Back to Journals » Journal of Inflammation Research » Volume 19
Association Between Systemic Immune-Inflammation Index and in-Hospital and Long-Term All-Cause Mortality in Patients with Type 2 Diabetes Mellitus Complicated by Spontaneous Intracerebral Hemorrhage
Authors Shen Y, Gao A, Shen Y, Gao S, Rong Y, Fan Z, Li Q, Lin T, Yang S, Liang H ![]()
Received 25 June 2025
Accepted for publication 21 December 2025
Published 10 January 2026 Volume 2026:19 549520
DOI https://doi.org/10.2147/JIR.S549520
Checked for plagiarism Yes
Review by Single anonymous peer review
Peer reviewer comments 2
Editor who approved publication: Dr Quan Zhang
Yongze Shen,1,* Aili Gao,2,* Yingjie Shen,1 Shang Gao,1 Yiwei Rong,1 Zhaoxin Fan,1 Qi Li,1 Tie Lin,1 Shanshan Yang,3 Hongsheng Liang1
1Department of Neurosurgery, The First Affiliated Hospital of Harbin Medical University, Harbin, 150001, People’s Republic of China; 2School of Life Science, Northeast Agricultural University, Harbin, 150006, People’s Republic of China; 3Department of Neurology, The First Affiliated Hospital of Harbin Medical University, Harbin, 150001, People’s Republic of China
*These authors contributed equally to this work
Correspondence: Shanshan Yang; Hongsheng Liang, Email [email protected]; [email protected]
Objective: Patients with type 2 diabetes mellitus (T2DM) and spontaneous intracerebral hemorrhage (sICH) face high mortality. Systemic inflammation may play a key role, but the prognostic value of the systemic immune-inflammation index (SII) in this population remains unclear. This study aimed to investigate the association between SII and all-cause mortality in T2DM with sICH.
Methods: A retrospective cohort study was conducted on 891 patients with T2DM and sICH hospitalized at the First Affiliated Hospital of Harbin Medical University from January 2021 to December 2024. SII was calculated using the formula: platelet count × neutrophil count/lymphocyte count. Patients were categorized into high and low SII groups based on the median value (817.5). Kaplan-Meier survival analysis, multivariate logistic and Cox regression models were used to assess the association of SII with in-hospital and long-term mortality. Subgroup and sensitivity analyses were performed to test the robustness of findings. Receiver operating characteristic (ROC) curves further evaluated predictive performance.
Results: In fully adjusted models, high SII was independently associated with a significantly increased risk of in-hospital mortality (OR = 3.122, 95% CI: 1.759– 5.544, P < 0.001) and long-term all-cause mortality (median follow-up 20.6 months, HR = 2.755, 95% CI: 1.938– 3.919, P < 0.001). Each 1-standard deviation increase in SII was linked to a 75.9% higher in-hospital death risk (OR = 1.759), and a 17.0% increase in long-term mortality risk (HR = 1.170). ROC analysis demonstrated moderate discriminative ability for SII (AUC = 0.722 for in-hospital mortality, AUC = 0.748 for long-term mortality). Kaplan-Meier analysis revealed significantly poorer survival in the high SII group over a 50-month follow-up (log-rank P = 0.015). These associations remained stable across subgroups and after adjusting for confounding comorbidities and clinical parameters.
Conclusion: Elevated SII is an independent predictor of both in-hospital and long-term all-cause mortality in patients with T2DM and sICH. This may be because high SII reflects an imbalance of inflammation and immunity, leading to increased mortality risk.
Keywords: systemic immune-inflammation index, type 2 diabetes mellitus, spontaneous intracerebral hemorrhage, mortality, prognostic biomarker
Introduction
Spontaneous intracerebral hemorrhage (sICH) refers to a non-traumatic rupture of blood vessels within the brain parenchyma, leading to the accumulation of blood in the brain tissue. It is an acute cerebrovascular disease typically presenting with sudden severe headache, frequent vomiting, and varying degrees of consciousness disturbance, often accompanied by neurological deficits such as hemiplegia and aphasia.1 sICH is characterized by rapid onset, severe clinical presentation, fast progression, high disability rate, and high mortality rate. It is one of the leading causes of stroke-related death and disability worldwide.2 Treatment primarily focuses on preventing secondary brain injury [eg, hematoma expansion, cerebral edema, intraventricular hemorrhage (IVH)], promoting neurological recovery, and minimizing complications. Although sICH accounts for only 10%–15% of all strokes, its 30-day mortality rate reaches 30%–50%, significantly higher than that of ischemic stroke (IS).3 Among survivors, about 80% experience varying degrees of functional impairment, severely affecting their quality of life.4 In China, the annual incidence of sICH is 50–80 per 100,000 people, much higher than in Western countries (10–15 per 100,000),5 with higher incidence rates observed in northern regions and during winter, possibly due to cold-induced vasoconstriction and poor hypertension control.6 The main risk factors for sICH include hypertension, cerebral atherosclerosis, cerebrovascular structural abnormalities (eg, arteriovenous malformations, intracranial aneurysms), coagulation disorders (eg, thrombocytopenia, coagulation factor deficiency, or long-term use of anticoagulants/antiplatelet agents), unhealthy lifestyle habits (eg, smoking, alcohol consumption), metabolic diseases (eg, diabetes, hyperlipidemia), age, sex, and genetic factors.7
Among these, type 2 diabetes mellitus (T2DM), a common chronic metabolic disease, is closely associated with the occurrence, progression, and prognosis of sICH. First, T2DM increases the risk of sICH. Chronic hyperglycemia leads to metabolic disorders, vascular endothelial damage, activation of oxidative stress and inflammatory pathways, resulting in hyaline degeneration and atherosclerosis of small vessels. These changes weaken vessel walls, making them more prone to rupture during blood pressure fluctuations.8,9 Furthermore, in a hyperglycemic state, platelet activity increases, red blood cell deformability decreases, and fibrinolysis is inhibited, resulting in a hypercoagulable state and further increasing the risk of cerebral vessel rupture.10 Second, T2DM exacerbates secondary injury after sICH. Hyperglycemia intensifies oxidative stress and promotes the release of inflammatory mediators, leading to additional neuronal damage. High osmolarity causes cerebral edema, and elevated blood viscosity reduces cerebral perfusion, worsening ischemia and hypoxia, thereby accelerating disease progression.11 Third, T2DM patients have lower immunity and are more susceptible to complications such as pulmonary and urinary tract infections, which impair recovery and increase mortality. Surgical patients may also experience delayed wound healing, while peripheral neuropathy due to chronic hyperglycemia affects the rehabilitation process, leading to poor neurological recovery. Given that recent global data estimate over 529 million people are currently living with diabetes—96% of whom have T2DM—and project that this number will exceed 1.3 billion by 2050, mainly driven by rising obesity, the urgency to explore early prognostic markers in high-risk populations such as patients with T2DM and sICH is increasingly evident.12 Thus, identifying risk factors for poor outcomes in patients with T2DM and sICH is crucial for reducing premature death and improving survival and quality of life.
In recent years, the central role of inflammation in the pathophysiology of intracerebral hemorrhage has attracted increasing attention, particularly in the context of metabolic diseases such as T2DM. After brain hemorrhage, immune-inflammatory responses are rapidly activated in the perihematomal region, releasing a large number of inflammatory mediators that trigger neuronal apoptosis and blood-brain barrier (BBB) disruption. T2DM, being a chronic low-grade inflammatory condition, can further amplify these effects. Therefore, the assessment of inflammatory markers is essential for evaluating disease progression and prognosis. Traditional inflammatory blood markers—such as white blood cell count (WBC), neutrophil count, lymphocyte count, monocyte count, C-reactive protein (CRP), and cytokines like interleukin-6 (IL-6), tumor necrosis factor-alpha (TNF-α), and interleukin-1 beta (IL-1β)—have been widely used in clinical inflammation monitoring and stroke prognosis analysis.13,14 However, these indicators often suffer from time sensitivity, high variability, and limited assessment scope, making them inadequate for reflecting the overall systemic immune-inflammatory status.
To overcome these limitations, several composite inflammatory scores have been proposed, including the neutrophil-to-lymphocyte ratio (NLR), platelet-to-lymphocyte ratio (PLR), and lymphocyte-to-monocyte ratio (LMR). Among them, the systemic immune-inflammation index (SII)—calculated as platelet count × neutrophil count/lymphocyte count—has gained attention for its ability to integrate three types of immune cells simultaneously, reflecting both pro-inflammatory and immune-suppressive processes in a single metric.15 Compared to NLR and PLR, SII incorporates platelet levels, which play an important role in thromboinflammation and secondary brain injury following hemorrhage, thus offering better biological plausibility and broader clinical relevance. In cardiovascular diseases (CVD), SII has not only been shown to be significantly associated with the risk of major adverse cardiovascular and cerebrovascular events (MACCE) in patients with coronary artery disease (CAD), but also demonstrated superior predictive performance compared to CRP and other traditional inflammatory markers, independently predicting the occurrence of MACCE in CAD patients.16,17 In neurological conditions, SII has been validated as a predictor for delayed cerebral vasospasm after aneurysmal subarachnoid hemorrhage (aSAH).18 Besides, Yang et al, in a study including 379 patients with acute ischemic stroke due to large vessel occlusion (AIS-LVO) who underwent endovascular treatment (EVT), demonstrated that a higher admission SII was independently associated with an increased risk of sICH, with the risk rising in a dose-dependent manner—specifically, every 10-unit increase in SII was linked to greater odds of sICH, and patients in the highest SII tertile had a significantly elevated risk compared to those in the lowest tertile.19 Furthermore, Cao et al retrospectively analyzed 482 patients with AIS-LVO who underwent successful EVT, and found that SII on the first postoperative day was an independent predictor of both poor 90-day functional outcome and sICH.20 These findings suggest that SII may outperform other composite indices by capturing broader aspects of the systemic inflammatory response. However, current studies have not systematically evaluated the role of SII in predicting in-hospital and long-term all-cause mortality among patients with sICH complicated by T2DM. Moreover, its independent predictive significance in this comorbid, high-risk population remains unclear.
Therefore, this study aims to investigate the prognostic value of SII in patients with T2DM complicated by sICH, specifically focusing on its association with in-hospital and long-term all-cause mortality. Clarifying this relationship may help establish SII as a reliable biomarker for early risk stratification and personalized intervention strategies in clinical practice.
Methods
Study Population
This study adopted a retrospective cohort design. The study population consisted of patients with T2DM complicated by sICH who were hospitalized at the First Affiliated Hospital of Harbin Medical University between January 1, 2021, and December 31, 2024. After an initial screening of 915 cases, a total of 891 patients were ultimately included in the final analysis based on the inclusion and exclusion criteria. This study protocol complies with the Declaration of Helsinki and was reviewed and approved by the First Affiliated Hospital of Harbin Medical University. Written informed consent was obtained from all patients.
Inclusion and Exclusion Criteria
Inclusion criteria were as follows: (1) Definite diagnosis of sICH, meeting the diagnostic criteria of the Chinese Stroke Association guidelines;21 (2) Diagnosis of T2DM in accordance with the 2020 criteria of the American Diabetes Association (ADA), including fasting blood glucose (FBG) ≥ 7.0 mmol/L, 2-hour postprandial blood glucose ≥ 11.1 mmol/L, or hemoglobin A1c (HbA1c) ≥ 6.5%;22 (3) All laboratory parameters were collected within 24 hours of hospital admission; (4) Age ≥ 18 years; (5) Complete availability of clinical data, imaging studies, and laboratory results.
Exclusion criteria were as follows: (1) Hemorrhage secondary to trauma, arteriovenous malformation, tumor, aneurysm, moyamoya disease, or other non-spontaneous causes; (2) History of anticoagulant (eg, warfarin), antiplatelet (eg, aspirin), or immunosuppressant use prior to admission, or known coagulation disorders; (3) Presence of severe systemic diseases [eg, malignancy, heart failure (HF), chronic infection, or immune system disorders] that may affect prognostic evaluation; (4) Incomplete or missing follow-up data.
Data Collection
All baseline information was collected and organized from the hospital’s electronic medical record system. This included demographic data (such as age and sex), lifestyle factors, medical history, medication use, and comorbidities. A family history of cerebrovascular disease was defined as having a first-degree relative with either intracerebral hemorrhage or IS. Smoking history was defined as current or former smoking with a cumulative duration of more than six months, while alcohol consumption was defined as drinking alcohol at least once per week on average.
Hypertension was diagnosed according to the 2024 Revised Chinese Guidelines for the Prevention and Treatment of Hypertension, which define hypertension as systolic blood pressure (SBP) ≥ 140 mmHg and/or diastolic blood pressure (DBP) ≥ 90 mmHg on at least three non-consecutive measurements, or a previously confirmed diagnosis.23 Hyperlipidemia was defined based on the 2016 Revised Chinese Guidelines for the Prevention and Treatment of Dyslipidemia in Adults, with diagnostic thresholds including total cholesterol (TC) ≥ 6.2 mmol/L, triglycerides ≥ 2.3 mmol/L, or low-density lipoprotein cholesterol (LDL-C) ≥ 4.1 mmol/L.24 T2DM was diagnosed according to the 2020 criteria of the ADA, defined as FBG ≥ 7.0 mmol/L, 2-hour plasma glucose during an oral glucose tolerance test ≥ 11.1 mmol/L, or HbA1c ≥ 6.5%.22 Coronary heart disease (CHD) was defined as myocardial ischemia or infarction confirmed by imaging or electrocardiography.25 IS referred to prior cerebral infarction or transient ischemic attack confirmed by imaging. Atrial fibrillation (AF) was diagnosed by electrocardiogram or Holter monitoring and classified as either persistent or paroxysmal. HF was diagnosed based on clinical presentation and echocardiographic findings, including reduced ejection fraction or diastolic dysfunction.26 Chronic kidney disease (CKD) was defined as an estimated glomerular filtration rate (eGFR) < 60 mL/min/1.73m2 lasting for more than three months.27 A history of previous sICH was also documented to provide a comprehensive assessment of cerebrovascular risk.
Medication use included antihypertensive, lipid-lowering, and hypoglycemic drugs. Antihypertensive medications included calcium channel blockers (CCB), angiotensin-converting enzyme inhibitors (ACEI), or angiotensin receptor blockers (ARB), diuretics, and beta-blockers. Lipid-lowering drugs primarily included statins and fibrates. Hypoglycemic therapy included oral antidiabetic drugs (such as metformin and sulfonylureas) and insulin injections.
Clinical data included body mass index (BMI), calculated as weight (kg) divided by the square of height (m2), and blood pressure measurements (SBP and DBP) recorded in mmHg at the time of admission. Neurological function was evaluated using the Glasgow Coma Scale (GCS) for consciousness and the Modified Rankin Scale (mRS) for functional disability.28 The presence of hemiplegia and vomiting at admission was determined from physical examination and nursing records. Levels of consciousness were categorized into five grades: alert, drowsy, confused, stuporous, and comatose. Time from onset to admission (TFA) was recorded in hours.
Hematoma volume was calculated using the ABC/2 formula, where A is the longest diameter of the hematoma on the largest axial slice, B is the diameter perpendicular to A, and C is the number of slices with hemorrhage multiplied by the slice thickness in centimeters, then multiplied by 0.5.29 Additional imaging data included the presence of midline shift, hemorrhage location (basal ganglia, thalamus, lobar, cerebellum, brainstem), intraventricular extension, and the presence of obstructive hydrocephalus. Treatment modality was categorized as either conservative or surgical, and intraoperative or postoperative complications—including rebleeding, reoperation, pulmonary infection, and seizures—were also recorded.
Laboratory parameters were collected within 24 hours of admission and included WBC, neutrophil count, lymphocyte count, monocyte count, hemoglobin, platelet count, FBG, alanine aminotransferase (ALT), aspartate aminotransferase (AST), total bilirubin (TB), albumin, uric acid (UA), blood urea nitrogen (BUN), creatinine, electrolytes (potassium, sodium, chloride, calcium, bicarbonate), fibrinogen, and D-dimer.
Assessment and Measurement of SII
In this study, all patients had venous blood samples collected within 24 hours of hospital admission. The samples were analyzed by the Clinical Laboratory Center of the First Affiliated Hospital of Harbin Medical University to obtain the parameters required for calculating the SII. The SII was calculated using the following formula: SII = neutrophil count (×109/L) × platelet count (×109/L)/lymphocyte count (×109/L).15
To comprehensively assess the predictive value of SII for all-cause mortality, the index was incorporated into regression analyses in three forms: as a continuous variable, a log-transformed variable (log10 transformation), and a standardized variable (Z-score). Additionally, SII was analyzed as a categorical variable. Based on the median value of 817.5, patients were divided into two groups: a low SII group (SII < 817.5, n = 352) and a high SII group (SII ≥ 817.5, n = 352).
Follow-Up and Outcomes
Based on in-hospital mortality status, the overall study population was divided into two groups: the non-in-hospital death group (n = 704) and the in-hospital death group (n = 187). Patients in the non-in-hospital death group were followed up, and follow-up data were obtained through telephone interviews, outpatient visits, and collaboration with community healthcare institutions. The starting point of follow-up was defined as the date of hospital discharge. Follow-up was conducted at 6 months, 1 year, and then annually thereafter to ensure standardized long-term outcome assessment. The final follow-up date was March 31, 2025. All-cause mortality was defined as death from any cause during the follow-up period. Finally, the non-in-hospital mortality group was further divided based on the occurrence of all-cause mortality into the non-all-cause mortality group (n = 503) and the all-cause mortality group (n = 201).
Statistical Analysis
All statistical analyses were performed using SPSS version 27.0, with a two-sided P-value < 0.05 considered statistically significant. Continuous variables with a normal distribution were expressed as mean ± standard deviation, and comparisons between two groups were conducted using the independent samples t-test. Continuous variables not conforming to a normal distribution were presented as median and interquartile range, and comparisons were made using non-parametric tests. Categorical variables were expressed as frequencies and percentages, and comparisons between groups were performed using the chi-square test or Fisher’s exact test, as appropriate.
Kaplan-Meier survival curves were plotted to compare long-term all-cause mortality between the high and low SII groups, and the Log rank test was used to assess the statistical significance of differences between survival curves. Univariate logistic regression analysis and univariate Cox regression analysis were used to identify variables with P < 0.05, which were subsequently included in multivariate logistic regression and multivariate Cox regression models. Three regression models were constructed to evaluate the association between SII—as a categorical variable and as a continuous variable—and both in-hospital mortality and all-cause mortality. To ensure the stability of the regression models, multicollinearity diagnostics were performed for all variables included in the multivariate logistic and Cox regression models. Variance inflation factors (VIFs) were calculated, and no significant multicollinearity was detected among the covariates in either model. Further, stratified analyses were performed using fully adjusted multivariate logistic regression and Cox regression models across various subgroups, including: sex, age, smoking status, alcohol consumption, presence of IS, presence of CHD, BMI (< 28 kg/m2 or ≥ 28 kg/m2, based on the obesity threshold defined for Chinese adults), GCS (< 13 or ≥ 13, based on the median GCS score), mRS (≤ 4 or > 4, based on the median mRS score), presence of consciousness disturbance, hemorrhage in the basal ganglia, IVH, WBC ≤ 10 ×109/L, WBC > 10 ×109/L, conservative treatment, surgical treatment, and presence or absence of pulmonary infection. These subgroup analyses aimed to further validate the stratified association between SII and both in-hospital and all-cause mortality. Additionally, robustness analyses were conducted using fully adjusted multivariate logistic and Cox regression models after excluding patients with hyperlipidemia, a history of sICH, CKD, HF, AF, hydrocephalus, postoperative rebleeding, reoperation, and seizures. Receiver operating characteristic (ROC) curve analysis was used to assess and compare the predictive value of SII, GCS, hematoma volume, and degree of midline shift for in-hospital mortality and long-term all-cause mortality.
Results
Baseline Characteristics Stratified by SII
As shown in Table 1, the overall study population was divided into two groups based on the SII level: the low SII group (n = 445) and the high SII group (n = 446). Compared with the low SII group, the high SII group exhibited higher levels of SBP, DBP, mRS score, hematoma volume, degree of midline shift, WBC, neutrophil count, monocyte count, platelet count, FBG, AST, albumin, and serum calcium (P < 0.05). Additionally, the high SII group had higher proportions of patients presenting with hemiplegia, stupor, coma, vomiting, IVH, and obstructive hydrocephalus (P < 0.05). Regarding treatment, the high SII group had a higher rate of surgical intervention (P < 0.05). In terms of postoperative complications, the high SII group had higher incidences of rebleeding, reoperation, pulmonary infection, and seizures (P < 0.05). However, compared with the low SII group, the high SII group had a lower mean age, a lower frequency of alcohol consumption, and lower levels of GCS score, lymphocyte count, serum chloride, and bicarbonate (P < 0.05).
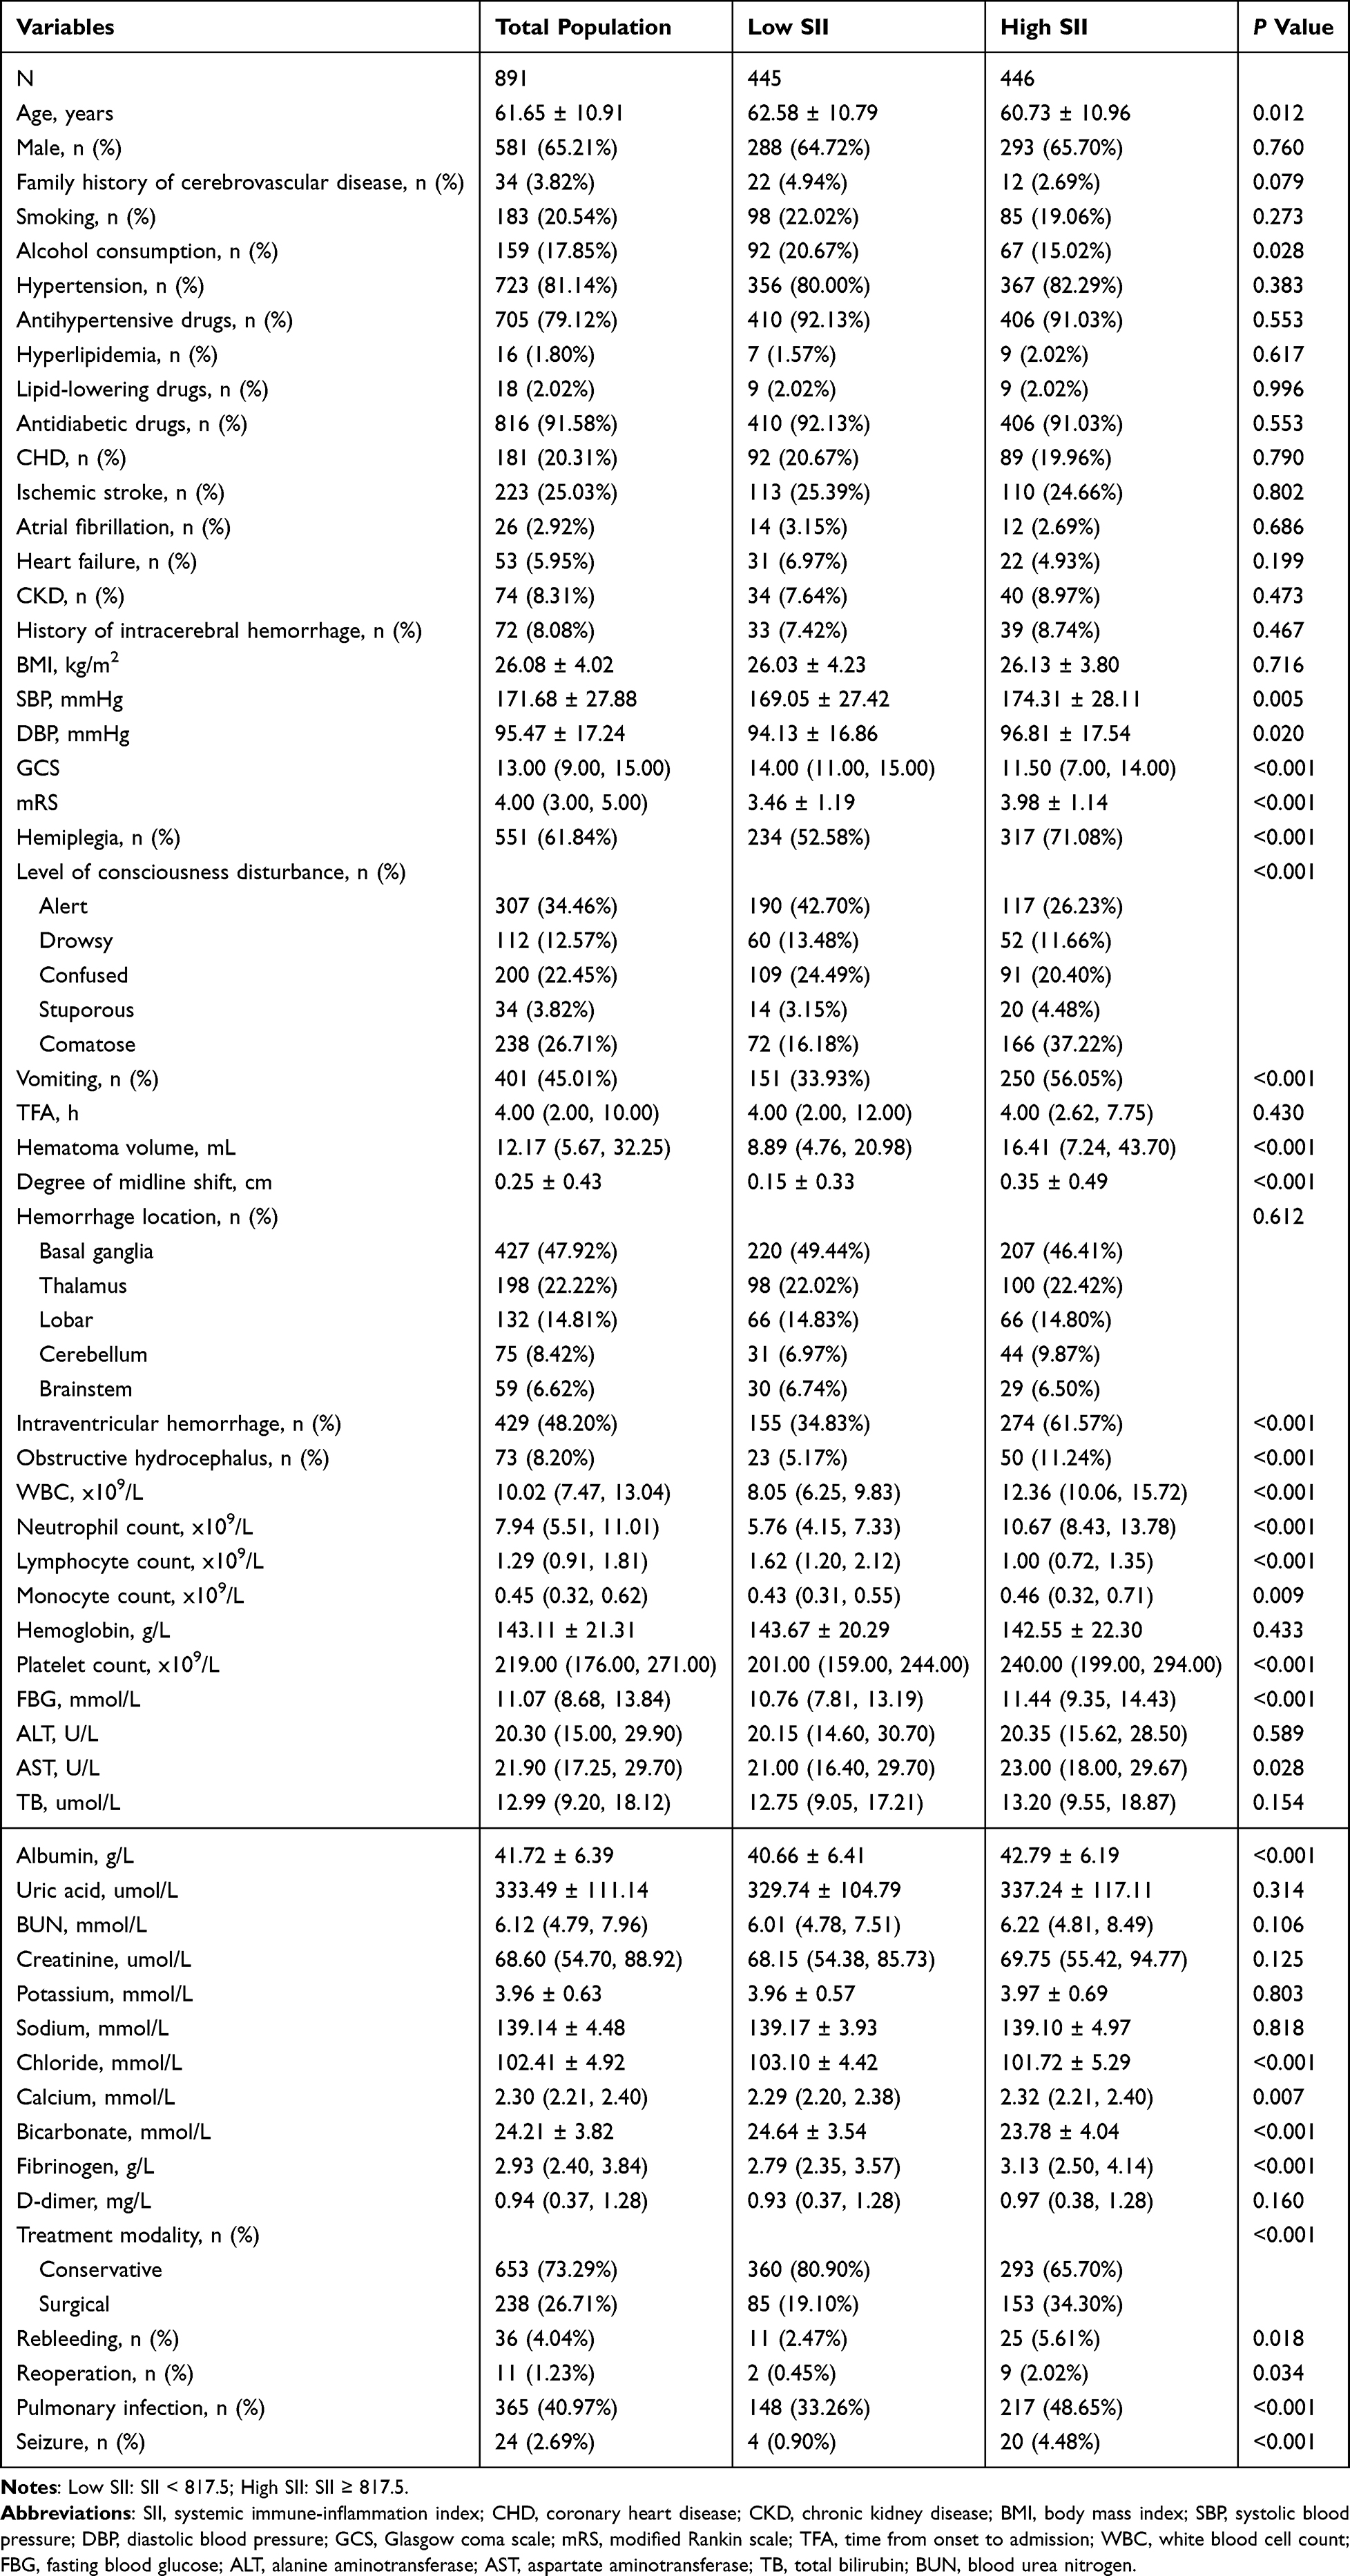 |
Table 1 Baseline Characteristics Stratified by SII |
Among these variables, the most striking differences were observed in hematoma volume, degree of midline shift, and GCS score (P < 0.001), which were well-established predictors of poor prognosis in sICH, suggesting that patients with higher SII tended to present with more severe neurological impairment and thereby supporting the biological plausibility of SII as a prognostic marker.
Multivariate Logistic Regression Analysis of SII and In-Hospital Mortality
As shown in Table 2, variables with P < 0.05 in the univariate logistic regression analysis were included in the multivariate logistic regression, and three regression models were constructed. Model 1 was adjusted for smoking, alcohol consumption, use of antihypertensive drugs, SBP, and DBP. Model 2 was further adjusted for GCS score, mRS score, presence of hemiplegia, level of consciousness disturbance, vomiting, TFA, hematoma volume, degree of midline shift, hemorrhage location, intraventricular extension, and obstructive hydrocephalus based on Model 1. Model 3 was additionally adjusted for WBC, FBG, AST, TB, BUN, serum chloride, bicarbonate, D-dimer, treatment modality, rebleeding, reoperation, and seizures based on Model 2.
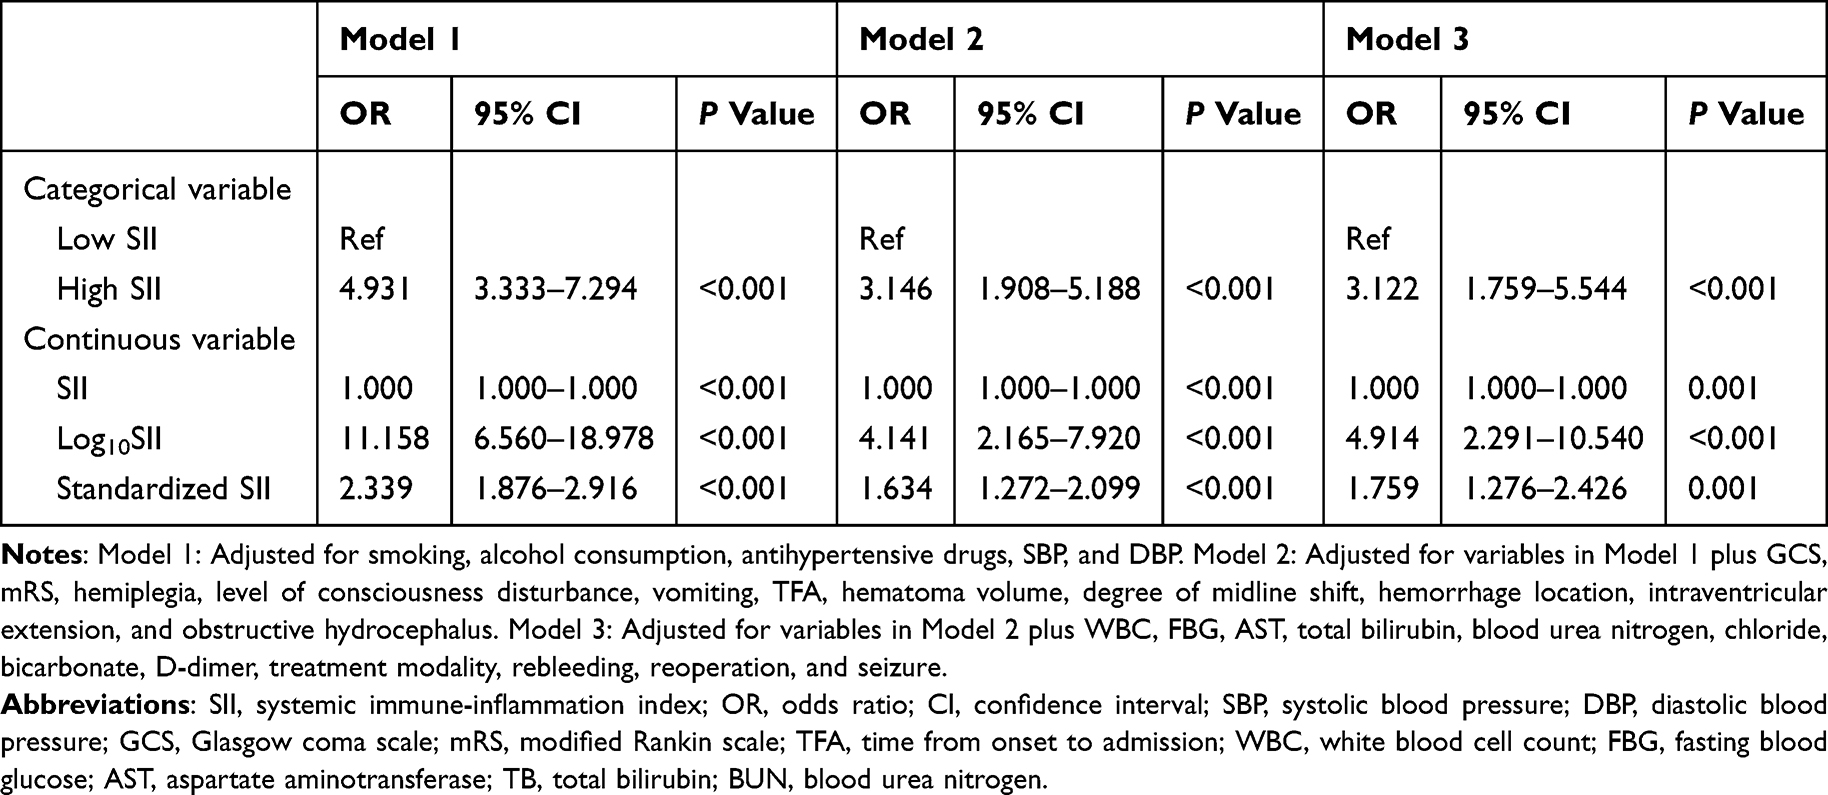 |
Table 2 Multivariate Logistic Regression Analysis of SII and In-Hospital Mortality |
In all three models—whether SII was treated as a categorical or continuous variable—SII remained significantly associated with in-hospital mortality (P < 0.05). Specifically, in the fully adjusted Model 3, the high SII group had a 3.122-fold higher risk of in-hospital mortality compared to the low SII group (OR = 3.122, 95% CI: 1.759–5.544). Additionally, for each 1-unit increase in SII, 1-standard deviation increase in SII, and 1-unit increase in log-transformed SII (Log10SII), the risk of in-hospital mortality significantly increased (OR = 1.000, 95% CI: 1.000–1.000; OR = 1.759, 95% CI: 1.276–2.426; OR = 4.914, 95% CI: 2.291–10.540, respectively).
Multivariate Stratified Association Between SII and In-Hospital Mortality
In the subgroup analysis of Table 3, when SII was analyzed as a categorical variable (high vs low), high SII was significantly associated with increased in-hospital mortality in multiple subgroups: males, older patients aged ≥ 60 years, patients without IS, those without CHD, BMI < 28 kg/m2, GCS < 13, mRS > 4, with consciousness disturbance, basal ganglia hemorrhage, non-basal ganglia hemorrhage, with and without IVH, WBC ≤ 10 ×109/L and > 10 ×109/L, conservative and surgical treatment, with and without pulmonary infection (all P < 0.05).
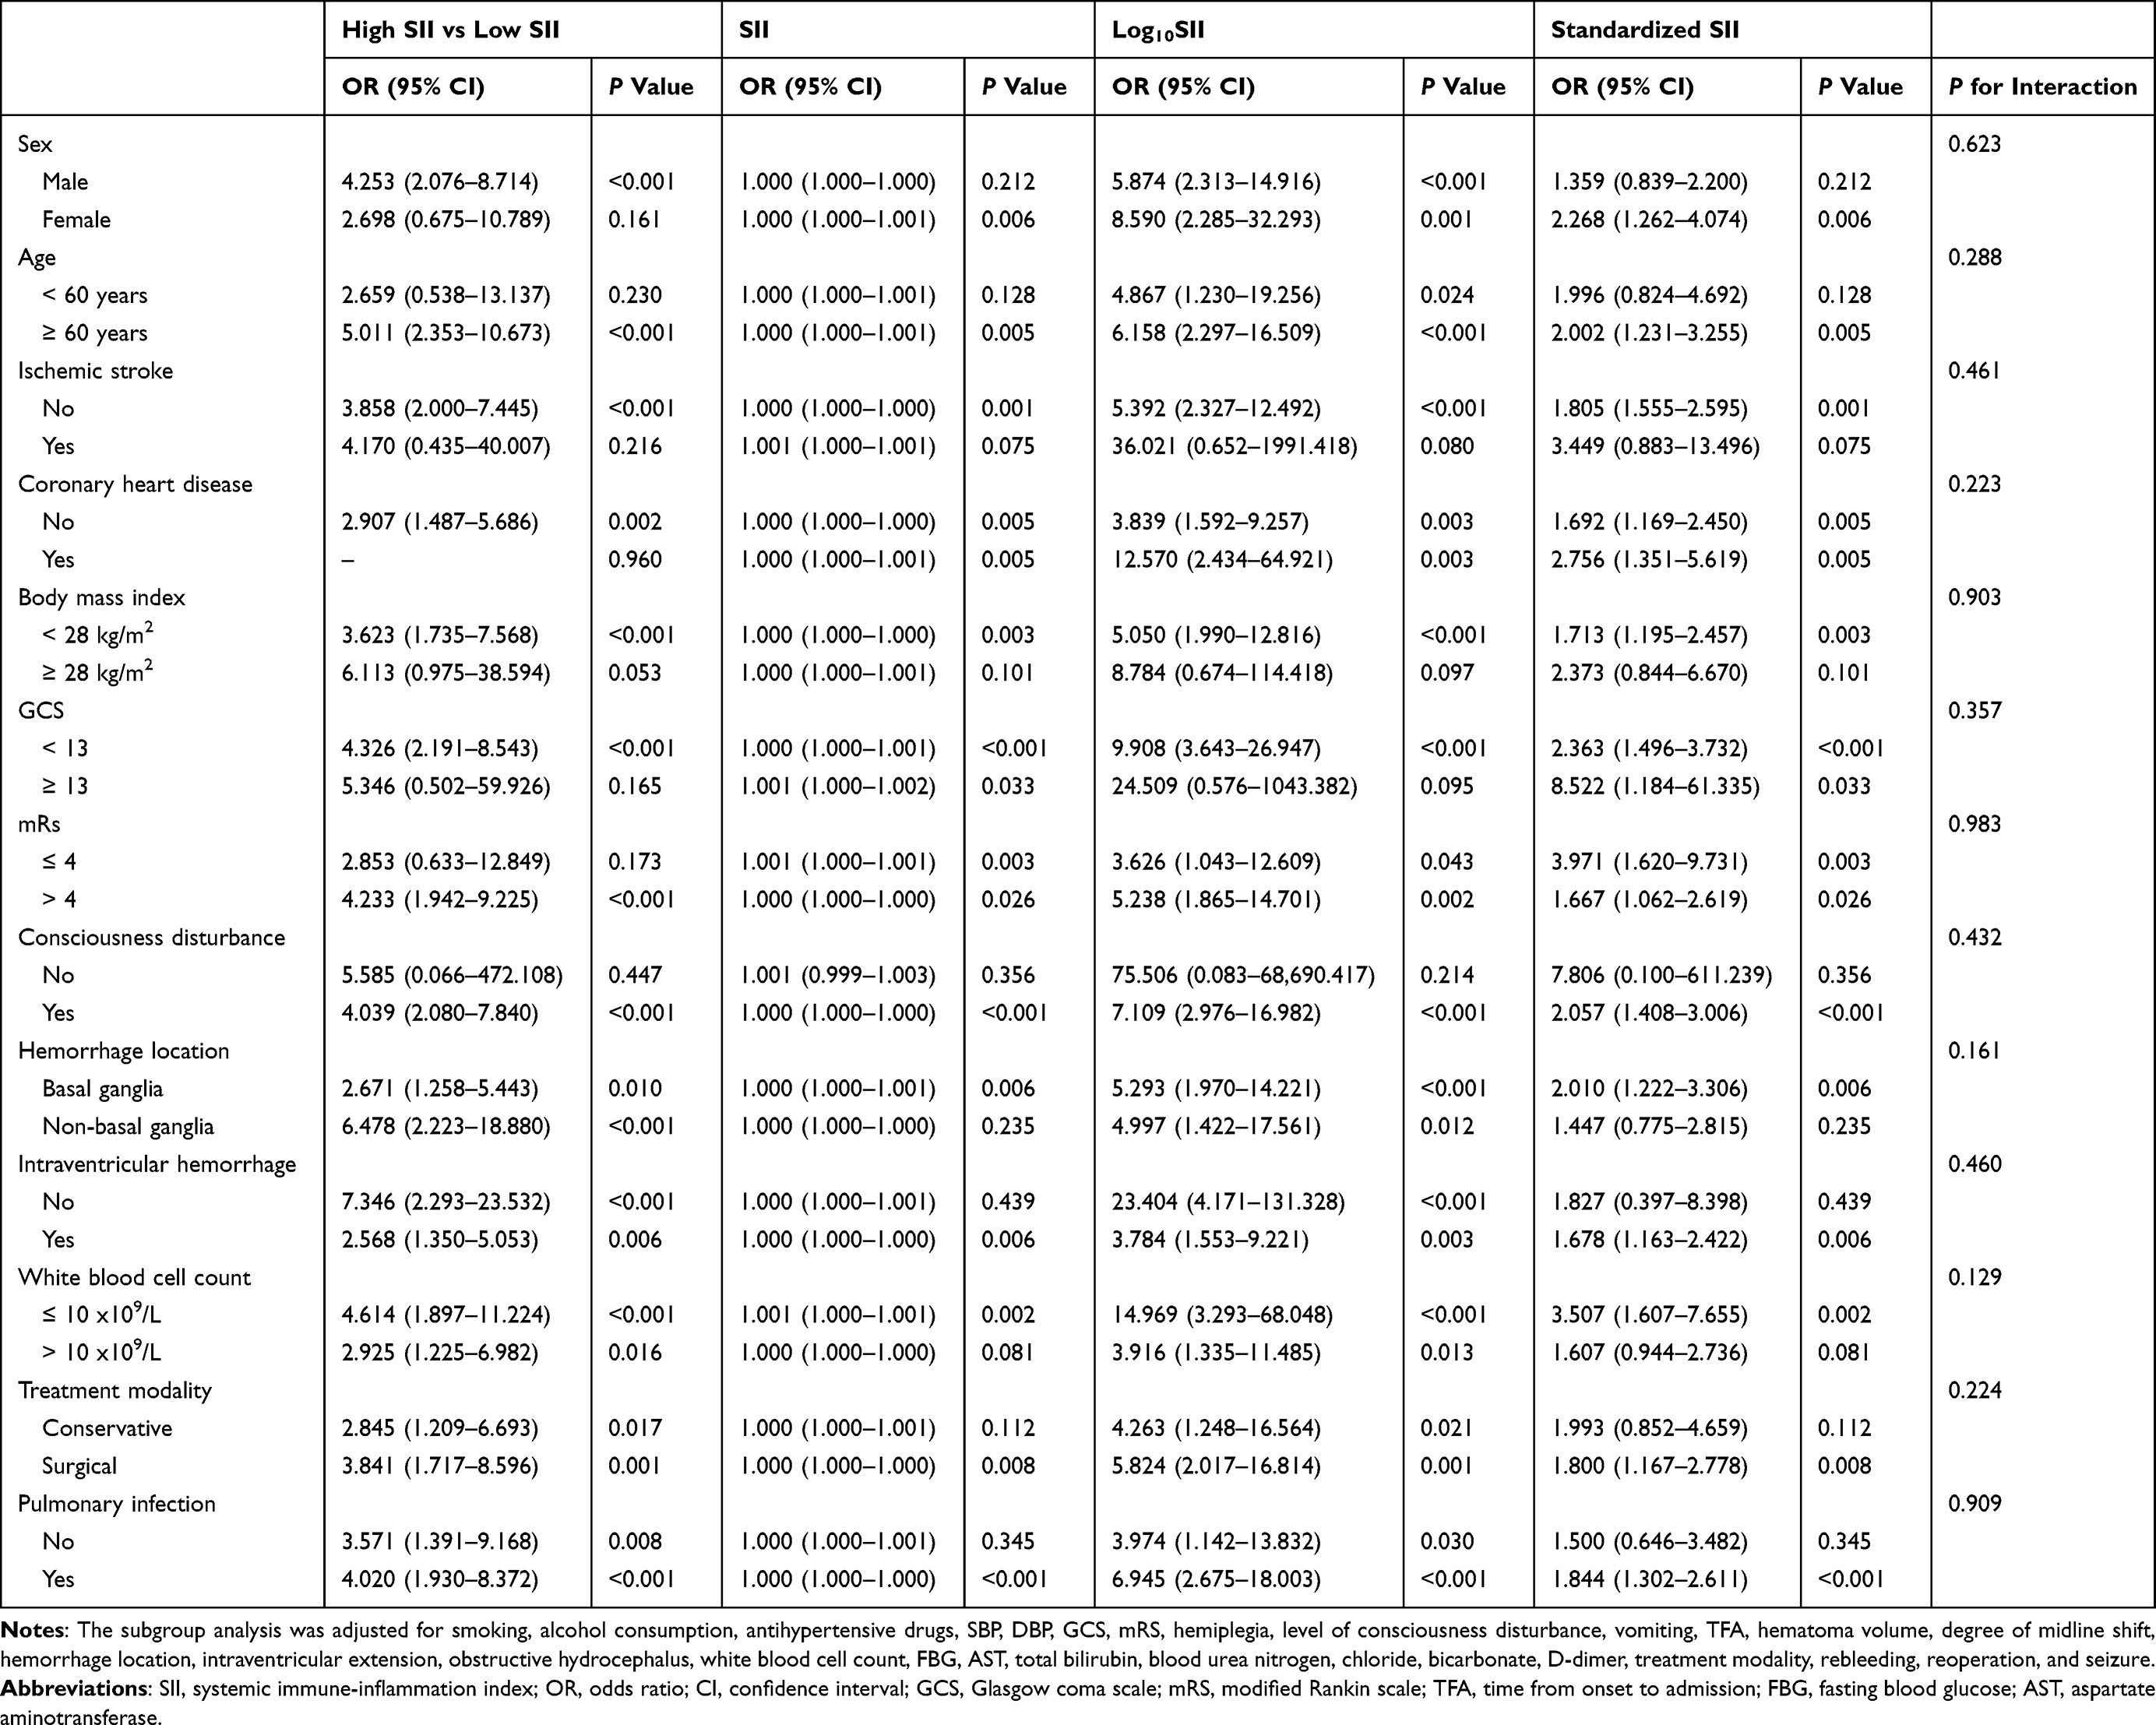 |
Table 3 Multivariate Stratified Association Between SII and In-Hospital Mortality |
When SII was analyzed as a continuous variable, including raw values, log-transformed values (Log10SII), and standardized SII, consistent positive associations with in-hospital mortality were observed in many subgroups. Log10SII and standardized SII showed significant associations in females, age ≥ 60, those without IS, both CHD subgroups, BMI < 28 kg/m2, both GCS and mRS subgroups, patients with consciousness disturbance, both hemorrhage locations, both IVH groups, WBC ≤ 10 ×109/L, surgical treatment, and patients with pulmonary infection (all P < 0.05). Additionally, all P for interaction values were > 0.05, indicating no statistically significant interactions across subgroups.
SII and In-Hospital Mortality: Multivariate Logistic Regression Analysis - Sensitivity Analysis
As shown in Table 4, sensitivity analyses were conducted by sequentially excluding patients with potential confounding conditions, including hyperlipidemia, history of IVH, CKD, HF, AF, hydrocephalus, as well as those with postoperative rebleeding, reoperation, or seizures. In all scenarios, the high SII group consistently showed a significantly increased risk of in-hospital mortality compared to the low SII group, with ORs ranging from 2.800 to 3.719 (all P < 0.05). Furthermore, in each subgroup, increases in SII (per unit and per standard deviation), as well as in log-transformed SII (Log10SII), were all significantly associated with elevated in-hospital mortality risk (all P < 0.05), confirming the robustness of the association between SII and in-hospital mortality.
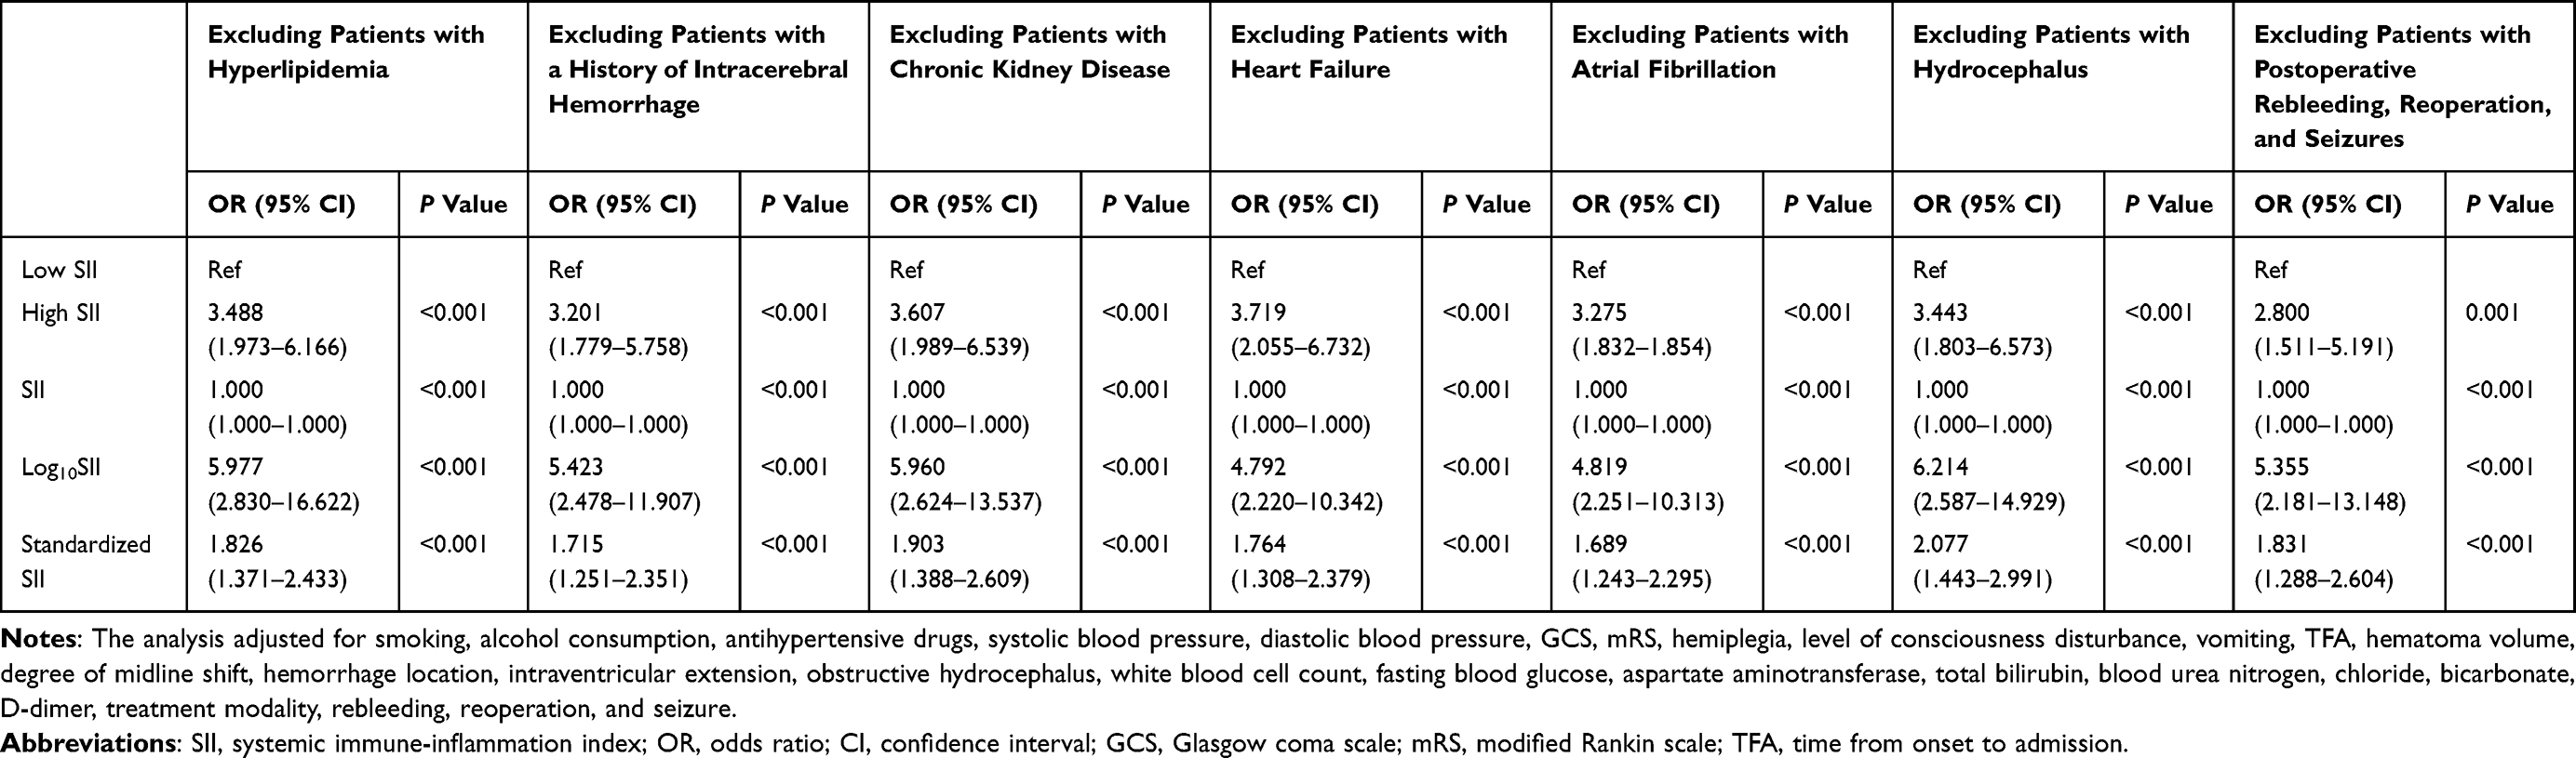 |
Table 4 Multivariate Logistic Regression Analysis of SII and In-Hospital Mortality: Sensitivity Analysis |
Kaplan-Meier Survival Analysis of Long-Term All-Cause Mortality by SII Levels
The Kaplan-Meier survival curve of Figure 1 illustrated the difference in long-term survival probability between patients with high and low SII levels. Over a follow-up period of approximately 50 months, the high SII group (red line) consistently showed a lower survival probability compared to the low SII group (blue line). The difference in survival between the two groups was statistically significant, as indicated by the Log rank test (P = 0.015).
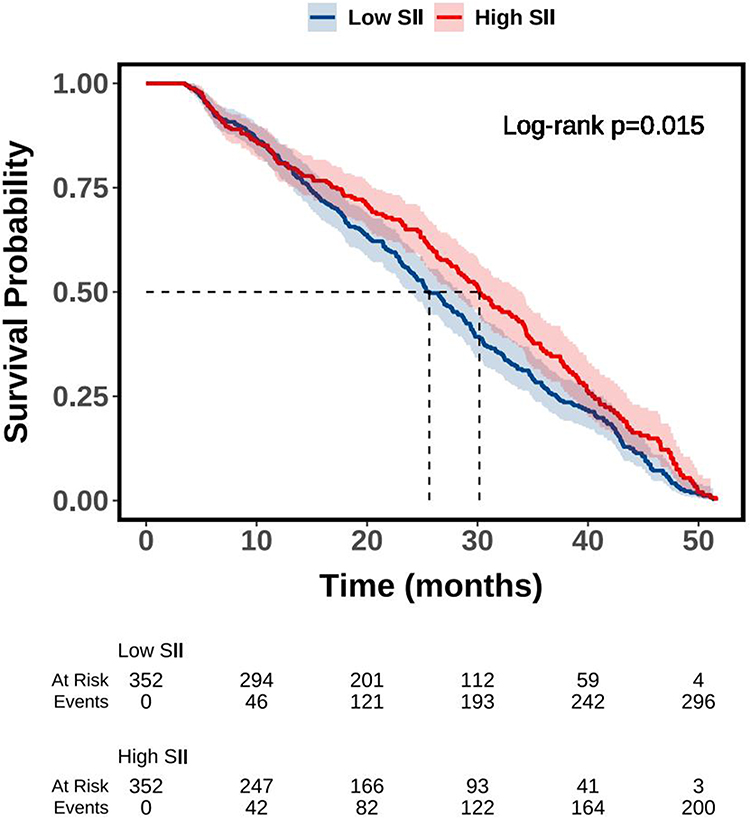 |
Figure 1 Kaplan-Meier survival analysis of long-term all-cause mortality by SII levels. Abbreviation: SII, systemic immune-inflammation index. |
Multivariate Cox Regression Analysis of SII and Long-Term All-Cause Mortality
As shown in Table 5, multivariate Cox regression analysis included variables with P < 0.05 from the univariate Cox regression analysis, and three regression models were constructed. Model 1 was adjusted for age, smoking, and SBP. Model 2 further adjusted for GCS, mRS, hemiplegia, level of consciousness disturbance, vomiting, hematoma volume, degree of midline shift, hemorrhage location, intraventricular extension, and obstructive hydrocephalus based on Model 1. Model 3 further adjusted for WBC, D-dimer, ALT, treatment modality, and pulmonary infection based on Model 2.
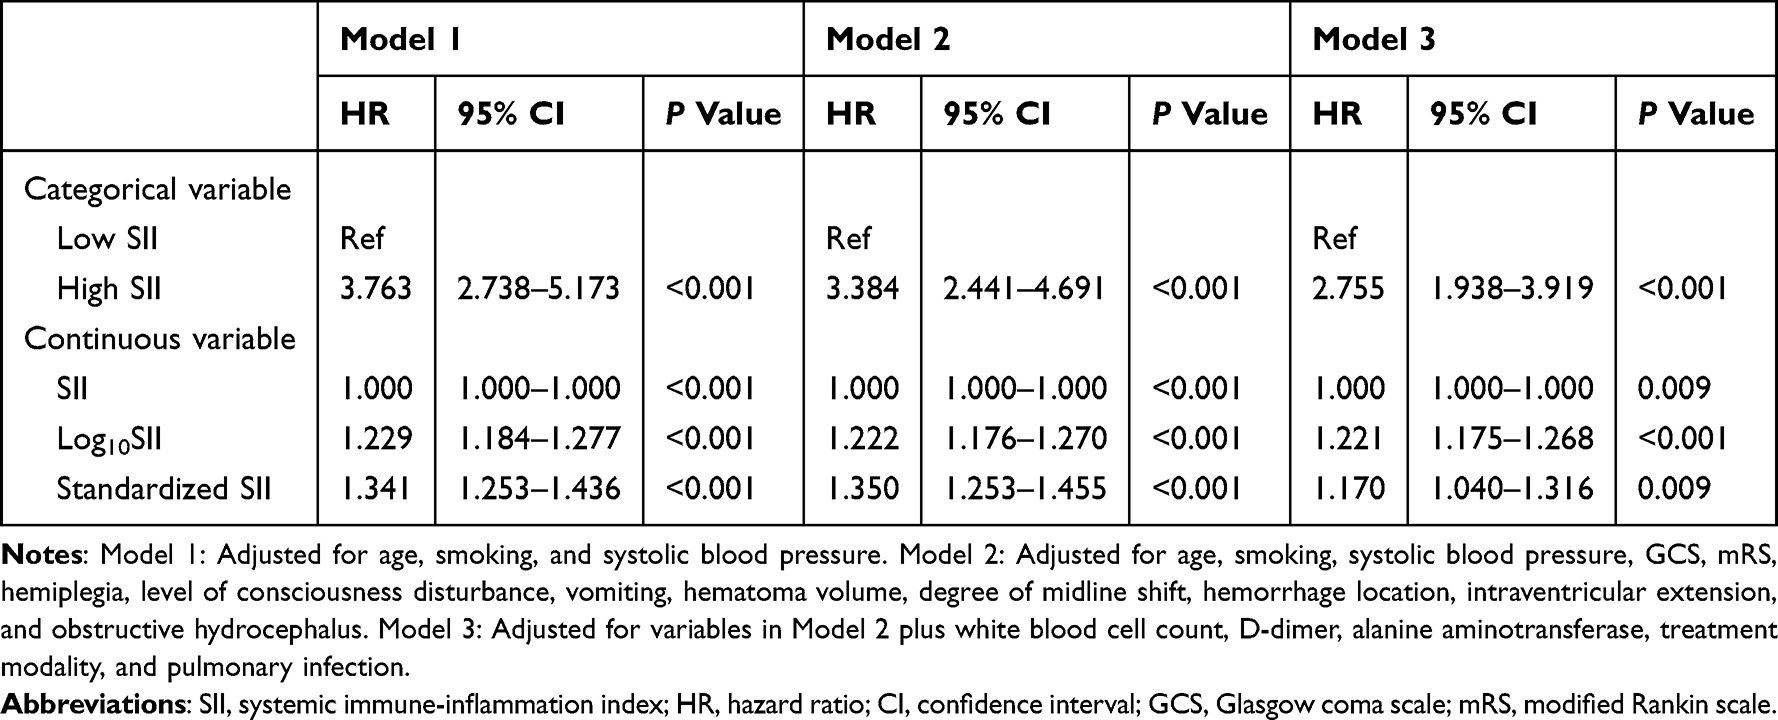 |
Table 5 Multivariate Cox Regression Analysis of SII and Long-Term All-Cause Mortality |
In Models 1, 2, and 3, whether SII was treated as a categorical or continuous variable, it was significantly associated with all-cause mortality (P < 0.05). Specifically, in the fully adjusted Model 3, the high SII group had a 2.755-fold higher risk of all-cause mortality compared to the low SII group (HR = 2.755, 95% CI: 1.938–3.919). Additionally, for each 1-unit increase in SII, 1-standard deviation increase in SII, and 1-unit increase in Log10SII, the risk of all-cause mortality significantly increased (HR = 1.000, 95% CI: 1.000–1.000; HR = 1.170, 95% CI: 1.040–1.316; HR = 1.221, 95% CI: 1.175–1.268).
Multivariate Stratified Association Between SII and Long-Term All-Cause Mortality
In the subgroup analysis of Table 6, when SII was analyzed as a categorical variable (high vs low), high SII was significantly associated with increased long-term all-cause mortality in males, females, patients aged 60 years or older, non-smokers, alcohol users, patients with or without IS, with or without CHD, those with BMI less than 28 kg/m2, patients with GCS scores 13 or above, mRS scores 4 or below, with or without consciousness disturbance, those with basal ganglia or non-basal ganglia hemorrhage, with or without IVH, with WBC either ≤ 10 or > 10 ×109/L, those receiving conservative or surgical treatment, and those with or without pulmonary infection (all P < 0.05).
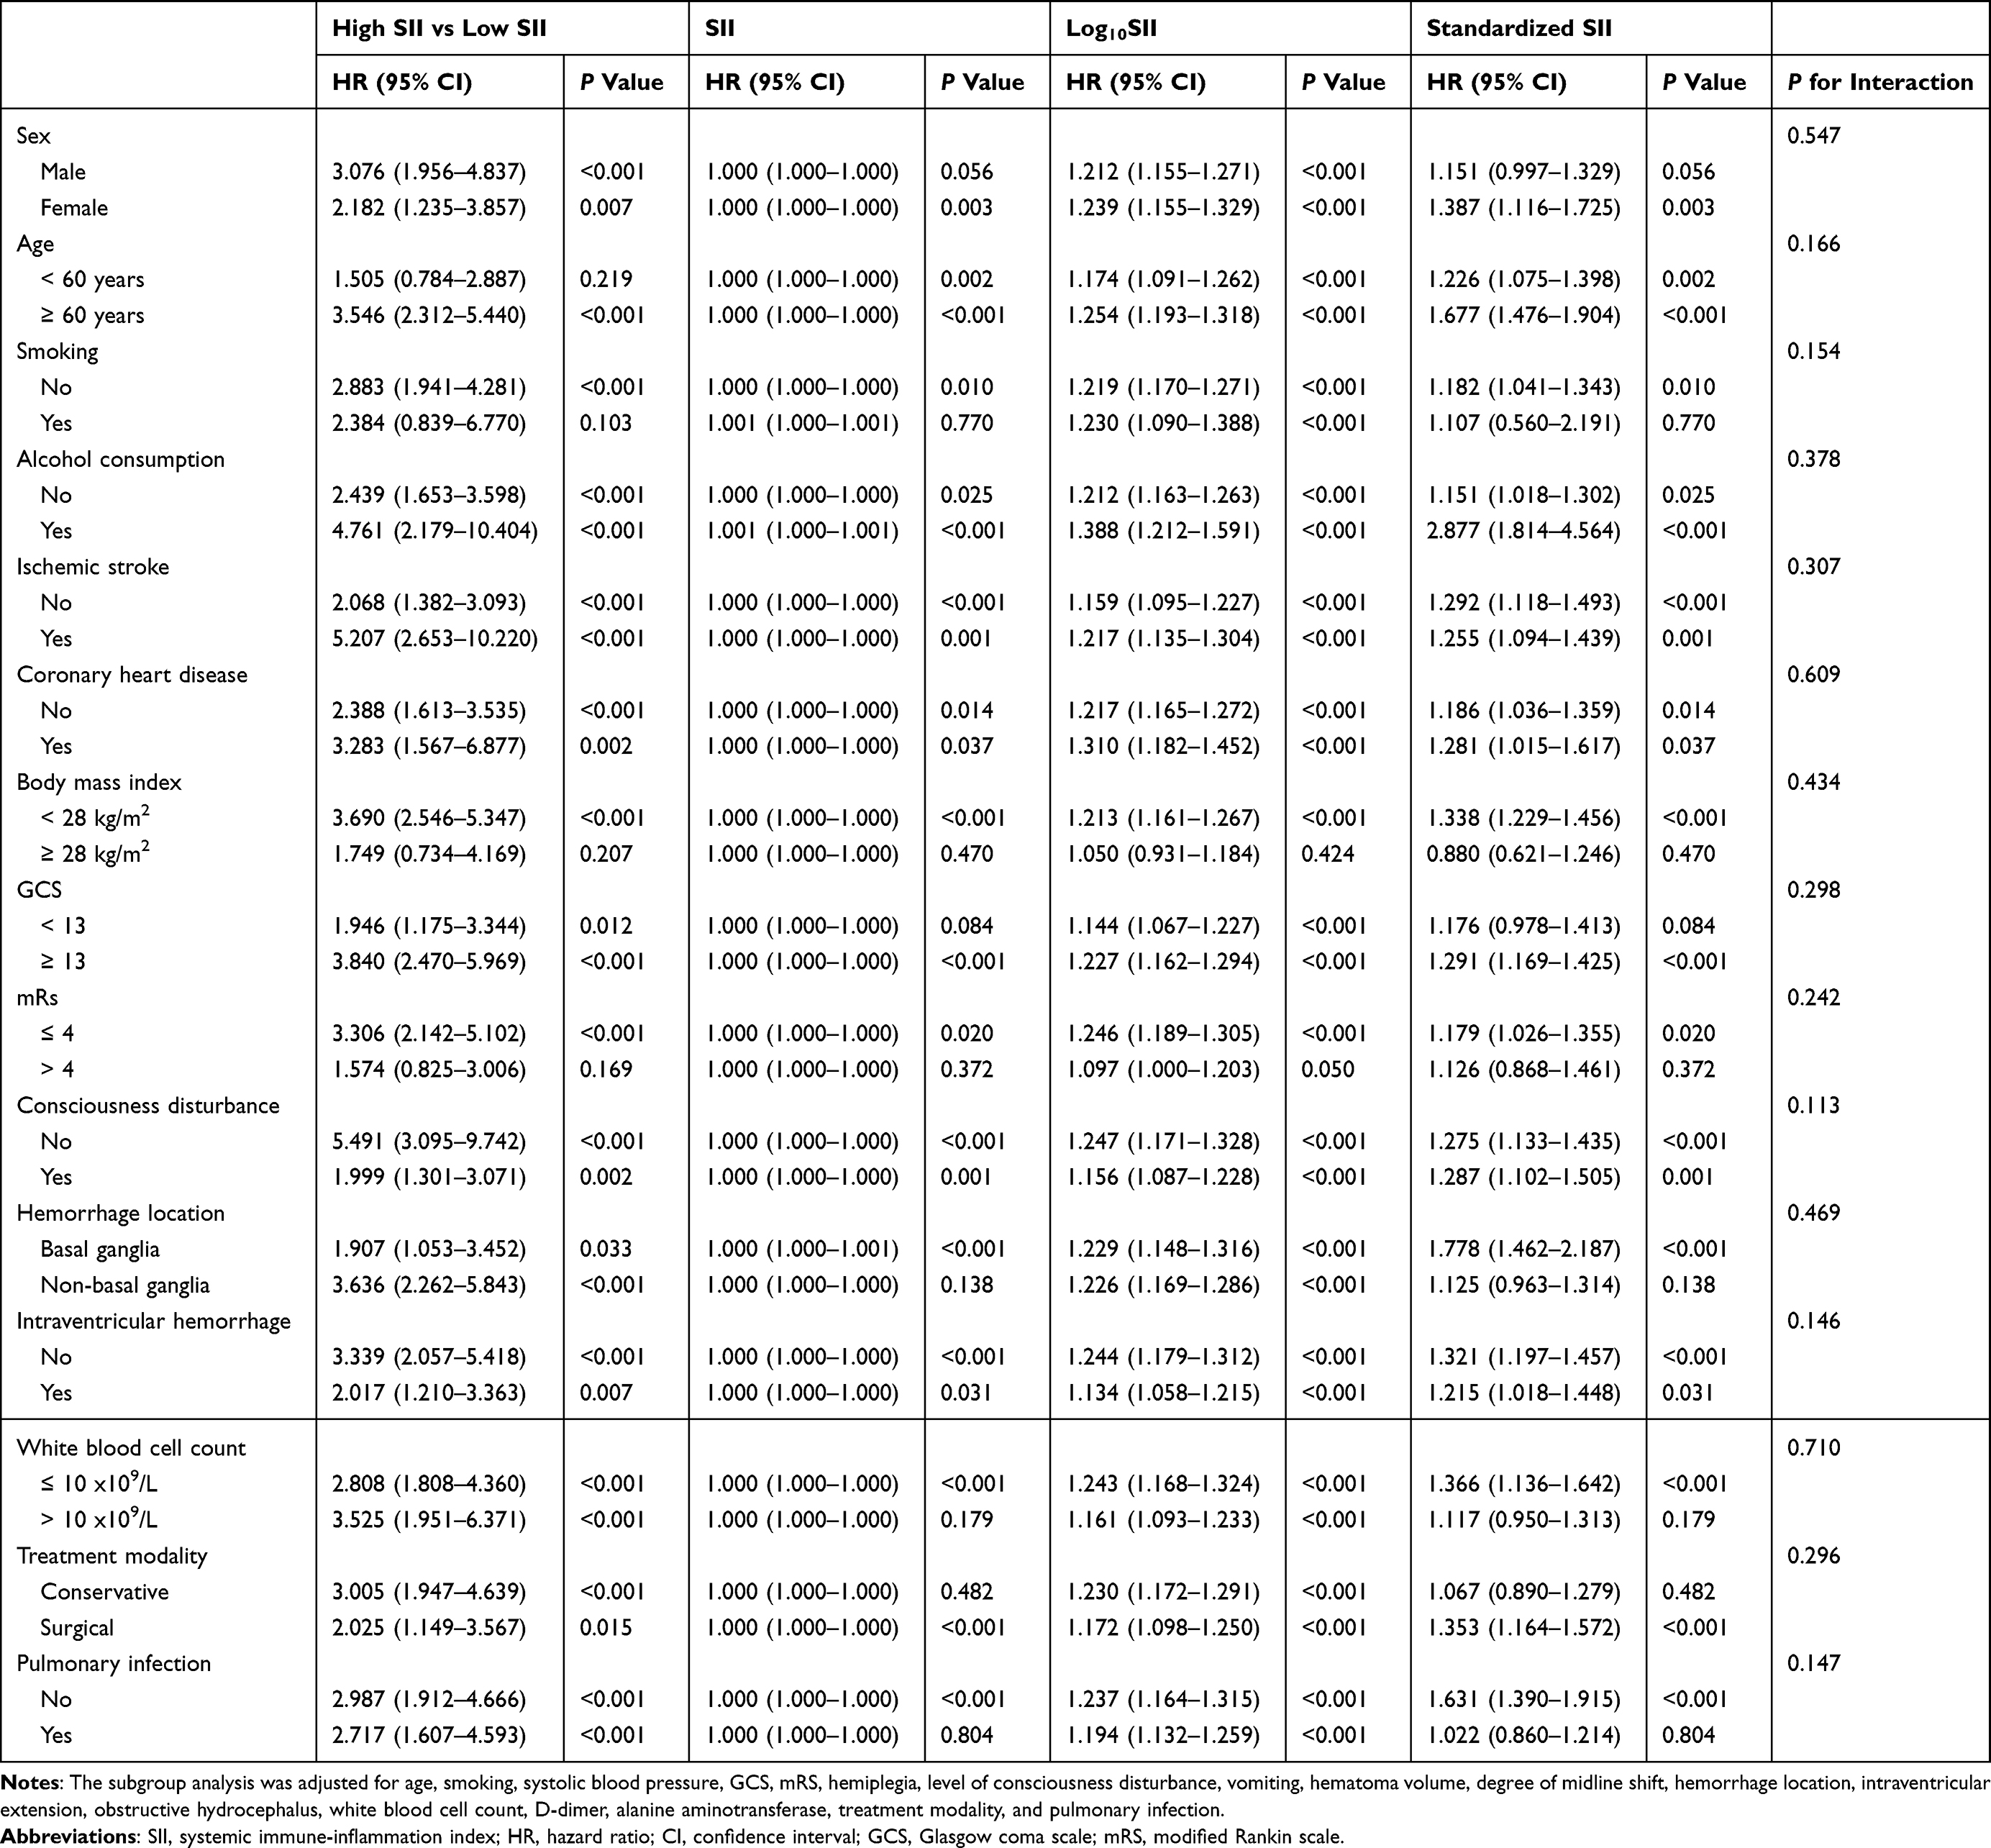 |
Table 6 Multivariate Stratified Association Between SII and Long-Term All-Cause Mortality |
When SII was treated as a continuous variable (including raw, log-transformed, and standardized SII), it remained significantly associated with long-term mortality in females, patients aged 60 years or older, alcohol users, patients with or without IS, with or without CHD, those with BMI less than 28 kg/m2, both GCS subgroups, mRS ≤ 4 subgroup, patients with or without consciousness disturbance, both hemorrhage location groups, both IVH subgroups, WBC ≤ 10 ×109/L, surgical treatment subgroup, and patients without pulmonary infection (all P < 0.05). Additionally, all P for interaction values were > 0.05, indicating no statistically significant interactions across subgroups.
Multivariate Cox Regression Analysis of SII and Long-Term All-Cause Mortality: Sensitivity Analysis
In the sensitivity analyses of Table 7, high SII was significantly associated with increased long-term all-cause mortality across all exclusion subgroups. Specifically, after excluding patients with hyperlipidemia, the HR was 2.698 (95% CI: 1.897–3.835); after excluding those with a history of IVH, HR = 2.630 (95% CI: 1.829–3.783); after excluding patients with CKD, HR = 2.607 (95% CI: 1.812–3.752); after excluding HF patients, HR = 2.520 (95% CI: 1.750–3.629); after excluding AF, HR = 2.918 (95% CI: 2.025–4.207); after excluding hydrocephalus, HR = 2.697 (95% CI: 1.858–3.915); and after excluding patients with postoperative rebleeding, reoperation, or seizures, HR = 2.406 (95% CI: 1.683–3.439).
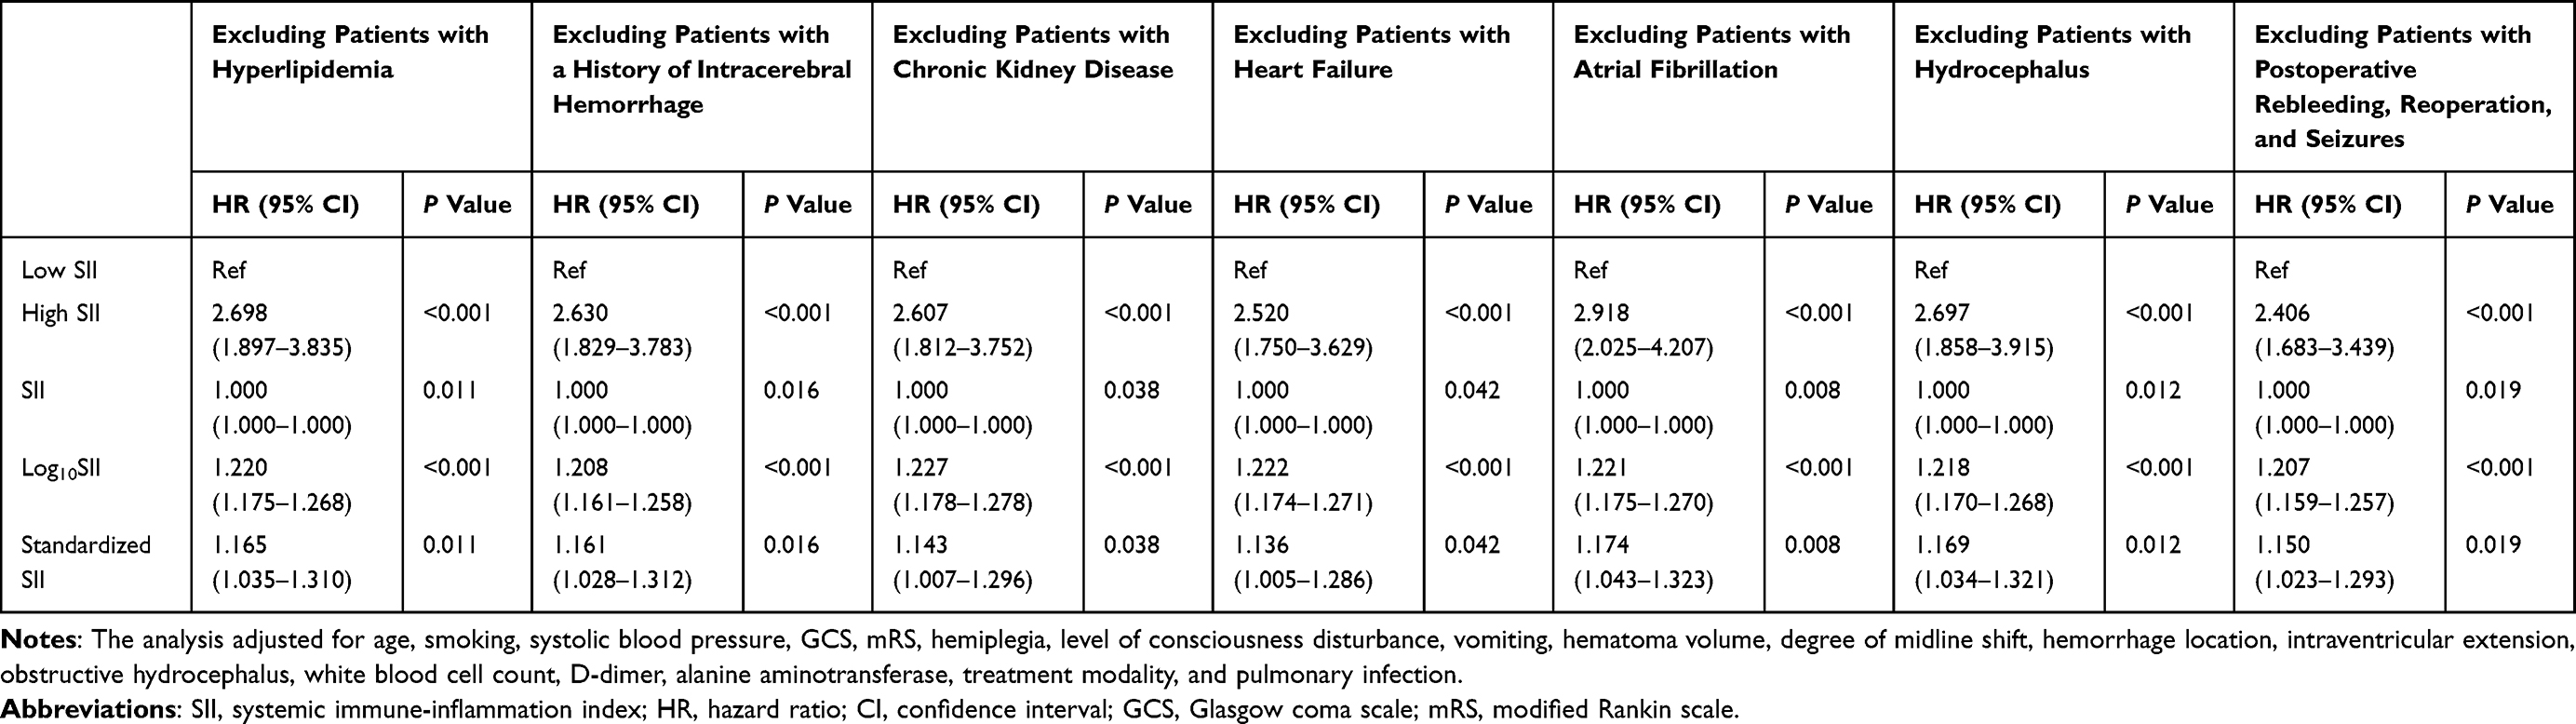 |
Table 7 Multivariate Cox Regression Analysis of SII and Long-Term All-Cause Mortality: Sensitivity Analysis |
For continuous forms of SII, all three indicators—raw SII, log10-transformed SII, and standardized SII—were significantly associated with long-term all-cause mortality across all sensitivity analyses. The log10SII yielded HRs ranging from 1.207 to 1.227, all with P < 0.001 and 95% CIs that did not cross 1, indicating stable and robust associations. Similarly, standardized SII showed HRs between 1.136 and 1.174, with all P values ≤ 0.042 and 95% CIs indicating statistical significance. Although raw SII values had HRs approximately equal to 1.000, the narrow CIs and P values (ranging from 0.008 to 0.042) suggest a consistent, albeit small, linear effect on risk.
Predictive Performance of SII for Mortality Outcomes
Figure 2 presented the ROC curves comparing the predictive performance of SII with established clinical indicators, including GCS, hematoma volume, and degree of midline shift, for both in-hospital and long-term all-cause mortality. For in-hospital mortality (Panel A), SII yielded an AUC of 0.722 (95% CI: 0.681–0.763, P < 0.001), indicating a moderate discriminative ability, with SII having about a 72% probability of correctly assigning higher risk to a non-survivor when randomly comparing one in-hospital death with one survivor. However, its predictive performance was lower than that of GCS (AUC: 0.878, 95% CI: 0.847–0.901), hematoma volume (AUC: 0.778, 95% CI: 0.738–0.817), and midline shift (AUC: 0.760, 95% CI: 0.716–0.805).
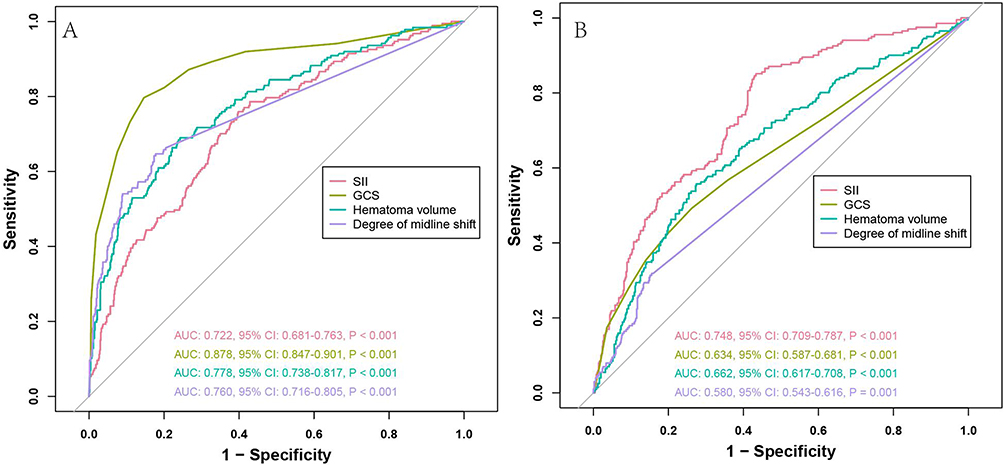 |
Figure 2 ROC curves comparing the predictive performance of SII, GCS, hematoma volume, and degree of midline shift for in-hospital mortality (A) and long-term all-cause mortality (B). Abbreviations: ROC, receiver operating characteristic; SII, systemic immune-inflammation index; GCS, Glasgow Coma Scale; AUC, area under the curve; CI, confidence interval. |
In contrast, for long-term all-cause mortality (Panel B), SII achieved the highest AUC among all variables at 0.748 (95% CI: 0.709–0.787, P < 0.001), suggesting good discriminative capacity with about a 75% probability of correctly distinguishing a patient who will die during follow-up from one who will survive, and outperforming hematoma volume (AUC: 0.662, 95% CI: 0.617–0.708), GCS (AUC: 0.634, 95% CI: 0.587–0.681), and midline shift (AUC: 0.580, 95% CI: 0.543–0.616).
Discussion
In this large retrospective cohort study of patients with T2DM complicated by sICH, we found that SII was independently associated with both in-hospital and long-term all-cause mortality. These associations were established through multivariate logistic regression for in-hospital mortality and multivariate Cox regression for long-term mortality, and remained robust in subgroup and sensitivity analyses excluding major comorbidities. ROC curve analyses further showed that SII had a higher AUC than hematoma volume, midline shift, and GCS in predicting long-term out-of-hospital mortality, suggesting better performance for long-term risk prediction. However, for in-hospital mortality, SII showed a lower AUC than these conventional indicators, indicating limited utility in short-term prognostication where acute neurological factors are dominant. These findings support the clinical utility of SII as a simple, inexpensive, and accessible biomarker for early risk stratification in patients with T2DM and sICH. While it may be less effective than traditional markers for short-term outcomes, SII demonstrates stronger value in predicting long-term prognosis, particularly after discharge when systemic inflammation may continue to influence recovery. Incorporating SII into clinical assessment may aid in identifying high-risk patients and guiding timely, individualized interventions.
Currently, studies investigating the prognostic value of the SII in cerebrovascular diseases have primarily focused on general stroke populations or treated SII as a single inflammatory biomarker. There is still a lack of systematic research exploring its prognostic significance specifically in patients with sICH complicated by T2DM. For example, Geraghty et al conducted a retrospective study of 246 patients with SAH to examine the association between SII and delayed cerebral vasospasm.30 The results showed that approximately 67.5% (166 cases) developed imaging-confirmed vasospasm, and SII at admission was significantly elevated in those patients. In multivariate logistic regression analysis, SII remained an independent predictor even after adjusting for age, aneurysm location, T2DM, and hyperlipidemia. ROC curve analysis demonstrated a good predictive value of SII for vasospasm, suggesting that early elevation of SII may serve as an independent predictor of delayed cerebral vasospasm in aneurysmal SAH, providing reference for clinical risk stratification and intervention.
In another study by Wang et al on patients with ICH, SII was associated with stroke-associated pneumonia (SAP) in univariate analysis, but ROC curve analysis revealed limited predictive ability, and SII was not identified as an independent predictor in multivariate analysis.31 Additionally, a retrospective study by Chen et al that included 333 SAH patients found that SII was an independent predictor of delayed cerebral ischemia (DCI).32 Multivariate regression showed a significant association between elevated SII and DCI risk. The ROC curve revealed high predictive accuracy for DCI (AUC = 0.860), with an optimal cutoff of 1,424, yielding a sensitivity of 93.1% and specificity of 68.1%. Patients with higher SII were also more likely to develop acute hydrocephalus and DCI, had higher modified Fisher scores and Hunt-Hess grades, and worse clinical outcomes, indicating that SII could serve as a practical biomarker for early DCI risk identification in aneurysmal SAH.
Furthermore, in a retrospective study by Liu et al, 105 patients with sICH were included to evaluate the prognostic value of SII for disease severity and outcomes.33 Patients were divided into good and poor prognosis groups based on the 3-month mRS score. Results showed that SII was significantly higher in the poor prognosis group and correlated with GCS, NIHSS, and mRS scores at admission. Multivariate regression confirmed SII as an independent risk factor for poor outcomes. ROC analysis showed that SII had an AUC of 0.838, outperforming other markers with higher predictive accuracy. Thus, SII can be used as a valid predictor of disease severity and 3-month outcomes in sICH patients. Wang et al also conducted a single-center retrospective study evaluating the ability of SII to predict acute kidney injury (AKI) and short-term outcomes in post-operative sICH patients.34 Among the 305 patients who underwent craniotomy, 129 (42.3%) developed AKI. Multivariate analysis identified SII as an independent predictor of AKI. Furthermore, in AKI patients, elevated SII was significantly associated with poor postoperative outcomes (AUC = 0.886; sensitivity 78.9%, specificity 88.2%). This study demonstrated that SII may predict both AKI risk and short-term prognosis in sICH patients undergoing surgery, offering clinical guidance. Liao et al conducted a systematic review to assess the prognostic value of SII in patients with aSAH, ultimately including four eligible studies from PubMed and Embase.35 All studies found that elevated SII at admission was significantly associated with worse outcomes, including DCI, cerebral vasospasm, and poor functional recovery. Although SII has been widely used in other medical fields for outcome prediction, this review was the first to systematically confirm its potential for predicting DCI and poor prognosis in aSAH patients, suggesting its value as an early risk stratification and prognostic tool. In a retrospective study by Trifan et al involving 239 patients with supratentorial sICH, SII was found to be an independent predictor of poor discharge outcomes.36 In multivariate analysis, SII was the only inflammatory index significantly associated with poor outcomes, and ROC curve analysis showed good discriminatory ability (AUC = 0.89), with an optimal cutoff value of 0.73 (sensitivity 95%, specificity 71%), indicating that early SII can be used to predict short-term poor outcomes in supratentorial sICH patients. However, in a retrospective analysis of 869 critically ill ICH patients from the MIMIC-IV database, Zhao et al assessed the predictive power of five inflammatory markers for ICU mortality risk.37 Although SII was included in the analysis, it did not outperform other markers and was not the most significant independent predictor in multivariate regression. Thus, while SII was considered in this study, its predictive value for ICU mortality in critically ill ICH patients was relatively limited.
Despite growing evidence suggesting that SII holds prognostic value in stroke, current research remains limited in several important ways. Most existing studies focus on general stroke populations—especially non-diabetic or mixed cohorts—without stratifying or specifically analyzing patients with coexisting T2DM. As a result, they fail to capture the unique inflammatory, immunologic, and coagulopathic disturbances characteristic of this high-risk subgroup. Moreover, most prior studies emphasized short-term functional outcomes, complications, or hospital mortality, while systematic evaluations of SII in predicting mid-to-long-term mortality (eg, post-discharge all-cause death) are still lacking. In addition, many of the available studies suffer from methodological limitations, such as small sample sizes and insufficient confounder adjustment, which restrict the generalizability and statistical power of their findings. These gaps limit our understanding of how SII might inform long-term risk stratification and individualized management strategies in patients with sICH, particularly those with T2DM. The present study addresses these limitations and contributes several novel insights. First, it is the first to focus specifically on patients with T2DM complicated by sICH—a population at significantly higher risk of mortality and disability—thereby enhancing the clinical relevance and applicability of the findings. Second, it comprehensively evaluates the association between SII and both in-hospital and long-term all-cause mortality, using robust statistical techniques including multivariate regression, subgroup analysis, interaction testing, and sensitivity analysis. Third, the study demonstrates that SII not only retains independent predictive power for short-term outcomes but also outperforms traditional indicators such as GCS, hematoma volume, and midline shift in predicting long-term mortality, highlighting its added value in post-discharge prognostication. With a relatively large cohort and rigorous model validation, this study provides the first systematic evidence that SII can serve as a reliable and cost-effective biomarker for early risk stratification in patients with T2DM and sICH. These findings fill a critical gap in the literature and lay the groundwork for future individualized treatment and monitoring strategies in this vulnerable population.
This study further explored the potential biological mechanisms underlying the prognostic value of the SII in patients with T2DM and sICH, highlighting its central role in the interplay between inflammation and immunity (Figure S1). From a mechanistic perspective, SII is a composite inflammatory marker derived from neutrophil, lymphocyte, and platelet counts. It provides a more comprehensive reflection of peripheral inflammatory burden and immune status than any single parameter alone. After cerebral hemorrhage, neutrophils are rapidly mobilized to the site of injury, releasing elastase, myeloperoxidase, and other reactive species that induce neuronal apoptosis and BBB disruption. A reduction in lymphocytes reflects an immunosuppressive state, increasing susceptibility to post-hemorrhagic infections such as pneumonia. Platelet activation contributes to the inflammation-coagulation cascade, promoting microthrombus formation and exacerbating tissue ischemia and necrosis.38 By integrating these three components, SII captures the complexity of this pathological process. Beyond inflammation, other mechanisms may also explain the elevation of SII in patients with T2DM and sICH. Chronic hyperglycemia induces endothelial dysfunction through oxidative stress and advanced glycation end products, leading to impaired vascular reactivity and increased permeability, which aggravates BBB disruption.39,40 In addition, T2DM is frequently associated with coagulopathy, including platelet hyperreactivity, impaired fibrinolysis, and abnormal activation of the coagulation cascade.41 These abnormalities not only elevate SII through increased platelet counts and neutrophil activation but also contribute to secondary ischemic damage and hematoma expansion. Thus, endothelial dysfunction and coagulopathy may represent important pathophysiological links complementing the role of systemic inflammation. In the context of T2DM, due to chronic low-grade inflammation and platelet hyperreactivity, SII levels are often persistently elevated, representing a triad of inflammation, immune dysregulation, and coagulation abnormalities. Thus, in patients with T2DM and sICH, SII may serve as a “sensitive indicator” of inflammation amplification, reflecting both the degree of tissue damage and the likelihood of poor outcomes. Dynamic monitoring of SII could potentially inform early risk identification and personalized intervention strategies. Importantly, SII encapsulates components of both the coagulation and immune-inflammatory pathways. While these systems function independently, in the complex pathological environment of T2DM combined with sICH, a synergistic interaction may exist. On the one hand, T2DM induces platelet hyperactivity and enhanced leukocyte adhesion, triggering mutual activation of both pathways and exacerbating thrombosis and tissue injury.42 On the other hand, an imbalance in the proportions of platelets and neutrophils within the SII may reciprocally affect coagulation, forming a vicious cycle of “inflammation–immunity–coagulation”.43 Therefore, SII not only overcomes the limitations of single-pathway markers but also enables multidimensional risk assessment in this high-risk population. In summary, as a representative biomarker of both inflammation and coagulation, SII plays a dual but complementary role in the disease progression of patients with T2DM and sICH. By also reflecting endothelial dysfunction and coagulopathy, SII provides a broader mechanistic framework that captures the interplay of vascular injury, immune imbalance, and hemostatic disturbances. Its application can capture the pathophysiological process from multiple perspectives, offering vital biological and theoretical support for personalized treatment strategies, precise risk stratification, and multi-target interventions in clinical practice.
Although this study was carefully designed and rigorously conducted, with stable and reliable results, several important limitations should be acknowledged. First, this was a single-center retrospective study, with all data derived from the First Affiliated Hospital of Harbin Medical University. This may introduce regional bias and limits the generalizability of the findings to national or international populations of patients with T2DM and sICH; thus, caution is warranted in extrapolating the results. Second, data collection relied on existing medical records. Despite thorough cross-checking, some degree of missing information or inconsistent data entry was inevitable, which may have introduced information bias. Third, although multiple confounding variables were adjusted for, important factors such as infection severity, specific inflammatory biomarkers (eg, CRP, IL-6, high mobility group box 1), and the use of anti-inflammatory or anti-infective therapies were not included due to limitations in routine clinical testing and data completeness. However, we note that most patients included in this study were admitted in the acute phase of sICH without concurrent infection or systemic inflammation, and only a small proportion received anti-inflammatory or anti-infective treatments. Thus, the potential confounding impact of these variables is likely limited, but their absence still restricts the comprehensiveness of the analysis. Fourth, this study only measured SII within the first 24 hours of admission and lacked dynamic monitoring throughout the disease course. Therefore, the temporal evolution of SII and its predictive value at different stages of illness could not be assessed. Fifth, although SII demonstrated good predictive performance in this sample, external validation in independent cohorts has not yet been conducted. Thus, its generalizability and practical clinical utility require further evidence. Sixth, although ROC curve analysis showed that SII had a relatively higher AUC for predicting long-term all-cause mortality compared to traditional indicators such as hematoma volume, GCS, and midline shift, its performance in predicting in-hospital mortality was only moderate and clearly lower than that of those established predictors. This limits the utility of SII in early in-hospital risk stratification and should be interpreted with caution. Additionally, the study did not examine the potential modulatory effects of treatments such as anticoagulation, glucose-lowering, or anti-inflammatory therapies on SII, nor did it explore interactions between interventions and biomarker changes, limiting the model’s capacity to evaluate treatment response. Some subgroups (eg, those receiving anti-infective therapy or reoperation) had relatively small sample sizes, resulting in insufficient statistical power for interaction analyses and affecting interpretability. Therefore, future research should not only focus on multicenter prospective validation but also investigate specific mechanistic pathways linking SII with vascular injury, immune dysfunction, and coagulation abnormalities, and further evaluate whether SII-guided therapeutic strategies—such as intensified anti-inflammatory therapy, endothelial-protective interventions, or personalized anticoagulation management—can effectively reduce mortality and improve long-term recovery in this vulnerable population.
Conclusions
In conclusion, this study confirms that the SII is an independent predictor of both in-hospital and long-term all-cause mortality in patients with T2DM complicated by sICH. Given its ability to reflect the balance between systemic inflammation and immune response, SII may help clinicians identify patients at higher risk for poor outcomes at an early stage, thereby guiding the intensity of monitoring and therapeutic decisions such as the use of anti-inflammatory agents, immunomodulatory support, or more aggressive glucose and blood pressure control. This suggests that SII has immediate clinical utility as a simple and accessible biomarker for early risk stratification and individualized management during hospitalization and after discharge. In the future, SII may also serve as a useful tool for tailoring treatment strategies, monitoring response to therapy, and integrating into clinical decision-making algorithms, particularly in precision medicine approaches. Future multicenter, prospective studies are warranted to further validate its prognostic value, investigate the underlying mechanisms, and explore its broader clinical applications.
Data Sharing Statement
The datasets used during the current study are available from the corresponding author (Hongsheng Liang) on reasonable request.
Ethics Approval and Consent to Participate
This study protocol complies with the Declaration of Helsinki and was reviewed and approved by the First Affiliated Hospital of Harbin Medical University. Written informed consent was obtained from all patients.
Author Contributions
All authors made a significant contribution to the work reported, whether that is in the conception, study design, execution, acquisition of data, analysis and interpretation, or in all these areas; took part in drafting, revising or critically reviewing the article; gave final approval of the version to be published; have agreed on the journal to which the article has been submitted; and agree to be accountable for all aspects of the work.
Funding
This work was supported by the Outstanding Youth Fund of the First Affiliated Hospital of Harbin Medical University (2024JQ02), the Natural Science Foundation of Heilongjiang Province (LH2023H028), and the Project of Zhuzhou Rehabilitation Quantitative Research and Development Foundation (2023HX004).
Disclosure
The authors declare that they have no competing interests.
References
1. Hemphill III JC, Greenberg SM, Anderson CS, et al. Guidelines for the Management of Spontaneous Intracerebral Hemorrhage: a Guideline for Healthcare Professionals From the American Heart Association/American Stroke Association. Stroke. 2015;46(7):2032–21. doi:10.1161/STR.0000000000000069
2. Feigin VL, Lawes CM, Bennett DA, Anderson CS. Stroke epidemiology: a review of population-based studies of incidence, prevalence, and case-fatality in the late 20th century. Lancet Neurol. 2003;2(1):43–53. doi:10.1016/s1474-4422(03)00266-7
3. Qureshi AI, Tuhrim S, Broderick JP, Batjer HH, Hondo H, Hanley DF. Spontaneous intracerebral hemorrhage. N Engl J Med. 2001;344(19):1450–1460. doi:10.1056/NEJM200105103441907
4. van Asch CJ, Luitse MJ, Rinkel GJ, van der Tweel I, Algra A, Klijn CJ. Incidence, case fatality, and functional outcome of intracerebral haemorrhage over time, according to age, sex, and ethnic origin: a systematic review and meta-analysis. Lancet Neurol. 2010;9(2):167–176. doi:10.1016/S1474-4422(09)70340-0
5. Wang W, Jiang B, Sun H, et al. Prevalence, Incidence, and Mortality of Stroke in China: results from a Nationwide Population-Based Survey of 480 687 Adults. Circulation. 2017;135(8):759–771. doi:10.1161/CIRCULATIONAHA.116.025250
6. Tu WJ, Zhao Z, Yin P, et al. Estimated Burden of Stroke in China in 2020. JAMA Network Open. 2023;6(3):e231455. doi:10.1001/jamanetworkopen.2023.1455
7. Poon MT, Fonville AF, Al-Shahi Salman R. Long-term prognosis after intracerebral haemorrhage: systematic review and meta-analysis. J Neurol Neurosurg Psychiatry. 2014;85(6):660–667. doi:10.1136/jnnp-2013-306476
8. Rawshani A, Rawshani A, Franzén S, et al. Risk Factors, Mortality, and Cardiovascular Outcomes in Patients with Type 2 Diabetes. N Engl J Med. 2018;379(7):633–644. doi:10.1056/NEJMoa1800256
9. Jin C, Li G, Rexrode KM, et al. Prospective Study of Fasting Blood Glucose and Intracerebral Hemorrhagic Risk. Stroke. 2018;49(1):27–33. doi:10.1161/STROKEAHA.117.019189
10. Stratton IM, Adler AI, Neil HA, et al. Association of glycaemia with macrovascular and microvascular complications of type 2 diabetes (UKPDS 35): prospective observational study. BMJ. 2000;321(7258):405–412. doi:10.1136/bmj.321.7258.405
11. Saxena A, Anderson CS, Wang X, et al. Prognostic Significance of Hyperglycemia in Acute Intracerebral Hemorrhage: the INTERACT2 Study. Stroke. 2016;47(3):682–688. doi:10.1161/STROKEAHA.115.011627
12. GBD. Diabetes Collaborators. Global, regional, and national burden of diabetes from 1990 to 2021, with projections of prevalence to 2050: a systematic analysis for the Global Burden of Disease Study 2021. Lancet. 2023;402(10397):203–234. doi:10.1016/S0140-6736(23)01301-6.
13. Vila N, Castillo J, Dávalos A, Chamorro A. Proinflammatory cytokines and early neurological worsening in ischemic stroke. Stroke. 2000;31(10):2325–2329. doi:10.1161/01.str.31.10.2325
14. Kim J, Song TJ, Park JH, et al. Different prognostic value of white blood cell subtypes in patients with acute cerebral infarction. Atherosclerosis. 2012;222(2):464–467. doi:10.1016/j.atherosclerosis.2012.02.042
15. Hu B, Yang XR, Xu Y, et al. Systemic immune-inflammation index predicts prognosis of patients after curative resection for hepatocellular carcinoma. Clin Cancer Res. 2014;20(23):6212–6222. doi:10.1158/1078-0432.CCR-14-0442
16. Yang YL, Wu CH, Hsu PF, et al. Systemic immune-inflammation index (SII) predicted clinical outcome in patients with coronary artery disease. Eur J Clin Invest. 2020;50(5):e13230. doi:10.1111/eci.13230
17. Li M, Li M, Wang Z, Zhang Y. The Combined Effect of the Systemic Immune-Inflammation Index and Aortic Valve Calcification on Major Adverse Cardiovascular Events in Patients with Coronary Heart Disease. J Inflamm Res. 2024;17:8375–8384. doi:10.2147/JIR.S493735
18. Yun S, Yi HJ, Lee DH, Sung JH. Systemic Inflammation Response Index and Systemic Immune-inflammation Index for Predicting the Prognosis of Patients with Aneurysmal Subarachnoid Hemorrhage. J Stroke Cerebrovasc Dis. 2021;30(8):105861. doi:10.1016/j.jstrokecerebrovasdis.2021.105861
19. Yang Y, Cui T, Bai X, et al. Association Between Systemic Immune-Inflammation Index and Symptomatic Intracranial Hemorrhage in Acute Ischemic Stroke Patients Undergoing Endovascular Treatment. Curr Neurovasc Res. 2022;19(1):83–91. doi:10.2174/1567202619666220406102429
20. Cao W, Song Y, Bai X, et al. Systemic-inflammatory indices and clinical outcomes in patients with anterior circulation acute ischemic stroke undergoing successful endovascular thrombectomy. Heliyon. 2024;10(10):e31122. doi:10.1016/j.heliyon.2024.e31122
21. Cao Y, Yu S, Zhang Q, et al. Chinese Stroke Association guidelines for clinical management of cerebrovascular disorders: executive summary and 2019 update of clinical management of intracerebral haemorrhage. Stroke Vasc Neurol. 2020;5(4):396–402. doi:10.1136/svn-2020-000433
22. American Diabetes Association. Classification and Diagnosis of Diabetes: standards of Medical Care in Diabetes-2020. Diabetes Care. 2020;43(Suppl 1):S14–S31. doi:10.2337/dc20-S002.
23. Writing Committee Members, Jones DW, Ferdinand KC, Ferdinand KC, et al. AHA/ACC/AANP/AAPA/ABC/ACCP/ACPM/AGS/AMA/ASPC/NMA/PCNA/SGIM Guideline for the Prevention, Detection, Evaluation and Management of High Blood Pressure in Adults: a Report of the American College of Cardiology/American Heart Association Joint Committee on Clinical Practice Guidelines. Hypertension. 2025;82(10):e212–e316. doi:10.1161/HYP.0000000000000249.
24. Li JJ, Zhao SP, Zhao D, et al. Chinese guideline for lipid management. Front Pharmacol. 2023;14:1190934. doi:10.3389/fphar.2023.1190934
25. Albus C, Barkhausen J, Fleck E, Haasenritter J, Lindner O, Silber S. The Diagnosis of Chronic Coronary Heart Disease. Dtsch Arztebl Int. 2017;114(42):712–719. doi:10.3238/arztebl.2017.0712
26. Ostrominski JW, DeFilippis EM, Bansal K, et al. Contemporary American and European Guidelines for Heart Failure Management: JACC: heart Failure Guideline Comparison. JACC Heart Fail. 2024;12(5):810–825. doi:10.1016/j.jchf.2024.02.020
27. Levin A, Ahmed SB, Carrero JJ, et al. Executive summary of the KDIGO 2024 Clinical Practice Guideline for the Evaluation and Management of Chronic Kidney Disease: known knowns and known unknowns. Kidney Int. 2024;105(4):684–701. doi:10.1016/j.kint.2023.10.016
28. Schaefer PW, Huisman TA, Sorensen AG, Gonzalez RG, Schwamm LH. Diffusion-weighted MR imaging in closed head injury: high correlation with initial glasgow coma scale score and score on modified Rankin scale at discharge. Radiology. 2004;233(1):58–66. doi:10.1148/radiol.2323031173
29. Tanioka S, Aydin OU, Hilbert A, et al. Reliability of ABC/2 volumetric estimation in spontaneous intracerebral hemorrhage for hematoma expansion prediction scores. Eur Stroke J. 2025;10(2):592–599. doi:10.1177/23969873241293572
30. Geraghty JR, Lung TJ, Hirsch Y, et al. Systemic Immune-Inflammation Index Predicts Delayed Cerebral Vasospasm After Aneurysmal Subarachnoid Hemorrhage. Neurosurgery. 2021;89(6):1071–1079. doi:10.1093/neuros/nyab354
31. Wang RH, Wen WX, Jiang ZP, et al. The clinical value of neutrophil-to-lymphocyte ratio (NLR), systemic immune-inflammation index (SII), platelet-to-lymphocyte ratio (PLR) and systemic inflammation response index (SIRI) for predicting the occurrence and severity of pneumonia in patients with intracerebral hemorrhage. Front Immunol. 2023;14:1115031. doi:10.3389/fimmu.2023.1115031
32. Chen L, Pandey S, Shen R, Xu Y, Zhang Q. Increased Systemic Immune-Inflammation Index Is Associated With Delayed Cerebral Ischemia in Aneurysmal Subarachnoid Hemorrhage Patients. Front Neurol. 2021;12:745175. doi:10.3389/fneur.2021.745175
33. Liu Y, Qiu T, Fu Z, et al. Systemic immune-inflammation index and serum glucose-potassium ratio predict poor prognosis in patients with spontaneous cerebral hemorrhage: an observational study. Medicine. 2024;103(29):e39041. doi:10.1097/MD.0000000000039041
34. Wang Q, Li S, Sun M, Ma J, Sun J, Fan M. Systemic immune-inflammation index may predict the acute kidney injury and prognosis in patients with spontaneous cerebral hemorrhage undergoing craniotomy: a single-center retrospective study. BMC Nephrol. 2023;24(1):73. doi:10.1186/s12882-023-03124-2
35. Liao B, Xu Q, Lu P, Zhang Y. The prognostic value of systemic immune-inflammation index in patients with aneurysmal subarachnoid hemorrhage: a systematic review. Neurosurg Rev. 2023;46(1):219. doi:10.1007/s10143-023-02133-x
36. Trifan G, Testai FD. Systemic Immune-Inflammation (SII) index predicts poor outcome after spontaneous supratentorial intracerebral hemorrhage. J Stroke Cerebrovasc Dis. 2020;29(9):105057. doi:10.1016/j.jstrokecerebrovasdis.2020.105057
37. Zhao G, Gu Y, Wang Z, Chen Y, Xia X. The clinical value of inflammation index in predicting ICU mortality of critically ill patients with intracerebral hemorrhage. Front Public Health. 2024;12:1373585. doi:10.3389/fpubh.2024.1373585
38. Tang J, Yue J, Tao Y, et al. Neutrophil Extracellular Traps Induce Brain Edema Around Intracerebral Hematoma via ERK-Mediated Regulation of MMP9 and AQP4. Transl Stroke Res. 2025;16(5):1461–1473. doi:10.1007/s12975-024-01318-w
39. Dhananjayan R, Koundinya KS, Malati T, Kutala VK. Endothelial Dysfunction in Type 2 Diabetes Mellitus. Indian J Clin Biochem. 2016;31(4):372–379. doi:10.1007/s12291-015-0516-y
40. Jenny L, Melmer A, Laimer M, Hardy ET, Lam WA, Schroeder V. Diabetes affects endothelial cell function and alters fibrin clot formation in a microvascular flow model: a pilot study. Diab Vasc Dis Res. 2020;17(1):1479164120903044. doi:10.1177/1479164120903044
41. Vazzana N, Ranalli P, Cuccurullo C, Davì G. Diabetes mellitus and thrombosis. Thromb Res. 2012;129(3):371–377. doi:10.1016/j.thromres.2011.11.052
42. Pickup JC. Inflammation and activated innate immunity in the pathogenesis of type 2 diabetes. Diabetes Care. 2004;27(3):813–823. doi:10.2337/diacare.27.3.813
43. Lisman T. Platelet-neutrophil interactions as drivers of inflammatory and thrombotic disease. Cell Tissue Res. 2018;371(3):567–576. doi:10.1007/s00441-017-2727-4
 © 2026 The Author(s). This work is published and licensed by Dove Medical Press Limited. The
full terms of this license are available at https://www.dovepress.com/terms
and incorporate the Creative Commons Attribution
- Non Commercial (unported, 4.0) License.
By accessing the work you hereby accept the Terms. Non-commercial uses of the work are permitted
without any further permission from Dove Medical Press Limited, provided the work is properly
attributed. For permission for commercial use of this work, please see paragraphs 4.2 and 5 of our Terms.
© 2026 The Author(s). This work is published and licensed by Dove Medical Press Limited. The
full terms of this license are available at https://www.dovepress.com/terms
and incorporate the Creative Commons Attribution
- Non Commercial (unported, 4.0) License.
By accessing the work you hereby accept the Terms. Non-commercial uses of the work are permitted
without any further permission from Dove Medical Press Limited, provided the work is properly
attributed. For permission for commercial use of this work, please see paragraphs 4.2 and 5 of our Terms.
Recommended articles
Preadmission Insulin-Treated Type 2 Diabetes Mellitus Patients Had Increased Mortality in Intensive Care Units
Fan R, Xie L, Peng X, Yu B, Zou H, Huang J, Yu X, Wang D, Yang Y
Diabetes, Metabolic Syndrome and Obesity 2022, 15:2135-2148
Published Date: 22 July 2022
Short- and Mid-Term Survival Prediction in Patients with Acute Type A Aortic Dissection Undergoing Surgical Repair: Based on the Systemic Immune-Inflammation Index
Li Z, Zhang H, Baraghtha S, Mu J, Matniyaz Y, Jiang X, Wang K, Wang D, Xue YX
Journal of Inflammation Research 2022, 15:5785-5799
Published Date: 10 October 2022
Increased Systemic Immune-Inflammation Index Was Associated with Type 2 Diabetic Peripheral Neuropathy: A Cross-Sectional Study in the Chinese Population
Li J, Zhang X, Zhang Y, Dan X, Wu X, Yang Y, Chen X, Li S, Xu Y, Wan Q, Yan P
Journal of Inflammation Research 2023, 16:6039-6053
Published Date: 11 December 2023
High Preoperative Systemic Immune-Inflammation Index Values Significantly Predicted Poor Outcomes After on-Pump Coronary Artery Bypass Surgery
Parmana IMA, Boom CE, Poernomo H, Gani C, Nugroho B, Cintyandy R, Sanjaya L, Hadinata Y, Parna DR, Yulia M, Hanafy DA
Journal of Inflammation Research 2024, 17:755-764
Published Date: 7 February 2024
Relationship Between Systemic Immune-Inflammation Index and Risk of Respiratory Failure and Death in COPD: A Retrospective Cohort Study Based on the MIMIC-IV Database
Zhang Y, Tan X, Hu S, Cui Z, Chen W
International Journal of Chronic Obstructive Pulmonary Disease 2024, 19:459-473
Published Date: 19 February 2024