Back to Journals » Research and Reports in Urology » Volume 14
A Novel Risk Score (P-score) Based on a Three-Gene Signature, for Estimating the Risk of Prostate Cancer-Specific Mortality
Authors Söderdahl F, Xu LD, Bring J, Häggman M ![]()
Received 25 January 2022
Accepted for publication 30 April 2022
Published 11 May 2022 Volume 2022:14 Pages 203—217
DOI https://doi.org/10.2147/RRU.S358169
Checked for plagiarism Yes
Review by Single anonymous peer review
Peer reviewer comments 2
Editor who approved publication: Dr Panagiotis J Vlachostergios
Fabian Söderdahl,1 Li-Di Xu,2 Johan Bring,1 Michael Häggman3
1Statisticon AB, Uppsala, Sweden; 2Prostatype Genomics AB, Stockholm, Sweden; 3Department of Urology, Uppsala University Hospital, Uppsala, Sweden
Correspondence: Michael Häggman, Department of Urology, Uppsala University Hospital, SE-751 85 Uppsala University Hospital, Uppsala, Sweden, Tel +46 70 520 42 87, Email [email protected]
Purpose: To develop and validate a risk score (P-score) algorithm which includes previously described three-gene signature and clinicopathological parameters to predict the risk of death from prostate cancer (PCa) in a retrospective cohort.
Patients and Methods: A total of 591 PCa patients diagnosed between 2003 and 2008 in Stockholm, Sweden, with a median clinical follow-up time of 7.6 years (1– 11 years) were included in this study. Expression of a three-gene signature (IGFBP3, F3, VGLL3) was measured in formalin-fixed paraffin-embedded material from diagnostic core needle biopsies (CNB) of these patients. A point-based scoring system based on a Fine-Gray competing risk model was used to establish the P-score based on the three-gene signature combined with PSA value, Gleason score and tumor stage at diagnosis. The endpoint was PCa-specific mortality, while other causes of death were treated as a competing risk. Out of the 591 patients, 315 patients (estimation cohort) were selected to develop the P-score. The P-score was subsequently validated in an independent validation cohort of 276 patients.
Results: The P-score was established ranging from the integers 0 to 15. Each one-unit increase was associated with a hazard ratio of 1.39 (95% confidence interval: 1.27– 1.51, p < 0.001). The P-score was validated and performed better in predicting PCa-specific mortality than both D’Amico (0.76 vs 0.70) and NCCN (0.76 vs 0.71) by using the concordance index for competing risk. Similar improvement patterns are shown by time-dependent area under the curve. As demonstrated by cumulative incidence function, both P-score and gene signature stratified PCa patients into significantly different risk groups.
Conclusion: We developed the P-score, a risk stratification system for newly diagnosed PCa patients by integrating a three-gene signature measured in CNB tissue. The P-score could provide valuable decision support to distinguish PCa patients with favorable and unfavorable outcomes and hence improve treatment decisions.
Keywords: biomarker, biopsy, genetic testing, prognosis, prostate cancer, Prostatype
Introduction
Prostate cancer (PCa) is one of the most common types of cancer in men; over 470,000 men were diagnosed with the disease in Europe during 2020.1 Since the emergence of prostate-specific antigen (PSA) testing in the early 1990s, incidence rates have risen considerably in Western countries.2 Standard treatment of PCa includes radical prostatectomy, radiation and hormone therapy, as well as conservative approaches, such as active surveillance.3,4
Prostate cancer is a highly heterogeneous disease and while some tumors are aggressive and require invasive treatment, most prostatic malignancies are indolent and unlikely to progress to clinically significant PCa.5,6 Despite a lifetime risk of being diagnosed with the disease of approximately 17%, the substantially lower 3% risk of dying from PCa indicates that many patients can be managed conservatively.7 Nevertheless, a large proportion of PCa patients undergo radical treatment, suggesting that a considerable number of patients are over-treated.5,6 Overtreatment is a concern because radical treatment frequently affects the patient’s quality of life and leads to considerable healthcare expenses,5,8 while not necessarily improving PCa-related survival outcomes compared to active surveillance.6,7
Currently, treatment decisions are mainly guided by clinicopathological parameters. The D’Amico classification system, a nomogram based on PSA, clinical tumor stage (T-stage), and Gleason Score (GS), is widely used to stratify PCa patients into low-, intermediate- and high-risk groups.9 There is, however, evidence of marked heterogeneity in outcomes among patients assigned to the intermediate-risk group based on the D’Amico classification system. This suggests that a subset of patients in this intermediate risk category harbor indolent tumors, causing uncertainty about the necessity of radical interventions.10 Similarly, heterogeneous outcomes among patients assigned to the intermediate risk group according to the National Comprehensive Cancer Network (NCCN) guidelines have been reported,11 although this has been improved by subdividing patients into favorable and unfavorable intermediate risk groups.4,12 Nevertheless, more reliable risk stratification systems are needed to guide decision-making and to avoid overtreatment of patients with clinically insignificant lesions while ensuring adequate therapeutic intervention for those with aggressive tumors.
Recently, genetic biomarkers have been identified and incorporated into risk scoring systems, providing improved prognostic value compared to traditional nomograms, which are based on clinical and pathological parameters only.13 However, introduction into clinical practice is slow, and data on their impact on clinical decision-making and patient outcomes is limited.4
In a previous study, Peng et al identified a three-gene signature which correlated with PCa-specific survival, independent of clinical parameters.14 The authors first identified 641 embryonic stem cell (ESC) gene predictors (ESCGPs) using publicly available datasets of whole-genome cDNA microarrays from five human ESC lines and 115 human normal tissues. Using prostate fine-needle aspiration samples from a Swedish cohort of 189 PCa patients diagnosed between 1986 and 2001, the authors found that three of these genes, insulin-like growth factor-binding protein 3 (IGFBP3), coagulation factor III (thromboplastin, tissue factor, F3), and vestigial-like family member 3 (VGLL3) correlated with PCa-specific survival. In this cohort, the three-gene signature showed improved predictive value for estimating the risk of PCa-specific mortality at diagnosis, independent of age, PSA level, tumor grade and clinical stage.14
The present retrospective study is a continuation of the work led by Dr. Peng and summarizes the development and validation of a novel risk score, the Prostatype risk score (P-score), based on this three-gene signature and clinicopathological parameters, in a larger, modern cohort with up to eleven years of survival data. The P-score is intended to guide treatment decisions for patients with newly diagnosed PCa.
Patients and Methods
Study Cohort
The study population consisted of 591 patients diagnosed with PCa (GS ≥6) by core needle biopsy (CNB) at Unilabs AB or Aleris Medilab AB, Stockholm, Sweden between 01 July 2003 and 30 December 2008. Clinical data was collected retrospectively from patient records.
The following exclusion criteria were applied to select this cohort: (i) incomplete or missing essential clinical information (PSA, T-stage, GS, age, cause of death), (ii) incomplete or missing treatment information, (iii) missing biopsy or insufficient tissue (<2 mm cancer length in CNB according to the pathology report), (iv) absence of cancer tissue, (v) less than 50% cancer cell coverage on the area marked for RNA expression test, (vi) inadequate RNA quality and (vii) unnatural cause of death. After exclusion of ineligible patients due to the above pathological exclusion criteria, gene expression was analyzed using CNB samples from 713 patients; valid results were obtained from 591 patients (82.9%) who were included in the final analysis. The cohort was divided into two subsets, an estimation dataset to develop the P-score and an independent validation dataset to validate the P-score.
This study complies with the Declaration of Helsinki. Ethical approval for the study was granted by the Regional Ethics Committee (EC) in Stockholm, Sweden (approval number 2015/984-31). The patient consent to use the archived biopsy material and medical records was not required by the committee due to the retrospective nature of the study. All data were anonymized and maintained with confidentiality throughout the study.
Specimen Collection and Handling
Formalin-fixed paraffin-embedded (FFPE) prostate CNB samples collected for PCa diagnosis according to routine procedures between 2003 and 2008 were used in this study. All biopsies were stored in the Unilabs AB or Aleris Medilab AB biobank facility under suitable conditions. According to the original pathology report, specimens containing PCa cells were identified and retrieved from the biobanks. Tissue samples were sectioned under DNase/RNase-free conditions at the Dalarna Research Laboratory (Dalarna, Sweden) and at ZeMac histoanalys AB (Stockholm, Sweden). Sample preparation is described in detail in the Supplemental Materials. In short, the PCa area was marked and quantified on the FFPE sections, cancer cell-containing areas were scraped, and total RNA was isolated using a commercial RNA extraction kit.
Gene Expression Analysis
Following extraction, total RNA from human PCa FFPE samples from 713 PCa patients was immediately subjected to gene expression analysis. The relative expression of the genes IGBP3, F3 and VGLL3 was determined in comparison to the expression level of the reference gene glyceraldehyde 3-phosphate dehydrogenase (GAPDH) using a one-step reverse transcription quantitative polymerase chain reaction (RT-qPCR) test kit (Prostatype® RT-qPCR Kit, Prostatype Genomics AB, Stockholm, Sweden) according to the manufacturer’s instructions for use.15 The reference gene served as an internal control to evaluate sample validity and integrity, and samples with a cycle threshold (C[t]) value >28 for the reference gene were excluded from subsequent analysis. In total, samples from 122 out of 713 patients were excluded because of invalid RT-qPCR results. The Prostatype® RT-qPCR kit also contains positive and negative controls that were assessed with each batch of PCa tissue samples. Measurements were conducted using a LightCycler 480-II (Roche Diagnostics AB, Stockholm, Sweden). The three-gene signature (IGFBP3, F3 and VGLL3) has been previously identified to show prognostic value for newly diagnosed PCa patients14,16,17 (see Supplemental Materials for a detailed description of gene expression analysis).
Statistical Analysis
The endpoint of the study was PCa-specific mortality. Follow-up started on the date of diagnosis, and observations were censored on the date of last follow-up. A competing risk model was used to estimate P-score to predict PCa mortality,18 using the three-gene signature combined with PSA, GS and T-stage at diagnosis based on the estimation cohort and then validated in the validation cohort. Hazard ratio (HR) for the P-score was also calculated per one-unit increase in the score by competing risk models. PCa-specific survival curves stratified by P-score risk groups as well as gene signature risk levels were assessed using the cumulative incidence function (CIF) method. Moreover, the accuracy of predicting 10-year PCa-specific survival with both P-score and D’Amico was estimated with area under the curve (AUC) using both timeROC19 and competing risk-based concordance index (C-index).20 Decision-curve analysis21 was used to assess the net-benefit comparing P-score and D’Amico across a range of threshold probabilities for PCa-specific mortality within 10 years. In the decision curve analysis, Cox proportional hazard models were applied. All reported p-values are the results of two-sided tests. Values of p < 0.05 were considered statistically significant. All statistical analyses were performed using the R statistical package (the R Foundation, version 3.6.2, Vienna, Austria).
Results
Clinical Characteristics of Study Cohort
The study cohort consisted of 591 PCa patients diagnosed with CNB at Unilabs AB or Aleris Medilab AB, Stockholm, Sweden, between 2003 and 2008 with complete genetic and clinical data. Of these, 300 patients (50.8%) were still alive at last follow-up, 123 (20.8%) patients had died of PCa and 168 (28.4%) patients had died of other diseases (Tables 1 and S1). The median follow-up time was 7.6 (min-max: 1–11) years. Out of the 591 patients, 315 patients (N = 159 hormone treatment, N = 156 active surveillance/watchful waiting) were included in the estimation cohort; none of these patients had received radical treatment. The validation cohort included 196 patients who had been treated with radical therapy (radiotherapy and prostatectomy) and 80 randomly chosen patients who had received hormone treatment (N = 43) or conservative treatment (active surveillance/watchful waiting; N = 37) (Table 1). Clinical characteristics and first-line treatment information for the overall study cohort (N = 591) as well as for the estimation and validation dataset (N = 276) are summarized in Table 1.
 |
Table 1 Clinical Characteristics of Patients in the Estimation Dataset (N = 315), Validation Dataset (N=276), and the Full Dataset (N = 591). PCa: Prostate Cancer; PSA: Prostate-Specific Antigen. Q1: Quartile 1; Q3: Quartile 3 |
Development of a Model to Predict PCa-Specific Mortality
In this cohort, the majority of deceased PCa patients died of other diseases during the follow-up period, suggesting the presence of a competing risk. Ignoring competing risks can lead to a biased estimation of cumulative incidence and predicted risks.22 Therefore, a point‐based scoring system estimated with a Fine-Gray competing risk model18 was used to develop the P-score to predict PCa-specific mortality in the estimation dataset. In a first step, the previously reported three-gene signature and conventional clinicopathological parameters (PSA, GS and clinical T-stage at diagnosis) were assessed individually by univariate analysis. The three genes were considered dichotomous variables (high vs low). For all other variables, different categories were determined based on cut-off values. In the univariate analysis, PSA, clinical T-stage, GS and the three genes IGFBP3 (p < 0.001), F3 (p<0.001), and VGLL3 (p < 0.01) were significantly associated with time to PCa-specific mortality (Table 2). In the multivariate analysis, after adjusting for GS, PSA and clinical T-stage, both IGFBP3 (p < 0.001) and VGLL3 (p < 0.036) remained strongly associated with time to PCa-specific mortality (Table 2).
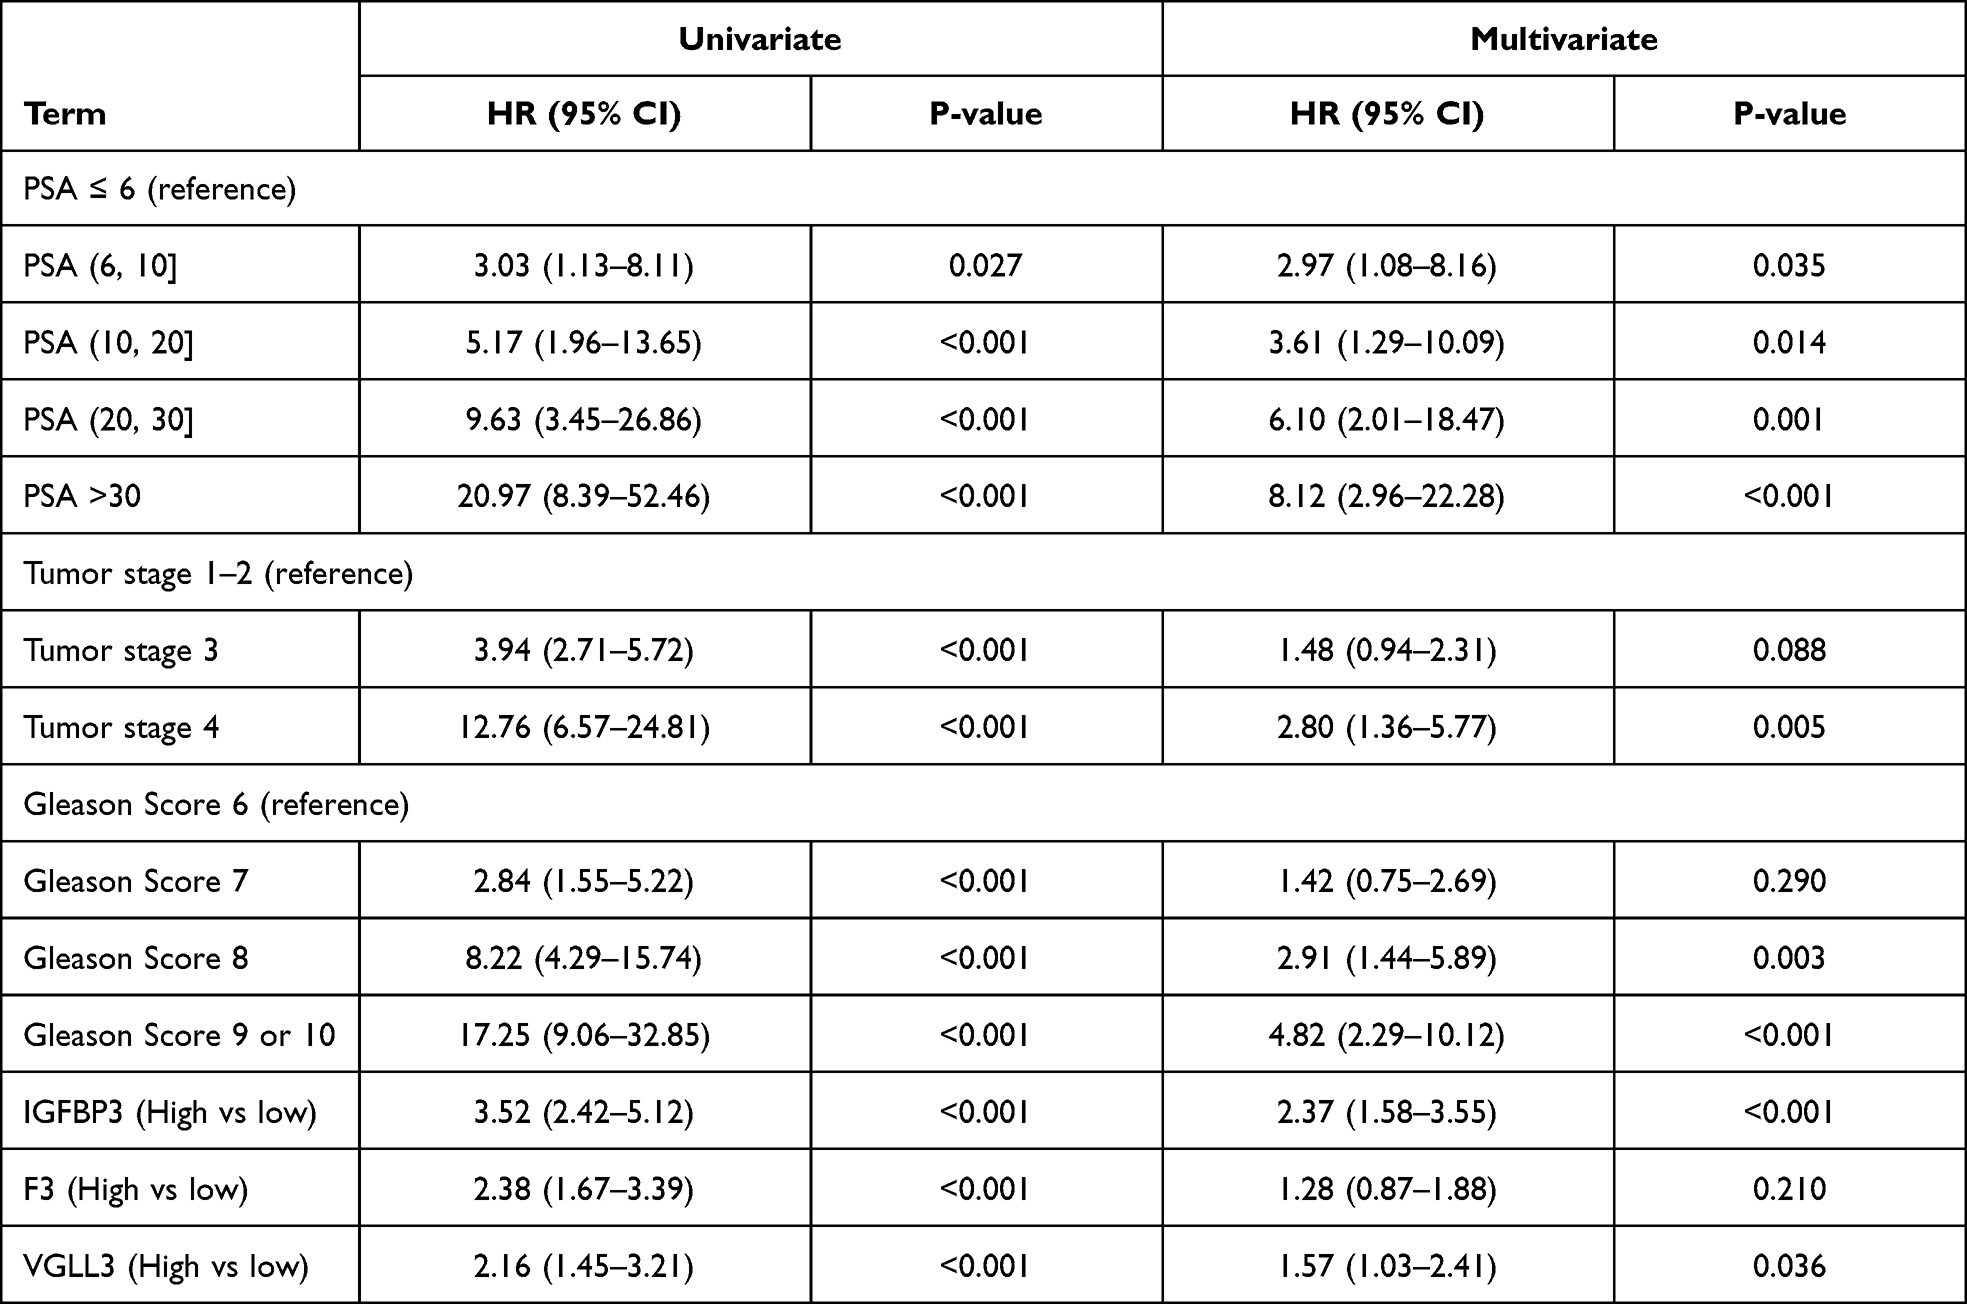 |
Table 2 Univariate and Multivariate Competing Risk Analysis of Three Genes, Together with PSA, Gleason Score and T-Stage in the Full Dataset (N = 591). The Lowest Level for Each Clinical Variable Was Used as Reference. Hazard Ratio (HR), 95% Confidence Interval (CI) and p-value are Presented. P < 0.05 Indicates Significance |
From the multivariate model, coefficients were obtained for each parameter as previously described18 and the P-score was computed based on these coefficients. The coefficients were then adjusted to generate an integer scale facilitating application of the P-score. The final P-score algorithm included the three genes IGFBP3, F3 and VGLL3, as well as the clinicopathological parameters PSA, GS and clinical T-stage at diagnosis, and ranged from the integers 0 to 15. Each added point on the P-score scale is associated with a higher probability of dying from PCa. Based on these probabilities, cut-offs were defined, and the P-score was categorized into three risk levels: low risk (0–2), intermediate risk (3–5) and high risk (6–15).
Genes are Significantly Correlated with PCa-Specific Mortality
In a univariate Cox proportional hazard model, all three genes were significant predictors of PCa-specific mortality with similar HRs both in the full dataset and the estimation dataset (Figure 1). Each of the three genes was computed as a dichotomous variable (low risk [0] vs high risk [1]) resulting in a gene signature with four categories depending on the number of genes in the high-risk category (0 – no gene in high-risk category, 1 – one gene in high-risk category; 2 – two genes in high-risk category; 3 – all genes in high-risk category). In a CIF analysis, the four categories (0–3) of the three-gene signature were significantly different in terms of time to PCa-specific mortality (p < 0.001) for all 591 patients (Figure 2A).
 |
Figure 1 Forest model to show univariable hazard ratio (HR) of individual genes in (A) the full dataset (N=591) and (B) the estimation dataset (N=315). HR, 95% confidence interval (CI) and p-value are presented. |
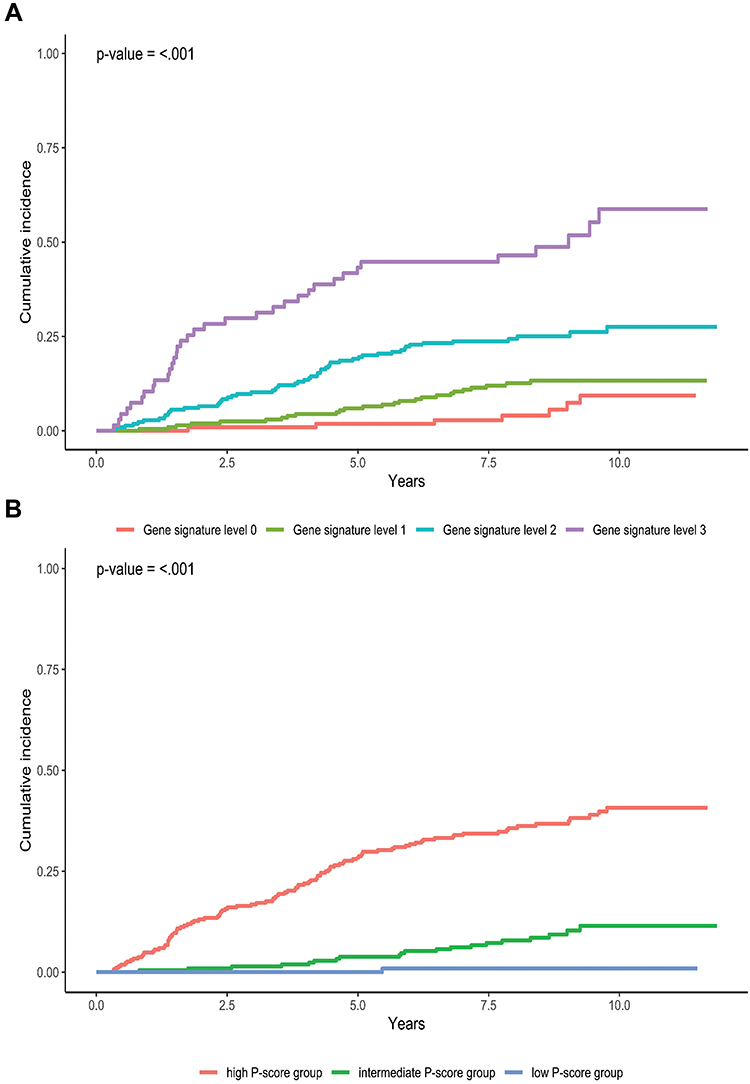 |
Figure 2 (A): Cumulative incidence function (CIF) analysis of three-gene signature to predict PCa-specific mortality versus time in the full dataset (N=591). (Gene signature levels: 0 – no gene in high-risk category, 1 – one gene in high-risk category; 2 – two genes in high-risk category; 3 – all genes in high-risk category). (B) Cumulative incidence function analysis of P-score to predict time to PCa-specific mortality in the full dataset (N=591). |
P-score Distribution and Performance
The CIF analysis also showed that the three P-score risk groups were significantly different in terms of time to PCa-specific mortality (p < 0.001) for all 591 patients (Figure 2B). The same was true for the estimation (p < 0.001) and validation (p < 0.001) data set (Supplemental Figure 1A and B).
The P-score was calculated for each patient, and its distribution across the full dataset (N = 591) is shown in Figure 3A. The observed distribution in the full dataset with a median P-score of 5 (quartile 1 [Q1] = 3; quartile 3 [Q3] = 8) was comparable to the P-score distribution in the estimation dataset (median [Q1; Q3] = 6 [3; 9]) (Supplemental Figure 2). P-score distribution in the different NCCN groups (0: low risk; 1: favorable intermediate risk; 2: unfavorable intermediate risk; 3: high risk; 4: very high risk) was also calculated (Figure 3B). The P-score downgraded 26% patients from the unfavorable intermediate NCCN group to the P-score low-risk group and upgraded 40% of patients from the low-risk to higher risk groups; 14.6% of patients in the favorable intermediate NCCN group were reassigned to the P-score high-risk group.
 |
Figure 3 (A) Distribution of the P-score in the full dataset (N=591). Q1: quartile 1; Q3: quartile 3. (B) Distribution of the P-score in the NCCN risk groups (N=590; 0: low risk; 1: favorable intermediate risk; 2: unfavorable intermediate risk; 3: high risk; 4: very high risk). Yellow dots: Censored patients; red dots: patients who died of prostate cancer (PCa); blue dots: patients who died of other causes. Two dashed lines indicate cut-offs for separating low, intermediate, and high-risk P-scores. |
P-score Outperforms Other Risk Score Systems
The performance of the P-score was compared to both the D’Amico and NCCN score, the standard PCa risk stratification systems in Europe and the USA, respectively. The distribution of PCa patients in the full dataset, as well as the estimation and validation data set across the D’Amico and NCCN risk groups, is detailed in Table 1. In total, 590 patients with valid NCCN scores were included in the comparison; one patient was excluded due to missing information for the total number of positive biopsies. In a univariate analysis (validation dataset), a one-unit increase in the P-score was associated with a HR of 1.39 (95% CI: 1.27–1.51; p < 0.001; Table 3). P-score HR was also assessed in each treatment group (full dataset), and the P-score was significantly associated with PCa-specific mortality in each treatment group with similar HRs (Supplemental Table 1). In a bivariate analysis, a one-unit increase in the P-score remained significantly associated with an increased risk for PCa-specific mortality when added to D’Amico (p < 0.001) or NCCN (p < 0.001); this was not true for the comparators (Table 3).
 |
Table 3 Prediction Performance Comparison of P-score, D’Amico, and NCCN in the Validation Dataset (N = 276). Univariate Competing Risk Analysis as Well as Bivariate Analysis Were Performed, Hazard Ratio (HR), 95% Confidence Interval (CI), P-value are Presented. Both Concordance Index (C-Index) and Area Under the Curve (AUC) Evaluated at 10 Years Follow-Up Time are Presented |
In a competing risk C-index analysis, predictive performance of the P-score in the validation dataset was 0.76 (95% CI: 0.67–0.84) compared to 0.70 (95% CI: 0.62–0.77) for the D’Amico score and 0.71 (95% CI: 0.64–0.78) for the NCCN score (Table 3). Time-dependent ROC analysis showed a similar difference (AUC [95% CI]: P-score: 0.76 [0.65–0.86] vs D’Amico: 0.69 [0.60–0.78] and NCCN: 0.69 [0.60–0.78]) (Table 3). The same improvement was observed in the estimation dataset and the full dataset (Supplemental Table 2). In a subgroup analysis (GS ≤7 or GS >7), the P-score had the highest C-index as well as AUC at 10 years of all three risk scoring systems (Supplemental Table 3).
In addition to ROC, decision curve analysis also supported the clinical utility of the P-score to accurately distinguish between patients with favorable or unfavorable outcomes. Greater net benefits were shown for the P-score compared to both D’Amico and NCCN for predicting PCa-specific mortality (Supplemental Figure 3).
To assess the contribution of the respective clinicopathologic variables and the three-gene signature to predicting PCa-specific mortality, the C-index was estimated for different combinations of variables based on a competing risk model. The established risk classification systems D’Amico and NCCN, which are based on clinicopathologic variables (T-stage, PSA and GS), resulted in a C-index of 0.74 and 0.75, respectively. Addition of the three-gene signature improved the prognostic power to 0.78 and 0.80, respectively. Similar improvements were observed when combining the three-gene signature with T-stage and T-stage + PSA, resulting in an increase in the C-index from 0.69 to 0.74 and from 0.75 to 0.76, respectively. Furthermore, we found that the three-gene signature itself had a prognostic power of 0.71. Notably, at 0.82, the P-score had a higher C-index than all combinations described above (Supplemental Table 4).
Discussion
There is an unmet clinical need to distinguish indolent from aggressive localised PCa as early as possible. The current clinicopathologic methods do not serve this goal well.23–25 Therefore, in this retrospective cohort study, we developed and validated the P-score, a novel risk stratification score for newly diagnosed PCa patients based on a previously reported three-gene signature14 and clinicopathological parameters. The P-score greatly improved prediction accuracy in terms of PCa-specific mortality, thereby addressing the unmet clinical need. Generally, the risk of dying from PCa is low,7 and it was therefore not unexpected that 60% of the deceased PCa patients in our cohort died from other causes during the follow-up period. Other-cause mortality represents a competing risk, which can lead to a biased estimation of cumulative incidence and predicted risks. To our knowledge, the P-score is the first genetic marker-based risk score for PCa patients based on a competing risk model. However, we acknowledge that similar genetic scores have applied this approach in recent validation studies.26,27
Our data demonstrate that genetic information can provide independent prognostic information. This is supported by a considerably increased C-index after adding our three-gene signature to the current standard risk scoring systems, D’Amico and NCCN, which only consider clinical variables. The P-score achieved the highest prediction accuracy in terms of PCa-specific mortality among all evaluated combinations in all datasets (full cohort, estimation dataset and validation dataset). Moreover, in the bivariate analysis, the P-score, but not the D’Amico or NCCN score, remained significantly associated with this outcome. We acknowledge that comparability of the P-score with the D’Amico or NCCN score is limited, as the standard scoring systems are only intended to assign patients into risk groups and were not designed to predict PCa-specific mortality risk within 10 years. Nevertheless, prognosis typically relies on categorization of patients according to risk strata. As the D’Amico and NCCN risk classification systems are widely used in clinical practice, comparing the P-score to these standard scoring systems may be of interest for urologists. Comparison of the P-score to PREDICT prostate, a model to predict PCa-specific and overall survival based on clinicopathologic parameters,28 would also be relevant. However, several parameters included in the PREDICT prostate model such as BRCA mutation status or comorbidity status were not widely available for our cohort.
In the past decade, several risk stratification systems have become available for PCa patients based on the expression of different genes.29–31 For some of these, the resulting genetic scores are then combined with clinicopathological parameters for a more complete estimate of the risk of an unfavorable outcome. Studies indicate that combining a genetic score with clinical parameters could improve predictive performance compared to using a genetic score alone, as determined by AUC analysis.26,27 The P-score therefore directly integrates the three-gene signature and clinicopathological parameters in a weighted algorithm. The underlying concept is comparable to the EndoPredict® EPclin score (Myriad Genetics, Inc.), a breast cancer prognostic score,32 which has been added to the American Society of Clinical Oncology guidelines for use of biomarkers to guide adjuvant breast cancer therapy in specific patient subpopulations.33 Predictive performance of the P-score in terms of PCa-specific mortality, as illustrated by AUC analysis, was comparable with the commercially available risk scoring tools when considering both genetic information and clinical variables.34
We are aware that the International Society of Urological Pathology (ISUP) grading system was introduced into clinical practice in 2015.35 However, this study is a retrospective study that includes patients diagnosed before 2008. Therefore, it was considered more appropriate to use GS, instead of ISUP grade, in this study. In the future, we will consider replacing the GS with the ISUP grade in the P-score algorithm; this requires a carefully designed validation study. T-stage subclassifications were not considered when developing the P-score as it is accepted that subcategories of the T-stage are often inaccurately assigned to localized disease.36 It is noted that GS 7 and T-stage 3 were only significantly associated with time to PCa-specific mortality in the univariate analysis but not in the multivariate analysis. Both GS 7 and T-stage 3 are clinically differentiated from the other GS and T-stage groups, respectively; therefore, it was decided to keep GS 7 and T-stage 3 as separate groups. Similarly, the gene F3 was not significantly associated with PCa-specific mortality in the multivariate analysis. However, it was highly significant in the univariate analysis and the gene signature combining IGFBP3, F3 and VGLL3, also correlated significantly. Moreover, the F3 gene, also named coagulation factor III (thromboplastin, tissue factor), is involved in tumor signaling and angiogenesis. It is overexpressed in the vast majority of PCa patients, as well as in many other solid tumors, and is strongly associated with tumor aggressiveness.14,17,37–39 Recently, the FDA approved an anti-cancer drug targeting tissue factor,40 supporting its relevance to oncologic conditions. For these reasons, we included F3 in the final P-score algorithm. The potential association of the different parameters with PCa-specific mortality needs to be further investigated in an independent clinical validation study in a larger cohort.
In contrast to most other studies, which are limited to patients with pre-selected types of treatment,30,31 the present study included heterogeneously treated patients and therefore constitutes a more representative, “real-world” cohort. However, since treatment modality could potentially affect survival, association of the P-score with the risk of PCa-specific mortality was analyzed within the different treatment groups in the full dataset and comparable HRs were determined, suggesting that the P-score has a similar predictive power irrespective of treatment. This is in line with earlier studies indicating that the beneficial effect of curative treatment is limited particularly in PCa patients aged ≥65 years41 and that radical prostatectomy may have little or no impact on the time to PCa-specific death.42
Notably, the P-score reassigned 26% of patients considered as having “unfavorable intermediate risk” according to the NCCN score to the P-score low-risk group, suggesting that these patients may have been at risk of overtreatment when using conventional risk stratification systems. Importantly, both scoring systems assigned patients who had died from PCa to either intermediate-risk or high-risk groups, except for one patient who was assigned to the low-risk group with both risk stratification systems. This suggests that the likelihood of identifying patients with aggressive tumors is very high with both methods. None of the known clinical parameters of the patient who was considered low risk by both scoring systems, but died of PCa within the follow-up period, suggested an aggressive disease. The cause of this unexpected disease course therefore remains unclear.
We acknowledge that the median follow-up time of 7.6 years could be considered relatively short, as PCa typically progresses slowly, and PCa-specific mortality may occur up to 20 years after diagnosis and first-line treatment.43 Biochemical recurrence (BCR), defined as PSA-relapse, is not considered an adequate endpoint in this context as it does not necessarily correlate with clinical recurrence and BCR alone is not a surrogate for PCa-specific mortality.44 Additional studies are underway that evaluate time-to-metastasis as a secondary endpoint, and further studies are planned to provide further evidence that the P-score is a valuable PCa risk stratification tool.
With 591 PCa patients, the cohort in this study could also be considered rather small. However, it is in the same order of magnitude as cohorts used to develop other commercially available gene expression-based scoring systems for PCa patients.30,31 Moreover, the P-score has subsequently been validated in a separate cohort, which confirmed its clinical utility. The results from this validation study will be published separately.
The technical drop-out rate (17.1%; 122 out of 713 patients) observed in this study was primarily due to inadequate RNA quality in the archived samples. There is evidence that tissue fixation method and time, as well as storage conditions, affect RNA quality.45 The tissue samples used in this study were collected from biobanks, and the archived CNBs were prepared before standardization of tissue fixation and handling routines. Therefore, we anticipate that using this method on more recently collected samples will considerably reduce the drop-out rate.
Conclusion
In conclusion, we developed the P-score, a risk stratification system for newly diagnosed PCa patients by integrating an ESC gene-signature measured in FFPE tumor tissue from PCa patients. The P-score was validated and showed superior performance in predicting PCa-specific mortality, compared to existing standard risk classification systems. Our findings support the clinical utility of the P-score for accurately distinguishing between patients likely to experience favorable or unfavorable outcomes. Consequently, it would be expected that using the P-score will reduce overtreatment of PCa patients, while ensuring that individuals with high-risk disease are treated appropriately. Therefore, the P-score could provide urologists with a valuable decision support tool to identify PCa patients most likely to benefit from curative treatment while simultaneously reducing overtreatment.
Acknowledgments
Zhuochun Peng, a former employee of Prostatype Genomics AB who unfortunately passed away in March 2019, has contributed greatly to the project design, cohort selection, clinical parameter collection and genetic analysis. The authors also thank the research groups at Karolinska Institute, Stockholm, Sweden, that Zhouchun Peng was part of. Furthermore, the authors thank Aleris Medilab AB and Unilabs AB, Stockholm, Sweden, for providing all biopsy samples used in this study. The contribution of the Medical Writer Jennifer Honek at LINK Medical AB, Sweden, is highly appreciated.
Disclosure
MH is a board member of and reports personal fees from Prostatype Genomics AB. LDX is employed by Prostatype Genomics AB. The authors report no other conflicts of interest in this work.
References
1. European Cancer Information System. European Union; 2021. Available from: https://ecis.jrc.ec.europa.eu.
2. Neppl-Huber C, Zappa M, Coebergh JW, et al. Changes in incidence, survival and mortality of prostate cancer in Europe and the United States in the PSA era: additional diagnoses and avoided deaths. Ann Oncol. 2012;23(5):1325–1334. doi:10.1093/annonc/mdr414
3. European Association of Urology. EAU guidelines; 2021. Available from: http://uroweb.org/guidelines/compilations-of-all-guidelines/.
4. Schaeffer E, Srinivas S, Antonarakis ES, et al. NCCN Guidelines Insights: Prostate Cancer, Version 1.2021. J Natl Compr Canc Netw. 2021;19(2):134-143. doi:10.6004/jnccn.2021.0008
5. Aizer AA, Gu X, Chen MH, et al. Cost implications and complications of overtreatment of low-risk prostate cancer in the United States. J Natl Compr Canc Netw. 2015;13(1):61–68. doi:10.6004/jnccn.2015.0009
6. Shao YH, Albertsen PC, Roberts CB, et al. Risk profiles and treatment patterns among men diagnosed as having prostate cancer and a prostate-specific antigen level below 4.0 ng/mL. Arch Intern Med. 2010;170(14):1256–1261. doi:10.1001/archinternmed.2010.221
7. Wilt TJ, Brawer MK, Jones KM, et al. Radical prostatectomy versus observation for localized prostate cancer. N Engl J Med. 2012;367(3):203–213. doi:10.1056/NEJMoa1113162
8. Dragan J, Kania J, Salagierski M. Active surveillance in prostate cancer management: where do we stand now? Arch Med Sci. 2021;17(3):805–811. doi:10.5114/aoms.2019.85252
9. D’Amico AV. Risk-based management of prostate cancer. N Engl J Med. 2011;365(2):169–171. doi:10.1056/NEJMe1103829
10. Pollard ME, Hobbs AR, Kwon YS, et al. Heterogeneity of outcomes in D’Amico intermediate-risk prostate cancer patients after radical prostatectomy: influence of primary and secondary Gleason score. Oncol Res Treat. 2017;40(9):508–514. doi:10.1159/000477545
11. Reese AC, Pierorazio PM, Han M, Partin AW. Contemporary evaluation of the National Comprehensive Cancer Network prostate cancer risk classification system. Urology. 2012;80(5):1075–1079. doi:10.1016/j.urology.2012.07.040
12. Serrano NA, Anscher MS. Favorable vs unfavorable intermediate-risk prostate cancer: a review of the new classification system and its impact on treatment recommendations. Oncology. 2016;30(3):229–236.
13. Matulay JT, Wenske S. Genetic signatures on prostate biopsy: clinical implications. Transl Cancer Res. 2018;7:S640–S650. doi:10.21037/tcr.2018.03.26
14. Peng Z, Skoog L, Hellborg H, et al. An expression signature at diagnosis to estimate prostate cancer patients’ overall survival. Prostate Cancer Prostatic Dis. 2014;17(1):81–90. doi:10.1038/pcan.2013.57
15. Prostatype Genomics AB. Prostatype RT qPCR Kit - Instructions for Use. Revision 7. Sweden: Solna; 2021.
16. Peng Z, Andersson K, Lindholm J, et al. Operator dependent choice of prostate cancer biopsy has limited impact on a gene signature analysis for the highly expressed genes IGFBP3 and F3 in prostate cancer epithelial cells. PLoS One. 2014;9(10):e109610. doi:10.1371/journal.pone.0109610
17. Peng Z, Andersson K, Lindholm J, et al. Improving the prediction of prostate cancer overall survival by supplementing readily available clinical data with gene expression levels of IGFBP3 and F3 in formalin-fixed paraffin embedded core needle biopsy material. PLoS One. 2016;11(1):e0145545. doi:10.1371/journal.pone.0145545
18. Austin PC, Lee DS, D’Agostino RB, Fine JP. Developing points-based risk-scoring systems in the presence of competing risks. Stat Med. 2016;35(22):4056–4072. doi:10.1002/sim.6994
19. Blanche P, Dartigues JF, Jacqmin-Gadda H. Estimating and comparing time-dependent areas under receiver operating characteristic curves for censored event times with competing risks. Stat Med. 2013;32(30):5381–5397. doi:10.1002/sim.5958
20. Wolbers M, Blanche P, Koller MT, Witteman JC, Gerds TA. Concordance for prognostic models with competing risks. Biostatistics. 2014;15(3):526–539. doi:10.1093/biostatistics/kxt059
21. Vickers AJ, Elkin EB. Decision curve analysis: a novel method for evaluating prediction models. Med Decis Making. 2006;26(6):565–574. doi:10.1177/0272989X06295361
22. Austin PC, Lee DS, Fine JP. Introduction to the analysis of survival data in the presence of competing risks. Circulation. 2016;133(6):601–609. doi:10.1161/CIRCULATIONAHA.115.017719
23. Arora R, Koch MO, Eble JN, Ulbright TM, Li L, Cheng L. Heterogeneity of Gleason grade in multifocal adenocarcinoma of the prostate. Cancer. 2004;100(11):2362–2366. doi:10.1002/cncr.20243
24. Cantiello F, Russo GI, Kaufmann S, et al. Role of multiparametric magnetic resonance imaging for patients under active surveillance for prostate cancer: a systematic review with diagnostic meta-analysis. Prostate Cancer Prostatic Dis. 2019;22(2):206–220. doi:10.1038/s41391-018-0113-2
25. Zelic R, Garmo H, Zugna D, et al. Predicting prostate cancer death with different pretreatment risk stratification tools: a head-to-head comparison in a nationwide cohort study. Eur Urol. 2020;77(2):180–188. doi:10.1016/j.eururo.2019.09.027
26. Cooperberg MR, Davicioni E, Crisan A, Jenkins RB, Ghadessi M, Karnes RJ. Combined value of validated clinical and genomic risk stratification tools for predicting prostate cancer mortality in a high-risk prostatectomy cohort. Eur Urol. 2015;67(2):326–333. doi:10.1016/j.eururo.2014.05.039
27. Karnes RJ, Choeurng V, Ross AE, et al. Validation of a genomic risk classifier to predict prostate cancer-specific mortality in men with adverse pathologic features. Eur Urol. 2018;73(2):168–175. doi:10.1016/j.eururo.2017.03.036
28. Thurtle DR, Greenberg DC, Lee LS, Huang HH, Pharoah PD, Gnanapragasam VJ. Individual prognosis at diagnosis in nonmetastatic prostate cancer: development and external validation of the PREDICT prostate multivariable model. PLoS Med. 2019;16(3):e1002758. doi:10.1371/journal.pmed.1002758
29. Cullen J, Rosner IL, Brand TC, et al. A biopsy-based 17-gene genomic prostate score predicts recurrence after radical prostatectomy and adverse surgical pathology in a racially diverse population of men with clinically low- and intermediate-risk prostate cancer. Eur Urol. 2015;68(1):123–131. doi:10.1016/j.eururo.2014.11.030
30. Cuzick J, Swanson GP, Fisher G, et al. Prognostic value of an RNA expression signature derived from cell cycle proliferation genes in patients with prostate cancer: a retrospective study. Lancet Oncol. 2011;12(3):245–255. doi:10.1016/S1470-2045(10)70295-3
31. Erho N, Crisan A, Vergara IA, et al. Discovery and validation of a prostate cancer genomic classifier that predicts early metastasis following radical prostatectomy. PLoS One. 2013;8(6):e66855. doi:10.1371/journal.pone.0066855
32. Filipits M, Rudas M, Jakesz R, et al. A new molecular predictor of distant recurrence in ER-positive, HER2-negative breast cancer adds independent information to conventional clinical risk factors. Clin Cancer Res. 2011;17(18):6012–6020. doi:10.1158/1078-0432.CCR-11-0926
33. Barbi M, Makower D, Sparano JA. The clinical utility of gene expression assays in breast cancer patients with 0–3 involved lymph nodes. Ther Adv Med Oncol. 2021;13:17588359211038467. doi:10.1177/17588359211038467
34. Van Den Eeden SK, Lu R, Zhang N, et al. A biopsy-based 17-gene genomic prostate score as a predictor of metastases and prostate cancer death in surgically treated men with clinically localized disease. Eur Urol. 2018;73(1):129–138. doi:10.1016/j.eururo.2017.09.013
35. Epstein JI, Egevad L, Amin MB, et al. The 2014 International Society of Urological Pathology (ISUP) consensus conference on Gleason grading of prostatic carcinoma: definition of grading patterns and proposal for a new grading system. Am J Surg Pathol. 2016;40(2):244–252. doi:10.1097/PAS.0000000000000530
36. Reese AC, Sadetsky N, Carroll PR, Cooperberg MR. Inaccuracies in assignment of clinical stage for localized prostate cancer. Cancer. 2011;117(2):283–289. doi:10.1002/cncr.25596
37. Abdulkadir SA, Carvalhal GF, Kaleem Z, et al. Tissue factor expression and angiogenesis in human prostate carcinoma. Hum Pathol. 2000;31(4):443–447. doi:10.1053/hp.2000.6547
38. Haubold K, Rink M, Spath B, et al. Tissue factor procoagulant activity of plasma microparticles is increased in patients with early-stage prostate cancer. Thromb Haemost. 2009;101(6):1147–1155. doi:10.1160/TH08-10-0654
39. Kaushal V, Mukunyadzi P, Siegel ER, Dennis RA, Johnson DE, Kohli M. Expression of tissue factor in prostate cancer correlates with malignant phenotype. Appl Immunohistochem Mol Morphol. 2008;16(1):1–6. doi:10.1097/01.pai.0000213157.94804.fc
40. Mullard A. First-in-class tissue factor-targeted antibody-drug conjugate secures FDA approval. Nat Rev Drug Discov. 2021;20(11):806.
41. Bill-Axelson A, Holmberg L, Ruutu M, et al. Radical prostatectomy versus watchful waiting in early prostate cancer. N Engl J Med. 2011;364(18):1708–1717. doi:10.1056/NEJMoa1011967
42. Vernooij RW, Lancee M, Cleves A, Dahm P, Bangma CH, Aben KK. Radical prostatectomy versus deferred treatment for localised prostate cancer. Cochrane Database Syst Rev. 2020;6:CD006590. doi:10.1002/14651858.CD006590.pub3
43. Bill-Axelson A, Holmberg L, Garmo H, et al. Radical prostatectomy or watchful waiting in prostate cancer - 29-year follow-up. N Engl J Med. 2018;379(24):2319–2329. doi:10.1056/NEJMoa1807801
44. Artibani W, Porcaro AB, De Marco V, Cerruto MA, Siracusano S. Management of biochemical recurrence after primary curative treatment for prostate cancer: a review. Urol Int. 2018;100(3):251–262. doi:10.1159/000481438
45. Srinivasan M, Sedmak D, Jewell S. Effect of fixatives and tissue processing on the content and integrity of nucleic acids. Am J Pathol. 2002;161(6):1961–1971. doi:10.1016/S0002-9440(10)64472-0
 © 2022 The Author(s). This work is published and licensed by Dove Medical Press Limited. The
full terms of this license are available at https://www.dovepress.com/terms
and incorporate the Creative Commons Attribution
- Non Commercial (unported, 3.0) License.
By accessing the work you hereby accept the Terms. Non-commercial uses of the work are permitted
without any further permission from Dove Medical Press Limited, provided the work is properly
attributed. For permission for commercial use of this work, please see paragraphs 4.2 and 5 of our Terms.
© 2022 The Author(s). This work is published and licensed by Dove Medical Press Limited. The
full terms of this license are available at https://www.dovepress.com/terms
and incorporate the Creative Commons Attribution
- Non Commercial (unported, 3.0) License.
By accessing the work you hereby accept the Terms. Non-commercial uses of the work are permitted
without any further permission from Dove Medical Press Limited, provided the work is properly
attributed. For permission for commercial use of this work, please see paragraphs 4.2 and 5 of our Terms.
Recommended articles
Serum NOX4 as a Promising Prognostic Biomarker in Association with 90-Day Outcome of Severe Traumatic Brain Injury
Jiang F, Chen Z, Hu J, Liu Q
International Journal of General Medicine 2022, 15:5307-5317
Published Date: 30 May 2022
Identification of KRBA1 as a Potential Prognostic Biomarker Associated with Immune Infiltration and m6A Modification in Hepatocellular Carcinoma
Liu Y, Fu B, Yu Z, Song G, Zeng H, Gong Y, Ding Y, Huang D
Journal of Hepatocellular Carcinoma 2022, 9:497-516
Published Date: 31 May 2022
Expression, Clinical Significance, Immune Infiltration, and Regulation Network of miR-3940-5p in Lung Adenocarcinoma Based on Bioinformatic Analysis and Experimental Validation
Lin Z, Huang W, Xie Z, Yi Y, Li Z
International Journal of General Medicine 2022, 15:6451-6464
Published Date: 6 August 2022
CSTF2 Acts as a Prognostic Marker Correlated with Immune Infiltration in Hepatocellular Carcinoma
Zhang W, Wan Y, Zhang Y, Liu Q, Zhu X
Cancer Management and Research 2022, 14:2691-2709
Published Date: 12 September 2022
NUP62CL as an Immunological and Prognostic Biomarker of Oral Squamous Cell Carcinoma
Yu X, Xu L, Zhou Y, Zhou X, Yang L, Zhou Y
Journal of Inflammation Research 2023, 16:3799-3809
Published Date: 29 August 2023