
Back to Journals » International Journal of General Medicine » Volume 19
A Machine Learning-Based Model for Cirrhosis Risk Stratification Incorporating Noninvasive Markers and Clinical Variables
Authors Wang Y, Liang H  , Si C, Li A, Wu H, Chen B
Received 11 February 2026
Accepted for publication 3 July 2026
Published 23 July 2026 Volume 2026:19 602749
DOI https://doi.org/10.2147/IJGM.S602749
Checked for plagiarism Yes
Review by Single anonymous peer review
Peer reviewer comments 3
Editor who approved publication: Professor Hyam Leffert
Yanping Wang, Haijun Liang, Changyun Si, Aihui Li, Hongjie Wu, Baoxin Chen
Department of Infectious Diseases, The First Affiliated Hospital of Henan Medical University, Xinxiang, 453100, People’s Republic of China
Correspondence: Haijun Liang, Department of Infectious Diseases, The First Affiliated Hospital of Henan Medical University, No. 88 Jiankang Road, Weihui, Xinxiang, Henan, 453100, People’s Republic of China, Tel +86-13409228305, Email [email protected]
Background: This study aimed to develop and validate a nomogram model integrating routine laboratory parameters, non-invasive fibrosis markers, and liver elastography parameters for cirrhosis risk stratification in patients with chronic liver disease.
Methods: A total of 344 patients with chronic liver disease were retrospectively enrolled and randomly divided into a training set (n=241) and a validation set (n=103) in a 7:3 ratio. Independent predictors were identified using univariate analysis, LASSO regression, and multivariate logistic regression. Machine learning algorithms, including Random Forest, Support Vector Machine, and Logistic Regression were constructed using these predictors. Internal validation was performed using the Bootstrap method. Model performance was evaluated by the area under the receiver operating characteristic curve (AUC), calibration curves, and decision curve analysis (DCA).
Results: Multivariable logistic regression identified age, platelet count, aspartate aminotransferase/alanine aminotransferase (AST/ALT) ratio, total bilirubin, abnormal international normalized ratio (> 1.2), and liver stiffness measurement as independent predictors of cirrhosis. The Random Forest model demonstrated slightly superior performance, with AUCs of 0.835 (95% CI: 0.767– 0.904) and 0.745 (95% CI: 0.597– 0.893) in the training and validation sets, respectively. The calibration curves demonstrated good consistency between the predicted probabilities and the actual risks (Hosmer-Lemeshow test, P > 0.05). Decision curve analysis indicated that the Random Forest model provided a superior net clinical benefit across a threshold probability range of 0.1– 0.3.
Conclusion: This study developed and validated a cirrhosis risk prediction model. The Random Forest model offers marginally better accuracy, while the nomogram provides a simple, interpretable tool for bedside clinical use. With further external validation, this model could potentially assist clinicians in stratifying cirrhosis risk among patients with chronic liver disease.
Keywords: liver cirrhosis, risk stratification, nomogram, prediction model, non-invasive markers
Introduction
Liver cirrhosis represents the terminal stage of various chronic liver diseases. Globally, chronic hepatitis B virus (HBV) infection and metabolic dysfunction-associated steatotic liver disease (MAFLD) are the leading etiologies, accounting for over 70% of cirrhosis cases worldwide. In China, HBV remains the predominant cause, while the prevalence of MAFLD-related cirrhosis is increasing rapidly due to changing lifestyles. Effective etiological control (eg., antiviral therapy for HBV) can significantly slow or even reverse fibrosis progression, but a large proportion of patients remain undiagnosed or untreated until advanced stages. It is characterized by a high incidence of complications and is a major cause of liver-related mortality, imposing a substantial disease burden.1 Early and accurate identification of patients at high risk of progressing to cirrhosis is crucial for initiating targeted surveillance and interventions to improve prognosis.2 Current clinical risk assessment often relies on physician experience or single non-invasive markers, lacking a precise predictive tool capable of integrating multi-dimensional information. The risk of cirrhosis is influenced by a complex interplay of multi-faceted factors.3 Demographic characteristics, such as age, constitute non-negligible non-modifiable risk factors.4 Platelet count, which reflects portal hypertension and hypersplenism, and the International Normalized Ratio, which reflects hepatic synthetic function, are key indicators for assessing liver function reserve and portal hypertension status.5 Direct markers of hepatocellular injury, such as the Aspartate Aminotransferase to Alanine Aminotransferase ratio (AST/ALT ratio) and total bilirubin levels, indicate ongoing hepatic inflammation and damage.6 Furthermore, liver stiffness measurement obtained directly via transient elastography provides an objective anatomical quantification of the degree of liver fibrosis.7 However, the combined impact of these factors on the ultimate risk of developing cirrhosis is complex, and a comprehensive predictive model integrating multi-dimensional information—including demographics, routine laboratory parameters, and direct imaging measurements—is currently lacking.8 Machine learning algorithms can efficiently process complex clinical data and capture potential non-linear relationships and interactions among variables, offering advantages for constructing high-dimensional predictive models. Consequently, this study aims to systematically integrate multi-dimensional clinical data to develop and validate a nomogram model for predicting the risk of cirrhosis in patients with chronic liver disease, utilizing both logistic regression and machine learning methods. The goal is to provide a quantitative decision-making tool for early clinical risk stratification and personalized management.
Materials and Methods
Study Population
A total of 344 patients with chronic liver disease who attended the Hepatology Department of our hospital and completed relevant examinations between January 2021 and December 2023 were retrospectively enrolled. The median follow-up time from baseline examination to cirrhosis diagnosis or final follow-up was 24.6 months (interquartile range: 12.3–36.8 months). Cirrhosis diagnosis was confirmed at any time point during the follow-up period, with the earliest diagnosis occurring 3 months after baseline and the latest at 42 months. Inclusion criteria were: (1) age 18–75 years; (2) diagnosis of common chronic liver diseases such as chronic hepatitis B, chronic hepatitis C, or non-alcoholic fatty liver disease; (3) completion of a full baseline assessment, including laboratory tests, imaging examinations, and transient elastography; (4) availability of definitive clinical evidence for either the diagnosis or exclusion of cirrhosis (determined via liver biopsy, comprehensive imaging evaluation, or long-term follow-up). Exclusion criteria were: (1) concurrent hepatocellular carcinoma or other malignancies; (2) concurrent severe dysfunction of vital organs (eg., heart, brain, kidney); (3) pregnancy or lactation; (4) incomplete clinical data precluding accurate group assignment. Data Collection Baseline multi-dimensional information was systematically extracted from the hospital electronic medical record system and the liver disease clinical database, serving as candidate predictors for model construction. Specifically, data included: (1) Demographic and clinical characteristics: age, gender, height, weight, body mass index (BMI, calculated as weight in kilograms divided by height in meters squared), etiology of chronic liver disease, history of diabetes. Height and weight were collected solely for the calculation of BMI and were not included as individual candidate predictors in the model. (2) Laboratory parameters: platelet count, albumin, aspartate aminotransferase, alanine aminotransferase, total bilirubin, creatinine, International Normalized Ratio, and total cholesterol. Based on these parameters, the following derived indices were calculated: Neutrophil-to-Lymphocyte Ratio, Fibrosis-4 Index (FIB-4), Aspartate Aminotransferase to Platelet Ratio Index (APRI), and Albumin-Bilirubin Score (ALBI). (3) Imaging and elastography parameters: All patients underwent abdominal ultrasonography and transient elastography. Liver morphological features, liver stiffness measurement, and controlled attenuation parameter values were recorded.
Outcome Definition
The study outcome was the diagnosis of cirrhosis.9 The diagnostic criteria integrated liver biopsy, imaging features (eg., ultrasonography, CT, or MRI findings of liver surface nodularity, parenchymal texture changes, and portal vein widening), and clinical evidence of decompensation.10 Patients were subsequently categorized into a cirrhosis group or a non-cirrhosis group based on this diagnosis. All diagnoses and group assignments were independently reviewed by two hepatologists with the rank of associate chief physician or higher. In cases of disagreement, a third senior expert made the final adjudication.
Statistical Analysis
Data analysis was performed using SPSS 26.0, R 4.2.3, and Python 3.8.5 software. Continuous variables with a normal distribution are presented as mean±standard deviation and were compared between groups using the independent samples t-test. Non-normally distributed data are presented as median (interquartile range) and were compared using the Mann–Whitney U-test. Categorical variables are presented as number (percentage) and were compared using the Chi-square test or Fisher’s exact test. The total cohort was randomly divided into a training set and a validation set at a 7:3 ratio, ensuring comparability of baseline characteristics between the two sets (P>0.05). In the training set, univariate analysis was first performed to screen potential predictors with P<0.05. Subsequently, the Least Absolute Shrinkage and Selection Operator (LASSO) regression was employed for variable selection. Finally, significant variables were entered into a multivariate logistic regression analysis to identify independent influencing factors. Machine learning algorithms, including Random Forest, Support Vector Machine, and Logistic Regression were constructed using core variables. Model performance was compared via the area under the receiver operating characteristic (ROC) curve (AUC). Calibration was evaluated by plotting calibration curves. Decision curve analysis (DCA) was performed to evaluate the clinical utility of the models. SHapley Additive exPlanations (SHAP) analysis was used to interpret the prediction logic of the best-performing machine learning model. All hypothesis tests were two-sided, and a P<0.05 was considered statistically significant.
Results
Comparison of Baseline Characteristics Between the Training and Validation Cohorts
No statistically significant differences were observed in any baseline indicators between the training cohort (n=241) and the validation cohort (n=103) (P>0.05). Specifically, the two cohorts demonstrated well-balanced distributions with respect to demographic characteristics (age, sex, etiology composition), general clinical parameters (body mass index, history of diabetes), routine laboratory indices (platelet count, albumin, AST/ALT ratio, total bilirubin, creatinine, total cholesterol, neutrophil‑to‑lymphocyte ratio), widely used non‑invasive fibrosis scores (FIB‑4 index, APRI index, ALBI score), and imaging‑based elastometry measures (liver stiffness measurement, controlled attenuation parameter). The proportion of patients with an abnormal international normalized ratio also did not differ between the two groups. These findings indicate that the training and validation cohorts possess highly comparable baseline characteristics. Consequently, they are suitable for the subsequent development and internal validation of the prediction model (Table 1).
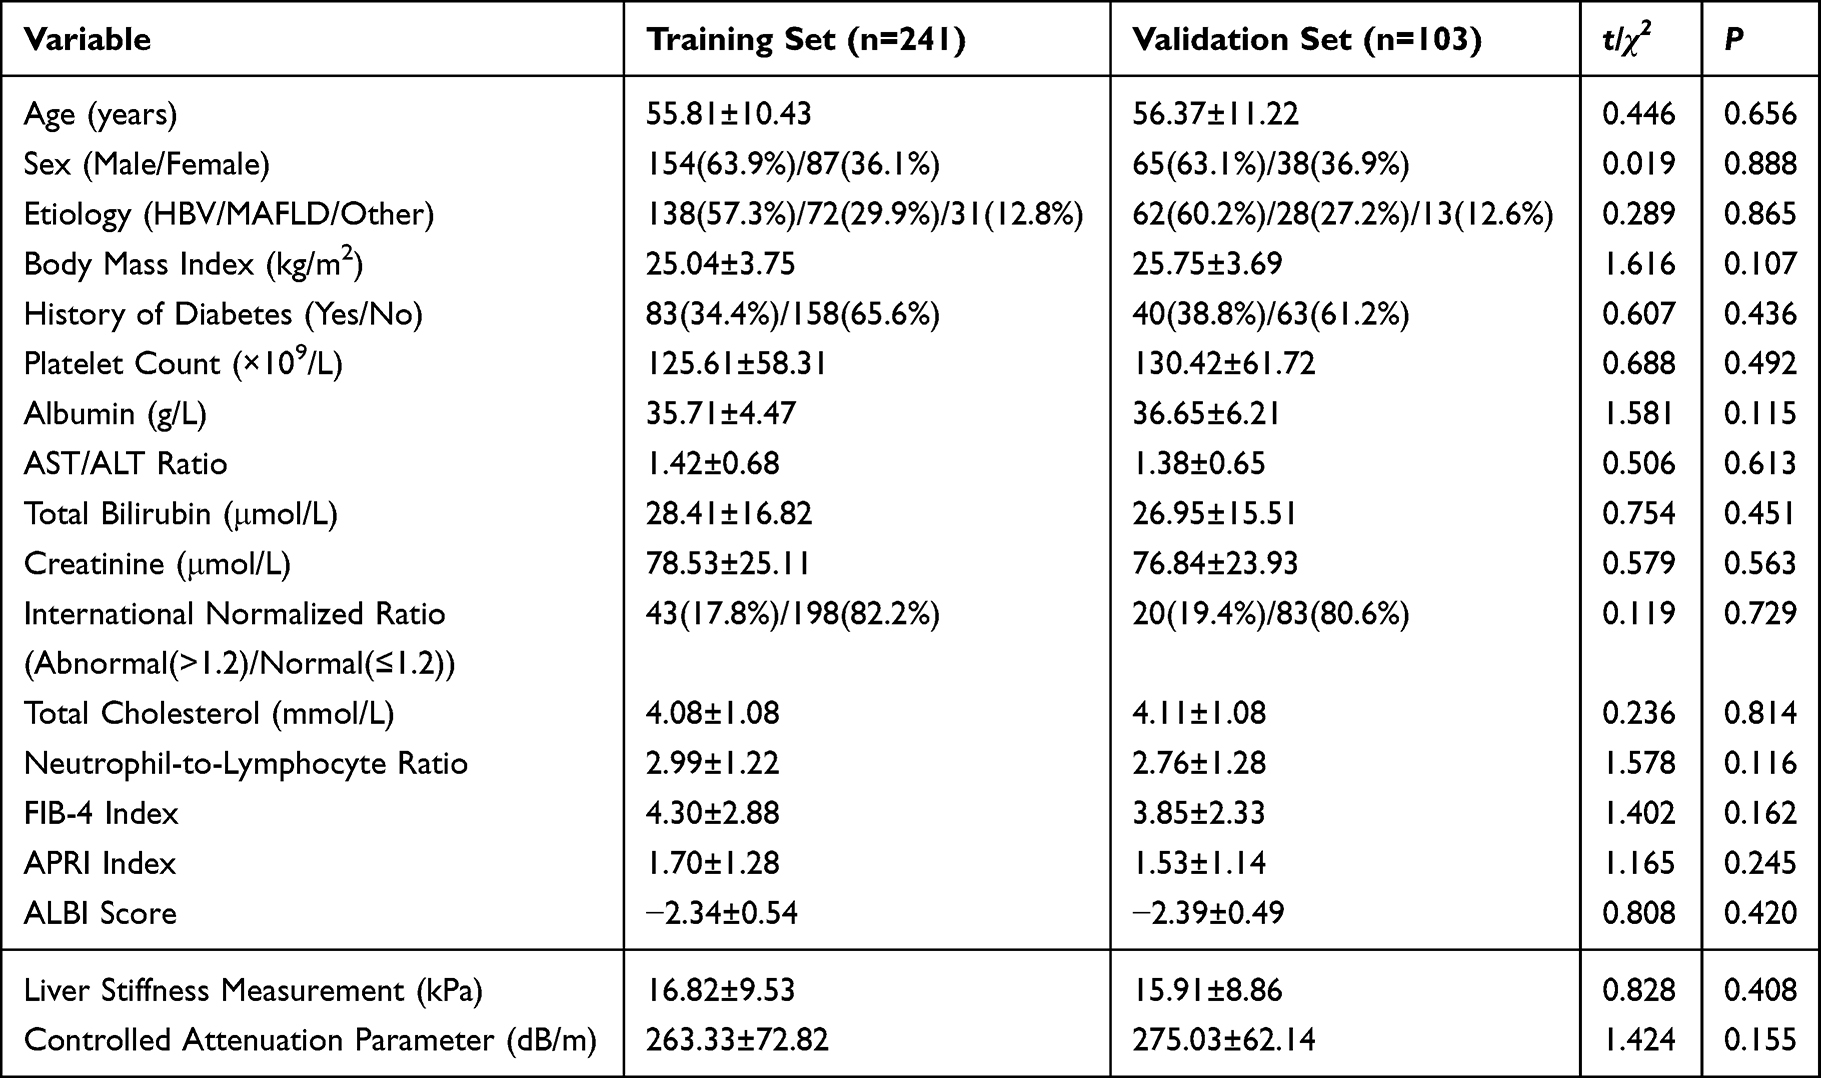 |
Table 1 Comparison of Baseline Characteristics Between Patients in the Training Set and Validation Set |
Univariate Analysis of Liver Cirrhosis Risk in the Training Cohort
Within the training cohort of 241 patients with chronic liver disease, the participants were stratified into a cirrhosis group (n=73) and a non-cirrhosis group (n=168) based on diagnostic outcomes. Univariate analysis showed that six indices exhibited statistically significant differences between the two groups (P<0.05): age, platelet count, AST/ALT ratio, total bilirubin, abnormal international normalized ratio, and liver stiffness measurement. Conversely, no statistically significant differences were observed for the remaining indices (P>0.05) (Table 2).
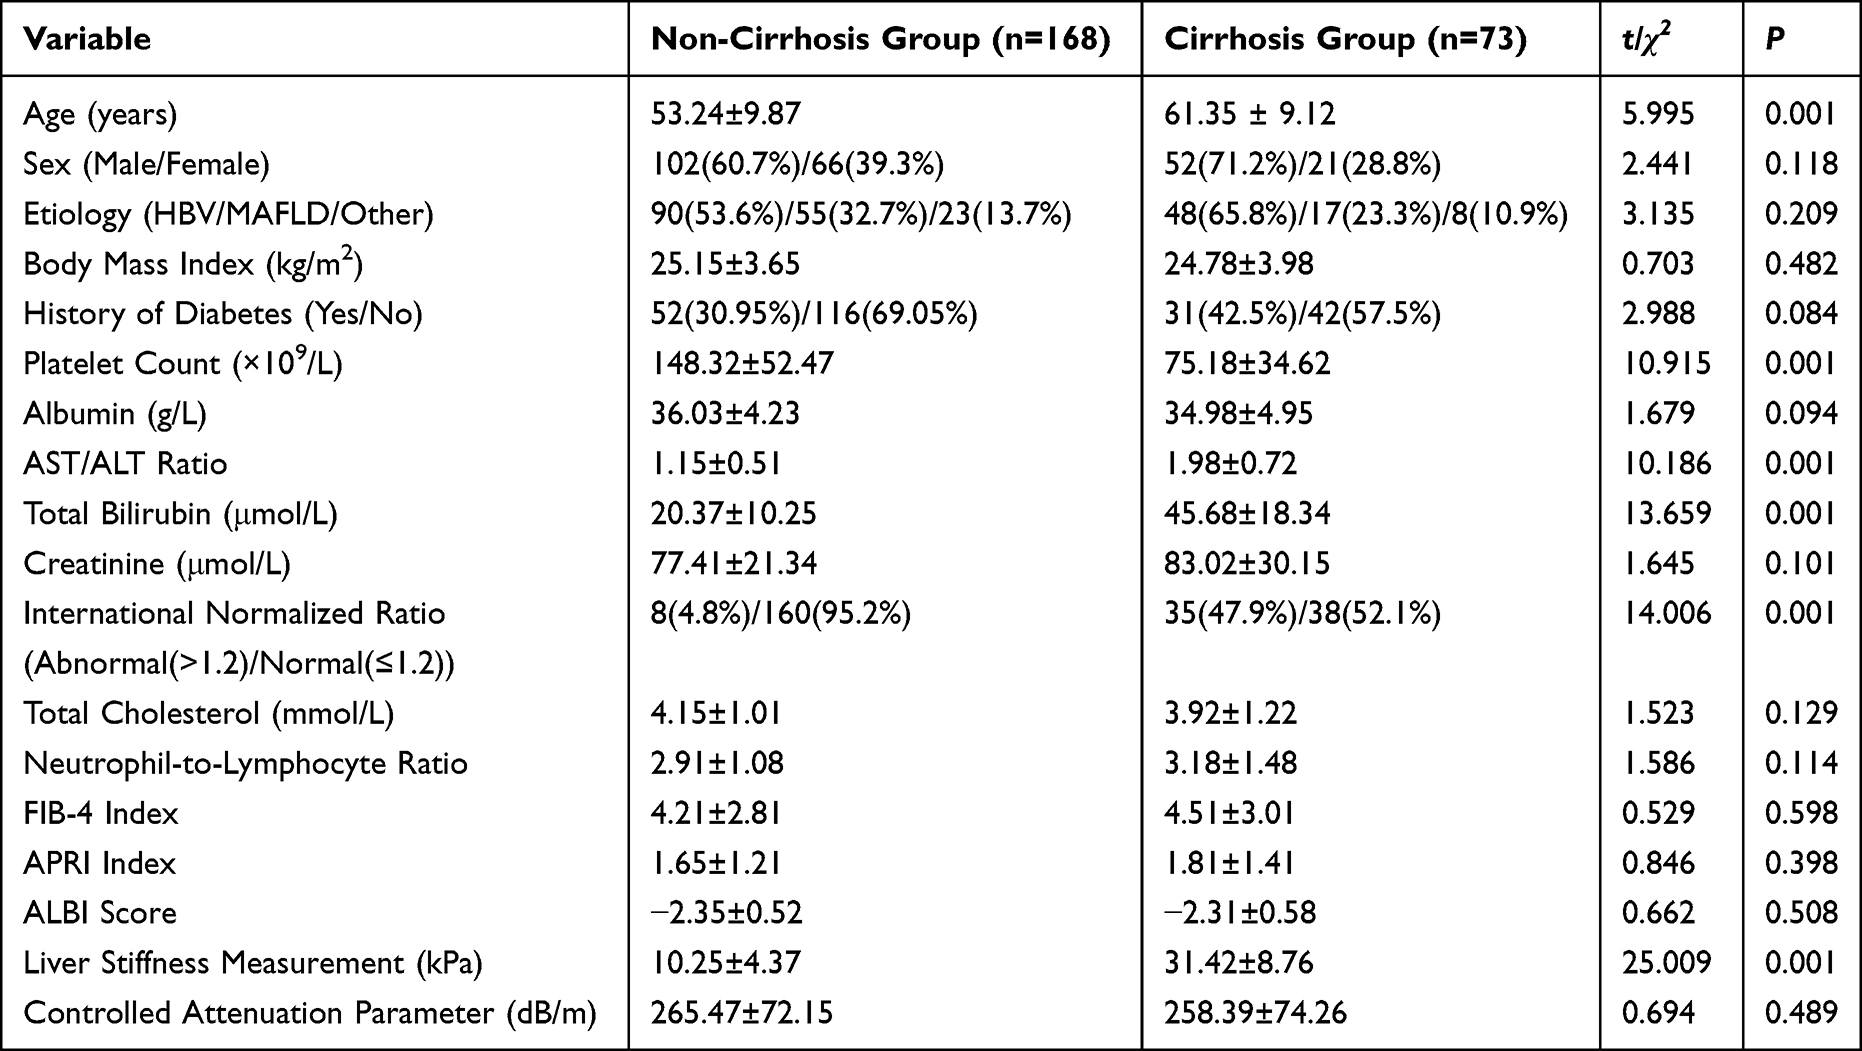 |
Table 2 Comparison of Baseline Characteristics in the Training Cohort by Cirrhosis Diagnosis |
Multivariate Logistic Regression Analysis of Factors Influencing the Cirrhosis Risk Prediction Model
Using the diagnosis of liver cirrhosis as the dependent variable (1=cirrhosis group, 0=non-cirrhosis group), all six statistically significant variables identified in the univariate analysis (age, platelet count, total bilirubin, AST/ALT ratio, international normalized ratio, and liver stiffness measurement) were subjected to variable selection via LASSO regression (Supplemental Table 1). Employing 10-fold cross-validation and the λ-1se criterion to select the optimal variables (Figure 1), all six predictors were ultimately retained and subsequently incorporated into a multivariate logistic regression model. The results of this multivariate logistic regression analysis confirmed that age, platelet count, total bilirubin, AST/ALT ratio, international normalized ratio, and liver stiffness measurement were independent influencing factors for liver cirrhosis (P<0.05) (Table 3).
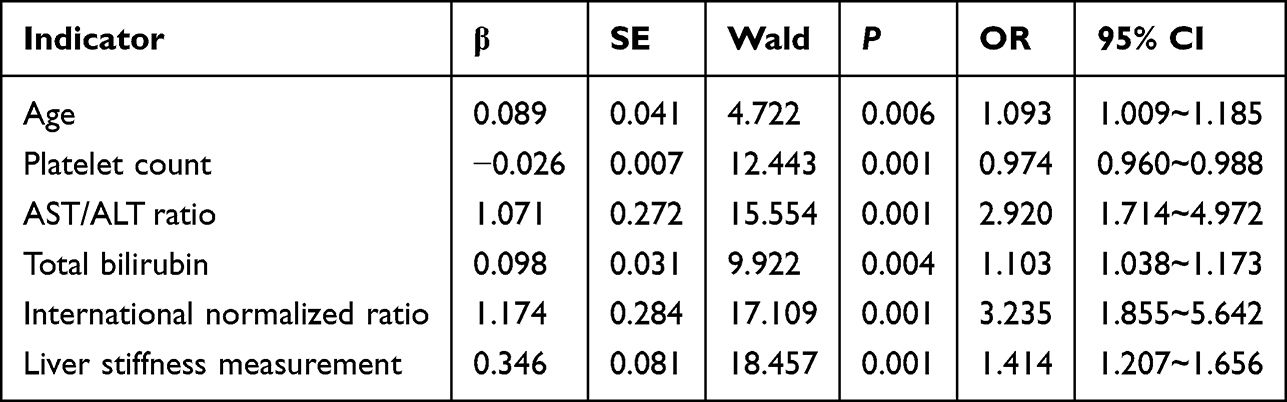 |
Table 3 Multivariate Logistic Regression Analysis of Factors Associated with Liver Cirrhosis |
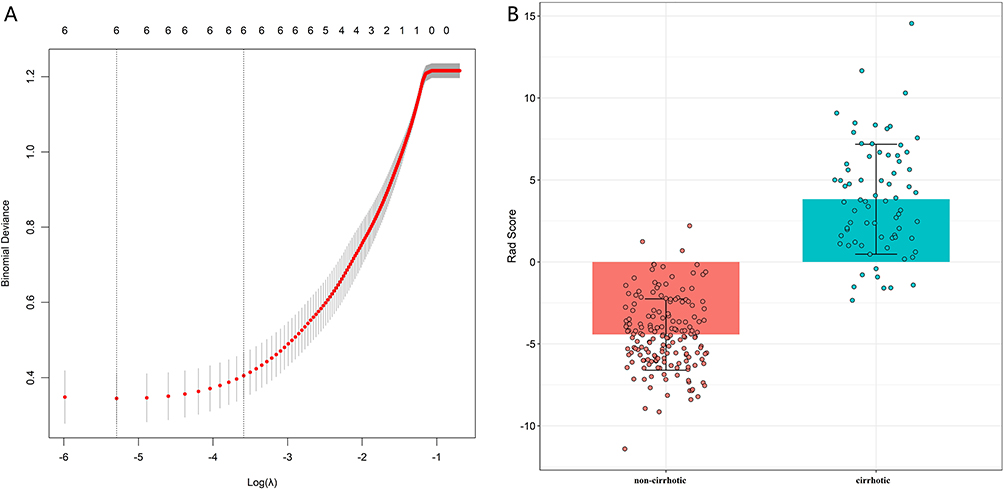 |
Figure 1 LASSO regression curve (A) and LASSO score difference comparison plot (B). |
Performance Evaluation of Machine Learning Models
To overcome the limitations of traditional logistic regression in capturing non-linear relationships between variables, this study further constructed three machine learning prediction models (Random Forest, Support Vector Machine, and Logistic Regression) based on the six key predictive variables identified through LASSO regression and multivariate logistic regression. Systematic comparison of model performance across both the training and validation cohorts is presented in Figure 2. The Random Forest model achieved the highest AUC of 0.835 (95% CI: 0.767–0.904) in the training set and maintained a similarly stable AUC of 0.745 (95% CI: 0.597–0.893) in the validation set. It slightly outperformed the logistic regression nomogram (AUC: 0.805/0.717) and the Support Vector Machine model (AUC: 0.792/0.702).
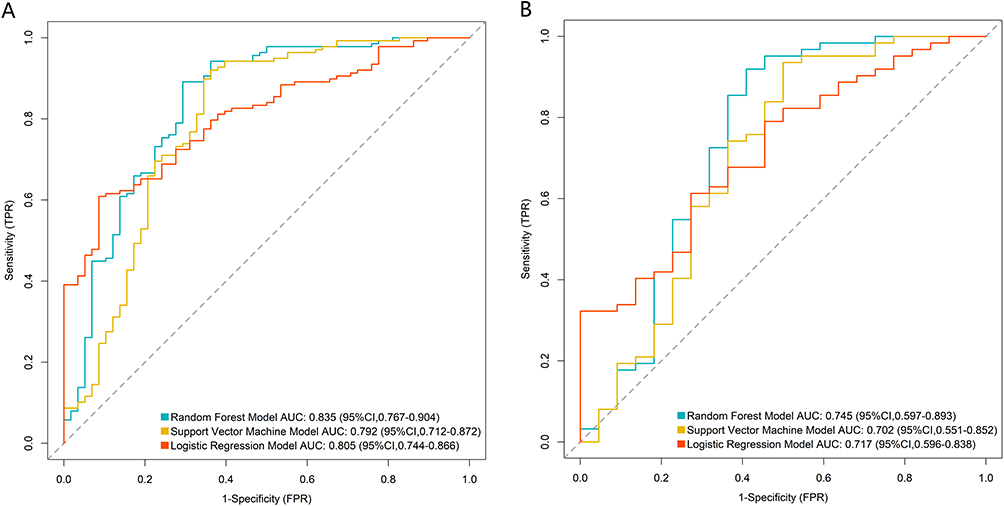 |
Figure 2 Receiver operating characteristic curves analysis of the machine learning models in the training (A) and validation (B) sets. |
Calibration curve analysis demonstrated that all three prediction models exhibited acceptable concordance between predicted probabilities and actual observed cirrhosis risks, with calibration curves generally approximating the ideal reference diagonal. Among them, the Random Forest model achieved the best calibration performance: its curve showed the closest fit to the diagonal line in both the training and validation sets, and the Hosmer-Lemeshow goodness-of-fit test yielded the highest non-significant P value (P > 0.05), indicating no statistically detectable deviation between predicted and actual risks. The Logistic Regression and Support Vector Machine models also showed favorable calibration, but with slightly larger deviations from the ideal diagonal compared with the Random Forest model (Figure 3). Furthermore, DCA (Figure 4) confirmed that the Random Forest model yielded the highest net clinical benefit across the threshold probability range of 0.1–0.3. Within this clinically relevant interval, the net benefit of the Random Forest model consistently and significantly exceeded the two extreme strategies of “screen all patients” and “screen none”, and was also superior to the Logistic Regression and Support Vector Machine models. This finding highlights the considerable clinical application value of the model for cirrhosis risk stratification.
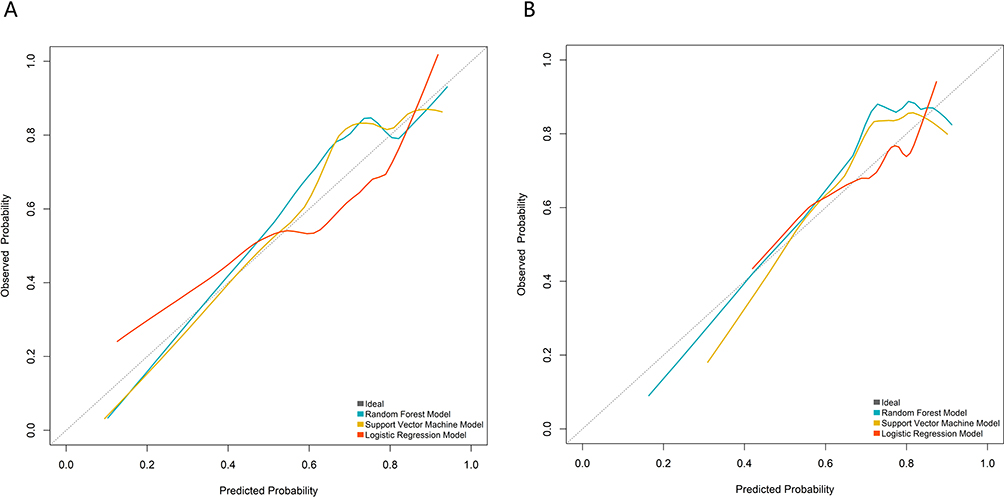 |
Figure 3 Calibration curves analysis of the machine learning models in the training (A) and validation (B) sets. |
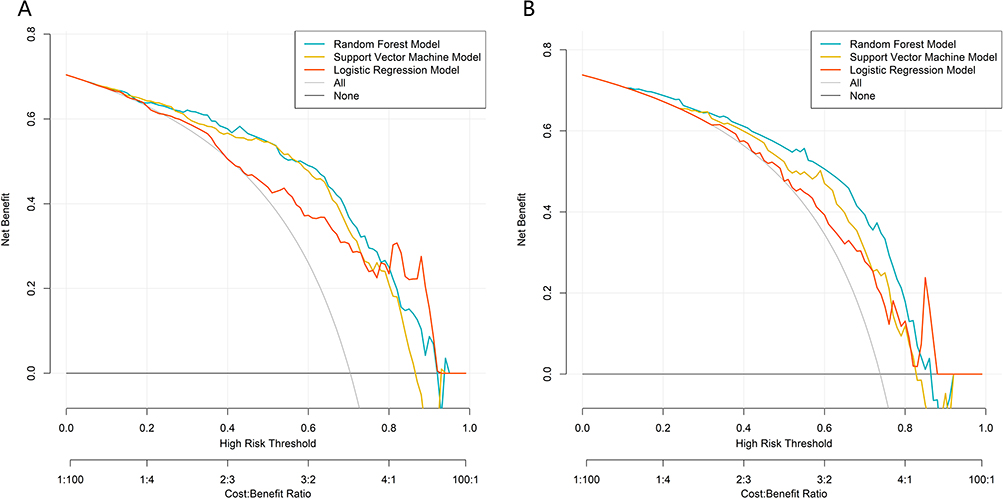 |
Figure 4 Clinical decision curve analysis of the prediction model in the training (A) and validation (B) sets. |
In summary, the Random Forest prediction model developed in this study, based on multidimensional indicators, demonstrates good predictive accuracy, calibration, and clinical applicability.
Interpretability Assessment of Model Predictions
Based on the six core predictive variables, we first constructed a traditional nomogram using multivariate logistic regression coefficients, which allows clinicians to calculate individual cirrhosis risk manually. We then developed a Random Forest model to capture potential non-linear relationships between variables and improve predictive accuracy. The nomogram (Figure 5A) visually displays the contribution of each clinical feature to cirrhosis risk based on logistic regression weights. As illustrated in Figure 5, this nomogram visually displays the magnitude and direction of each clinical feature’s contribution to cirrhosis risk. The model results indicate that age (X1), AST/ALT ratio (X3), total bilirubin (X4), international normalized ratio (X5), and liver stiffness measurement (X6) are independent risk factors for cirrhosis. An increase in their values significantly elevates cirrhosis risk. Conversely, platelet count (X2) serves as a protective factor, with higher values associated with decreased risk. SHAP analysis further quantified the relative importance of each feature. The order of influence, from greatest to least, was as follows: AST/ALT ratio (X3), platelet count (X2), international normalized ratio (X5), liver stiffness measurement (X6), age (X1), and total bilirubin (X4). Among these, the AST/ALT ratio, reflecting hepatocellular injury, and platelet count, indicative of portal hypertension, contributed most prominently to risk prediction. In contrast, the traditional liver function indicator total bilirubin, while also a risk factor, exhibited a relatively lower influence weight compared to direct markers of fibrosis and coagulation function.
 |
Figure 5 Model interpretability analysis: (A) nomogram, (B) SHAP feature importance plot. Note: X1: Age; X2: Platelet count; X3: AST/ALT ratio; X4: Total bilirubin; X5: International normalized ratio; X6: Liver stiffness measurement. |
Discussion
Cirrhosis represents the terminal stage of various chronic liver diseases. Early identification and precise risk stratification are crucial for improving patient prognosis and optimizing healthcare resource allocation.11 Current clinical practice, which relies on single non-invasive indicators or physician experience for risk assessment, suffers from insufficient accuracy and strong subjectivity. This study innovatively integrated routine laboratory indices, composite non-invasive scores, and imaging-based elastography parameters to successfully develop and validate a random forest model for individualized prediction of cirrhosis risk. The model demonstrated good and stable discriminatory performance in both the training and independent validation sets (with area under the receiver operating characteristic curve values of 0.835 and 0.745, respectively). Comparisons among three machine learning algorithms (logistic regression, Random Forest, and Support Vector Machine) ensured the robustness of the predictor variables and confirmed the optimal performance of the Random Forest model.
Furthermore, we conducted an in-depth interpretability analysis of the model by combining a nomogram with SHAP analysis. This approach not only quantified the relative importance of each predictor but also clarified the direction of its association with cirrhosis risk. Consequently, it provides a novel quantitative tool and theoretical basis for understanding the multifactorial mechanisms of cirrhosis development and achieving early clinical warning.
The six core predictors ultimately identified in this study encompass multiple dimensions, including liver injury, liver function, portal hypertension, and direct measurement of fibrosis. This comprehensive set reflects the complex pathophysiological process of cirrhosis.12 SHAP analysis showed that the AST/ALT ratio, representing the “hepatic inflammation and necrosis” dimension indicative of hepatocyte injury, and platelet count, representing the “hemodynamics” dimension reflecting portal hypertension, were the two most influential contributors to the model’s predictions.13 An elevated AST/ALT ratio often signals a pathological transition from hepatocyte injury to fibrosis progression, and its significance has been confirmed by numerous studies.14 Thrombocytopenia is a sensitive marker of hypersplenism and portal hypertension, and its predictive value holds a central position in various non-invasive scores for liver fibrosis.15 The high contribution of these two factors underscores the foundational role of persistent liver injury and secondary portal hypertension in the development and progression of cirrhosis.16
Notably, the international normalized ratio (INR), reflecting hepatic synthetic function, was identified as a key independent risk factor after being converted into a dichotomous variable (>1.2).17 An abnormal INR indicates a significant decline in the liver’s capacity to synthesize clotting factors, serving as an early and sensitive indicator of hepatic decompensation.18 This model confirmed that even a mild elevation in INR can significantly increase cirrhosis risk when other indicators remain within normal ranges. This finding emphasizes the unique value of coagulation function monitoring in early risk assessment.
Moreover, this model confirmed the predictive value of age as a non-modifiable risk factor. Advancing age is closely associated with prolonged duration of liver disease, cumulative injury, and diminished tissue repair capacity.19 Total bilirubin, a classic indicator for assessing hepatic metabolic and excretory function, directly reflects the decline in liver function when elevated.20 Liver stiffness measurement (LSM) obtained via vibration-controlled transient elastography, as a direct physical quantification of the degree of liver fibrosis, provided the most objective anatomical evidence for the model. Its inclusion substantially strengthened the biological plausibility of the model.21
Notably, the widely used non-invasive fibrosis scores (FIB-4, APRI, and ALBI) did not show significant differences between the cirrhosis and non-cirrhosis groups in our cohort, which differs from some previous studies. This unexpected finding may be explained by three key factors. First, our study population consisted of patients who had already been referred for transient elastography, indicating a higher pre-test probability of advanced fibrosis compared to the general population. This spectrum bias may have reduced the discriminative ability of traditional scores that were originally developed for population screening. Second, traditional indirect scores rely on surrogate markers of liver function and portal hypertension, whereas our model incorporates direct measurement of liver stiffness, which provides a more accurate quantification of fibrosis severity. Third, a significant proportion of patients in our cohort had compensated cirrhosis with preserved liver synthetic function, resulting in normal or near-normal values for the components of FIB-4, APRI, and ALBI. These findings highlight the limitations of relying solely on traditional indirect scores and underscore the value of integrating direct elastography measurements into risk assessment models.
Nomograms have been widely recognized as practical clinical tools for individualized risk prediction in various liver diseases, including predicting long-term survival in cirrhosis patients.22 The proposed risk prediction model can be easily implemented in routine clinical practice using readily available non-invasive parameters. Based on the model’s predicted probability, we recommend the following stratified management strategies:Low-risk group (predicted probability<0.1): Routine follow-up with liver function tests and transient elastography every 12–24 months. Continue etiological control measures as appropriate. Medium-risk group (predicted probability 0.1–0.3): Enhanced surveillance with liver function tests, complete blood count, and transient elastography every 6–12 months. Consider additional imaging evaluations (eg., abdominal ultrasound) to screen for early signs of portal hypertension. High-risk group (predicted probability > 0.3): Intensive monitoring with comprehensive assessments every 3–6 months, including evaluation for cirrhosis complications (eg., varices, ascites). Referral to a specialized hepatology clinic for individualized management and consideration of early intervention therapies. These stratified strategies can help optimize healthcare resource allocation by focusing intensive monitoring on patients at highest risk while reducing unnecessary testing for low-risk individuals.
The core methodological strength and novelty of this study lie in the organic integration and complementary use of traditional statistics and modern machine learning techniques, which addresses a critical gap in existing cirrhosis prediction models that often prioritize either accuracy or interpretability but not both. We first screened candidate variables through univariate analysis. Subsequently, multivariate logistic regression was employed to confirm the independent predictive value and hazard ratio of each variable after controlling for confounders, ensuring the statistical rigor and clinical interpretability of the model-building process. Finally, the random forest algorithm was used to construct the predictive model. Its capability to handle complex nonlinear relationships and high-dimensional interactions holds promise for achieving superior predictive accuracy compared to traditional logistic regression models. More importantly, this study applied the SHAP interpretability framework to elucidate the “black-box” machine learning model. This analysis not only objectively quantified the ranking of each feature’s contribution at a global level but also demonstrated the specific direction and magnitude of each feature’s impact on the prediction for individual cases. This “white-box” treatment significantly enhances clinicians’ understanding and trust in the model’s decision-making logic, representing a critical step towards translating predictive models from the laboratory to bedside clinical application.
This study has several limitations. First, as a retrospective, single-center study, although rigorous internal validation was performed, the generalizability of the model to broader populations, different etiologies of liver disease, and diverse healthcare settings requires validation through multicenter, prospective external cohorts. Second, our outcome definition integrated liver biopsy, imaging features, and clinical evidence of decompensation, which reflects real-world clinical practice but introduces potential heterogeneity. Patients diagnosed by imaging alone may have less advanced disease than those diagnosed by biopsy or decompensation. While we did not have sufficient sample size to perform a meaningful sensitivity analysis restricted to biopsy-proven cirrhosis in this study, we plan to address this issue in our upcoming multicenter validation study. Third, this study evaluated the model’s ability to identify prevalent cirrhosis at a single time point rather than predict the future development of cirrhosis in patients with chronic liver disease. Longitudinal follow-up data are needed to assess whether the model can accurately predict disease progression over time. Fourth, the model incorporated only baseline static variables and did not capture the dynamic trajectories of indicators such as LSM and platelet count over time. Such dynamic changes may contain important prognostic information. Future research could explore constructing dynamic prediction models that integrate time-series data. Finally, this study aimed to develop a general risk prediction model applicable to multiple common chronic liver diseases, without performing subgroup analyses for specific etiologies (eg., hepatitis B, MAFLD). The degree of portal hypertension, liver function impairment, and fibrosis progression rates vary significantly across different etiologies. For example, HBV-related cirrhosis often develops after decades of chronic inflammation, while MAFLD-related cirrhosis may progress more rapidly in patients with concurrent metabolic comorbidities. Therefore, the generalizability of our model to specific etiological subgroups requires further validation in large, multicenter cohorts, and developing etiology-specific refined models is an important direction for future research.
In conclusion, this study developed and validated a cirrhosis risk prediction model integrating multi-dimensional noninvasive clinical parameters. The Random Forest model exhibited favorable discrimination and calibration performance, while the logistic regression-based nomogram offered a clinically interpretable tool for bedside use. Markers of liver injury, hepatic synthetic function, portal hypertension, and direct fibrosis measurement were confirmed as independent contributors to cirrhosis risk stratification. This model may provide quantitative support for noninvasive cirrhosis screening and risk-stratified patient management. Further prospective multicenter validation is warranted to verify its generalizability and clinical utility.
Data Sharing Statement
The datasets used and/or analysed during the current study available from the corresponding author on reasonable request.
Ethics Approval and Consent to Participate
The study was approved by the Ethics Committee of The First Affiliated Hospital of Henan Medical University (No. 2025022154), and informed consent was obtained from all patients. This study was conducted in accordance with the Declaration of Helsinki.
Author Contributions
All authors made a significant contribution to the work reported, whether that is in the conception, study design, execution, acquisition of data, analysis and interpretation, or in all these areas; took part in drafting, revising or critically reviewing the article; gave final approval of the version to be published; have agreed on the journal to which the article has been submitted; and agree to be accountable for all aspects of the work.
Funding
This study received funding from the Henan Provincial Medical Science and Technology Key Projects Joint Construction Program Project (LHGJ20240481).
Disclosure
The authors declare that they have no competing interests in this work.
References
1. Wilson R, Williams DM. Cirrhosis. Med Clin North Am. 2022;106(3):437–11. doi:10.1016/j.mcna.2021.12.001
2. Man S, Deng Y, Ma Y, et al. Prevalence of liver steatosis and fibrosis in the general population and various high-risk populations: a nationwide study with 5.7 million adults in China. Gastroenterology. 2023;165(4):1025–1040. doi:10.1053/j.gastro.2023.05.053
3. Innes H, Morling JR, Buch S, et al. Performance of routine risk scores for predicting cirrhosis-related morbidity in the community. J Hepatol. 2022;77(2):365–376. doi:10.1016/j.jhep.2022.02.022
4. Zhang X, Wong GL, Yip TC, et al. Risk of liver-related events by age and diabetes duration in patients with diabetes and nonalcoholic fatty liver disease. Hepatology. 2022;76(5):1409–1422. doi:10.1002/hep.32476
5. Berzigotti A, Seijo S, Arena U, et al. Elastography, spleen size, and platelet count identify portal hypertension in patients with compensated cirrhosis. Gastroenterology. 2013;144(1):102–111.e101. doi:10.1053/j.gastro.2012.10.001
6. Zhang L, Bi X, Chen X, et al. A nomogram based on HBeAg,AST, and age to predict non-minimal liver inflammation in CHB patients with ALT <80 U/L. Front Immunol. 2022;13:1119124. doi:10.3389/fimmu.2022.1119124
7. Ding H, Ma JJ, Wang WP, et al. Assessment of liver fibrosis: the relationship between point shear wave elastography and quantitative histological analysis. J Gastroenterol Hepatol. 2015;30(3):553–558. doi:10.1111/jgh.12789
8. Strandberg R, Åberg F, Asteljoki JV, et al. Use of new CORE risk score to predict 10 year risk of liver cirrhosis in general population: population based cohort study. BMJ. 2025;390:e083182. doi:10.1136/bmj-2024-083182
9. Zheng T, Qu Y, Chen J, et al. Noninvasive diagnosis of liver cirrhosis: qualitative and quantitative imaging biomarkers. Abdom Radiol. 2024;49(6):2098–2115. doi:10.1007/s00261-024-04225-8
10. Balcar L, Semmler G, Pomej K, et al. Patterns of acute decompensation in hospitalized patients with cirrhosis and course of acute-on-chronic liver failure. United Eur Gastroenterol J. 2021;9(4):427–437. doi:10.1002/ueg2.12089
11. Han M, Xu J, Wu X, et al. Identification of serum MicroRNAs associated with hepatic immunoinflammatory injury in chronic hepatitis B: implications for non-invasive diagnosis. Front Immunol. 2025;16:1671149. doi:10.3389/fimmu.2025.1671149
12. Ding R, Zhou X, Huang D, et al. Nomogram for predicting advanced liver fibrosis and cirrhosis in patients with chronic liver disease. BMC Gastroenterol. 2021;21(1):190. doi:10.1186/s12876-021-01774-w
13. Zhao Y, Wang F, Zhang GY, et al. Evaluating the liver fibrosis and waist-to-height ratio(LFWHR) as a gallstone disease predictor: a nomogram model and SHAP analysis. Sci Rep. 2025;15(1):35189. doi:10.1038/s41598-025-19194-1
14. Liu H, Li H, Deng G, et al. Association of AST/ALT ratio with 90-day outcomes in patients with acute exacerbation of chronic liver disease: a prospective multicenter cohort study in China. Front Med Lausanne. 2024;11:1307901. doi:10.3389/fmed.2024.1307901
15. Gallo P, Terracciani F, Di Pasquale G, et al. Thrombocytopenia in chronic liver disease: physiopathology and new therapeutic strategies before invasive procedures. World J Gastroenterol. 2022;28(30):4061–4074. doi:10.3748/wjg.v28.i30.4061
16. Chen B, Ye B, Zhang J, et al. RDW to platelet ratio: a novel noninvasive index for predicting hepatic fibrosis and cirrhosis in chronic hepatitis B. PLoS One. 2013;8(7):e68780. doi:10.1371/journal.pone.0068780
17. Stravitz RT, Fontana RJ, Karvellas C, et al. Future directions in acute liver failure. Hepatology. 2023;78(4):1266–1289. doi:10.1097/hep.0000000000000458
18. Kalas MA, Chavez L, Leon M, et al. Abnormal liver enzymes: a review for clinicians. World J Hepatol. 2021;13(11):1688–1698. doi:10.4254/wjh.v13.i11.1688
19. Yang X, Li Q, Liu W, et al. Mesenchymal stromal cells in hepatic fibrosis/cirrhosis: from pathogenesis to treatment. Cell Mol Immunol. 2023;20(6):583–599. doi:10.1038/s41423-023-00983-5
20. Lee HA, Jung JY, Lee YS, et al. Direct bilirubin is more valuable than total bilirubin for predicting prognosis in patients with liver cirrhosis. Gut Liver. 2021;15(4):599–605. doi:10.5009/gnl20171
21. Gawrieh S, Vilar-Gomez E, Wilson LA, et al. Increases and decreases in liver stiffness measurement are independently associated with the risk of liver-related events in NAFLD. J Hepatol. 2024;81(4):600–608. doi:10.1016/j.jhep.2024.05.008
22. Zhu C, Li Y, Wang Z, et al. An RFH-NPT-based nomogram for predicting the long-term survival of liver cirrhosis patients: a multicenter study. Eur J Clin Nutr. 2026;80(1):87–95. doi:10.1038/s41430-025-01789-2
 © 2026 The Author(s). This work is published and licensed by Dove Medical Press Limited. The
full terms of this license are available at https://www.dovepress.com/terms
and incorporate the Creative Commons Attribution
- Non Commercial (unported, 4.0) License.
By accessing the work you hereby accept the Terms. Non-commercial uses of the work are permitted
without any further permission from Dove Medical Press Limited, provided the work is properly
attributed. For permission for commercial use of this work, please see paragraphs 4.2 and 5 of our Terms.
© 2026 The Author(s). This work is published and licensed by Dove Medical Press Limited. The
full terms of this license are available at https://www.dovepress.com/terms
and incorporate the Creative Commons Attribution
- Non Commercial (unported, 4.0) License.
By accessing the work you hereby accept the Terms. Non-commercial uses of the work are permitted
without any further permission from Dove Medical Press Limited, provided the work is properly
attributed. For permission for commercial use of this work, please see paragraphs 4.2 and 5 of our Terms.
Recommended articles

Predicting the Risk of Unplanned Readmission at 30 Days After PCI: Development and Validation of a New Predictive Nomogram
Xu W, Tu H, Xiong X, Peng Y, Cheng T
Clinical Interventions in Aging 2022, 17:1013-1023
Published Date: 5 July 2022
Development and Validation of a Nomogram for Predicting 28-Day Mortality on Admission in Elderly Patients with Severe Community-Acquired Pneumonia
Song Y, Wang X, Lang K, Wei T, Luo J, Song Y, Yang D
Journal of Inflammation Research 2022, 15:4149-4158
Published Date: 21 July 2022

Development and Validation of a Prediction Model for Chronic Post-Surgical Pain After Thoracic Surgery in Elderly Patients: A Retrospective Cohort Study
Wu XD, Zeng FF, Yu XX, Yang PP, Wu JP, Xv P, Wang HT, Pei YM
Journal of Pain Research 2022, 15:3079-3091
Published Date: 29 September 2022
Clinical Analysis and Prognostic Prediction Model for Patients with Uterine Leiomyosarcoma at FIGO Stage I
Chen S, Deng Y, Zhai Y, Zhan Y, Li X, Wang J, Bai H
International Journal of Women's Health 2023, 15:545-557
Published Date: 11 April 2023
Risk Factors for Granulomatous Mastitis and Establishment and Validation of a Clinical Prediction Model (Nomogram)
Zeng Y, Zhang D, Fu N, Zhao W, Huang Q, Cui J, Chen Y, Liu Z, Zhang X, Zhang S, Mansoor KM
Risk Management and Healthcare Policy 2023, 16:2209-2222
Published Date: 20 October 2023