Back to Journals » Journal of Inflammation Research » Volume 18
The Intestinal Immune Network for IgA Production is Involved in the Development and Progression of Sepsis: A Multi-Omics Study
Authors Wang YF ![]() , Gao S
, Gao S ![]() , Gao F, Wu ML, Yang L
, Gao F, Wu ML, Yang L ![]() , Zhang JY
, Zhang JY ![]() , Wang YN
, Wang YN ![]() , Xu HY
, Xu HY ![]()
Received 8 July 2025
Accepted for publication 3 November 2025
Published 13 November 2025 Volume 2025:18 Pages 15887—15910
DOI https://doi.org/10.2147/JIR.S548786
Checked for plagiarism Yes
Review by Single anonymous peer review
Peer reviewer comments 2
Editor who approved publication: Dr Rongxue Wu
Yi-Feng Wang,1,* Song Gao,2,* Fei Gao,1 Mei-Li Wu,3 Lan Yang,1 Jia-Yue Zhang,1 Ya-Nan Wang,4 Hong‑Yang Xu1
1Department of Critical Care Medicine, The Affiliated Wuxi People’s Hospital of Nanjing Medical University, Wuxi People’s Hospital, Wuxi Medical Center, Nanjing Medical University, Wuxi, Jiangsu, People’s Republic of China; 2Department of Critical Care Medicine, Xishan People’s Hospital of Wuxi City, Wuxi, Jiangsu, People’s Republic of China; 3Center of Clinical Research, The Affiliated Wuxi People’s Hospital of Nanjing Medical University, Wuxi People’s Hospital, Wuxi Medical Center, Nanjing Medical University, Wuxi, Jiangsu, People’s Republic of China; 4Department of Gastroenterology, Henan Provincial People’s Hospital, Zhengzhou, Henan, People’s Republic of China
*These authors contributed equally to this work
Correspondence: Hong‑Yang Xu, Email [email protected] Ya-Nan Wang, Email [email protected]
Introduction: Intestinal barrier injury plays a significant role in the development and progression of sepsis. However, the underlying mechanisms remain unclear.
Methods: The “intestinal immune network for IgA production” pathway (KEGG ID: hsa04672) is closely associated with the intestinal barrier. This study integrated bulk and single-cell RNA sequencing data, a clinical trial, an animal study and Mendelian randomization (MR) analyses to elucidate the role of hsa04672 during sepsis.
Results: Enrichment analyses confirmed the relationship between hsa04672 and sepsis. Four machine learning algorithms identified HLA-DPA1 (area under the curve [AUC] = 0.995), ITGB7 (AUC = 0.967), and CXCR4 (AUC = 0.942) as hsa04672-associated diagnostic biomarkers. Gene Set Variation Analysis (GSVA) revealed suppressed activity of hsa04672 in sepsis patients. Two independent methods (GSVA scores and consensus clustering) generated hsa04672-associated sepsis subgroups. Kaplan-Meier analyses subsequently confirmed significant survival differences between these subgroups, indicating a relationship between hsa04672 and sepsis prognosis. Afterwards, univariable Cox, LASSO, and multivariable Cox regression analyses identified ANKRD55, CX3CR1, and GIMAP4 as hsa04672-associated prognostic biomarkers. Based on these prognostic biomarkers, we constructed a nomogram model, whose accuracy and robustness were demonstrated through calibration curves, decision curve analyses, and time-dependent ROC curves. In the animal study, reduced intestinal IgA production was observed in severe sepsis. Single-cell analyses revealed the activities of hsa04672 and the expression patterns of biomarkers within each immune cell type across healthy controls, sepsis survivors, and sepsis nonsurvivors. MR analyses suggested that elevated CXCR4 expression was a risk factor of sepsis (OR = 1.27, 95% CI: 1.02– 1.58, P = 0.036), and decreased GIMAP4 expression was a risk factor of 28-day death in sepsis (OR = 0.76, 95% CI: 0.60– 0.98, P = 0.032).
Conclusion: The “intestinal immune network for IgA production” is deeply involved in the development and progression of sepsis.
Keywords: Sepsis, intestinal immune network for IgA production, biomarker, nomogram model, single-cell RNA sequencing, mendelian randomization
Introduction
Sepsis is a life-threatening condition caused by an overactive immune response to infection.1 Because of its high mortality rate and substantial economic and social burdens, sepsis has become a major global public health issue.2 With its high heterogeneous, sepsis can be caused by various pathogens from different infection sites, which compromises the ability to apply research findings from specific sepsis models to all conditions.3,4 Therefore, it is vital to find the universal mechanisms that contribute to all subgroups of sepsis.
The intestinal barrier is a complex body system consisting of mucosal, microbial, and immune barriers. All the components of intestinal barrier collaborate to facilitate nutrient absorption from the intestinal lumen while block bacteria, toxins, and other harmful substances from entering the intestinal tissue or bloodstream.5 Previous studies have confirmed that intestinal barrier injury plays a critical role in sepsis progression across different experimental and clinical models. In murine models of polymicrobial sepsis (induced by cecal ligation and puncture, CLP), intestinal barrier injury causes bacterial translocation, systemic inflammation, and multi-organ failure, leading to increased mortality.6,7 In endotoxemia models (induced by lipopolysaccharide [LPS] challenge), intestinal hyperpermeability is driven primarily by Toll-like receptor 4 mediated disruption of tight junctions.8,9 Clinically, sepsis patients with elevated biomarkers of intestinal barrier injury (plasma I-FABP, citrulline) exhibit higher organ failure scores and mortality.10 Taken together, intestinal barrier injury is not exclusive to intestinal origin sepsis but is a common feature of most types of sepsis. The impaired intestinal barrier allows intestinal contents to cross the intestinal barrier and enter the bloodstream lymphatic system, or peritoneal cavity, leading to enterogenic infections, systemic inflammatory responses, immune dysregulation, and multiple organ dysfunction syndrome.11–13 Given the complexity of intestinal barrier, it is essential to identify its specific component that significantly contributes to the development and progression of sepsis.
In this study, we employed bulk and single-cell RNA sequencing data from Gene Expression Omnibus (GEO, https://www.ncbi.nlm.nih.gov/geo/), and genome-wide association studies (GWAS) data from the “IEU OpenGWAS Project” (https://gwas.mrcieu.ac.uk/), conducted an animal study and a clinical trial to clarify the role of a specific pathway closely related to intestinal barrier function during sepsis. Then based on this targeted pathway, we identified valuable biomarkers for the diagnosis and prognosis of sepsis, constructed a prognostic nomogram model, and investigated the causal relationships between biomarkers and sepsis. Figure 1 shows the flowchart of this study.
 |
Figure 1 The flowchart of this study. Abbreviations: DEGs, differentially expressed genes; GSEA, gene set enrichment analysis; GO, gene ontology; KEGG, kyoto encyclopedia of genes and genomes; Hsa04672, the KEGG identifier for the “intestinal immune network for IgA production” pathway; XGBoost, eXtreme gradient boosting; RF, random forest; GMM, gaussian mixture mo SVM-RFE, support vector machine recursive feature elimination; GSVA, gene set variation analysis; MR, Mendelian randomization. |
Methods
Analysis of Bulk RNA Sequencing Data
Data Source
Five bulk RNA sequencing datasets were obtained from GEO, including one training dataset (GSE65682) and four validation datasets (GSE57065, GSE95233, GSE131761, and GSE134347). Prognosis information regarding 28-day survival status and specific survival time was available in the training dataset, but not in the validation datasets. The details of these datasets can be found in Table S1.
Differential Expression Analysis and Enrichment Analysis
In this study, the “limma” package (version 3.58.1) was used to perform differential expression analysis, and the criteria for identifying differentially expressed genes (DEGs) were |log2 Fold Change| ≥ 0.58 and adjusted P-value < 0.05.14 The DEGs between sepsis patients and healthy controls were labeled “Diagnosis-DEGs”, highlighting their potential role in sepsis diagnosis. Then Gene Set Enrichment Analysis (GSEA), Gene Ontology (GO) annotation, and Kyoto Encyclopedia of Genes and Genomes (KEGG) pathway enrichment analysis were conducted using the “clusterProfiler” package (version 4.10.1) to elucidate the biological mechanisms and signaling pathways implicated in sepsis pathogenesis.15 Besides, the “circlize” package (version 0.4.16) was used to visualize gene chromosome localization,16 and the “pathview” package (version 1.40.0) was used to illustrate the gene expression patterns in the targeted KEGG pathway (Supplementary material. KEGG permission letter).17
Machine Learning Algorithms and Diagnostic Biomarkers
Four machine learning algorithms were implemented for hub gene identification: eXtreme Gradient Boosting (XGBoost), Random Forest (RF), Gaussian Mixture Model (GMM), and Support Vector Machine Recursive Feature Elimination (SVM-RFE). (i) XGBoost: Implemented via the ”xgboost” package (version 1.7.8.1), this gradient boosting framework constructed additive decision trees through gradient-based boosting iterations (eta=0.1), with L2 regularization (lambda=0.5) and minimum loss reduction (gamma=0.3) to control model complexity.18 (ii) RF: Implemented via the ”randomForest” package (version 4.7–1.1), 500 decorrelated decision trees were generated using bootstrap aggregating, with feature importance quantified through mean decrease Gini index.19 (iii) GMM: Implemented via the ”SimDesign” package (version 2.18), gene expression patterns were modeled as probabilistic mixtures of multivariate Gaussian distributions (n_components = 3), optimized via expectation-maximization algorithm (convergence threshold = 1e-5).20 (iv) SVM-RFE: Implemented via the ”e1071” package (version 1.7–16), linear kernel SVM classifiers were recursively trained (C = 1.0), eliminating 10% of features with minimal absolute weight coefficients per iteration until achieving optimal feature subset.21 Then the overlapping gene sets identified by machine learning algorithms were regarded as the biomarkers for sepsis diagnosis. Their diagnostic values were assessed by the receiver operating characteristic (ROC) curve and its area under the curve (AUC).
Gene Set Variation Analysis (GSVA)
GSVA was performed using the “GSVA” package (version 1.50.5) and the GSVA scores were used to quantify pathway activation states.22 Then the GSVA scores of the targeted pathway were compared between sepsis patients and healthy controls. According to the GSVA scores, sepsis patients were divided into high-score and low-score subgroups. The optimal cutoff for GSVA scores was determined using the “survminer” package (version 0.4.9). Kaplan-Meier (K-M) survival analysis was conducted to compare the outcomes between subgroups. Differential expression analysis was performed between high-score and low-score subgroups and the DEGs were identified as “GSVA-DEGs”.
Consensus Clustering
Consensus clustering analysis was conducted using the “ConsensusClusterPlus” package (version 1.66.0) with PAM clustering and Canberra distance.23 Sepsis patients were divided into two subgroups (Cluster1 and Cluster2). Principal component analysis (PCA) was performed to show separation of subgroups. K-M survival analysis was conducted to compare the outcomes between subgroups. Differential expression analysis was performed between Cluster1 and Cluster2 and the DEGs were identified as “Clustering-DEGs”.
Prognostic Biomarkers and Nomogram Model
Univariable Cox regression analysis was performed to identify genes associated with sepsis prognosis as “Uni-Cox genes”. Then the intersection of Clustering-DEGs, GSVA-DEGs, Uni-Cox genes and Diagnosis-DEGs was obtained.
Next, LASSO regression through 10-fold cross-validation were performed using the “glmnet” package (version 4.1–8). The optimal regularization parameter (lambda) was determined by minimizing the partial likelihood deviance, with genes retaining non-zero coefficients at the selected lambda value subsequently designated as candidate biomarkers for prognostic model construction.24 Afterwards, multivariable Cox regression analysis was performed with backward stepwise selection (α = 0.05 for variable retention) to identify prognostic biomarkers. These biomarkers were subsequently incorporated into a prognostic nomogram model. The model’s predictive performance was evaluated through three distinct methodologies: calibration curve assessing prediction accuracy, decision curve analysis (DCA) quantifying clinical utility, and time-dependent ROC measuring discriminative capacity across temporal intervals.
Protein-Protein Interaction (PPI)
PPI networks of biomarkers were generated using two online databases. The GeneMANIA algorithm (http://www.genemania.org) was used to generated a PPI network incorporating both biomarkers and their functionally related partners. The STRING database (http://www.string-db.org/) was used to construct a PPI network of biomarkers with an edge confidence > 0.15.
Transcription Factor (TF)-mRNA Network
The interactions between TF and biomarkers were obtained from the ChIPBase database (https://rnasysu.com/chipbase3/). Customized download links were programmatically generated in R for each biomarker, specifying hg38 genome assembly, 1kb upstream/downstream regulatory regions, and motif-validated interactions. High-confidence interactions (total samples >15) were retained to construct an edge list. Final TF-mRNA network was visualized with Cytoscape (version 3.10.2).
CeRNA (Competing Endogenous RNA) Regulatory Network
The ceRNA regulatory network was constructed using data from the ENCORI database (https://rnasysu.com/encori/). For miRNA-mRNA interactions, R automatically generated ENCORI API links (hg38 assembly, mRNA type, Clip-seq support ≥1) to download targeting relationships of biomarkers. High-confidence interactions (pancancerNum > 6) were retained to build an mRNA-miRNA edge list. Next, identified miRNAs were queried against lncRNA targets (hg38, lncRNA type, interaction support ≥1). Interactions with pancancerNum exceeding 11 were filtered to create miRNA-lncRNA edges. Final ceRNA regulatory network was visualized with Cytoscape (version 3.10.2).
Clinical Trial
Study Population
The clinical trial was approved by Medical Ethics Committee of The Affiliated Wuxi People’s Hospital of Nanjing Medical University (Approval No. KY24180) and was prospectively registered at the Chinese Clinical Trial Register (Registration No. ChiCTR2400094241; 19/12/2024). This study complied with the Declaration of Helsinki. Ten sepsis patients (diagnosed per Sepsis-3 criteria25) and ten healthy controls were included in this study. Details regarding the inclusion and exclusion criteria are provided in Table S2. All healthy controls provided written informed consent directly. For sedated sepsis patients lacking decision-making capacity, consent was obtained through legally authorized representatives. Blood samples of sepsis patients were collected within 24 hours after ICU admission; Blood samples of healthy controls were collected during sampling for medical examination. The expression levels of biomarkers were measured using real-time quantitative polymerase chain reaction (RT-qPCR).
RT-qPCR
Total RNA was extracted using the Spin Column Blood Total RNA Purification Kit (Sangon Biotech, China). It was then reverse-transcribed into cDNA using the PrimeScript™ RT Master Mix (Perfect Real Time) (TAKARA, Japan, RR036A). Next, RT-qPCR was conducted using the TB Green Premix Ex Taq II (Tli RNaseH Plus) (TAKARA, Japan RR820A). The primer sequences can be found in Table S3. The experiment included three technical replicates, and the relative mRNA expression levels were calculated using the 2−ΔΔCT method, with GAPDH as the internal reference.26
Animal Study
Establishment of Sepsis Mouse Model
Male C57BL/6J mice at 8 weeks of age and weighing 20–25 g (Jiangsu Huachuang Sino Pharma Tech Could) were acclimatized for one week prior to the experiment under controlled conditions: room temperature of 23–25 °C, humidity of 50–60%, and a 12-hour light/dark cycle in the SPF-level animal room. LPS (Escherichia coli 055:B5, Sigma-Aldrich) was dissolved in sterile phosphate buffered saline (PBS), and the sepsis mouse model was established by intraperitoneal injection of LPS. A total of 15 mice were randomly assigned to three groups (n = 5/group) using computer-generated randomization. Mice in the mild sepsis group were given 10 mg/kg body weight of LPS, and mice in the severe sepsis group were given 20 mg/kg body weight of LPS.27 Mice in the control group were given an equivalent volume of PBS to ensure comparability with the LPS-injected group. After LPS injection, the clinical symptoms of sepsis in mice were monitored every 6 hours, including lethargy, piloerection, and reduced mobility. 24 hours after intraperitoneal LPS administration, mice were euthanized with an overdose of sodium pentobarbital (100 mg/kg, P3761, Sigma-Aldrich) under 3% isoflurane anesthesia. Death was confirmed by absence of corneal reflexes and bilateral thoracotomy. Ileal tissues were immediately excised and luminal contents were cleared with ice-cold PBS perfusion. This animal study was approved by the Institutional Animal Care and Use Committee of The Affiliated Wuxi People’s Hospital of Nanjing Medical University (Approval No. DL2020001) and conducted in accordance with the Guide for the Care and Use of Laboratory Animals of the National Institutes of Health (8th edition).
Immunohistochemical Analysis of IgA in the Ileum
The ileum tissues were fixed in 4% paraformaldehyde for 24 hours, then dehydrated in graded ethanol, and embedded in paraffin. Sections of 4 µm thickness were cut with a microtome, mounted on glass slides, and baked at 60°C for 50 minutes. For immunohistochemistry, tissue sections underwent deparaffinization and rehydration, followed by antigen retrieval with citrate buffer (pH 6.0) at 95 °C for 20 minutes then cooled naturally. The activity of endogenous peroxidase was inhibited using 3% hydrogen peroxide for 10 minutes. The sections were incubated overnight at 4 °C with a primary antibody against IgA (MAB12771, Abnova). After washing, the sections were incubated with a horseradish peroxidase-conjugated secondary antibody at room temperature for 1 hour. Diaminobenzidine was used as the chromogen, and sections were counterstained with hematoxylin. Stained sections were observed with a light microscope, and images were taken with a digital camera.28
Analysis of Single-Cell RNA Sequencing Data
Data Source
GSE167363 was a single-cell RNA sequencing dataset of peripheral blood mononuclear cells obtained from GEO. This study included two healthy controls, three sepsis survivors, and two sepsis nonsurvivors, excluding any repeated sampling data.
Quality Control
The “Seurat” package (version 5.1.0, https://satijalab.org/seurat/) was used to process the single-cell RNA sequencing data. To ensure data quality, cells with counts from 200 to 10000, feature > 200, log10GenesPerUMI > 0.8, and mitochondrial percentages < 20% were included, then the cell cycle processing was performed. Afterwards, doublets cells were identified and removed using the “scDblFinder” package (version 1.16.0), the batch effect was removed by the “harmony” package (version 1.2.1).
Cell Annotation and Visualization
After quality control, the Uniform Manifold Approximation and Projection (UMAP) was used for the dimensionality reduction and visualization. Next, cells were clustered with a resolution of 1.0 using unsupervised clustering, and annotated using ScType and “HGNChelper” packages (version 0.8.14). Additionally, gene set enrichment analysis was conducted using the “AUCell” package (version 1.24.0). At last, the “Seurat” and “ggplot2” package (version 3.5.1) were used to generate dot plots for the visualization of gene set enrichment scores as well as the expression patterns of biomarkers in the single-cell level.
Mendelian Randomization (MR) Analysis
Data Source
The GWAS data for MR analysis were obtained from the “IEU OpenGWAS Project”, and no further ethical approval was required. The details of the data source for the MR analysis are presented in Table S4.
Study Design
MR analysis is a robust mothed that reveals unbiased causal relationships between potential exposures and specific outcomes. It utilizes genetic variants, the single nucleotide polymorphisms (SNPs), as instrumental variables (IVs). This method effectively addresses the inherent limitations of observational studies.29 In this study, the exposures were expression levels of biomarkers, and the outcomes were the risk of sepsis and 28-day death in sepsis, the causal relationships between exposures and outcomes were investigated by the two-sample MR analysis using the “TwoSampleMR” package (version 0.6.8), following the guideline of the STROBE-MR Statement.30
IVs Selection
Three key assumptions need to be considered during the selection of SNPs. (i) SNPs must be strongly associated with the exposure. (ii) SNPs must be independent of any confounders that could influence the relationship between exposure and outcome. (iii) SNPs should affect the outcome solely through their direct impact on the exposure, without involving other pathways.31 The clumping procedure was used to avoid linkage disequilibrium among the included SNPs, with parameters set at r2 = 0.001 and a clump window of 10,000 kb. To secure an adequate number of SNPs, the selection threshold was set at p < 1×10−5.31 During the harmonization procedure, non-concordant and palindromic alleles were removed. To minimize potential biases, only SNPs that generated an F-statistic > 10 were accepted.32
MR and Sensitivity Analysis
This MR analysis employed four complementary approaches: (i) The inverse-variance weighted (IVW) method, serving as primary analysis under the assumption of balanced pleiotropy, which aggregates Wald ratio estimates through variance-weighted meta-analysis; (ii) The weighted median estimator, providing consistent causal estimates when more than 50% of IVs satisfy valid instrument assumptions; (iii) MR Egger regression, incorporating an intercept term to detect directional pleiotropy while generating pleiotropy-adjusted effect estimates; (iv) The weighted mode-based approach, which identifies the clustered genetic variants exhibiting congruent causal effects through density-weighted modal estimation, demonstrating particular robustness to heterogeneous pleiotropic effects.33 The conclusions of the MR study mainly considered the results of IVW method due to its slightly greater power.34
In addition, four visualization methods were used in this MR study: (i) Forest plots displayed individual and pooled IV estimates with 95% confidence intervals, allowing assessment of effect heterogeneity; (ii) Scatter plots illustrated SNP-exposure (x-axis) versus SNP-outcome (y-axis) associations with fitted regression lines, visually demonstrating core MR assumptions; (iii) Leave-one-out analysis systematically excluded each IV to evaluate result stability and identify influential variants; (iv) Funnel plots, plotting effect sizes against precision, detected potential directional pleiotropy through asymmetry.
Sensitivity analyses were performed to enhance the stability and reliability of this MR study. The heterogeneity among IVs was assessed by Cochran’s Q test.35 The horizontal pleiotropy was evaluated by the MR Egger intercept test.36 Moreover, the direction of causal relationship was confirmed depend on the correlations between SNPs and exposures/outcomes.
Statistical Analysis
The data processing, statistical analysis and visualization were conducted utilizing R language (version 4.3.3) and Xiantao (https://www.xiantaozi.com/). Wilcoxon test was used for the comparisons between two groups. P < 0.05 was considered statistically significant. ***P < 0.001; **P < 0.01; *P < 0.05.
Results
Diagnosis-DEGs and the Intestinal Immune Network for IgA Production (hsa04672)
First, we performed differential expression analysis between 475 sepsis patients (104 with community-acquired pneumonia, 77 with hospital-acquired pneumonia, and 294 with other origins) and 42 healthy controls in the training dataset GSE65682. A total of 2645 DEGs were identified, including 1189 upregulated genes and 1456 downregulated genes (Figure 2A). In the following study, we referred to these DEGs as “Diagnosis-DEGs”. Next, we conducted GSEA, GO, and KEGG enrichment analyses to identify potential mechanisms and pathways associated with sepsis (Figure 2B–F). Among the results of enrichment analyses, the “intestinal immune network for IgA production” (hsa04672) was closely related to the intestinal barrier. Then we displayed the chromosome localization of hsa04672-associated genes (Figure 3A). Using the hsa04672 pathway diagram from KEGG, we showed the expression patterns of hsa04672-associated genes in sepsis patients (Figure 3B).
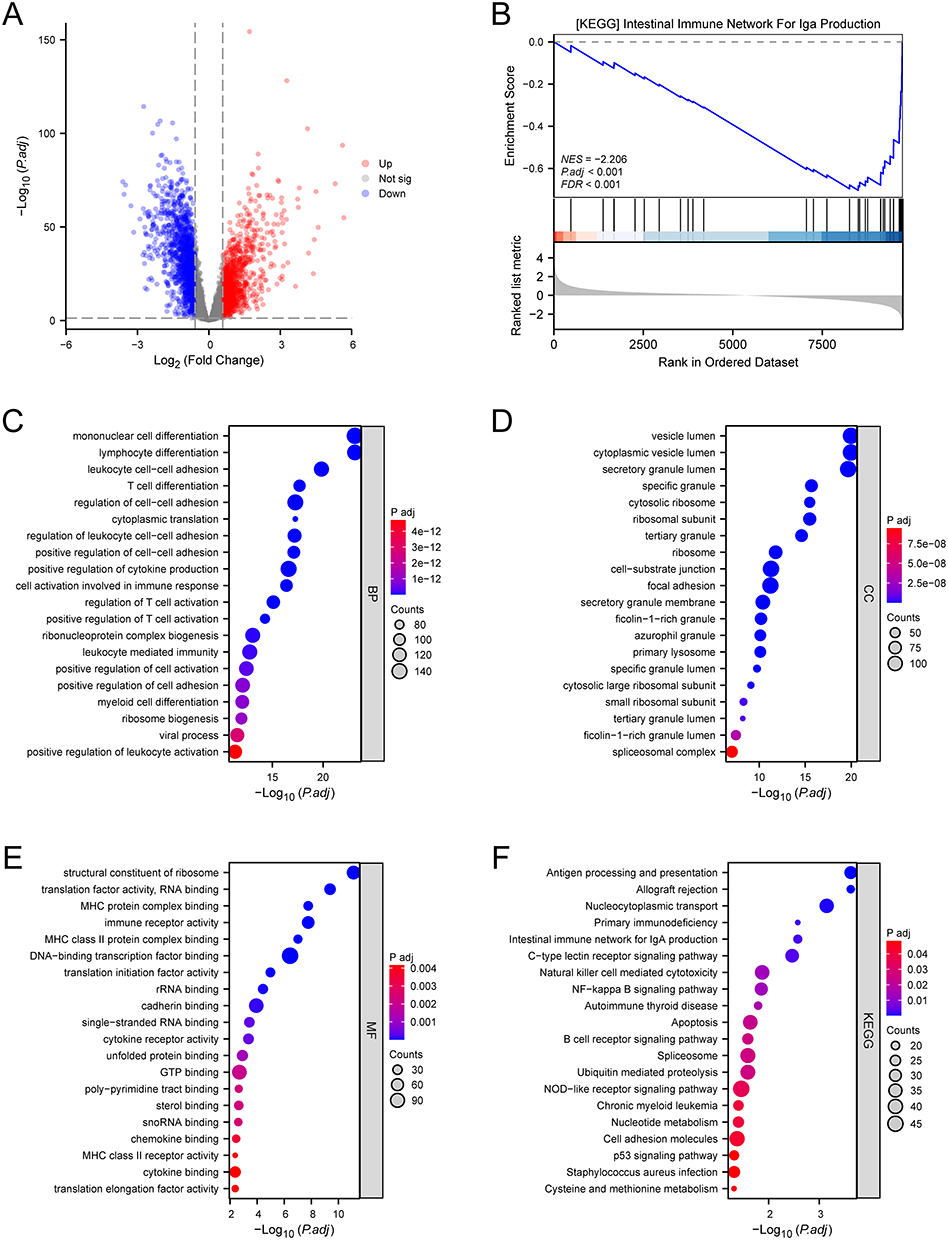 |
Figure 2 DEGs and enrichment analyses. (A) the volcano plot illustrated the DEGs between sepsis patients and healthy controls. (B) GSEA result of the hsa04672 pathway. (C) GO-BP annotation. (D) GO-CC annotation. (E) GO-MF annotation. (F) KEGG pathway enrichment analysis. Abbreviations: DEGs, differentially expressed genes; GSEA, gene set enrichment analysis; hsa04672, the KEGG identifier for the “intestinal immune network for IgA production” pathway; GO, gene ontology; BP, biological process; CC, cellular component; MF, molecular function; KEGG, kyoto encyclopedia of genes and genomes; P.adj, adjusted P value; NES, normalized enrichment score; FDR, false discovery rate. |
 |
Figure 3 The hsa04672 pathway. (A) the chromosomal localization of hsa04672-associated genes. (B) the expression patterns of hsa04672-associated genes in sepsis patients showed in the KEGG pathway diagram. (C) the intersection of diagnosis-DEGs and hsa04672-associated genes. Abbreviations: Hsa04672, the KEGG identifier for the “intestinal immune network for IgA production” pathway; DEGs, differentially expressed genes; KEGG, kyoto encyclopedia of genes and genomes. |
In the following study, we investigated the role of hsa04672 pathway and its associated genes in the development and progression of sepsis.
Hsa04672 and the Diagnosis of Sepsis
To estimate the role of hsa04672-associated genes in sepsis diagnosis, we preselected 19 genes as the intersection of Diagnosis-DEGs and hsa04672-associated genes (Figure 3C). From these 19 genes we employed four machine learning algorithms to respectively identify potential biomarkers for sepsis diagnosis. The XGBoost algorithm selected 6 genes with a Gain > 0.02 (Figure 4A). The RF algorithm identified 14 genes with an importance score > 1.0 (Figure 4B and C). In the GMM regression analysis, the model with highest accuracy comprised 5 genes (Figure 4D). In the SVM-RFE analysis, the lowest classifier error and highest classifier accuracy occurred when the number of features was 19 (Figure 4E and F). The common genes of four gene sets identified by machine learning algorithms were determined to be the sepsis diagnostic biomarkers, including HLA-DPA1, ITGB7, and CXCR4 (Figure 4G). In the GSE65682 dataset, these diagnostic biomarkers were all downregulated in sepsis patients (Figure 4H). The ROC curves showed that the AUC for HLA-DPA1, ITGB7, and CXCR4 were 0.995, 0.967, and 0.942 respectively, indicating excellent diagnostic value for sepsis (Figure 4I).
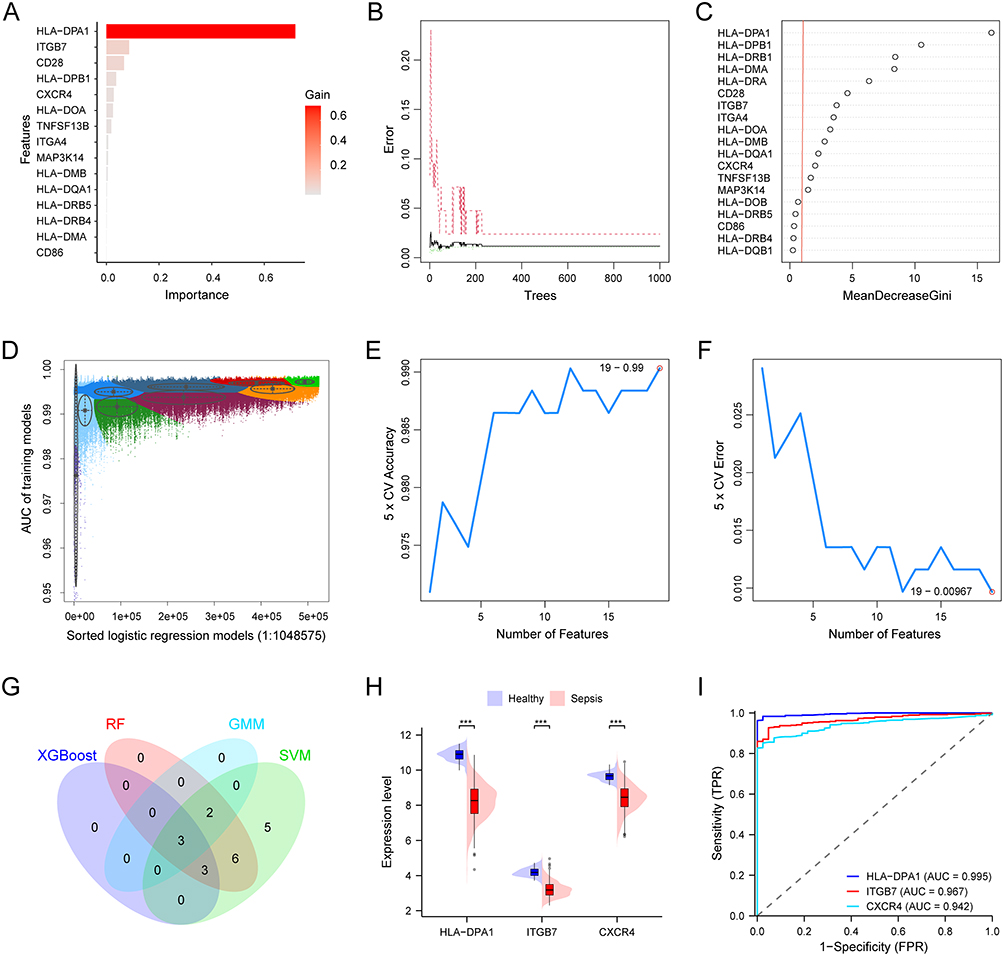 |
Figure 4 Hsa04672 and the diagnosis of sepsis. (A) 6 genes selected by XGBoost algorithm with a gain > 0.02. (B and C) 14 genes identified by RF algorithm with an importance score > 1.0. (D) 5 genes in GMM model with highest accuracy. (E and F) 19 genes selected by SVM-RFE algorithm. (G) 3 diagnostic biomarkers obtained from the intersection of four machine learning results. (H) The expression patterns of diagnostic biomarkers between sepsis patients and healthy controls. (I) The ROC curves of biomarkers in the diagnosis of sepsis. ***, P < 0.001. Abbreviations: Hsa04672, the KEGG identifier for the “intestinal immune network for IgA production” pathway; XGBoost, eXtreme gradient boosting; RF, random forest; GMM, gaussian mixture mo SVM-RFE, support vector machine recursive feature elimination; ROC, receiver operating characteristic; AUC, area under the curve; CV, cross validation; TPR, true positive rate; FPR, false positive rate. |
To investigate the role of the whole hsa04672 pathway in sepsis, we generated hsa04672 GSVA scores to quantify the overall activities of this pathway for all samples. The comparison of hsa04672 GSVA scores between sepsis patients and healthy controls revealed that the scores were significantly lower in sepsis patients, suggesting that the overall activity of hsa04672 pathway was downregulated during sepsis (Figure 5A).
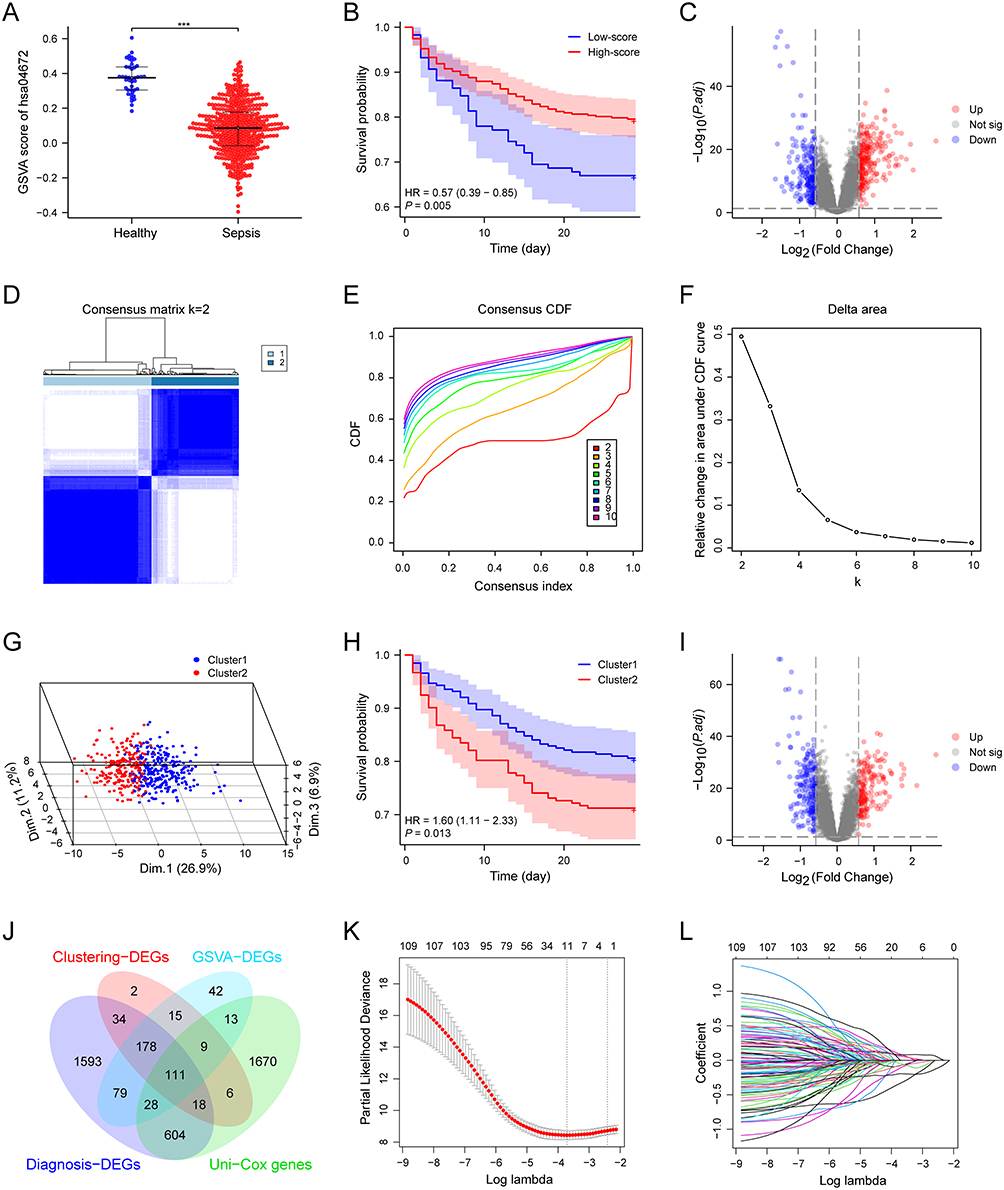 |
Figure 5 Hsa04672 and the prognosis of sepsis. (A) The comparison of hsa04672 GSVA scores between sepsis patients and healthy controls. (B) The K-M survival curve of two hsa04672-associated sepsis subgroups (high-score and low-score subgroups). Sepsis patients were stratified into high-score and low-score subgroups according to the hsa04672 GSVA scores. (C) The volcano plot illustrated the DEGs between two hsa04672-associated sepsis subgroups (high-score and low-score subgroups). (D-G) Consensus clustering. Based on the hsa04672-associated genes, sepsis patients were divided into Cluster1 and Cluster2. (D) Consensus clustering matrix. (E) Relative alterations in CDF delta area curves. (F) Consensus CDF curves. (G) 3-D PCA delineated the segregation between Cluster1 and Cluster2. (H) The K-M survival curve of two hsa04672-associated sepsis subgroups (Cluster1 and Cluster2). (I) The volcano plot illustrated the DEGs between two hsa04672-associated sepsis subgroups (Cluster1 and Cluster2). (J) The intersection of Uni-Cox genes, GSVA-DEGs, Clustering-DEGs, and diagnosis-DEGs. (K and L) LASSO regression. ***, P < 0.001. Abbreviations: Hsa04672, the KEGG identifier for the “intestinal immune network for IgA production” pathway; GSVA, gene set variation analysis; K-M, kaplan-meier; degs, differentially expressed genes; CDF, cumulative distribution function; PCA, principal component analysis; LASSO, least absolute shrinkage and selection operator; P.adj, adjusted P value. |
Hsa04672 and the Prognosis of Sepsis
To estimate the role of hsa04672 in sepsis prognosis, we employed two methods to divide sepsis patients into hsa04672-associated subgroups and compared their outcomes. (i) According to the hsa04672 GSVA scores, we stratified sepsis patients into high-score and low-score subgroups. K-M survival analysis demonstrated that the high-score subgroup had a better outcome than the low-score subgroup (Figure 5B). Then the DEGs of high-score and low-score subgroups were identified using differential analysis (Figure 5C). (ii) Using consensus clustering analysis, we divided sepsis patients into Cluster1 and Cluster2 (Figure 5D–F). The PCA revealed a clear separation between two clusters (Figure 5G). K-M survival analysis showed that patients in Cluster1 had a better outcome than those in Cluster2 (Figure 5H). Then the DEGs of Cluster1 and Cluster2 were identified using differential analysis (Figure 5I). These results suggested that hsa04672 was associated with sepsis prognosis, and the reduced activity of hsa04672 indicated a worse outcome of sepsis.
Nomogram Model for the Prognosis of Sepsis
Knowing the prognosis difference between hsa04672-associated subgroups, the DEGs of these subgroups were associated with both hsa04672 pathway and sepsis prognosis. We identified 475 DEGs as “GSVA-DEGs” in the differential analysis between high-score and low-score subgroups, and 373 DEGs as “Clustering-DEGs” in the differential analysis between Cluster1 and Cluster2. Besides, we identified 2459 potential prognostic genes as “Uni-Cox genes” through univariable Cox regression analysis. Then from the intersection of Uni-Cox genes, GSVA-DEGs, Clustering-DEGs, and Diagnosis-DEGs, we obtained 111 hub genes (Figure 5J).
Next, we selected 11 of the 111 hub genes through LASSO regression (Figure 5K and L). Since there were 112 sepsis nonsurvivors in the GSE65682 dataset, to avoid overfitting and optimize clinical utility, we identified three of these genes using multivariable Cox regression (Figure 6A). The three genes (ANKRD55, CX3CR1, and GIMAP4) were recognized as prognostic biomarkers of sepsis. Based on these biomarkers, we constructed a prognostic nomogram model (Figure 6B) and validated the robust performance of this model using calibration curves (Figure 6C–E), DCA (Figure 6F-H) and time-dependent ROC (Figure 6I). Notably, the AUC of time-dependent ROC curves decreased over time, indicating that the model’s predictive ability was more accurate in the early stage of sepsis (Figure 6I and J). The expression patterns of three prognostic biomarkers showed that ANKRD55 was upregulated while CX3CR1 and GIMAP4 were downregulated in sepsis patients (Figure 6K).
 |
Figure 6 Hsa04672-associated nomogram model for the prognosis of sepsis. (A) The forest plot showed the results of univariable and multivariable COX analyses. (B) The nomogram model for the prognosis of sepsis, incorporating three hsa04672-associated prognostic biomarkers. (C-E) Calibration curves showed the prediction accuracy of this nomogram model. (F-H) DCA showed the clinical utility of this nomogram model. (I) The time-dependent ROC curves of this nomogram model. (J) The relationship between the prediction time and the AUC of time-dependent ROC curves. (K) The expression patterns of prognostic biomarkers between sepsis patients and healthy controls. ***, P < 0.001. Abbreviations: Hsa04672, the KEGG identifier for the “intestinal immune network for IgA production” pathway; DCA, decision curve analysis; ROC, receiver operating characteristic; AUC, area under the curve; TPR, true positive rate; FPR, false positive rate. |
Interactions of Biomarkers
After we identified three diagnostic biomarkers (HLA-DPA1, ITGB7, and CXCR4) and three prognostic biomarkers (ANKRD55, CX3CR1, and GIMAP4), we constructed PPI networks, TF-mRNA regulatory network, and ceRNA regulatory network to show the interactions between these genes and their closely related molecules. In the PPI network generated by the GeneMANIA database, we identified 20 genes closely related to these biomarkers (Figure 7A). The PPI network constructed in the STRING database showed that ANKRD55 did not directly interact with the other five biomarkers (Figure 7B). The TF-mRNA regulatory network showed that ITGB7, CXCR4, and CX3CR1 possessed multiple TFs, while ANKRD55 and GIMAP4 each had one TF (Figure 7C). The ceRNA regulatory network showed a regulatory relationship involving CXCR4 and GIMAP4 mediated by mRNA, miRNA, and lncRNA (Figure 7D).
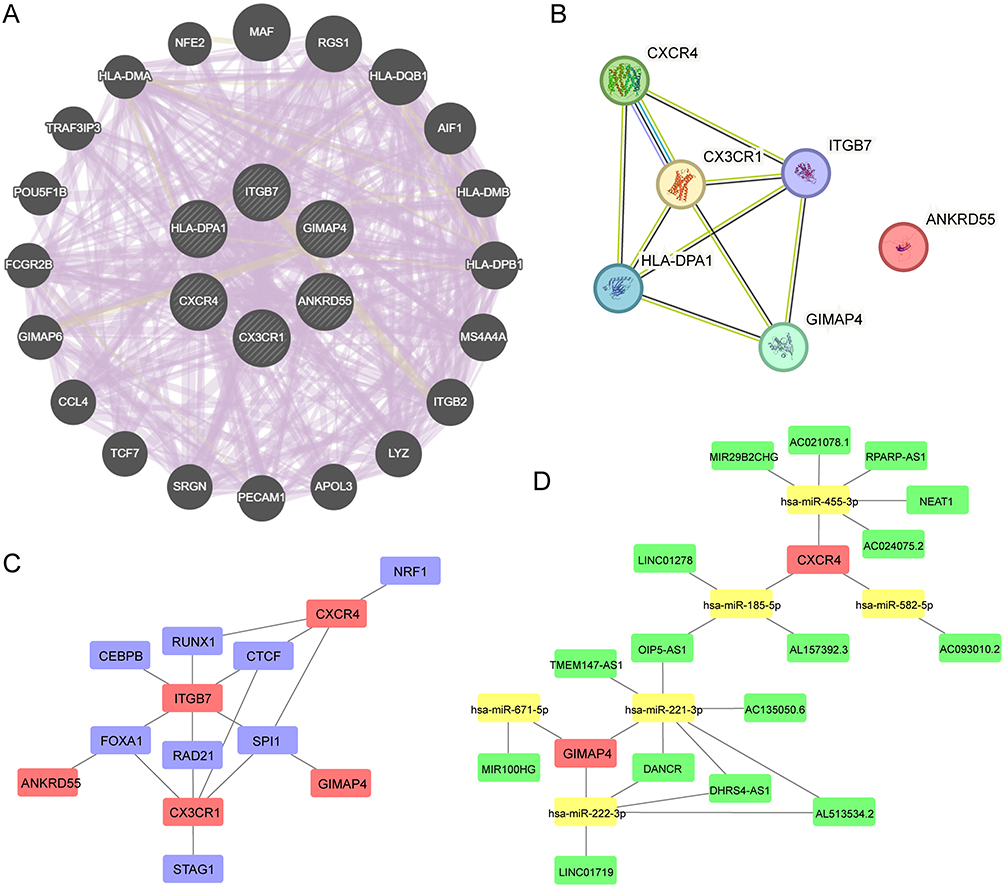 |
Figure 7 Interactions of hsa04672-associated biomarkers. (A) PPI network generated by the GeneMANIA database. (B) PPI network constructed in the STRING database. (C) TF-mRNA regulatory network. (D) CeRNA regulatory network. Abbreviations: Hsa04672, the KEGG identifier for the “intestinal immune network for IgA production” pathway; PPI, protein-protein interaction; TF, transcription factor; ceRNA, competing endogenous RNA. |
Validation of Biomarkers
After the identification of biomarkers in the training dataset GSE65682, we validated the expression patterns of biomarkers and the diagnostic values of diagnostic biomarkers in four validation datasets (GSE57065, GSE95233, GSE131761 and GSE134347). Since no survival time data was recorded in these datasets, the prognostic values of prognostic biomarkers had not been validated. Additionally, we conducted a clinical trial to assess the expression patterns of biomarkers. The results from independent validation datasets and clinical trial showed that ANKRD55 was upregulated while other biomarkers were downregulated in sepsis patients, which were consistent with what we found in GSE65682 (Figure 8A-E). When it came to the diagnosis values, ROC curves were constructed for all diagnostic biomarkers in each independent datasets, and the results showed that the AUC of the ROC curves were all over 0.9, suggesting that HLA-DPA1, ITGB7 and CXCR4 were promising candidates in sepsis diagnosis (Figure 8F-I).
 |
Figure 8 Validation of hsa04672-associated biomarkers. (A-D) The expression patterns of hsa04672-associated biomarkers between sepsis patients and healthy controls in validation datasets (GSE57065, GSE95233, GSE131761 and GSE134347). (E) The expression patterns of hsa04672-associated biomarkers between ten sepsis patients and ten healthy controls in the clinical trial. (F-I) The ROC curves of hsa04672-associated biomarkers for the diagnosis of sepsis in validation datasets (GSE57065, GSE95233, GSE131761 and GSE134347). **, P < 0.01; ***, P < 0.001. Abbreviations: Hsa04672, the KEGG identifier for the “intestinal immune network for IgA production” pathway; ROC, receiver operating characteristic; TPR, true positive rate; FPR, false positive rate. |
Intestinal IgA Expression in Sepsis Mice
Knowing the importance of hsa04672 in sepsis, we investigated the intestinal IgA expression in the ileum of sepsis mice. The result showed that the IgA expression was higher in sepsis mice compared with that in healthy controls (Figure 9A-F); in the sepsis subgroups, IgA expression was lower in the severe sepsis group than that in the mild sepsis group (Figure 9D-I).
 |
Figure 9 Intestinal IgA expression in sepsis mice. (A-C) Intestinal IgA expression in the control group (n = 5). (D-F) Intestinal IgA expression in the mild sepsis group (n = 5). (G-I) Intestinal IgA expression in the severe sepsis group (n = 5). |
Hsa04672 and Biomarkers in Single-Cell RNA Sequencing Data
Given the vital role of hsa04672 and its associated biomarkers in sepsis, we further investigated them in a single-cell RNA sequencing dataset (GSE167363). After excluding repeated sampling data, we obtained cells of three groups: healthy controls (n = 2), sepsis survivors (n = 3), and sepsis nonsurvivors (n = 2).
Followed cell quality control process, we categorized all cells into 21 groups (Figure 10A) and identified 11 specific immune cell types (Figure 10B). When the colors were mapped according to the groups, cells with different colors were not well mixed in some cell populations, that clearly illustrated the diversity of these cells across groups (Figure 10C). Then we showed the percentage of each immune cell in every group (Figure 11A). Here we known that the percentages of immune cells were distinct from healthy controls to sepsis survivors to sepsis nonsurvivors.
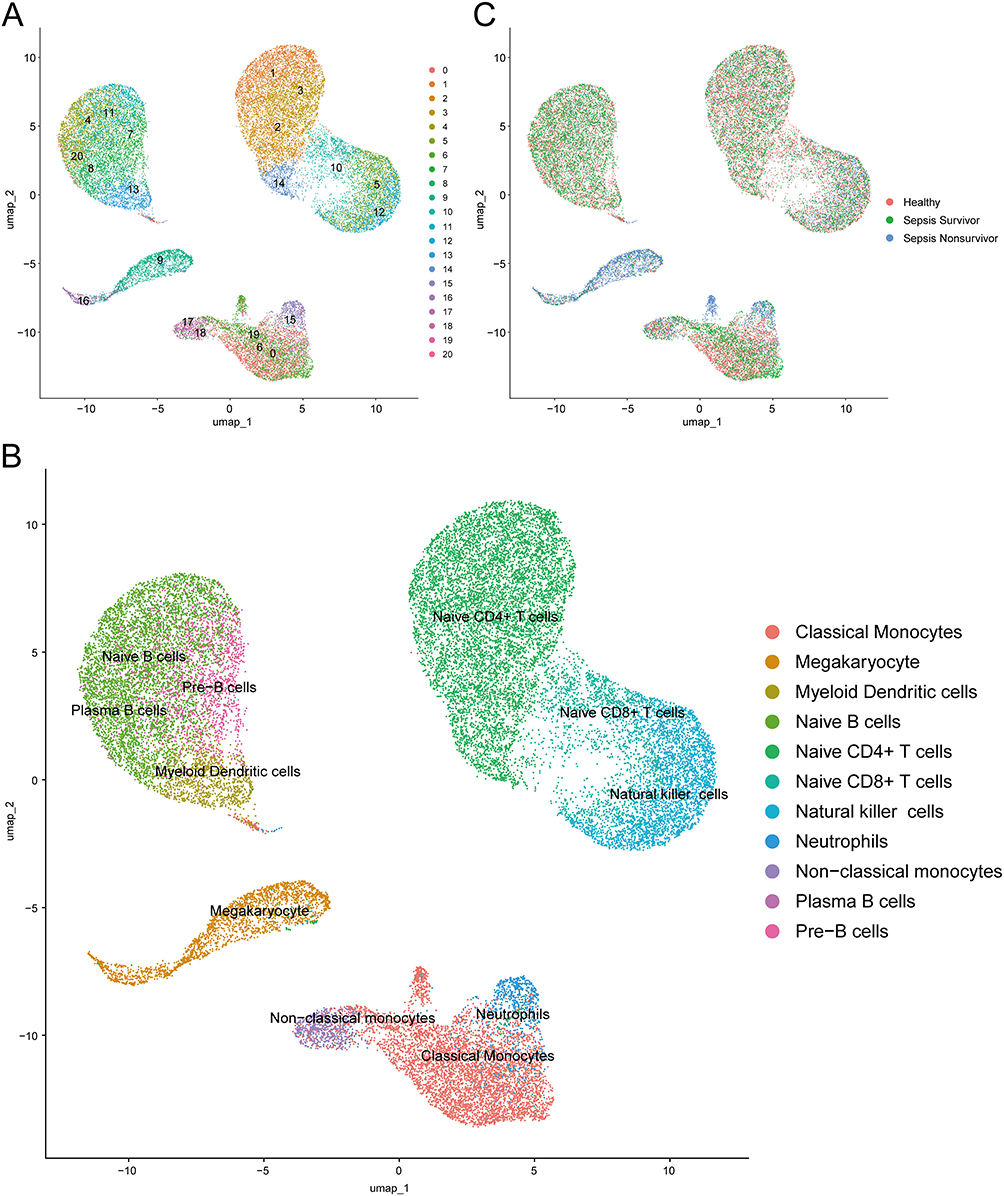 |
Figure 10 Clustering and annotation of single-cell RNA sequencing data. (A) Cells clustered into 21 groups. (B) Cells annotated into 11 specific immune cell types. (C) Cells from healthy controls, sepsis survivors and sepsis nonsurvivors. Abbreviation: UMAP, uniform manifold approximation and projection. |
 |
Figure 11 The activities of hsa04672 and the expression patterns of hsa04672-associated biomarkers in single-cell RNA sequencing data. (A) The percentages of each immune cell in different groups. (B) The activities of hsa04672 across different immune cells in different groups. (C-H) The expression patterns of hsa04672-associated biomarkers across different immune cells in different groups. Abbreviations: Hsa04672, the KEGG identifier for the “intestinal immune network for IgA production” pathway; pct.score, percentage of cells that had enrichment scores; avg.score, average of the enrichment scores; pct.exp, percentage of cells that expressed the targeted gene; avg.exp, average of the expression levels. |
Based on the hsa04672-associated genes, we generated enrichment score for each cell to quantify the overall activity of hsa04672. Then we investigated the activities of hsa04672 and the expression patterns of hsa04672-associated biomarkers in three groups across different immune cells. The results showed significant differences in the activities of hsa04672 among different immune cells. From healthy controls to sepsis survivors to sepsis nonsurvivors, the activities of hsa04672 in most immune cells showed a decreasing trend, which was most significant in classical monocytes (Figure 11B). Besides, there were notable differences in the expression patterns of hsa04672-associated biomarkers, with HLA-DPA1 and CXCR4 exhibiting higher expression levels and cell ratios. HLA-DPA1 was expressed in most immune cells except neutrophils, naive CD4+ T cells, and megakaryocytes (Figure 11C); CXCR4 was expressed in most immune cells except megakaryocytes (Figure 11D). The expression levels and cell ratios of the remaining biomarkers were relatively low and exhibited specific patterns in certain immune cells. Among them, ITGB7 was relatively high expressed in natural killer cells of healthy controls (Figure 11E); The expression level of ANKRD55 was relatively high in megakaryocytes of sepsis survivors (Figure 11F); The expression level of CX3CR1 was relatively high in non-classical monocytes of sepsis survivors and natural killer cells of healthy controls (Figure 11G); The expression level of GIMAP4 was relatively high in natural killer cells of healthy controls and non-classical monocytes of sepsis survivors (Figure 11H).
MR Analysis Between hsa04672-Associated Biomarkers and Sepsis
Considering the correlation between hsa04672-associated biomarkers and sepsis, it is essential to examine how they affect the development and outcome of sepsis. In this study, we performed MR analyses to investigate the causal relationships between hsa04672-associated biomarkers and sepsis.
In the MR analyses about diagnostic biomarkers and sepsis, results of IVW showed that the upregulated CXCR4 expression was associated with a higher risk of sepsis (OR = 1.27, 95% CI: 1.02–1.58, P = 0.036). In the MR analyses about prognostic biomarkers and 28-day death in sepsis, results of IVW showed that the upregulated GIMAP4 expression was associated with a lower risk of 28-day death (OR = 0.76, 95% CI: 0.60–0.98, P = 0.032). The causal relationship has not been confirmed between other biomarkers and sepsis. The IVs used in this study are showed in Table S5 and the main results are shown in Table S6 and Figure 12A.
 |
Figure 12 MR study between hsa04672-associated biomarkers and sepsis. (A) The forest plot showed the IVW results of causal relationships between biomarkers and sepsis or sepsis mortality. (B) The forest plot of the association between CXCR4 and sepsis. (C) The scatter plot of the association between CXCR4 and sepsis. (D) The leave-one-out plot of the association between CXCR4 and sepsis. (E) The funnel plot of the association between CXCR4 and sepsis. (F) The forest plot of the association between GIMAP4 and sepsis mortality. (G) The scatter plot of the association between GIMAP4 and sepsis mortality. (H) The leave-one-out plot of the association between GIMAP4 and sepsis mortality. (I) The funnel plot of the association between GIMAP4 and sepsis mortality. Abbreviations: MR, mendelian randomization; IVW, inverse-variance weighted; SNPs, single nucleotide polymorphisms. |
For CXCR4 and GIMAP4, we also generated forest plots and scatter plots to visually evaluate the estimated relationships and eliminate potential outlier impacts. The leave-one-out plots showed that no single SNP significantly affected the causal estimates between exposures and outcomes, which highlighted the stability and reliability of the observed relationships.37 The symmetry of the funnel plots indicates the absence of pleiotropy (Figure 12B-I). Sensitivity analyses revealed no significant heterogeneity or horizontal pleiotropy in the relationships (Table S7). And the correlations between SNPs and exposures were significantly stronger than those between SNPs and outcomes, reinforcing the validity of these causal relationships (Table S7).
Discussion
Previous studies have confirmed that the intestinal barrier injury plays a significant role during sepsis.5,11–13 In this study, we aimed to explore the specific mechanism by which intestinal barrier injury affects the development and progression of sepsis. We integrated the results from bulk and single-cell RNA sequencing data, GWAS data, animal study, and clinical trial, highlighted the role of “intestinal immune network for IgA production” (hsa04672) during sepsis, investigated the intestinal IgA expression in sepsis mice, obtained hsa04672-associated diagnostic biomarkers (HLA-DPA1, ITGB7 and CXCR4), and hsa04672-associated prognostic biomarkers (ANKRD55, CX3CR1 and GIMAP4), constructed a prognostic nomogram model for sepsis. Then we explored the activities of hsa04672 and the expression patterns of hsa04672-associated biomarkers across immune cells in healthy controls, sepsis survivors, and sepsis nonsurvivors. Furthermore, we confirmed the causal relationships between CXCR4 and sepsis, GIMAP4 and 28-day death in sepsis through MR analysis.
Hsa04672 is Associated with the Development and Progression of Sepsis
Hsa04672 is the KEGG identifier for the “intestinal immune network for IgA production”, which involves coordinated interactions between immune cells and epithelial cells in the intestine-associated lymphoid tissue.38 Hsa04672 is responsible for the production and secretion of IgA, a key antibody that protects mucosal surfaces, especially in the intestine. Previous studies employing the CLP sepsis model demonstrated that impaired intestinal IgA production correlated with intestinal barrier injury, higher intestinal IgA levels were related to better innate immunity and lower mortality,39,40 and intravenous IgA administration preserved blood-brain barrier integrity.41 In clinical studies, lower plasma IgA levels were associated with shorter survival times,42 and plasma IgA levels of sepsis survivors progressively increased from day 1 to day 10.43 With the ability of pathogen neutralization, immune exclusion, microbiota regulation, and anti-inflammatory effects, the intestine derived IgA plays essential role in maintaining intestinal barrier integrity, preventing systemic infections, and avoiding bacterial translocation.44 Therefore, the dysfunction of hsa04672 could play a critical role in the development of sepsis.
In the study of bulk RNA sequencing data, GSEA and KEGG enrichment analyses demonstrated the importance of hsa04672 in the development of sepsis. The hsa04672 GSVA scores in sepsis patients were significantly lower than those in healthy controls, implying that the activity of hsa04672 was reduced during sepsis.
Unlike the role of hsa04672 in the development of sepsis, the role of hsa04672 in the prognosis of sepsis could not be directly clarified. Based on the hsa04672-associated genes, we employed two methods to divided sepsis patients into hsa04672-associated subgroups. The separated outcomes of hsa04672-associated subgroups indicated that the different status of hsa04672 was associated with sepsis prognosis, and the reduced activity of hsa04672 was related to the worse outcome of sepsis.
In the study of single-cell RNA sequencing data, we found that the percentages of immune cells differed among healthy controls, sepsis survivors, and sepsis nonsurvivors. The single-cell data provided a deeper insight into hsa04672 activity in each immune cell, showing that its activity progressively decreased from healthy controls to sepsis survivors and then to sepsis nonsurvivors. This pattern was consistent with the results observed in bulk RNA sequencing data.
In our animal study, intestinal IgA expression was higher in sepsis mice than in healthy controls; In sepsis mice, hsa04672 was stimulated and IgA was produced to counteract the translocation of intestinal components caused by intestinal barrier injury.45 However, the reduced activity of hsa04672 during sepsis might produce insufficient IgA, leading to inadequate pathogen clearance and persistent intestinal barrier injury.46 Our animal study also showed that mice with severe sepsis had lower intestinal IgA expression than those with mild sepsis. The relationship between intestinal IgA expression and the severity of sepsis further supported the role of hsa04672 in the progression of sepsis.
Previous animal studies on intestinal IgA production were mainly conducted using the CLP-induced sepsis model.39–41 In this study, we investigated intestinal IgA production in the LPS-induced sepsis model. The results showed that mice with severe sepsis had lower intestinal IgA expression than those with mild sepsis, which supported the relationship between hsa04672 and sepsis prognosis. Since the sepsis model was induced by LPS, our results further indicated that the hsa04672 pathway was involved not only in sepsis caused by intestinal damage but also in other forms of sepsis.
In summary, hsa04672 was associated with the development and prognosis of sepsis. The reduced activity of hsa04672 was a notable feature of sepsis, and was involved in the progression of sepsis.
Hsa04672-Associated Biomarkers for the Diagnosis of Sepsis
After establishing the significance of hsa04672 during sepsis, we aimed to identify hsa04672-associated biomarkers for the diagnosis of sepsis. We first located 19 genes from the intersection of hsa04672-associated genes and Diagnosis-DEGs. Next, we employed four machine learning algorithms to create independent gene sets for sepsis diagnosis. Finally, we identify the intersection of these gene sets as the hsa04672-associated biomarkers for sepsis diagnosis, including HLA-DPA1, ITGB7, and CXCR4.
In the training dataset, four validation datasets, and clinical trial, these diagnostic biomarkers were downregulated in sepsis patients. The ROC curves showed that AUC of these biomarkers were all above 0.9 in training and validation datasets, suggesting the excellent utility in sepsis diagnosis.
In the single-cell RNA sequencing dataset, we found that the percentages of immune cells differed among healthy controls, sepsis survivors, and sepsis nonsurvivors. Furthermore, the subsequent investigation provided more precise information about the expression of hsa04672-associated diagnostic biomarkers in each immune cell. We observed that HLA-DPA1 and CXCR4 were highly expressed across most immune cells, while ITGB7 was only found in a small fraction of immune cells. The expression patterns of these biomarkers varied across different immune cells, providing valuable insights for the further investigation about the cell-cell interactions in sepsis. Although all these biomarkers were associated with sepsis, only the causal relationship between CXCR4 and sepsis was confirmed through the MR analysis.
Hsa04672-Associated Biomarkers and Nomogram Model for the Prognosis of Sepsis
In addition to the diagnosis of sepsis, we also identified hsa04672-associated biomarkers and constructed a nomogram model for the prognosis of sepsis.
We first performed differential expression analyses between hsa04672-associated subgroups to obtain two prognostic gene sets: GSVA-DEGs and Clustering-DEGs. Then we performed univariable Cox regression analysis to obtain Uni-Cox genes. Next, we identified 111 hub genes from the intersection of GSVA-DEGs, Clustering-DEGs, Uni-Cox genes and Diagnosis-DEGs. As the intersection of GSVA-DEGs and Clustering-DEGs, hub genes were related to hsa04672 pathway; as the intersection of GSVA-DEGs, Clustering-DEGs, and Uni-Cox genes, hub genes were associated with sepsis prognosis; as a subset of Diagnosis-DEGs, hub genes were related to the development of sepsis. Further, we employed LASSO regression to reduce the candidate pool to 11 key genes. To avoid overfitting and optimize clinical utility, we employed multivariable Cox regression to identify three hsa04672-associated biomarkers for sepsis prognosis, including ANKRD55, CX3CR1, and GIMAP4.
In this study, stepwise selection was applied to the pre-filtered 11 genes. Although multivariable Cox regression with a stepwise approach was incapable of avoiding multiple testing, the P values (P < 0.001) remained significant after strict Bonferroni correction (threshold ≈ 0.0045 for 11 tests). Furthermore, the differences in ORs between univariable and multivariable models were less than 20%, indicating consistent effect sizes for these selected genes.
In the training dataset, four validation datasets, and clinical trial, ANKRD55 was upregulated, while CX3CR1 and GIMAP4 were down regulated in sepsis patients. In the single-cell RNA sequencing dataset, we found that the percentages of immune cells differed among healthy controls, sepsis survivors, and sepsis nonsurvivors. The subsequent investigation showed that these hsa04672-associated prognostic biomarkers were expressed in just a small part of immune cells, and their expression patterns varied across different immune cells, offering plentiful information for the further investigation about cell-cell interactions in sepsis. Although all these biomarkers were linked to the prognosis of sepsis, only the causal relationship between GIMAP4 and 28-day death in sepsis was confirmed through the MR analysis.
Based on three prognostic biomarkers, we further constructed a nomogram model for sepsis prognosis. The accuracy and robustness of this model were demonstrated through calibration curve, DCA and time-dependent ROC curve. However, restricted by the lack of survival information, this model had not been validated in other independent datasets. What’s more, the AUC of time-dependent ROC suggested that the model’s predictive ability for long-term sepsis was limited.
Sepsis is a rapidly changing condition, whose progression is influenced by various factors, including patient characteristics, disease severity, and therapeutic interventions. As the illness advances, these factors accumulate, making initial biomarkers less reliable for predicting long-term outcomes in sepsis patients.47 The dynamic nature of sepsis presents significant challenges in prognosis assessment. Consequently, early biomarkers useful for initial diagnosis and short-term prognosis often fail to account for the complex interactions of factors that develop over time.48 The cumulative effect of these variables can alter disease progression in ways that initial assessments cannot anticipate. This evolving complexity underscores the need for dynamic prognostic models in sepsis management.49 Future research should focus on the development of time-dependent biomarkers and predictive algorithms that consider the progressive accumulation of prognostic factors.50 Such advancements could enhance our ability to predict long-term outcomes and guide personalized treatment strategies throughout the course of sepsis.
Perspectives
In the study of single-cell RNA sequencing data, we found that the percentages of immune cells differed among healthy controls, sepsis survivors, and sepsis nonsurvivors. This finding provided crucial context for interpreting the changes in hsa04672-associated biomarkers. While the bulk RNA sequencing data revealed overall changes, the single-cell RNA sequencing data demonstrated how these alterations occurred in two aspects: variations in cell proportions and differential gene expression within specific cell types. For example, during sepsis, the overall increase in ANKRD55 expression resulted from both a higher proportion of megakaryocytes and increased expression levels within these cells. The combined effects of altered immune cell proportions and gene expression within specific immune cell types during sepsis deserve further investigation.
Limitations
This study has some limitations. (i) There are 48 genes in the hsa04672 pathway. But restricted by sequencing methods, only 33 genes have been annotated in the training dataset, the other genes have not been discussed in this study. (ii) There was no survival time data for sepsis patients in four validation datasets, the performance of prognostic nomogram model has not been validated in independent datasets. (iii) The samples of datasets used in this study were blood cells, the intestinal IgA expression is not directly correlated with the overall activity of hsa04672, the interaction among hsa04672, intestinal microflora, and intestinal barrier during sepsis needs further investigation.
Conclusion
“Intestinal immune network for IgA production” (hsa04672) is deeply involved in the development and progression of sepsis. HLA-DPA1, ITGB7, and CXCR4 were the hsa04672-associated diagnostic biomarkers, with elevated CXCR4 expression representing a risk factor of sepsis. ANKRD55, CX3CR1, and GIMAP4 were the hsa04672-associated prognostic biomarkers, with decreased GIMAP4 expression being a risk factor of 28-day death in sepsis. A prognostic nomogram model incorporating ANKRD55, CX3CR1 and GIMAP4 demonstrated robust predictive performance, especially in the early stage of sepsis.
Abbreviations
AUC, Area Under the Curve; BP, Biological Process; CC, Cellular Component; CDF, Cumulative Distribution Function; ceRNA, Competing Endogenous RNA; CLP, Cecal Ligation and Puncture; CV, Cross Validation; DCA, Decision Curve Analysis; DEGs, Differentially Expressed Genes; FDR, False Discovery Rate; FPR, False Positive Rate; GEO, Gene Expression Omnibus; GMM, Gaussian Mixture Mo GO, Gene Ontology; GSEA, Gene Set Enrichment Analysis; GSVA, Gene Set Variation Analysis; GWAS, Genome-Wide Association Studies; IVs, Instrumental Variables; IVW, Inverse-Variance Weighted; KEGG, Kyoto Encyclopedia of Genes and Genomes; K-M, Kaplan-Meier; LPS, Lipopolysaccharide; MF, Molecular Function; MR, Mendelian Randomization; NES, Normalized Enrichment Score; PBS, Phosphate Buffered Saline; PCA, Principal Component Analysis; PPI, Protein-Protein Interaction; RF, Random Forest; ROC, Receiver Operating Characteristic; RT-qPCR, Real-Time Quantitative Polymerase Chain Reaction; SNPs, Single Nucleotide Polymorphisms; SVM-RFE, Support Vector Machine Recursive Feature Elimination; TF, Transcription Factor; TPR, True Positive Rate; UMAP, Uniform Manifold Approximation and Projection; XGBoost, eXtreme Gradient Boosting.
Data Sharing Statement
Data is provided within the manuscript or supplementary information files. The raw data are available from the corresponding authors upon reasonable request.
Ethical Approval and Consent to Participate
The clinical trial and animal study were approved by Medical Ethics Committee of The Affiliated Wuxi People’s Hospital of Nanjing Medical University. The clinical trial was registered at the Chinese Clinical Trial Register Center (ChiCTR2400094241) on December 19, 2024.
Consent for Publication
The consent for publication of “intestinal immune network for IgA production (hsa04672)” has been obtained from KEGG and provided in the Supplementary material.
Author Contributions
All authors made a significant contribution to the work reported, whether that is in the conception, study design, execution, acquisition of data, analysis and interpretation, or in all these areas; took part in drafting, revising or critically reviewing the article; gave final approval of the version to be published; have agreed on the journal to which the article has been submitted; and agree to be accountable for all aspects of the work.
Funding
The study was supported by Taihu-Talent Project of Wuxi government (2021THRC-TD-ZZYXK-2021), and Top Talent Support Program for young and middle-aged people of Wuxi Health Committee (HB2023118).
Disclosure
The authors declare that they have no competing interests.
References
1. Wang W, Ma L, Liu B, Ouyang L. The role of trained immunity in sepsis. Front Immunol. 2024;15:1449986. doi:10.3389/fimmu.2024.1449986
2. Cecconi M, Evans L, Levy M, Rhodes A. Sepsis and septic shock. Lancet. 2018;392(10141):75–87. doi:10.1016/s0140-6736(18)30696-2
3. Vazquez Guillamet MC, Liu H, Atkinson A, Fraser VJ, Lu C, Kollef MH. Performance of risk models for antimicrobial resistance in adult patients with sepsis. JAMA Netw Open. 2024;7(11):e2443658. doi:10.1001/jamanetworkopen.2024.43658
4. Xu JQ, Zhang WY, Fu JJ, et al. Viral sepsis: diagnosis, clinical features, pathogenesis, and clinical considerations. Military Med Res. 2024;11(1):78. doi:10.1186/s40779-024-00581-0
5. Camilleri M. Leaky gut: mechanisms, measurement and clinical implications in humans. Gut. 2019;68(8):1516–1526. doi:10.1136/gutjnl-2019-318427
6. Wang K, Zhang X, Xie T, et al. Establishment and evaluation of a new type of animal model of persistent inflammation, immunosuppression, and catabolism syndrome based on gut microbiota dysbiosis and bacterial translocation. Shock. 2025. doi:10.1097/shk.0000000000002621
7. Khan N, Kumar V, Li P, et al. Inhibiting Eph/ephrin signaling reduces vascular leak and endothelial cell dysfunction in mice with sepsis. Sci Transl Med. 2024;16(744):eadg5768. doi:10.1126/scitranslmed.adg5768
8. Shi Z, Jiao Y, Lai Z, et al. Evaluation of the protective role of resveratrol on LPS-induced septic intestinal barrier function via TLR4/MyD88/NF-κB signaling pathways. Sci Rep. 2025;15(1):828. doi:10.1038/s41598-025-85148-2
9. Wenying S, Jing H, Ying L, Hui D. The role of TLR4/MyD88/NF-κB in the protective effect of ulinastatin on the intestinal mucosal barrier in mice with sepsis. BMC Anesthesiol. 2023;23(1):414. doi:10.1186/s12871-023-02374-9
10. Tyszko M, Lemańska-Perek A, Śmiechowicz J, et al. Citrulline, intestinal fatty acid-binding protein and the acute gastrointestinal injury score as predictors of gastrointestinal failure in patients with sepsis and septic shock. Nutrients. 2023;15(9):2100. doi:10.3390/nu15092100
11. Piccioni A, Spagnuolo F, Candelli M, et al. The gut microbiome in sepsis: from dysbiosis to personalized therapy. J Clin Med. 2024;13(20):6082. doi:10.3390/jcm13206082
12. Zhang X, Liu H, Hashimoto K, Yuan S, Zhang J. The gut-liver axis in sepsis: interaction mechanisms and therapeutic potential. Crit Care. 2022;26(1):213. doi:10.1186/s13054-022-04090-1
13. Wang YF, Li JW, Wang DP, Jin K, Hui JJ, Xu HY. Anti-hyperglycemic agents in the adjuvant treatment of sepsis: improving intestinal barrier function. Drug Des Devel Ther. 2022;16:1697–1711. doi:10.2147/dddt.S360348
14. Ritchie ME, Phipson B, Wu D, et al. limma powers differential expression analyses for RNA-sequencing and microarray studies. Nucleic Acids Res. 2015;43(7):e47. doi:10.1093/nar/gkv007
15. Yu G, Wang LG, Han Y, He QY. clusterProfiler: an R package for comparing biological themes among gene clusters. Omics. 2012;16(5):284–287. doi:10.1089/omi.2011.0118
16. Gu Z, Gu L, Eils R, Schlesner M, Brors B. circlize implements and enhances circular visualization in R. Bioinformatics. 2014;30(19):2811–2812. doi:10.1093/bioinformatics/btu393
17. Luo W, Brouwer C. Pathview: an R/Bioconductor package for pathway-based data integration and visualization. Bioinformatics. 2013;29(14):1830–1831. doi:10.1093/bioinformatics/btt285
18. Xiong S, Liu Z, Min C, Shi Y, Zhang S, Liu W. Compressive strength prediction of cemented backfill containing phosphate tailings using extreme gradient boosting optimized by whale optimization algorithm. Materials. 2022;16(1):308. doi:10.3390/ma16010308
19. Khatibi T, Hanifi E, Sepehri MM, Allahqoli L. Proposing a machine-learning based method to predict stillbirth before and during delivery and ranking the features: nationwide retrospective cross-sectional study. BMC Pregnancy Childbirth. 2021;21(1):202. doi:10.1186/s12884-021-03658-z
20. Barajas-Olmos FM, Ortiz-Sánchez E, Imaz-Rosshandler I, et al. Analysis of the dynamic aberrant landscape of DNA methylation and gene expression during arsenic-induced cell transformation. Gene. 2019;711:143941. doi:10.1016/j.gene.2019.143941
21. Xu X, Gu W, Shen X, et al. An interactive web application to identify early parkinsonian non-tremor-dominant subtypes. J Neurol. 2024;271(4):2010–2018. doi:10.1007/s00415-023-12156-5
22. Hänzelmann S, Castelo R, Guinney J. GSVA: gene set variation analysis for microarray and RNA-seq data. BMC Bioinf. 2013;14(1):7. doi:10.1186/1471-2105-14-7
23. Wilkerson MD, Hayes DN. ConsensusClusterPlus: a class discovery tool with confidence assessments and item tracking. Bioinformatics. 2010;26(12):1572–1573. doi:10.1093/bioinformatics/btq170
24. Gao J, Kwan PW, Shi D. Sparse kernel learning with LASSO and bayesian inference algorithm. Neural Net. 2010;23(2):257–264. doi:10.1016/j.neunet.2009.07.001
25. De Backer D, Deutschman CS, Hellman J, et al. Surviving sepsis campaign research priorities 2023. Crit Care Med. 2024;52(2):268–296. doi:10.1097/ccm.0000000000006135
26. Zheng P, Ma R, Liu X, Song L, Ma B, Zou G. Saikosaponin-d attenuates irinotecan-induced intestinal toxicity via TAK1/NF-κB pathway and enhances antitumor efficacy. J Inflamm Res. 2025;18:7973–7988. doi:10.2147/jir.S504696
27. Byun JE, Lee JW, Choi EJ, et al. Therapeutic effects of TN13 peptide on acute respiratory distress syndrome and sepsis models in vivo. J Clin Med. 2025;14(6):1804. doi:10.3390/jcm14061804
28. Shi C, Yue F, Shi F, et al. Selenium-containing amino acids protect dextran sulfate sodium-induced colitis via ameliorating oxidative stress and intestinal inflammation. J Inflamm Res. 2021;14:85–95. doi:10.2147/jir.S288412
29. Yang S, Guo J, Kong Z, et al. Causal effects of gut microbiota on sepsis and sepsis-related death: insights from genome-wide Mendelian randomization, single-cell RNA, bulk RNA sequencing, and network pharmacology. J Transl Med. 2024;22(1):10. doi:10.1186/s12967-023-04835-8
30. Skrivankova VW, Richmond RC, Woolf BAR, et al. Strengthening the reporting of observational studies in epidemiology using Mendelian randomization: the STROBE-MR statement. JAMA. 2021;326(16):1614–1621. doi:10.1001/jama.2021.18236
31. Liu X, Dong Q. Associations between gut microbiota and three prostate diseases: a bidirectional two-sample Mendelian randomization study. Sci Rep. 2024;14(1):4019. doi:10.1038/s41598-024-54293-5
32. Guan X, Zhang D, Zhang F, et al. Causal association of physical activity with low back pain, intervertebral disc degeneration and sciatica: a two-sample mendelian randomization analysis study. Front Cell Develop Biol. 2023;11:1260001. doi:10.3389/fcell.2023.1260001
33. Slob EAW, Burgess S. A comparison of robust Mendelian randomization methods using summary data. Genet Epidemiol. 2020;44(4):313–329. doi:10.1002/gepi.22295
34. Burgess S, Butterworth A, Thompson SG. Mendelian randomization analysis with multiple genetic variants using summarized data. Genet Epidemiol. 2013;37(7):658–665. doi:10.1002/gepi.21758
35. Bowden J, Holmes MV. Meta-analysis and Mendelian randomization: a review. Res Synth Methods. 2019;10(4):486–496. doi:10.1002/jrsm.1346
36. Verbanck M, Chen CY, Neale B, Do R. Detection of widespread horizontal pleiotropy in causal relationships inferred from Mendelian randomization between complex traits and diseases. Nature Genet. 2018;50(5):693–698. doi:10.1038/s41588-018-0099-7
37. Burgess S, Bowden J, Fall T, Ingelsson E, Thompson SG. Sensitivity analyses for robust causal inference from Mendelian randomization analyses with multiple genetic variants. Epidemiology. 2017;28(1):30–42. doi:10.1097/ede.0000000000000559
38. Takahashi D, Kimura S, Hase K. Intestinal immunity: to be, or not to be, induced? That is the question. Int Immunol. 2021;33(12):755–759. doi:10.1093/intimm/dxab051
39. Lai YN, Yeh SL, Lin MT, Shang HF, Yeh CL, Chen WJ. Glutamine supplementation enhances mucosal immunity in rats with Gut-Derived sepsis. Nutrition. 2004;20(3):286–291. doi:10.1016/j.nut.2003.11.015
40. Jin S, Jiang R, Lei S, et al. Shenfu injection prolongs survival and protects the intestinal mucosa in rats with sepsis by modulating immune response. Turk J Gastroenterol. 2019;30(4):364–371. doi:10.5152/tjg.2019.18418
41. Esen F, Senturk E, Ozcan PE, et al. Intravenous immunoglobulins prevent the breakdown of the blood-brain barrier in experimentally induced sepsis. Crit Care Med. 2012;40(4):1214–1220. doi:10.1097/CCM.0b013e31823779ca
42. Bermejo-Martín JF, Rodriguez-Fernandez A, Herrán-Monge R, et al. Immunoglobulins IgG1, IgM and IgA: a synergistic team influencing survival in sepsis. J Intern Med. 2014;276(4):404–412. doi:10.1111/joim.12265
43. Andaluz-Ojeda D, Iglesias V, Bobillo F, et al. Early natural killer cell counts in blood predict mortality in severe sepsis. Crit Care. 2011;15(5):R243. doi:10.1186/cc10501
44. Mahdally SM, Izquierdo M, Viscardi RM, et al. Secretory-IgA binding to intestinal microbiota attenuates inflammatory reactions as the intestinal barrier of preterm infants matures. Clin Exp Immunol. 2023;213(3):339–356. doi:10.1093/cei/uxad042
45. Yue Y, Wang Y, Xie Q, et al. Bifidobacterium bifidum E3 combined with bifidobacterium longum subsp. infantis E4 improves LPS-induced intestinal injury by inhibiting the TLR4/NF-κB and MAPK signaling pathways in vivo. J Agric Food Chem. 2023;71(23):8915–8930. doi:10.1021/acs.jafc.3c00421
46. Nagaishi T, Watabe T, Kotake K, et al. Immunoglobulin A-specific deficiency induces spontaneous inflammation specifically in the ileum. Gut. 2022;71(3):487–496. doi:10.1136/gutjnl-2020-322873
47. Wong HR. Pediatric sepsis biomarkers for prognostic and predictive enrichment. Pediatr Res. 2022;91(2):283–288. doi:10.1038/s41390-021-01620-5
48. Zhou Y, Tao L, Qiu J, et al. Tumor biomarkers for diagnosis, prognosis and targeted therapy. Sig Transd Target Ther. 2024;9(1):132. doi:10.1038/s41392-024-01823-2
49. Hassan FI, Didari T, Khan F, Mojtahedzadeh M, Abdollahi M. The role of epigenetic alterations involved in sepsis: an overview. Curr Pharm Des. 2018;24(24):2862–2869. doi:10.2174/1381612824666180903114253
50. Guan Y, Wang X, Chen X, Yi D, Chen L, Jiang X. Assessment of the timeliness and robustness for predicting adult sepsis. Iscience. 2021;24(2):102106. doi:10.1016/j.isci.2021.102106
 © 2025 The Author(s). This work is published and licensed by Dove Medical Press Limited. The
full terms of this license are available at https://www.dovepress.com/terms
and incorporate the Creative Commons Attribution
- Non Commercial (unported, 4.0) License.
By accessing the work you hereby accept the Terms. Non-commercial uses of the work are permitted
without any further permission from Dove Medical Press Limited, provided the work is properly
attributed. For permission for commercial use of this work, please see paragraphs 4.2 and 5 of our Terms.
© 2025 The Author(s). This work is published and licensed by Dove Medical Press Limited. The
full terms of this license are available at https://www.dovepress.com/terms
and incorporate the Creative Commons Attribution
- Non Commercial (unported, 4.0) License.
By accessing the work you hereby accept the Terms. Non-commercial uses of the work are permitted
without any further permission from Dove Medical Press Limited, provided the work is properly
attributed. For permission for commercial use of this work, please see paragraphs 4.2 and 5 of our Terms.
Recommended articles
Identifying Potential Effective Diagnostic and Prognostic Biomarkers in Sepsis by Bioinformatics Analysis and Validation
Huang X, Tan J, Chen X, Zhao L
International Journal of General Medicine 2022, 15:6055-6071
Published Date: 6 July 2022
Impaired Circulating Antibody-Secreting Cells Generation Predicts the Dismal Outcome in the Elderly Septic Shock Patients
Xu H, Li T, Zhang X, Li H, Lv D, Wang Y, Huo F, Bai J, Wang C
Journal of Inflammation Research 2022, 15:5293-5308
Published Date: 13 September 2022
SPINK1 is a Potential Diagnostic and Prognostic Biomarker for Sepsis
Chen D, Shi Z, Gao X, Yang Y, Lei X, Hu Y
Infection and Drug Resistance 2024, 17:875-884
Published Date: 8 March 2024
Integrated Analysis Identified TGFBI as a Biomarker of Disease Severity and Prognosis Correlated with Immune Infiltrates in Patients with Sepsis
Shi M, Wei Y, Guo R, Luo F
Journal of Inflammation Research 2024, 17:2285-2298
Published Date: 15 April 2024
Screening and Validation of Potential Biomarkers of Immune Cells in Childhood Asthma Patients via Mendelian Randomization and Machine Learning
Zhang Y, Hai Y, Song B, Xu J, Cao L, Yasen R, Xu W, Zhang J, Hu J
Journal of Inflammation Research 2025, 18:2583-2600
Published Date: 21 February 2025