Back to Journals » Journal of Pain Research » Volume 19
The Emotional Allodynia Questionnaire: Preliminary Validation and Clinical Phenotyping in Fibromyalgia
Authors Corriero A ![]() , Giglio M, Pilolla A, Galdini F, Mucci O
, Giglio M, Pilolla A, Galdini F, Mucci O ![]() , Vurro M, Fornarelli F, Di Venosa C, Trerotoli P, Puntillo F
, Vurro M, Fornarelli F, Di Venosa C, Trerotoli P, Puntillo F ![]()
Received 13 March 2026
Accepted for publication 11 May 2026
Published 3 June 2026 Volume 2026:19 607309
DOI https://doi.org/10.2147/JPR.S607309
Checked for plagiarism Yes
Review by Single anonymous peer review
Peer reviewer comments 2
Editor who approved publication: Dr Rocío de la Vega
Alberto Corriero,1 Mariateresa Giglio,1 Alfonso Pilolla,1 Filomena Galdini,1 Olmina Mucci,1 Miriana Vurro,1 Fara Fornarelli,1 Cinzia Di Venosa,1 Paolo Trerotoli,2 Filomena Puntillo1
1Department of Interdisciplinary Medicine – Pain and ICU Section, University of Bari Aldo Moro, Bari, Italy; 2Department of Interdisciplinary Medicine – Statistics Section, University of Bari Aldo Moro, Bari, Italy
Correspondence: Alberto Corriero, Email [email protected]
Background: Despite IASP’s recognition of pain as a sensory and emotional experience, current assessment tools largely overlook affective hypersensitivity to socially neutral stimuli, a phenomenon we term “emotional allodynia” that appears particularly recurrent in fibromyalgia.
Methods: This preliminary psychometric validation study evaluated the Emotional Allodynia Questionnaire (AEQ), an 11-item 0– 4 Likert scale designed to quantify maladaptive emotional responses to subtle relational stimuli (perceived unresponsiveness, loss of reciprocity) in 107 patients with fibromyalgia from a tertiary pain clinic (90.7% female, mean age 56.8 years, median VAS 8.0).
Results: AEQ demonstrated excellent internal consistency (Cronbach’s α = 0.917, 95% CI: 0.880– 0.943). Exploratory factor analysis supported unidimensional structure (Kaiser–Meyer–Olkin, KMO = 0.90, loadings 0.55– 0.86). Confirmatory factor analysis provided partial support (CFI = 0.924, RMSEA = 0.104). Convergent validity showed moderate-to-strong Spearman correlations with Central Sensitization Inventory (CSI) (ρ = 0.40), Pain Catastrophizing Scale (PCS) (ρ = 0.57), Difficulties in Emotion Regulation Scale (DERS) (ρ = 0.59), Beck Depression Inventory-II (BDI-II) (ρ = 0.52), State-Trait Anxiety Inventory (STAI-Y) (ρ = 0.51– 0.56, all p < 0.001). Principal Component Analysis revealed that AEQ loaded strongly on a shared affective-sensitization dimension (65.9% variance). Exploratory median-split AEQ-CSI phenotyping identified four distinct profiles - resilient, emotional allodynia, central sensitization, mixed - that differed across all measures (Kruskal–Wallis p < 0.001).
Conclusion: These preliminary findings suggest that the AEQ may represent a promising and theoretically coherent instrument for assessing a relational-affective dimension relevant to nociplastic pain, warranting replication in larger, independent samples.
Keywords: fibromyalgia, chronic pain, nociplastic pain, central sensitization, emotion regulation, psychometrics
Introduction
Despite the International Association for the Study of Pain (IASP) explicitly defining pain as both a sensory and emotional experience, the emotional dimension is often overlooked in the clinical practice of pain therapy.1 Emotional aspects are usually assessed inconsistently, typically through indirect observation or psychometric screening tools like the Pain Catastrophizing Scale (PCS),2 the Central Sensitization Inventory (CSI),3 Beck Depression Inventory-II (BDI-II),4 State-Trait Anxiety Inventory (STAI-Y),5 and the Difficulties in Emotion Regulation Scale (DERS).6 While these tools capture important constructs, including depression, anxiety, catastrophizing, and emotion regulation, they do not specifically evaluate heightened affective sensitivity to interpersonal or relational stimuli.
This limitation is especially clear in fibromyalgia, a typical nociplastic pain condition7 marked by central amplification, symptom heterogeneity, and significant interindividual variability.8 Although fibromyalgia is commonly linked to emotional distress, the affective component of pain is often insufficiently integrated into mechanism-based models of pain.9,10 Certain individuals demonstrate heightened emotional reactivity to subtle relational signals, including perceived unresponsiveness, exclusion, or diminished reciprocity, with exacerbations of pain closely associated with these phenomena. Others, despite experiencing similar levels of pain, exhibit relative emotional resilience. This clinical heterogeneity underscores the necessity for enhanced phenotypic frameworks that extend beyond the severity of symptoms reported by the patients.
We propose that a subset of patients with chronic pain, particularly within the fibromyalgia spectrum, exhibits a distinct clinical pattern, characterized by affective hypersensitivity to low-intensity interpersonal stimuli. This phenomenon reflects a form of affective nociplasticity, whereby emotionally neutral or mildly negative social cues elicit disproportionate emotional distress and pain amplification. We hypothesize that this affective hypersensitivity represents a specific psychosociological amplifier of pain, that might not be fully addressed by existing measures of mood, cognition, or general emotional dysregulation.
The Emotional Allodynia Questionnaire (AEQ) was developed to address this gap by providing a structured, specific tool to identify emotional allodynia, thereby aligning clinical assessment with the IASP’s comprehensive definition of pain.
The term “emotional allodynia” is modeled on the concept of physical allodynia, a hallmark of patients with fibromyalgia in which normally harmless physical stimuli provoke pain.11 By analogy, emotional allodynia refers to a condition in which neutral or low-intensity interpersonal stimuli provoke disproportionate emotional distress. Just as the physical allodynia threshold is lowered for tactile or thermal stimuli, the emotional allodynia threshold is lowered for relational stimuli, a parallel that reflects the shared neurobiological substrate of physical and social pain.12 The construct was first operationalized by Ushinsky et al,13 who showed heightened pain sensitivity following negative mood induction in individuals with major depressive disorder. Subsequent neuroimaging studies14–16 confirmed that social-emotional distress and physical pain activate overlapping brain regions, including the anterior cingulate cortex and insula,17 pointing to a common pain–affect network.18,19
This shared neurobiology not only supports the construct of emotional allodynia but suggests an analogous opportunity for stratification. While in neuropathic pain quantitative sensory testing (QST)-based sensory phenotyping has identified subgroups of patients with distinct mechanistic profiles and differential treatment responses,20 nociplastic pain currently lacks comparable tools for mechanism-informed phenotyping. Emotional allodynia (EA) may have a neurobiological basis in the circuits governing both pain processing and emotional regulation so that individuals prone to emotional dysregulation exhibit heightened responses to nociceptive stimuli.21 Impairments in descending inhibitory pathways involving serotonergic and noradrenergic systems may contribute to central sensitization and increased emotional reactivity,22 and investigating this dimension with a structured instrument may support more targeted, biopsychosocial pain management approaches.
In clinical practice, the affective dimension of fibromyalgia is often subsumed under a coexisting psychiatric label, an approach that risks obscuring the heterogeneity of affective-relational mechanisms that may independently modulate pain amplification. We argue that affective hypersensitivity to interpersonal stimuli represents not merely a comorbid psychological trait but a clinically relevant dimension of central amplification that current pain scales may not fully address.
The AEQ was developed as an exploratory instrument to identify individuals displaying significant relational emotional hypersensitivity (Figure 1), to support the identification of emotionally driven nociplastic pain phenotypes. Designed as a brief, self-administered tool completable in approximately 5 to 8 minutes, the AEQ is intended for routine use in pain clinic settings, providing pain specialists with a rapid and specific instrument to identify this socio-affective dimension, helping clinicians move beyond a one-size-fits-all model toward individualized pain management strategies.
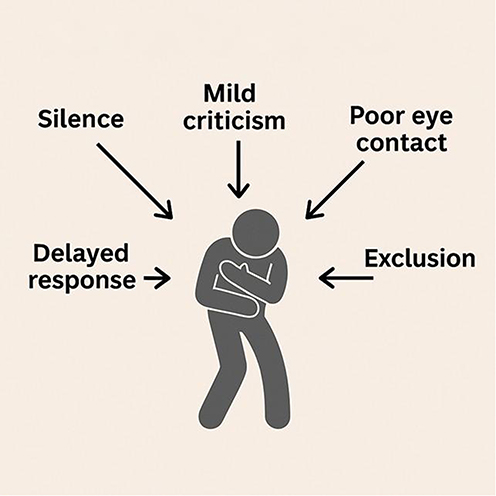 |
Figure 1 Conceptual schematic of Emotional Allodynia. This figure is an explanatory illustration and does not represent empirical data from the present study. |
Methods
Study Design and Population
This is a single-center, cross-sectional observational study conducted in patients with fibromyalgia attending a tertiary pain outpatient clinic.
The study is part of an ongoing research program (STUDIO PEARL) and is conducted in accordance with the ethical principles of the Declaration of Helsinki and the IASP guidelines for pain research in humans. Approval was obtained from the local Ethics Committee (2451/CEL – STUDIO PEARL), and all participants provided written informed consent.
The present manuscript reports a preliminary exploratory analysis of data collected at the Pain Clinic of Policlinico Hospital in Bari between September 2025 and January 2026, focusing on the initial psychometric validation of the Emotional Allodynia Questionnaire (AEQ). A formal sample size calculation was performed for the final validation phase of the study, which is ongoing and designed to support confirmatory psychometric analyses.
Fibromyalgia was diagnosed according to the 2016 revision of the American College of Rheumatology (ACR) criteria.23 The study population was intentionally restricted to patients with fibromyalgia in order to maximize construct homogeneity in this initial validation phase, given the prototypical nociplastic and affectively modulated nature of the syndrome.
Patients were eligible if they were ≥18 years old and could independently complete self-report questionnaires in Italian. Exclusion criteria included acute pain with a clear structural etiology, severe cognitive impairment, inability to understand Italian, oncological disease, and any current or past psychiatric diagnosis except depression and panic disorder, as assessed by clinical history. This exclusion strategy was defined in consultation with a clinical psychiatrist. Ongoing pharmacological treatment for pain or mental health was not an exclusion criterion, as it represents standard of care in fibromyalgia populations.
Procedure and Data Collection
After clinical screening and written informed consent, eligible participants completed a set of self-report questionnaires in paper format during their clinical visit. A physician was available throughout the session to clarify any items or instructions upon request. Completed questionnaires were subsequently verified and entered into a secure digital platform by the physician, ensuring complete item-level data collection. Data were treated as confidential throughout. In addition to psychometric questionnaires, basic sociodemographic, clinical, lifestyle, and relational variables were collected using a standardized self-report form developed for the study. These variables included age, sex, educational level, occupational status, marital status, living arrangement, pain duration, physical activity level, sleep quality, perceived quality of life, relational history, and current or past psychological and pharmacological treatments. No personally identifiable information was collected. The estimated completion time was approximately 25–30 minutes.
The assessment questionnaires included AEQ, CSI, PCS, BDI-II, STAI-Y (1–2), DERS, and Visual Analog Scale (VAS).
Although patients with fibromyalgia present widespread pain, they were asked to indicate the body region perceived as the most painful or clinically dominant at the time of assessment.
The AEQ consists of 11 items scored on a 0–4 Likert scale that assess the frequency of maladaptive emotional responses to subtle interpersonal or relational cues (eg, delayed responses, unresponsiveness, loss of reciprocity). Higher scores indicate greater affective hypersensitivity.
The AEQ items were developed through a process informed by the theoretical framework of physical allodynia and its proposed affective analogue, drawing on literature on interpersonal sensitivity, social pain neuroscience, and emotion regulation in chronic pain. Item content was generated and refined through iterative discussion among the multidisciplinary research team, including pain medicine specialists and clinical psychologists with expertise in fibromyalgia. Preliminary item comprehensibility was informally reviewed with a subset of patients prior to final item selection. The questionnaire was originally developed and administered in Italian; the English version presented in this manuscript is a translation prepared by the authors for publication purposes and has not undergone formal back-translation.
The complete questionnaire including administration instructions and scoring guidelines, is provided in Figure 2.
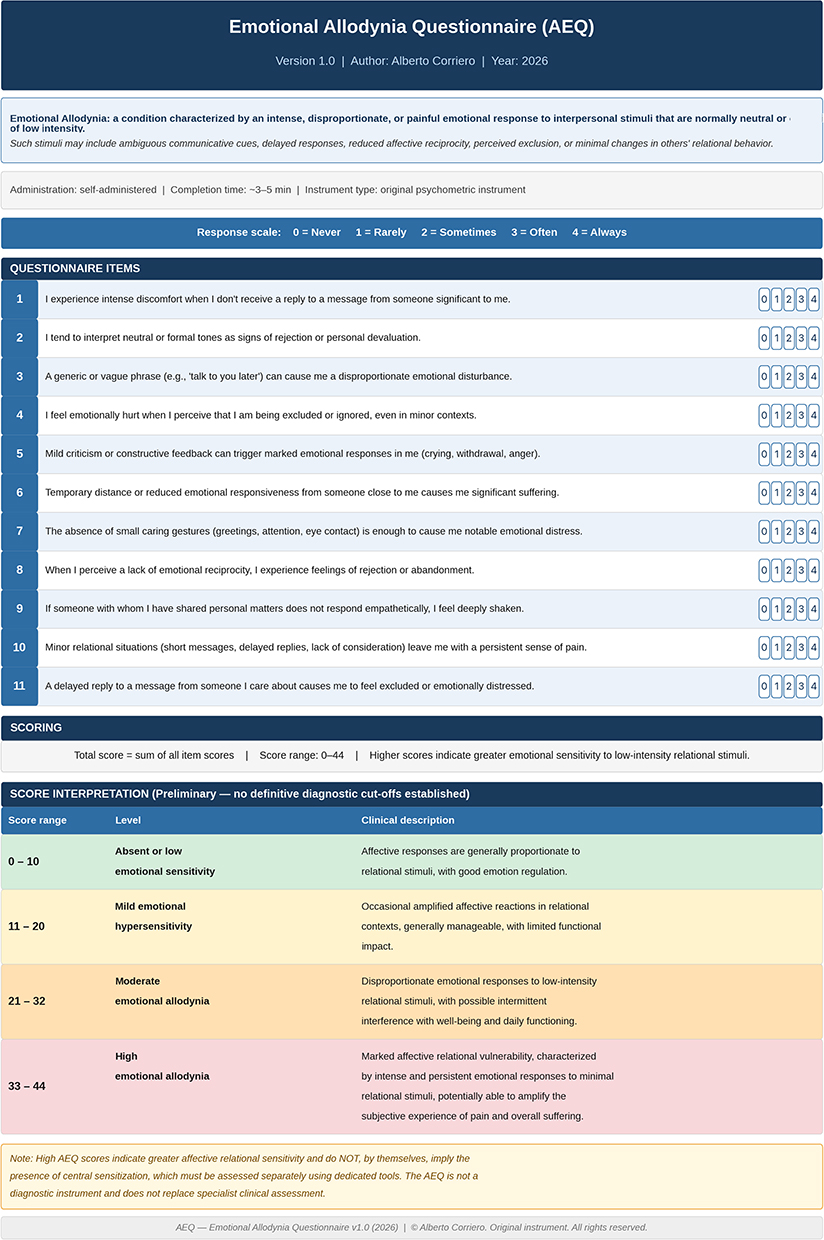 |
Figure 2 The Emotional Allodynia Questionnaire (AEQ), Version 1.0. The instrument comprises 11 self-administered items rated on a five-point Likert scale (0 = Never; 1 = Rarely; 2 = Sometimes; 3 = Often; 4 = Always). The total score is obtained by summing all item scores (range 0–44); higher scores indicate greater emotional sensitivity to low-intensity relational stimuli. The score interpretation table presents four preliminary ranges: absent or low sensitivity (0–10, green); mild hypersensitivity (11–20, yellow); moderate emotional allodynia (21–32, Orange); high emotional allodynia (33–44, red); ranges are provided for exploratory and descriptive purposes only. The AEQ is not a diagnostic instrument and does not replace specialist clinical assessment. Figure property of the author. |
Statistical Analysis
Descriptive demographic and clinical characteristics are reported to contextualize the sample and support the interpretability of the psychometric analyses.
Demographic and clinical variables are reported as mean ± SD given their approximately normal distribution; psychometric scale scores and VAS are reported as medians and interquartile ranges given the non-normal distribution of these measures.
Categorical variables were summarized using counts and percentages. Floor and ceiling effects for the AEQ were explored descriptively.
Internal consistency of the AEQ was assessed using Cronbach’s alpha. The latent structure of the AEQ was explored through Exploratory Factor Analysis (EFA) on item-level data.
EFA was conducted using the minimum residuals extraction method with oblimin rotation, allowing for correlated factors. Sampling adequacy was assessed using the Kaiser–Meyer–Olkin (KMO) measure, and factorability was evaluated using Bartlett’s test of sphericity. The number of factors was determined using parallel analysis. Factor loadings ≥0.30 were considered meaningful.
To complement the EFA and explore the factorial structure of the AEQ in a preliminary confirmatory framework, a Confirmatory Factor Analysis (CFA) was conducted in the same sample using the lavaan package (via jamovi). Given this single-sample design, CFA results should be interpreted as preliminary internal cross-validation rather than independent confirmatory evidence.
A single-factor model was specified a priori, consistent with the unidimensional structure identified by EFA and parallel analysis. Model fit was evaluated using the following indices: Comparative Fit Index (CFI), Tucker-Lewis Index (TLI), Root Mean Square Error of Approximation (RMSEA) with 90% confidence interval, and Standardized Root Mean Square Residual (SRMR). Conventional thresholds were applied: CFI and TLI ≥ 0.90, RMSEA ≤ 0.08, and SRMR ≤ 0.08. Modification indices were inspected post hoc to identify theoretically justifiable residual covariances.
The CFA was conducted using Maximum Likelihood (ML) estimation as implemented in jamovi, with Full Information Maximum Likelihood (FIML) specified as the missing data method. Given the self-administered format with physician verification of completeness, complete item-level responses were obtained from all participants. Items were treated as continuous variables in this model, consistent with common practice in preliminary psychometric studies using 5-point Likert scales.24
Convergent validity of the AEQ was assessed using Spearman’s rank correlation coefficients between AEQ total scores and CSI, PCS, BDI-II, STAI-Y1, STAI-Y2, and DERS total scores.
To explore the discriminant validity of the AEQ with respect to DERS, a median-split approach was applied to both instruments. A 2×2 contingency table was constructed to identify patients showing dissociated profiles, specifically, those with high AEQ and low DERS, or low AEQ and high DERS, as empirical evidence that the two instruments capture partially distinct constructs. Association between groups was tested using the chi-square test. Additionally, the average variance extracted (AVE) was calculated from the standardized CFA loadings to evaluate discriminant validity according to the Fornell-Larcker criterion, which requires AVE to exceed the squared correlation between constructs.
To explore the multivariate relationships between affective, cognitive, and somatic dimensions, a Principal Component Analysis (PCA) was performed on total scores of AEQ, CSI, PCS, BDI-II, STAI-Y1, STAI-Y2, and DERS. Components were retained based on eigenvalues and inspection of the scree plot. A biplot was generated to visualize the joint distribution of patients and scale loadings.
For exploratory purposes, a bidimensional stratification framework was adopted to investigate potential heterogeneity within the study population. One axis was defined a priori by the AEQ, as the primary construct under investigation. The second axis was selected post hoc among the remaining psychometric measures, based on its relative divergence from AEQ and its ability to capture a complementary dimension of pain-related amplification.
Both axes were dichotomized using median splits, which is acknowledged as a methodological limitation of this exploratory analysis.25,26 Values equal to the median were classified in the higher category. The resulting categorical variables were combined to generate four exploratory patient groups within a bidimensional framework. This stratification was data-driven, not predefined, and was intended solely for exploratory analyses rather than confirmatory classification.
Between-group differences across psychometric measures were assessed using Kruskal–Wallis tests, followed by Dwass–Steel–Critchlow–Fligner post-hoc comparisons when appropriate. Given the exploratory nature of this preliminary study, no multiple comparison correction (eg, Bonferroni) was applied.27 Effect sizes (ε2) were calculated for Kruskal–Wallis tests.
All tests were two-tailed, and statistical significance was set at p < 0.05. All statistical analyses were performed using jamovi (version 2.6). Descriptive statistics, non-parametric tests, and correlation analyses were conducted using the jamovi base module (jmv). Exploratory factor analysis, including the Kaiser–Meyer–Olkin measure, Bartlett’s test of sphericity, and parallel analysis, was performed using the psych R package within jamovi. Graphical visualizations were generated using the scatr module for jamovi.28
Results
Sample Characteristics
A total of 107 consecutive patients with fibromyalgia were included in the analysis. The mean age was 56.8 ± 11.0 years, and the sample was predominantly female, with 90.7% of participants being women. Most patients were unemployed or retired (65.4%), and the majority had a middle or high school level of education. Most participants were married or in a stable relationship (69.2%), although 20.6% reported living alone.
Pain was long-standing and severe. Nearly half of the sample reported a pain duration longer than 10 years, and more than two-thirds had experienced pain for over five years. Pain intensity was high, with a median VAS score of 8.0 (IQR = 3.0). Pain distribution was heterogeneous, with spinal pain being the most frequently reported primary location, followed by girdle and widespread pain.
Lifestyle indicators showed a largely sedentary profile, with 57.0% of patients reporting less than one hour of physical activity per week. Subjective sleep quality and overall quality of life were both low, with mean scores below the midpoint of the scale.
Psychosocial and relational variables revealed a high prevalence of emotional vulnerability. A large proportion of patients reported distress in response to perceived emotional distance (78.5%) and a history of abandonment, betrayal, or rejection (57.0%). Rapid and intense attachment tendencies were reported by 40.2% of the sample. Although most patients reported having social support available, the perceived level of emotional support showed wide variability.
Regarding mental health and pharmacological treatments, 13.1% of patients were engaged in psychotherapy at the time of assessment, while more than half were receiving psychotropic medications (SSRI, SNRI, gabapentinoids, benzodiazepines, medical cannabis). Analgesic and adjuvant medication use was frequent, including opioids, paracetamol, NSAID and muscle relaxants.
All demographic, clinical, psychosocial, and treatment-related characteristics are summarized in Table 1.
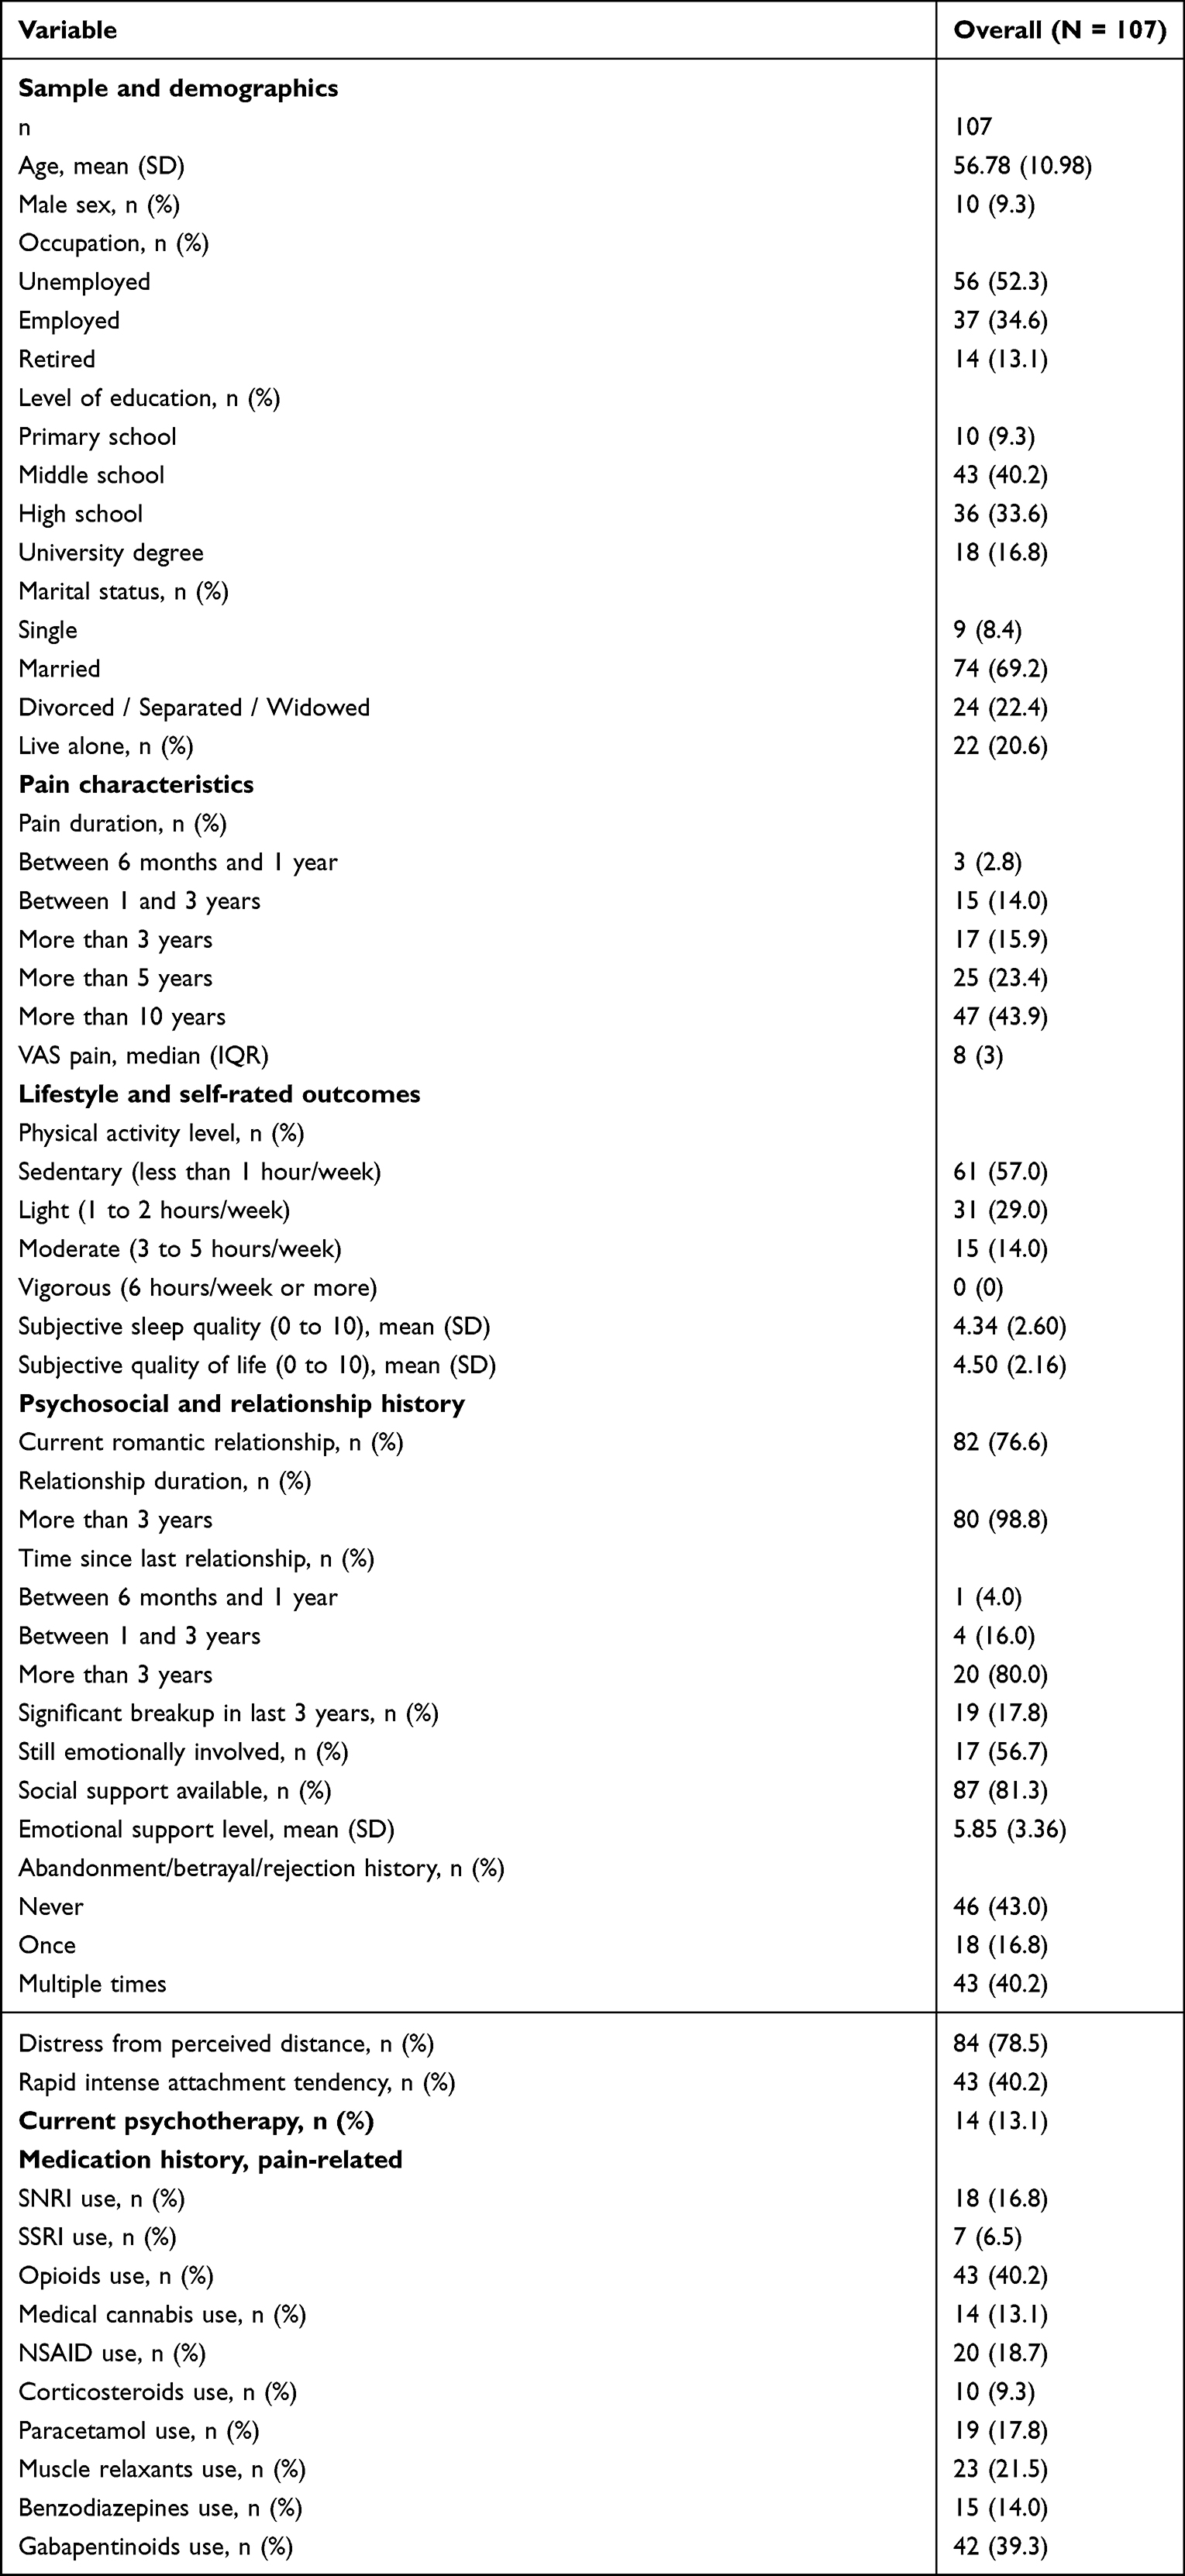 |
Table 1 Baseline Demographic, Clinical, Psychosocial, and Treatment Characteristics of the Study Sample (N = 107) |
Descriptive Statistics of Psychometric Instruments
Descriptive statistics of all psychometric instruments are reported in Table 2. AEQ total scores showed wide variability (median 16, range 1–44), while CSI scores were consistently elevated (median 61, range 24–92), indicating a substantial burden of central sensitization in the sample.
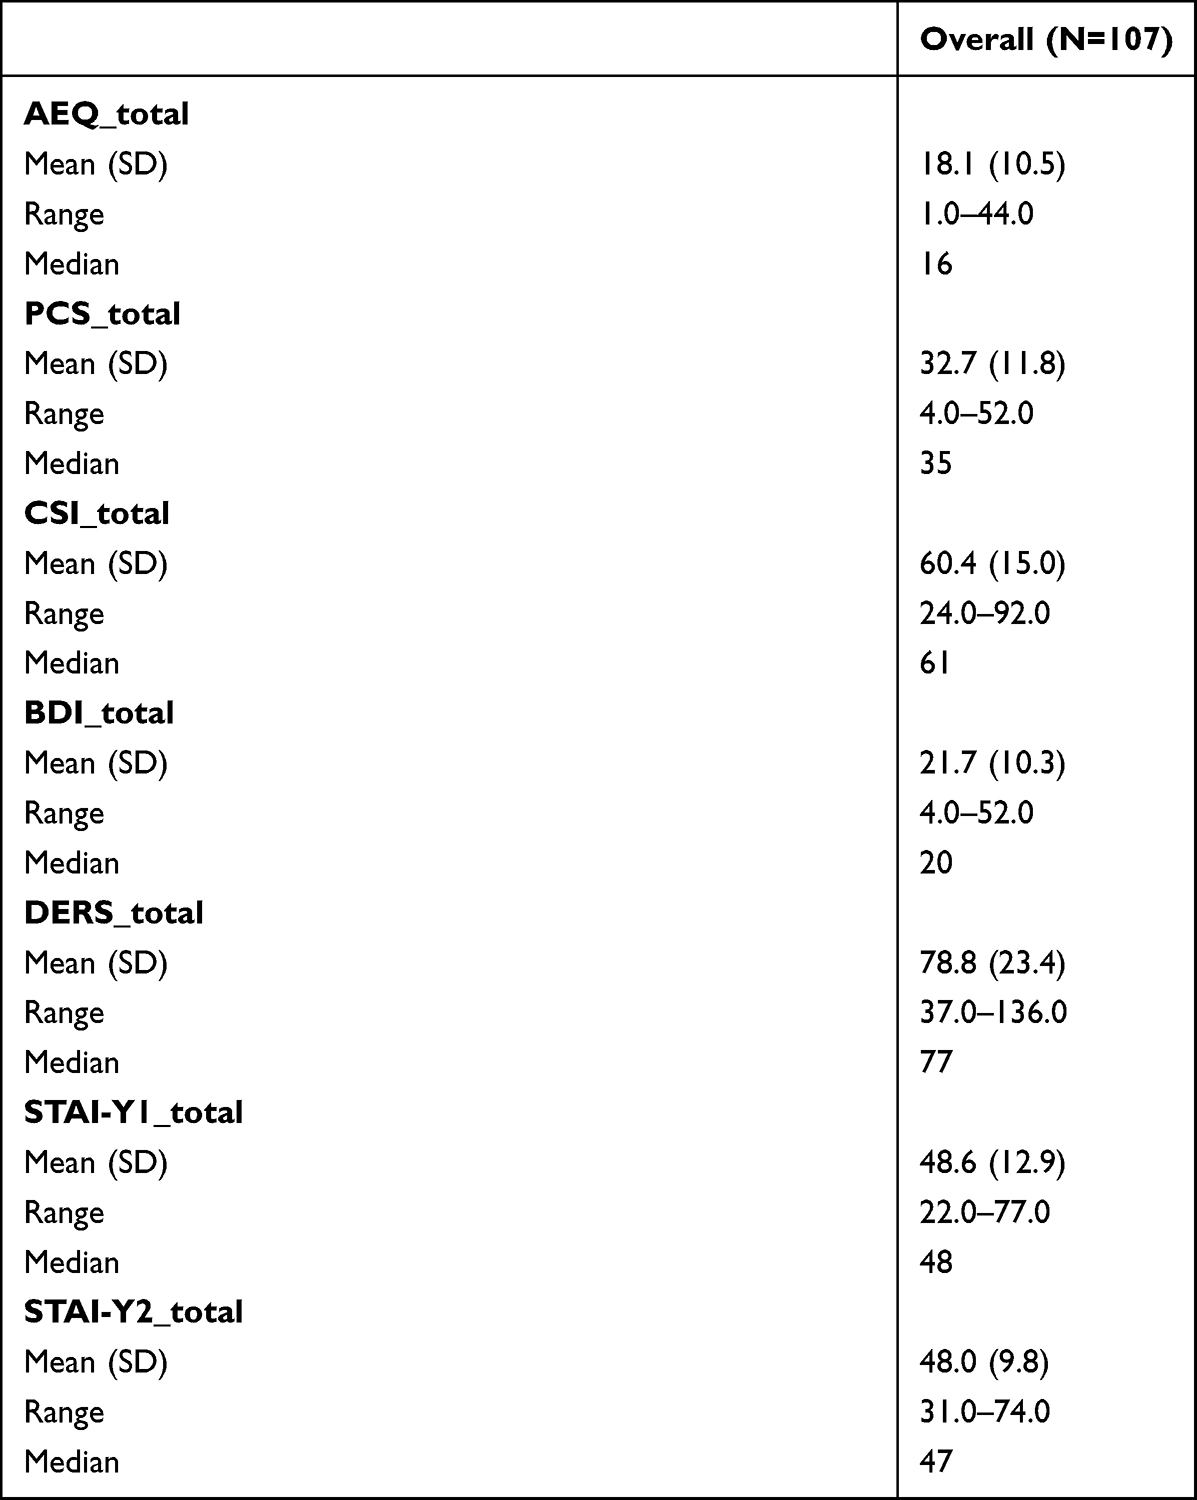 |
Table 2 Descriptive Statistics of Psychometric Instruments |
Reliability and Internal Structure of the AEQ
The AEQ showed excellent internal consistency, with a Cronbach’s alpha of 0.917. Full reliability statistics are reported in Tables 3 and S1.
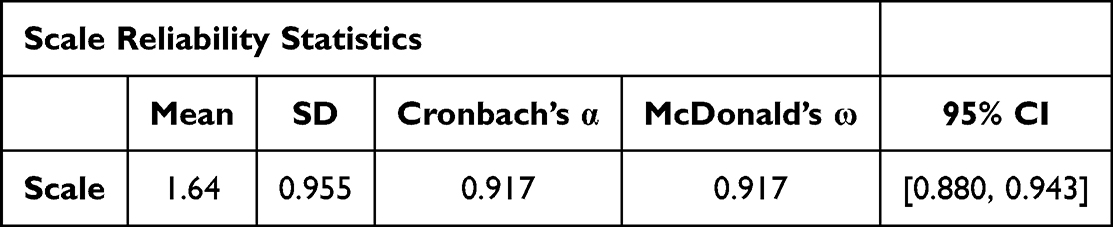 |
Table 3 Internal Consistency of the AEQ: Cronbach’s α with 95% Bootstrap Confidence Interval and McDonald’s ω |
Exploratory factor analysis was conducted to examine whether the AEQ captures a single underlying construct. Sampling adequacy was excellent, with a KMO value of 0.90 and a significant Bartlett’s test of sphericity. Parallel analysis and scree plot inspection supported a one-factor solution. All items loaded positively on the same latent factor, with loadings ranging from 0.55 to 0.86. This indicates that the AEQ measures a unified affective-relational dimension rather than multiple unrelated traits. Factor loadings and adequacy indices are presented in Tables 4A, B and S2, and the scree plot is shown in Figure 3.
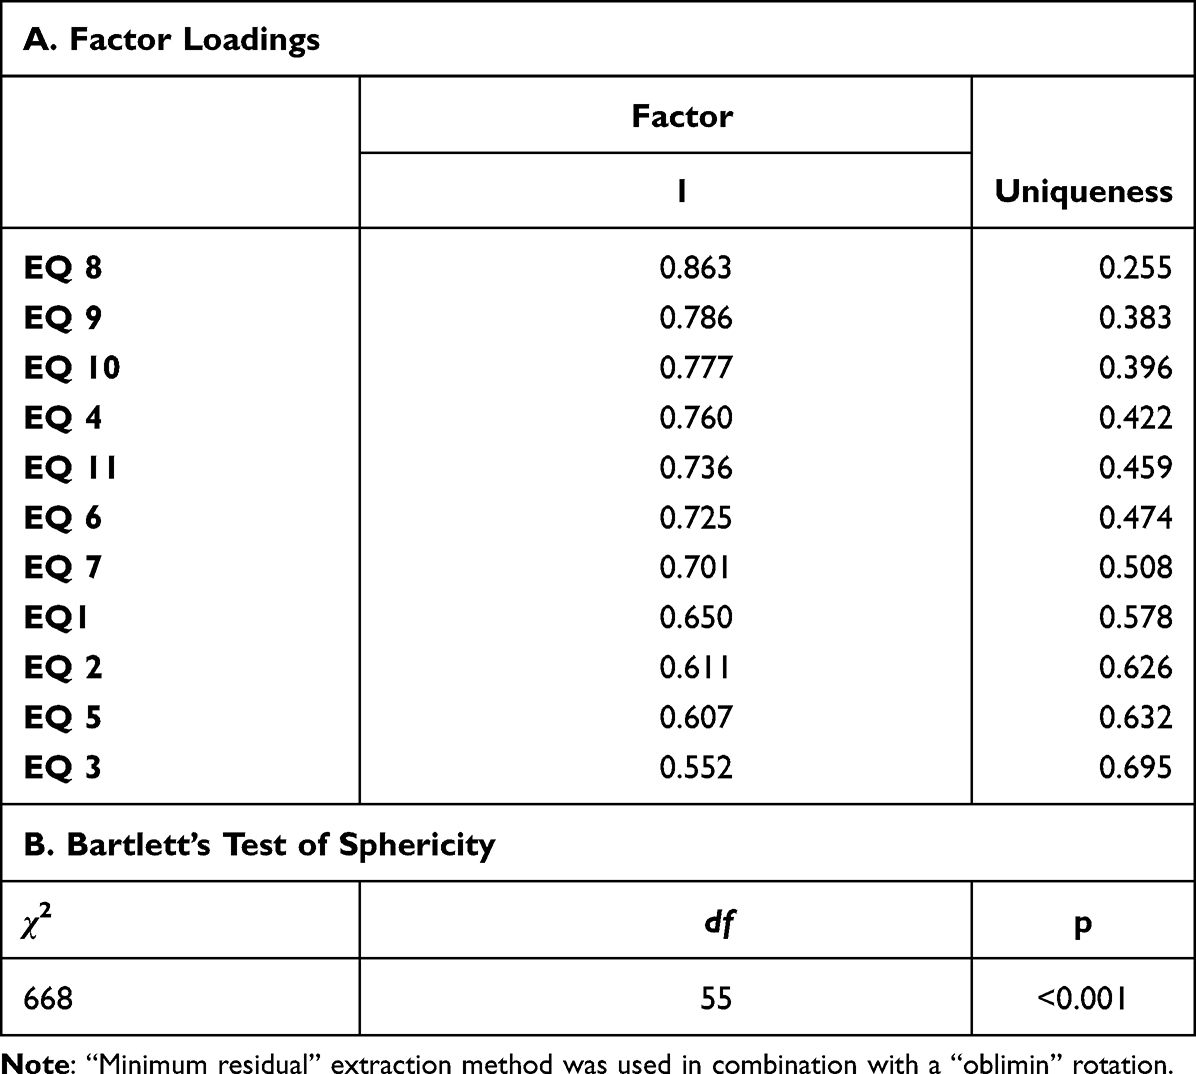 |
Table 4 Exploratory Factor Analysis of the AEQ Items |
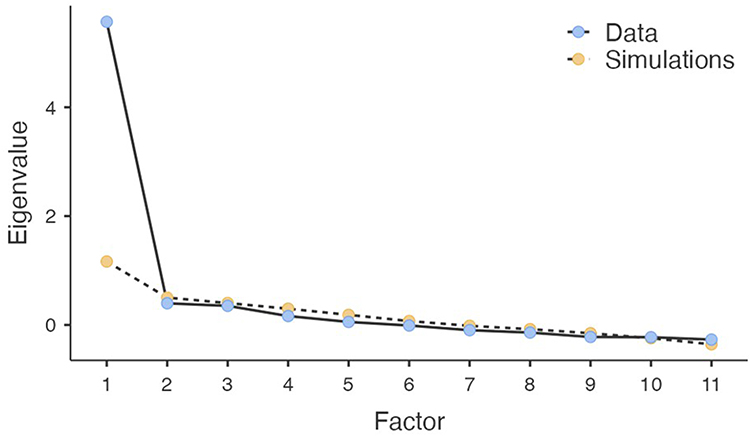 |
Figure 3 Scree plot and parallel analysis for AEQ items. Blue filled circles: observed eigenvalues. Yellow filled circles: mean eigenvalues from 1000 simulated datasets (parallel analysis). |
Confirmatory Factor Analysis
To further examine the factorial structure of the AEQ in a confirmatory framework, a single-factor CFA model was tested.
The baseline model yielded adequate fit for SRMR (0.058) but suboptimal values for CFI (0.892), TLI (0.866), and RMSEA (0.122, 90% CI: 0.095–0.150). Inspection of modification indices revealed a substantial residual covariance between items EQ10 (“minor relational situations leave a persistent sense of pain”) and EQ11 (“delayed reply causes feeling of exclusion”), which share highly overlapping content regarding responses to delayed digital communication.
Freeing this residual covariance on theoretical grounds yielded an improved model: CFI = 0.924, TLI = 0.903, SRMR = 0.055, and RMSEA = 0.104 (90% CI: 0.074–0.133). While CFI and TLI met conventional thresholds, RMSEA remained above the 0.08 cutoff. Taken together, these results offer partial support for a unidimensional structure and should be interpreted as preliminary, consistent with the exploratory single-sample design.
All standardized factor loadings were statistically significant (all p <0.001) and ranged from 0.534 (EQ3) to 0.867 (EQ8), confirming that all items contributed meaningfully to the latent construct. CFA results are reported in Table S3A and S3B.
Relationship Between Emotional Allodynia and Established Psychological Dimensions
To assess convergent validity, AEQ scores were correlated with established measures of central sensitization, affective distress, and emotion regulation. Clinically meaningful associations were observed across multiple domains. In particular, AEQ showed its strongest correlations with DERS (ρ = 0.59) and PCS (ρ = 0.57); the comparatively weakest, though still significant, with CSI (ρ = 0.40). Full correlation matrix is reported in Table 5 and scatterplots are shown in Figure 4.
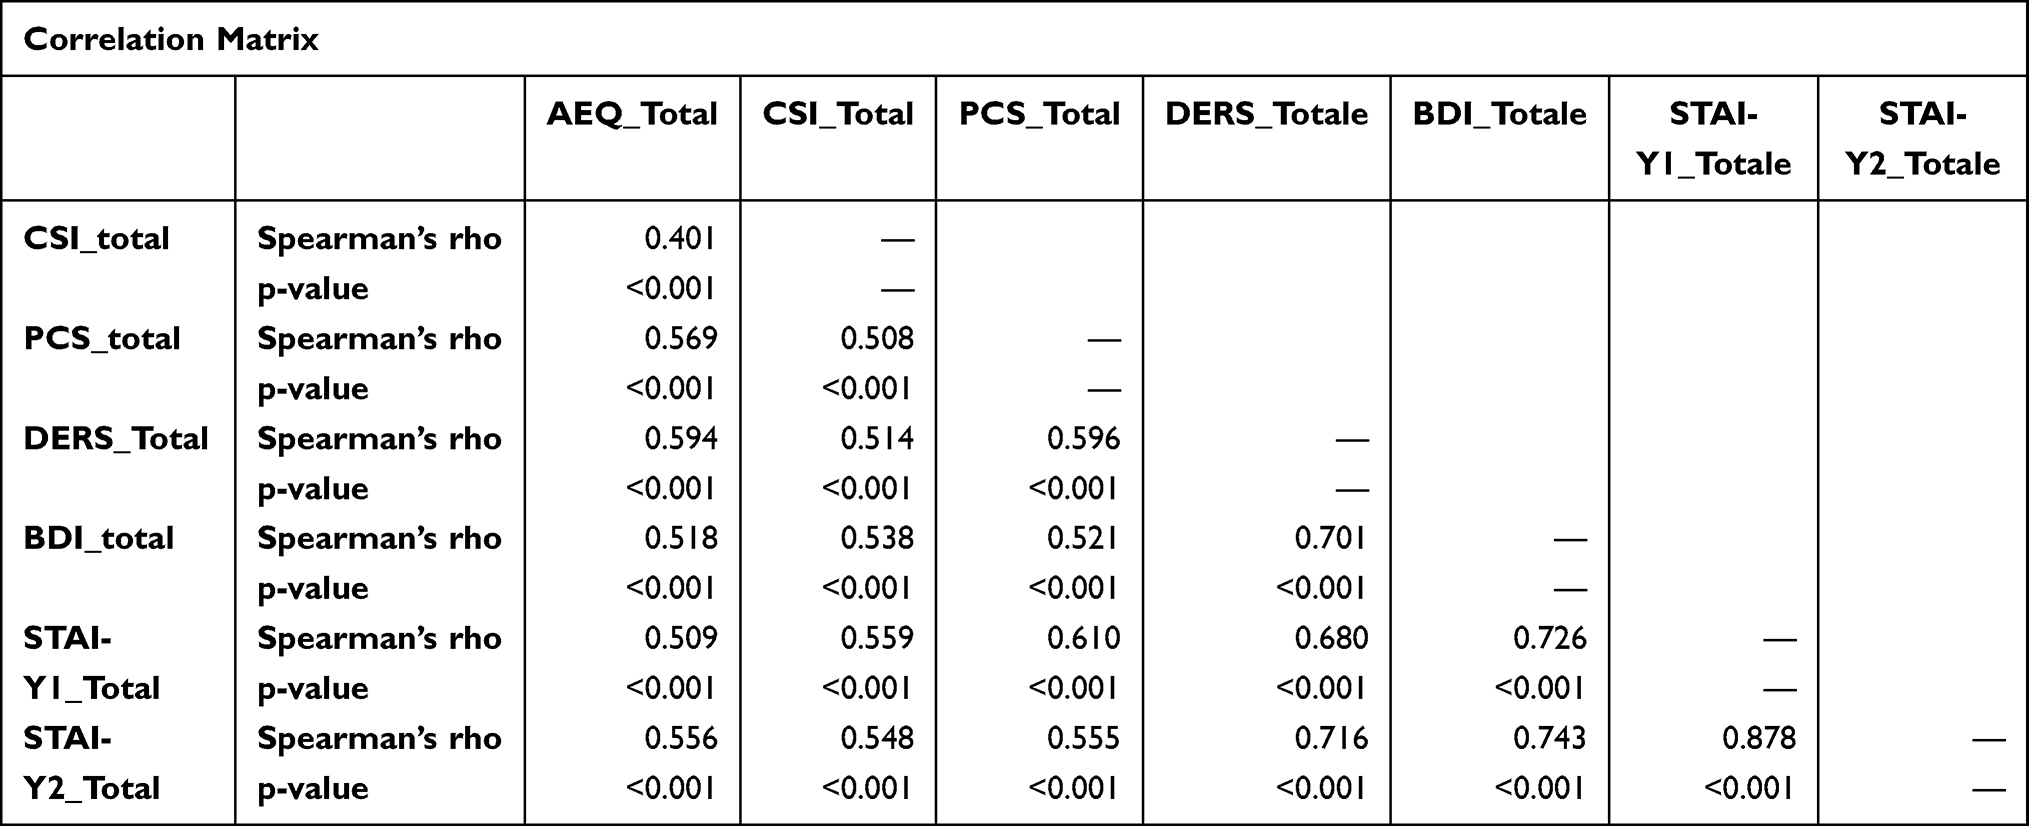 |
Table 5 Spearman Correlations Between AEQ and Psychological Scales |
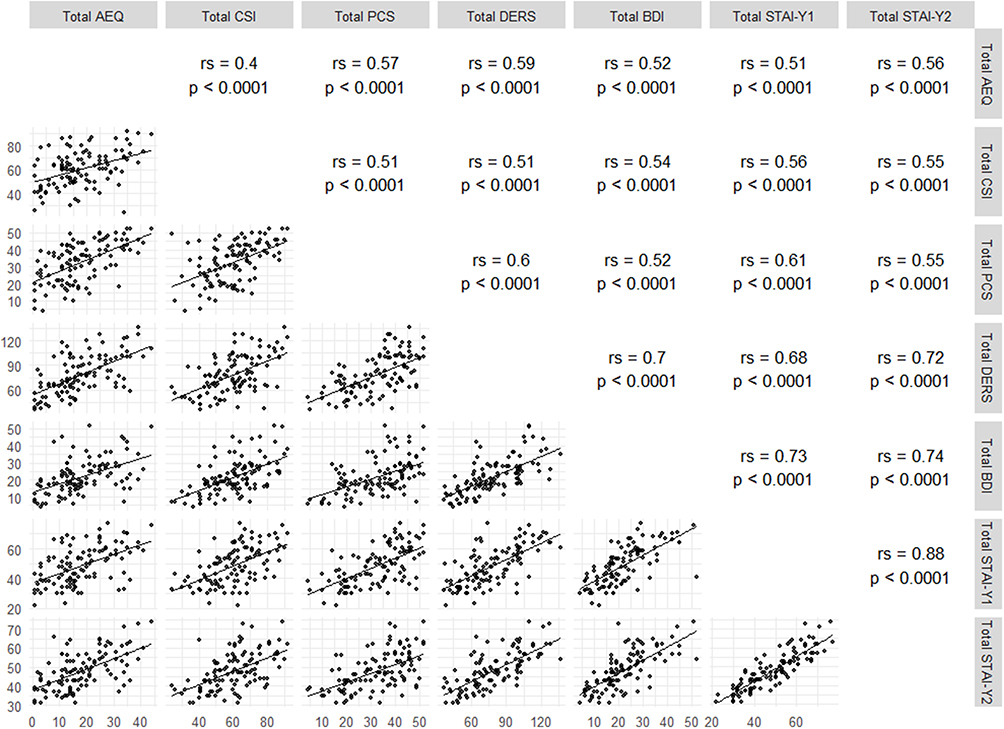 |
Figure 4 Scatterplot matrix of AEQ, CSI, PCS, DERS, BDI-II, and STAI-Y scores. Each dot represents one participant. Diagonal lines are Spearman regression lines. Upper panels show rs and p-values. |
Discriminant Validity of AEQ with Respect to DERS
To empirically address the potential conceptual overlap between AEQ and DERS, a cross-tabulation of median-split groups was performed. Despite a moderate Spearman correlation (ρ = 0.594, corresponding to 35% shared variance), 28 out of 107 patients (26.2%) showed dissociated profiles: 15 patients (14.0%) had high AEQ with low DERS, and 13 patients (12.1%) had low AEQ with high DERS (Table 6). This dissociation was statistically significant (χ2 = 24.3, df = 1, p <0.001), and indicates that a substantial proportion of patients exhibit elevated emotional-relational hypersensitivity in the absence of general emotion dysregulation, or vice versa. Furthermore, the AVE of the AEQ, calculated from standardized CFA loadings, was 0.506. This value exceeded the squared Spearman correlation between AEQ and DERS (0.5942 = 0.353), satisfying the Fornell-Larcker criterion for discriminant validity. These results should be interpreted as exploratory rather than as definitive evidence of discriminant validity, given the single-sample design and the application of the Fornell-Larcker criterion to a single comparator instrument.
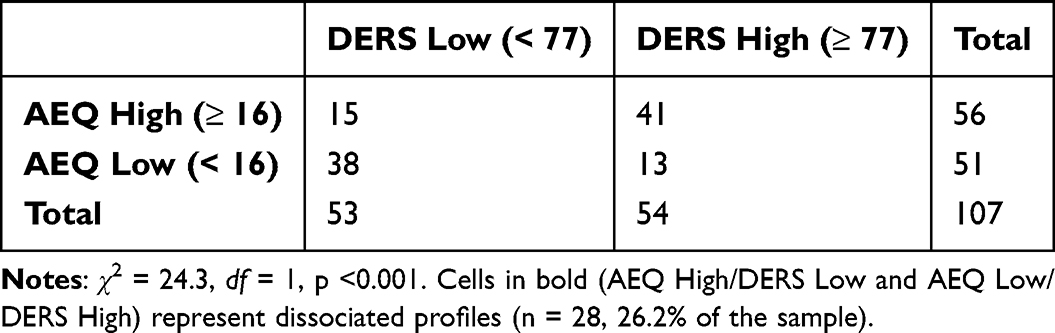 |
Table 6 Cross-Tabulation of AEQ and DERS Median-Split Groups (N = 107) |
A graphical visualization is provided in Figure 5.
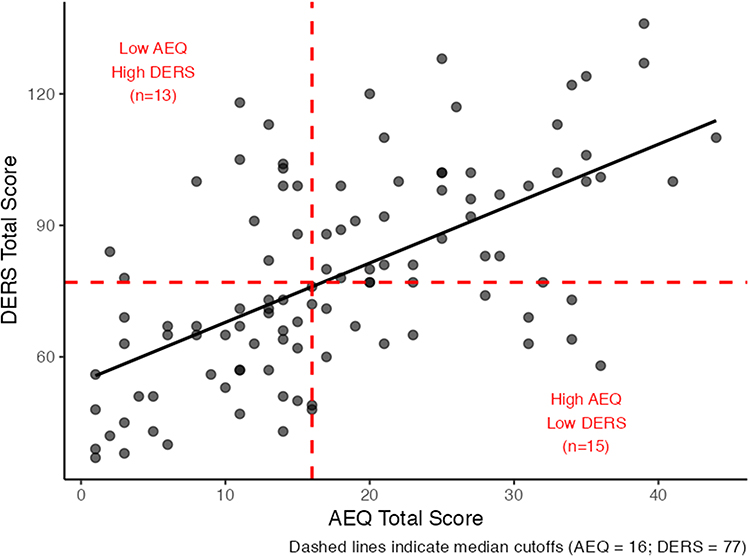 |
Figure 5 Scatterplot of AEQ versus DERS total scores. Dashed lines indicate median cutoffs (AEQ = 16; DERS = 77). Quadrants in red identify patients with dissociated profiles: High AEQ / Low DERS (n = 15) and Low AEQ / High DERS (n = 13), representing 26.2% of the sample. The regression line reflects the moderate Spearman correlation (ρ = 0.594), accounting for 35% of shared variance. |
Shared and Distinct Dimensions Across Psychological Scales
To explore the broader dimensional structure, a principal component analysis was performed on the total scores of all psychological instruments. A single principal component explained 65.9% of the total variance, reflecting a shared affective-sensitization dimension across scales. AEQ loaded strongly on this component, with a magnitude comparable to PCS and DERS.
The PCA biplot, shown in Figure 6, indicates that AEQ aligns with affective and sensitization-related measures, but its vector orientation suggests a specific relational-affective emphasis rather than a generic distress signal. PCA loadings are reported in Table 7A and B.
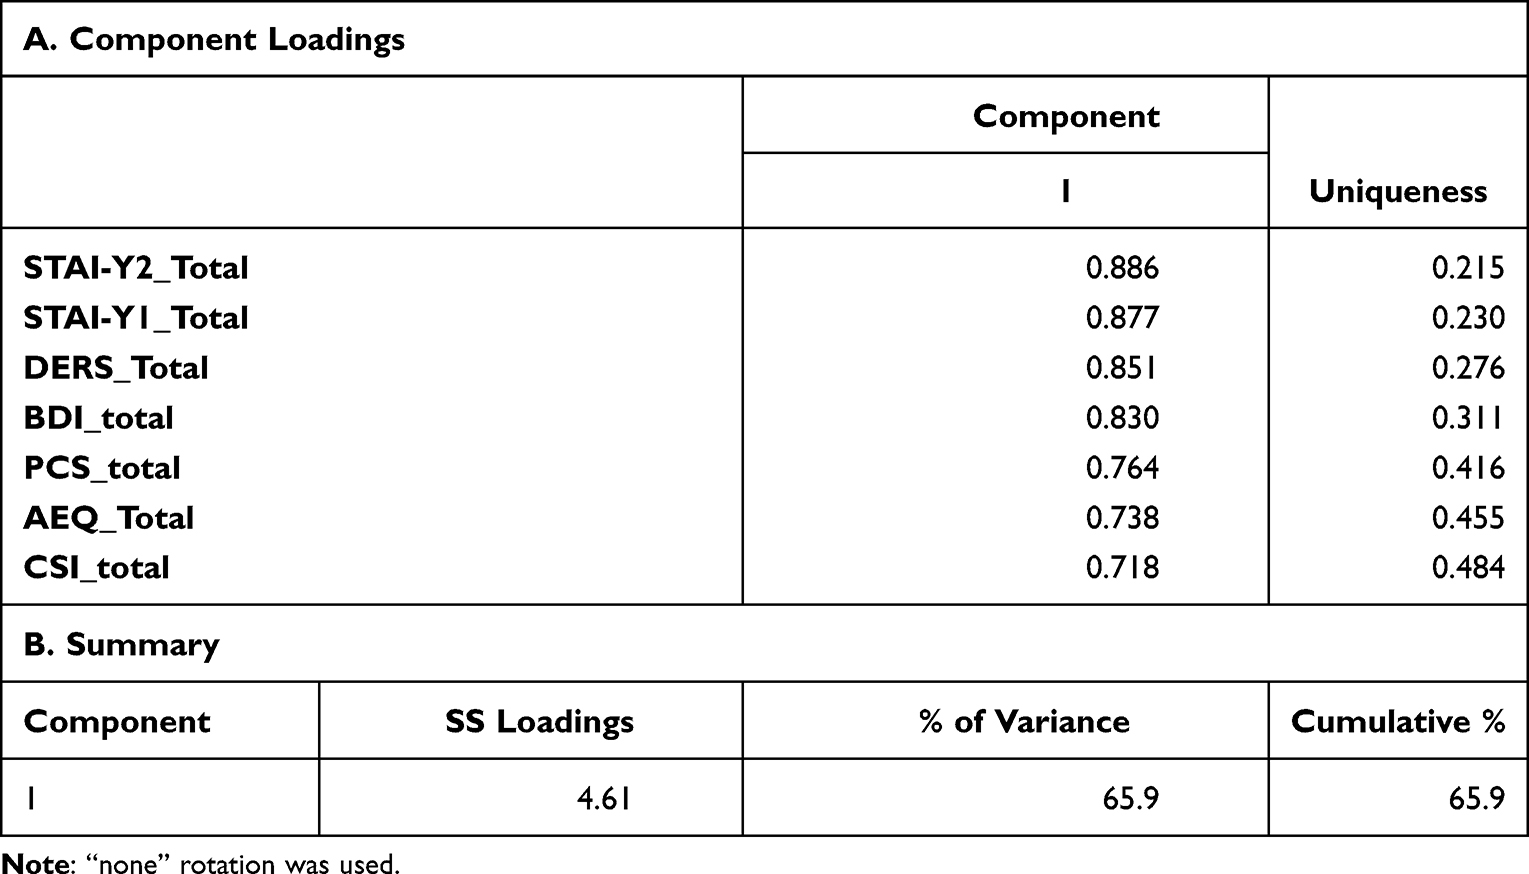 |
Table 7 PCA Loadings of Psychological Scales |
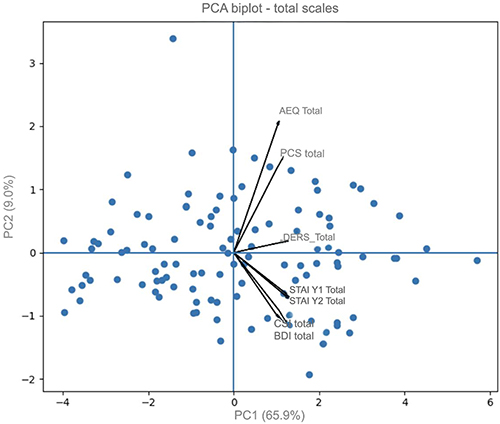 |
Figure 6 PCA biplot of total scale scores. Each blue circle represents one participant. A single principal component accounted for 65.9% of total variance, supporting a dominant shared affective-sensitization dimension. The biplot requires two axes for graphical representation; PC2 is displayed as a technical requirement of the visualization format and is not interpreted as a meaningful independent dimension. |
Phenotypic Stratification Based on Emotional and Central Sensitization
To translate these dimensions into clinically meaningful profiles, patients were stratified using median cutoffs of AEQ and CSI scores. This approach yielded four phenotypes representing different combinations of emotional and central sensitization:
- Resilient phenotype: low AEQ, low CSI
- Emotional Allodynia phenotype: high AEQ, low CSI
- Central Sensitization phenotype: low AEQ, high CSI
- Mixed phenotype: high AEQ, high CSI
Group sizes and descriptive statistics for all psychological measures across phenotypes are shown in Table 8.
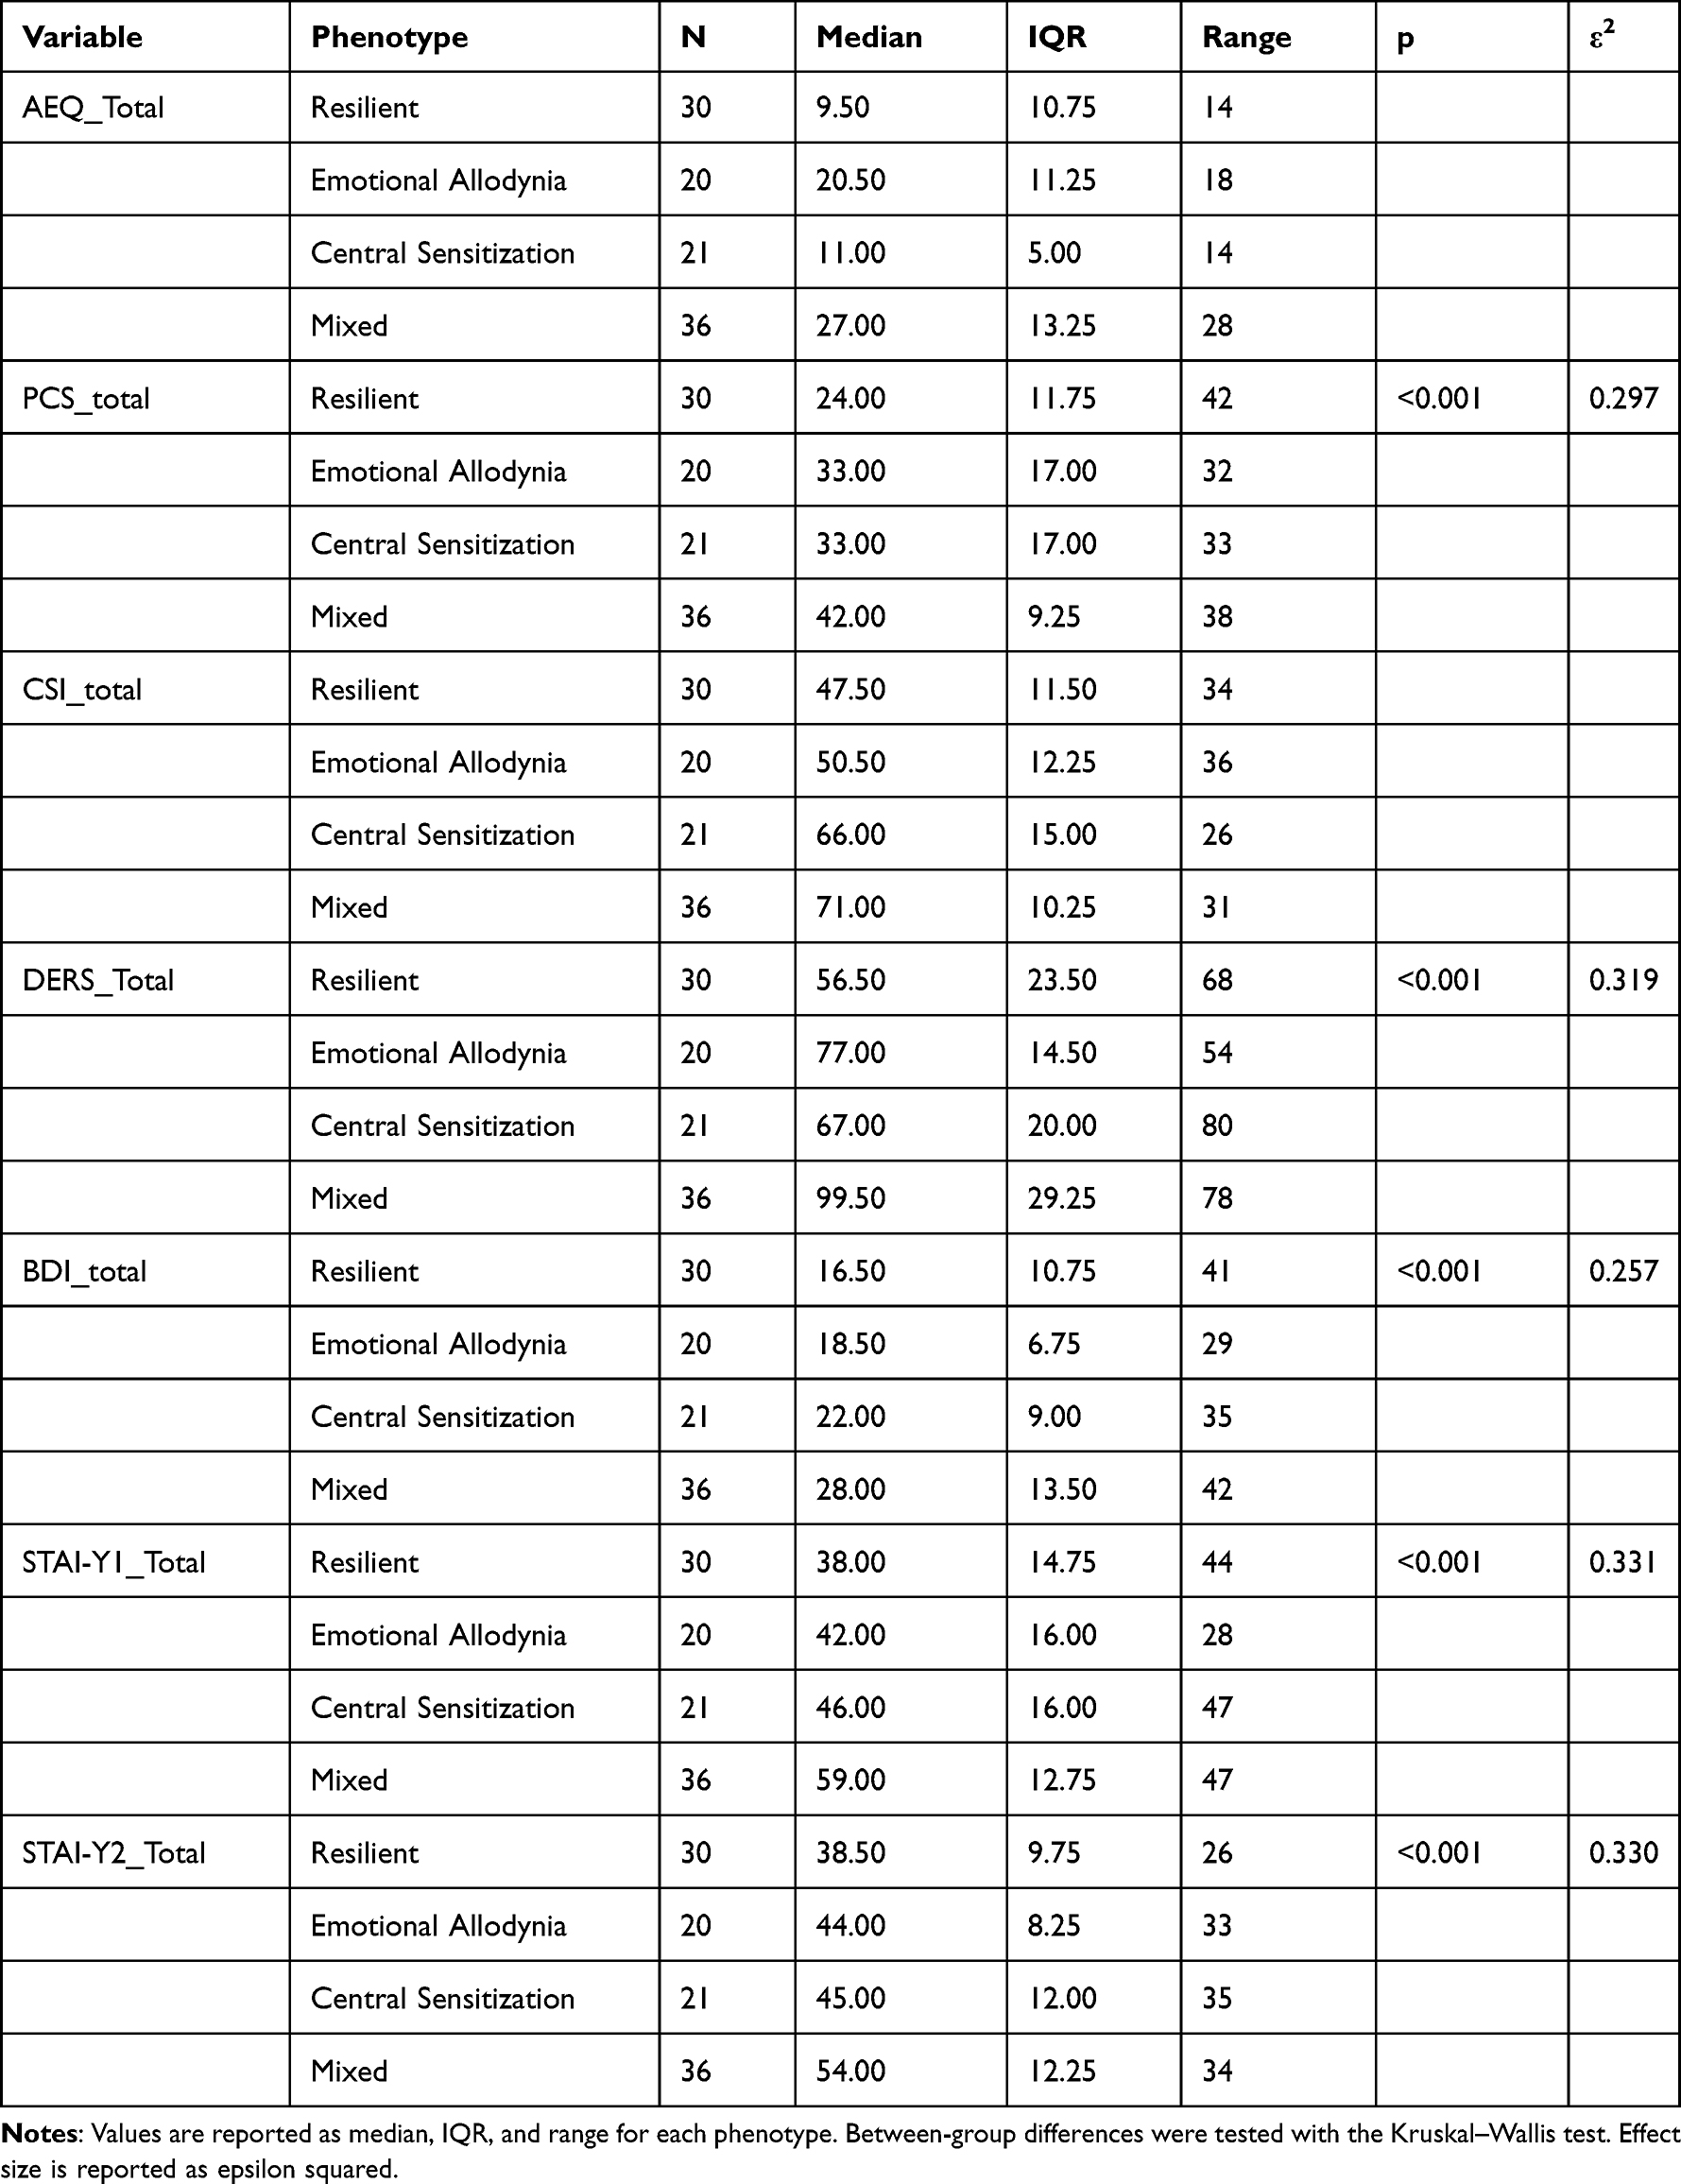 |
Table 8 Distribution of Psychometric Scores Across Pain Phenotypes Identified by AEQ and CSI |
Between-Phenotype Differences
Non-parametric Kruskal–Wallis analyses were performed to compare phenotypes across psychological measures not used for phenotype definition, including PCS, DERS, BDI-II, and STAI-Y scores. Significant between-group differences were observed across all these measures (all p < 0.001; Table 8), indicating that the exploratory phenotypes were associated with distinct affective and psychological profiles beyond the variables used for their construction.
Effect sizes were moderate to large, with the highest values observed for anxiety (STAI-Y1; ε2 = 0.331) and emotion dysregulation (DERS total score; ε2 = 0.319).
Post hoc pairwise comparisons demonstrated a consistent gradient. The mixed phenotype showed the highest levels of affective distress, emotion dysregulation, and central sensitization. The resilient phenotype showed the lowest scores across measures. EA and central sensitization phenotypes occupied intermediate positions and differed primarily in affective burden versus central sensitization load. Detailed pairwise results are reported in Table S4A–S4G. Group distributions are visualized using boxplots in Figures 7–13.
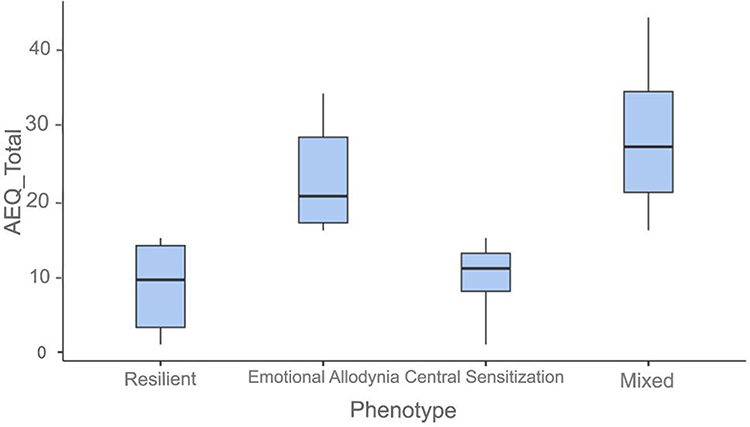 |
Figure 7 AEQ total by phenotype. Box: IQR. Line: median. Whiskers: 1.5 × IQR. Filled circles (●): outliers. |
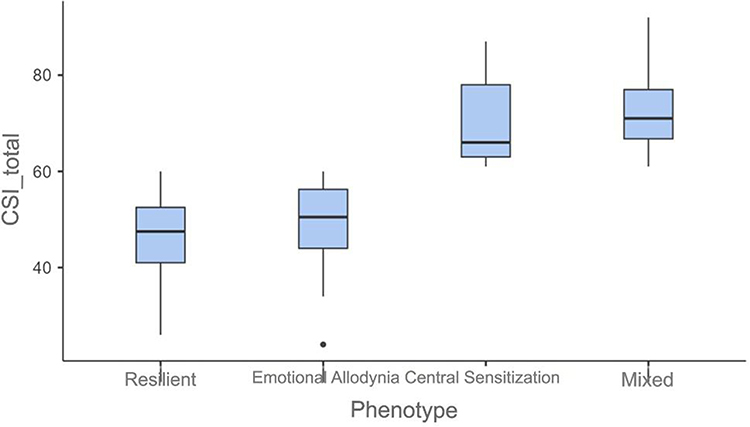 |
Figure 8 CSI total by phenotype. Box: IQR. Line: median. Whiskers: 1.5 × IQR. Filled circles (●): outliers. |
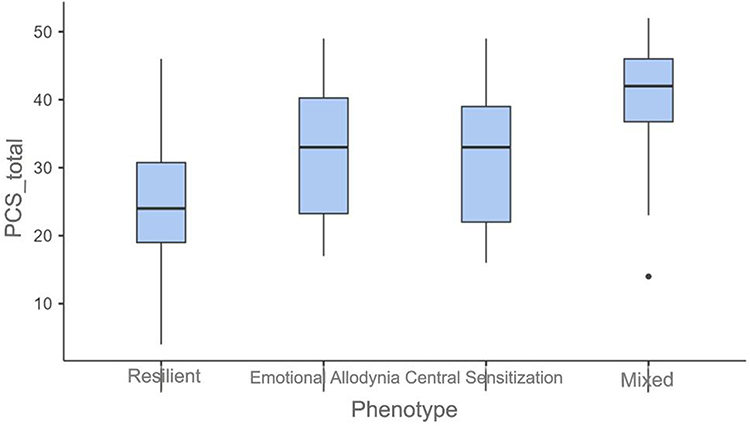 |
Figure 9 PCS total by phenotype. Box: IQR. Line: median. Whiskers: 1.5 × IQR. Filled circles (●): outliers. |
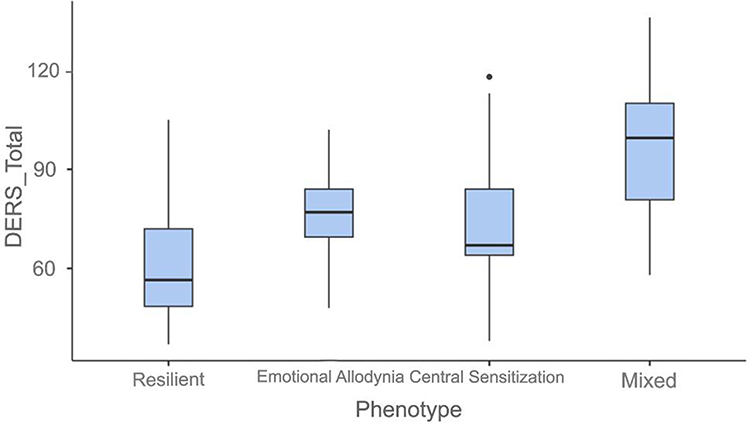 |
Figure 10 DERS total by phenotype. Box: IQR. Line: median. Whiskers: 1.5 × IQR. Filled circles (●): outliers. |
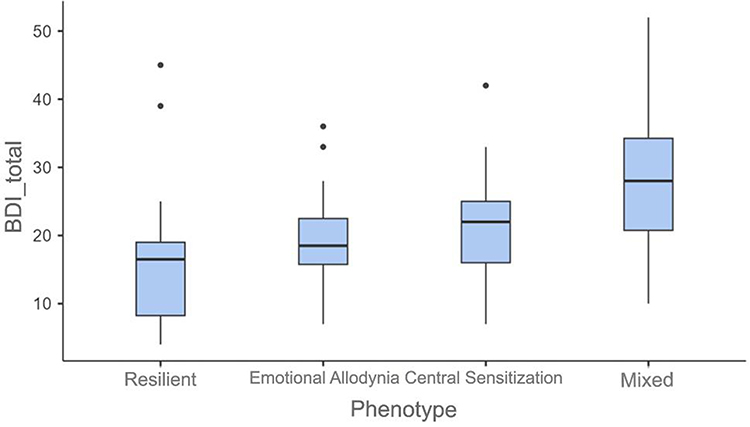 |
Figure 11 BDI-II total by phenotype. Box: IQR. Line: median. Whiskers: 1.5 × IQR. Filled circles (●): outliers. |
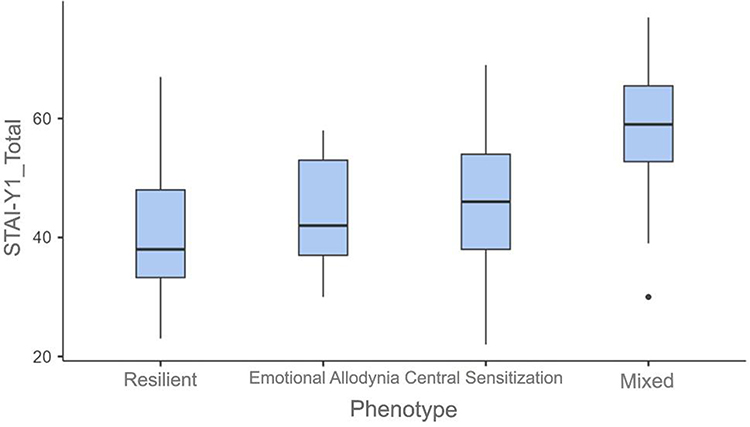 |
Figure 12 STAI-Y-1 scores by phenotype. Box: IQR. Line: median. Whiskers: 1.5 × IQR. Filled circles (●): outliers. |
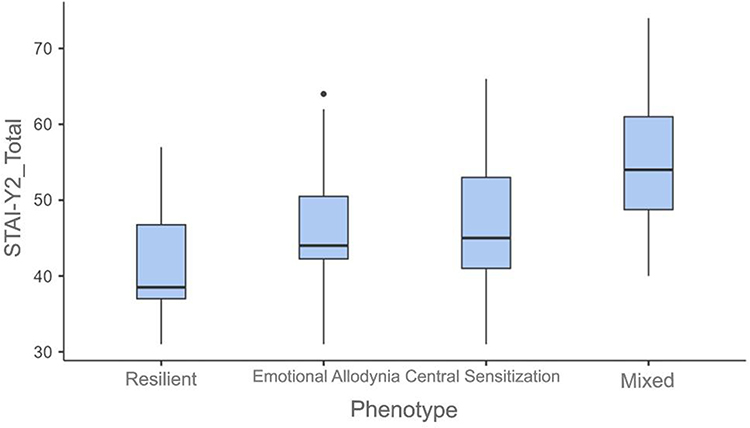 |
Figure 13 STAI-Y-2 scores by phenotype. Box: IQR. Line: median. Whiskers: 1.5 × IQR. Filled circles (●): outliers. |
Integrated Visualization of Emotional and Central Sensitization Dimensions
Finally, an integrated scatterplot of AEQ versus CSI scores is provided as a conceptual visualization of the bidimensional framework underlying the proposed phenotypic model. Rather than serving as a classification test, this figure illustrates how EA and central sensitization distribute continuously across patients and how different phenotypic profiles emerge from their interaction. The visualization is intended to support clinical interpretation rather than inferential validation (Figure 14).
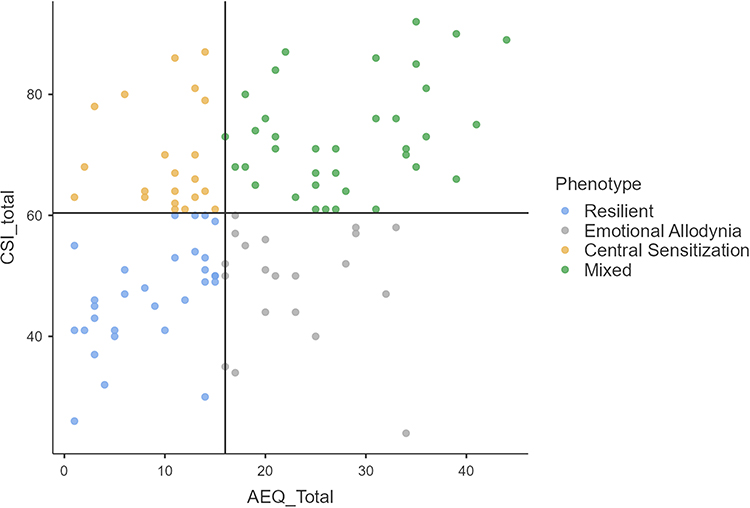 |
Figure 14 Exploratory scatterplot of AEQ versus CSI total scores. Each circle represents one participant, color-coded by exploratory phenotype. Vertical and horizontal lines indicate the median cutoffs (AEQ=16, CSI=61), used to define the four exploratory AEQ–CSI phenotypes. Points represent individual participants. |
Discussion
In this preliminary validation study, the AEQ demonstrated excellent internal consistency, with a Cronbach’s alpha of 0.917 and narrow confidence intervals, supporting its reliability. EFA, supported by parallel analysis, indicated a unidimensional structure, suggesting that the AEQ captures a coherent affective construct rather than a nonspecific index of psychological distress. Consistent and statistically significant associations were observed between AEQ scores and established measures of central sensitization, pain catastrophizing, depression, anxiety, and emotion regulation, while non-parametric group comparisons revealed marked differences across all psychological domains when combined AEQ–CSI profiles were stratified by patient group. These findings support the AEQ as a feasible and potentially informative instrument for assessment in nociplastic pain.
Unlike established instruments such as the PCS, CSI, and BDI-II, which were designed to assess pain-related cognitions, symptom burden, or depressive severity, respectively,2,3,29,30 the AEQ specifically targets affective reactivity to subtle interpersonal cues. Although interpersonal emotional processes are increasingly recognized as relevant modulators of chronic pain,31 they remain insufficiently operationalized in standard pain assessment. Recent network analysis evidence confirms that emotional variables, particularly depression, occupy a central and highly connected position within the fibromyalgia symptom network, mediating the relationship between psychological distress and pain burden,10 further supporting the need for instruments that specifically operationalize this affective dimension.
To further illustrate this distinction, Table 9 offers a conceptual comparison of instruments currently used in pain management, highlighting their clinical focus, methods, and inherent limitations.
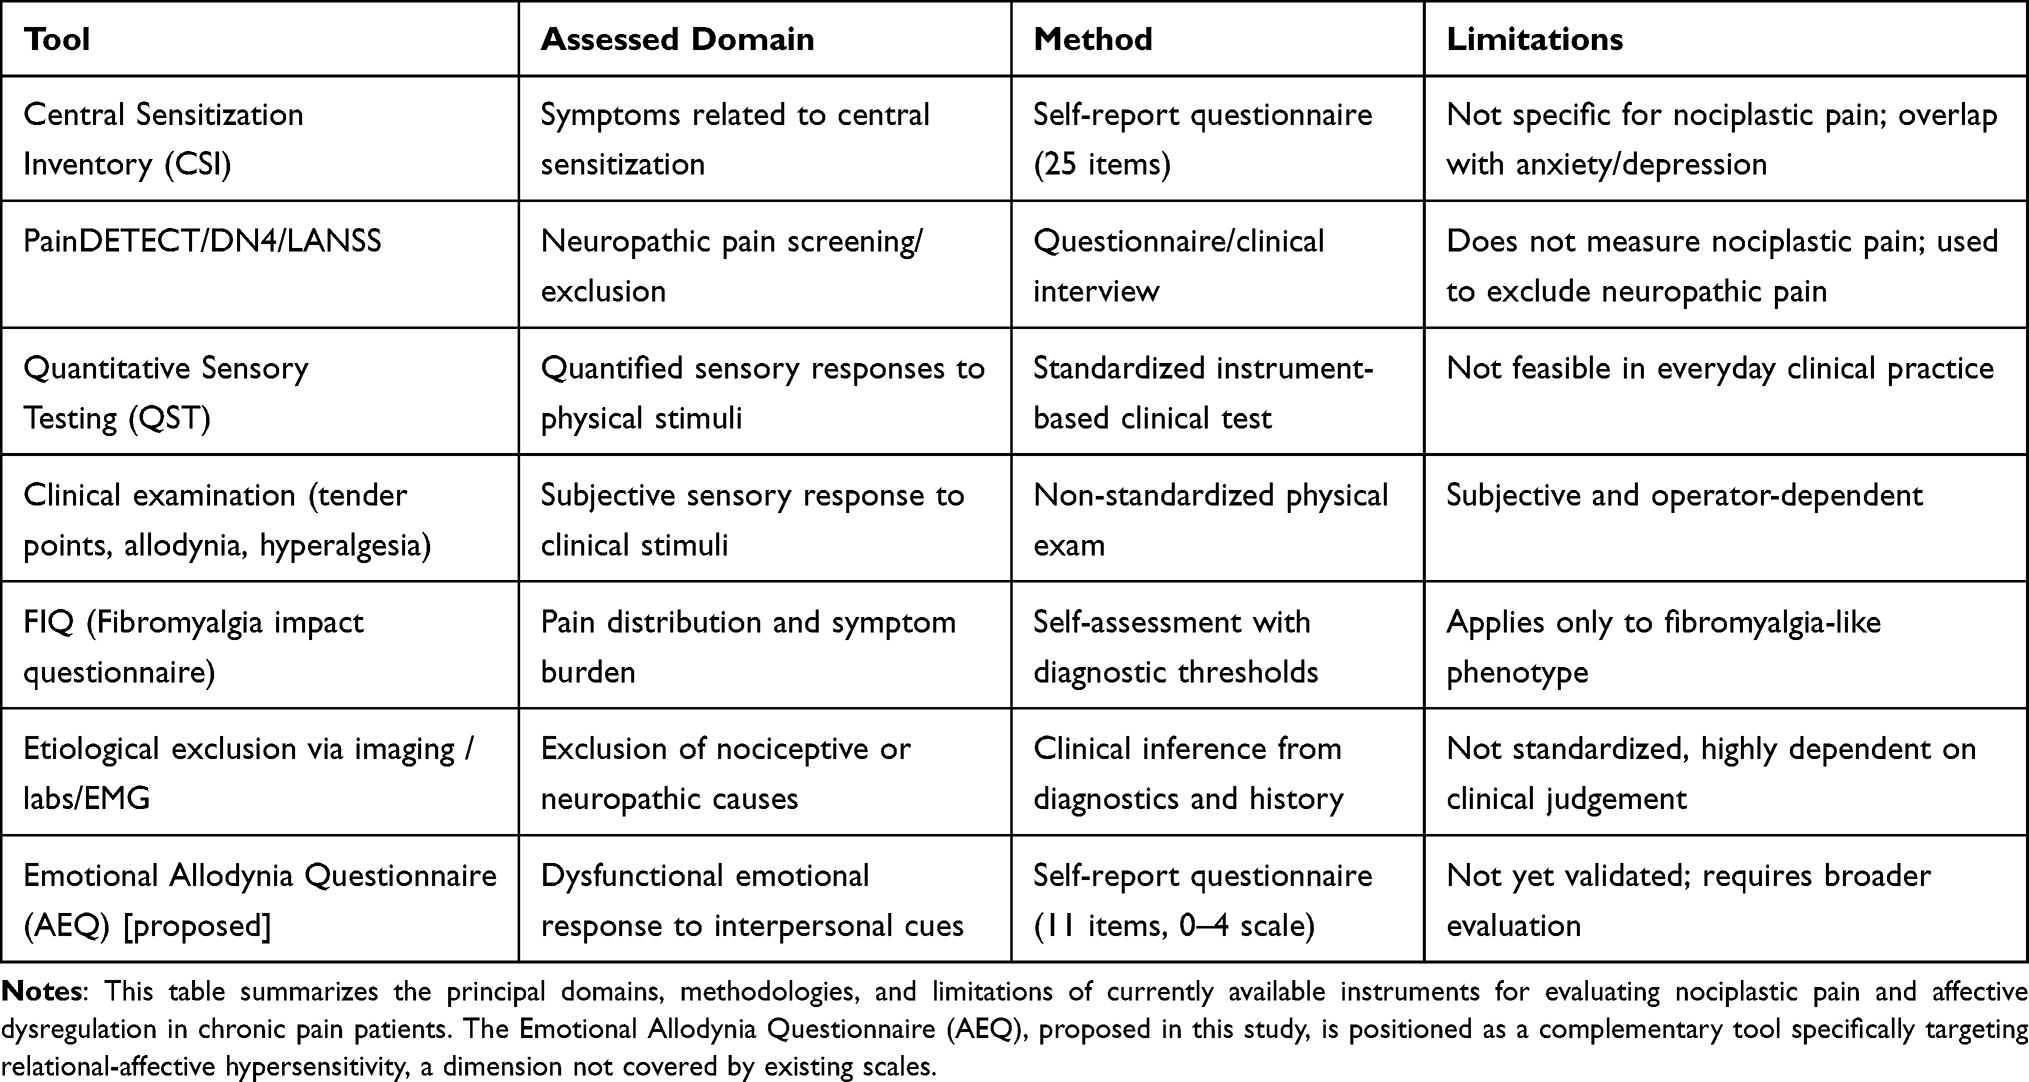 |
Table 9 Conceptual Comparison of Available Tools for Nociplastic Pain Assessment |
Furthermore, while small fiber neuropathy and quantitative sensory testing phenotypes have been described in fibromyalgia,32,33 to our knowledge, this study presents the first integrated emotional-central stratification using validated self-report measures (AEQ+CSI). This approach may offer greater clinical accessibility compared to biomarker or neuroimaging-based classifications, though its clinical utility requires prospective validation. Beyond conceptual differentiation, empirical support for the discriminant validity of the AEQ was obtained by examining its relationship with the DERS. Although a moderate correlation was observed (ρ = 0.594), this association accounts for only 35% of shared variance, leaving the majority of AEQ variance unexplained by general emotion dysregulation. Importantly, 26.2% of patients showed dissociated profiles, high AEQ with low DERS, or vice versa, demonstrating that affective relational hypersensitivity and general emotion regulation difficulties are related but not interchangeable constructs. This finding was further supported by the Fornell-Larcker criterion: the AVE of the AEQ (0.506) exceeded the squared correlation with the DERS (0.353), indicating that the AEQ captures more variance internally than it shares with general emotion dysregulation. Conceptually, the DERS measures the capacity to regulate emotional states once activated, the ability to modulate, accept, and control emotional responses across contexts. The AEQ, by contrast, measures the threshold at which emotional responses are triggered by low-intensity interpersonal stimuli. In other words, the DERS captures deficits in emotion regulation, while the AEQ captures hypersensitivity of emotional activation. A patient may retain adequate regulatory capacity while remaining selectively hypersensitive to relational cues of exclusion or diminished reciprocity. Conversely, general emotion dysregulation may occur without specific interpersonal hypersensitivity. These are adjacent but non-overlapping constructs.
Although EA shares a relational dimension with constructs such as rejection sensitivity34 and interpersonal sensitivity,35 the AEQ specifically operationalizes affective hypersensitivity within a chronic pain framework, conceptualizing it as a potential amplifier of nociplastic pain rather than a general personality trait. The AEQ may offer clinicians an additional interpretative framework for analyzing refractory or variable pain states that cannot be entirely explained by nociceptive input, anatomical disease, or mood disorders alone, serving to supplement rather than substitute for current psychometric instruments.
The AEQ construct closely resembles the IASP concept of nociplastic pain, characterized as pain resulting from altered nociception without clear evidence of tissue injury or somatosensory system dysfunction.1,7 In this light, the AEQ may offer a preliminary window into this domain. Fibromyalgia is the prototype of nociplastic pain disorder, marked by central sensitization, compromised descending inhibitory control, and recurrent emotional dysregulation.36,37 In this context, we tentatively propose that EA might be understood as a variant of affective nociplasticity, an empirical interpretive framework, in which typically neutral or low-intensity interpersonal cues provoke excessive emotional reactions that enhance pain perception and sustain symptom load. Neurobiological models that endorse a common pain-affect matrix, encompassing areas such as the anterior cingulate cortex, insula, and amygdala, further substantiate this notion.38
The decision to integrate AEQ and CSI scores into a bidimensional framework was data-driven. While both measures were related to central mechanisms of pain amplification, the CSI showed a pattern of partial divergence from EA, with several patients exhibiting high central sensitization in the absence of elevated affective hypersensitivity, and vice versa.
Two patients may have the same CSI score while differing substantially in how they emotionally process and experience pain. Therefore, two orthogonal dimensions were used to explore clinically meaningful profiles rather than a single composite index, leading to four distinct phenotypic profiles: resilient, central sensitization, emotional allodynia, and mixed phenotypes. These profiles differed across multiple psychological measures, including depressive symptoms, anxiety, catastrophizing, and emotion regulation, as observed in between-group comparisons. These differences should be interpreted as exploratory and hypothesis-generating rather than confirmatory evidence of stable clinical subtypes.
It is important to understand that these phenotypes should not be seen as unchanging or permanent patient groups. Instead, they show how clinical conditions change with the body’s state and the main mechanisms by which pain persists over time. Given the fluctuating nature of fibromyalgia and nociplastic pain, transitions between phenotypes over time are expected and may themselves carry prognostic or therapeutic relevance. From this viewpoint, phenotypic variability needs to be considered an intrinsic characteristic of the model rather than a limitation.
EA appears to be variably expressed among patients with fibromyalgia, supporting its role as a modulatory dimension rather than a ubiquitous feature of the condition.
From a translational standpoint, the phenotypes generated by the integrated AEQ–CSI framework may be directly correlated with several treatment techniques, as shown in the suggested phenotype-driven therapeutic framework for chronic pain management in fibromyalgia (Table 10). This table represents a clinical hypothesis derived from the phenotypic profiles and should not be interpreted as empirically validated treatment guidelines; no treatment-response, prognostic, or longitudinal data are available to support these recommendations at this stage. However, these assumptions may represent a call to action for the pain physician to act in coordination with a multidisciplinary team, especially in mixed phenotypes, where unidimensional treatments are prone to failure, and meticulous follow-up is crucial.
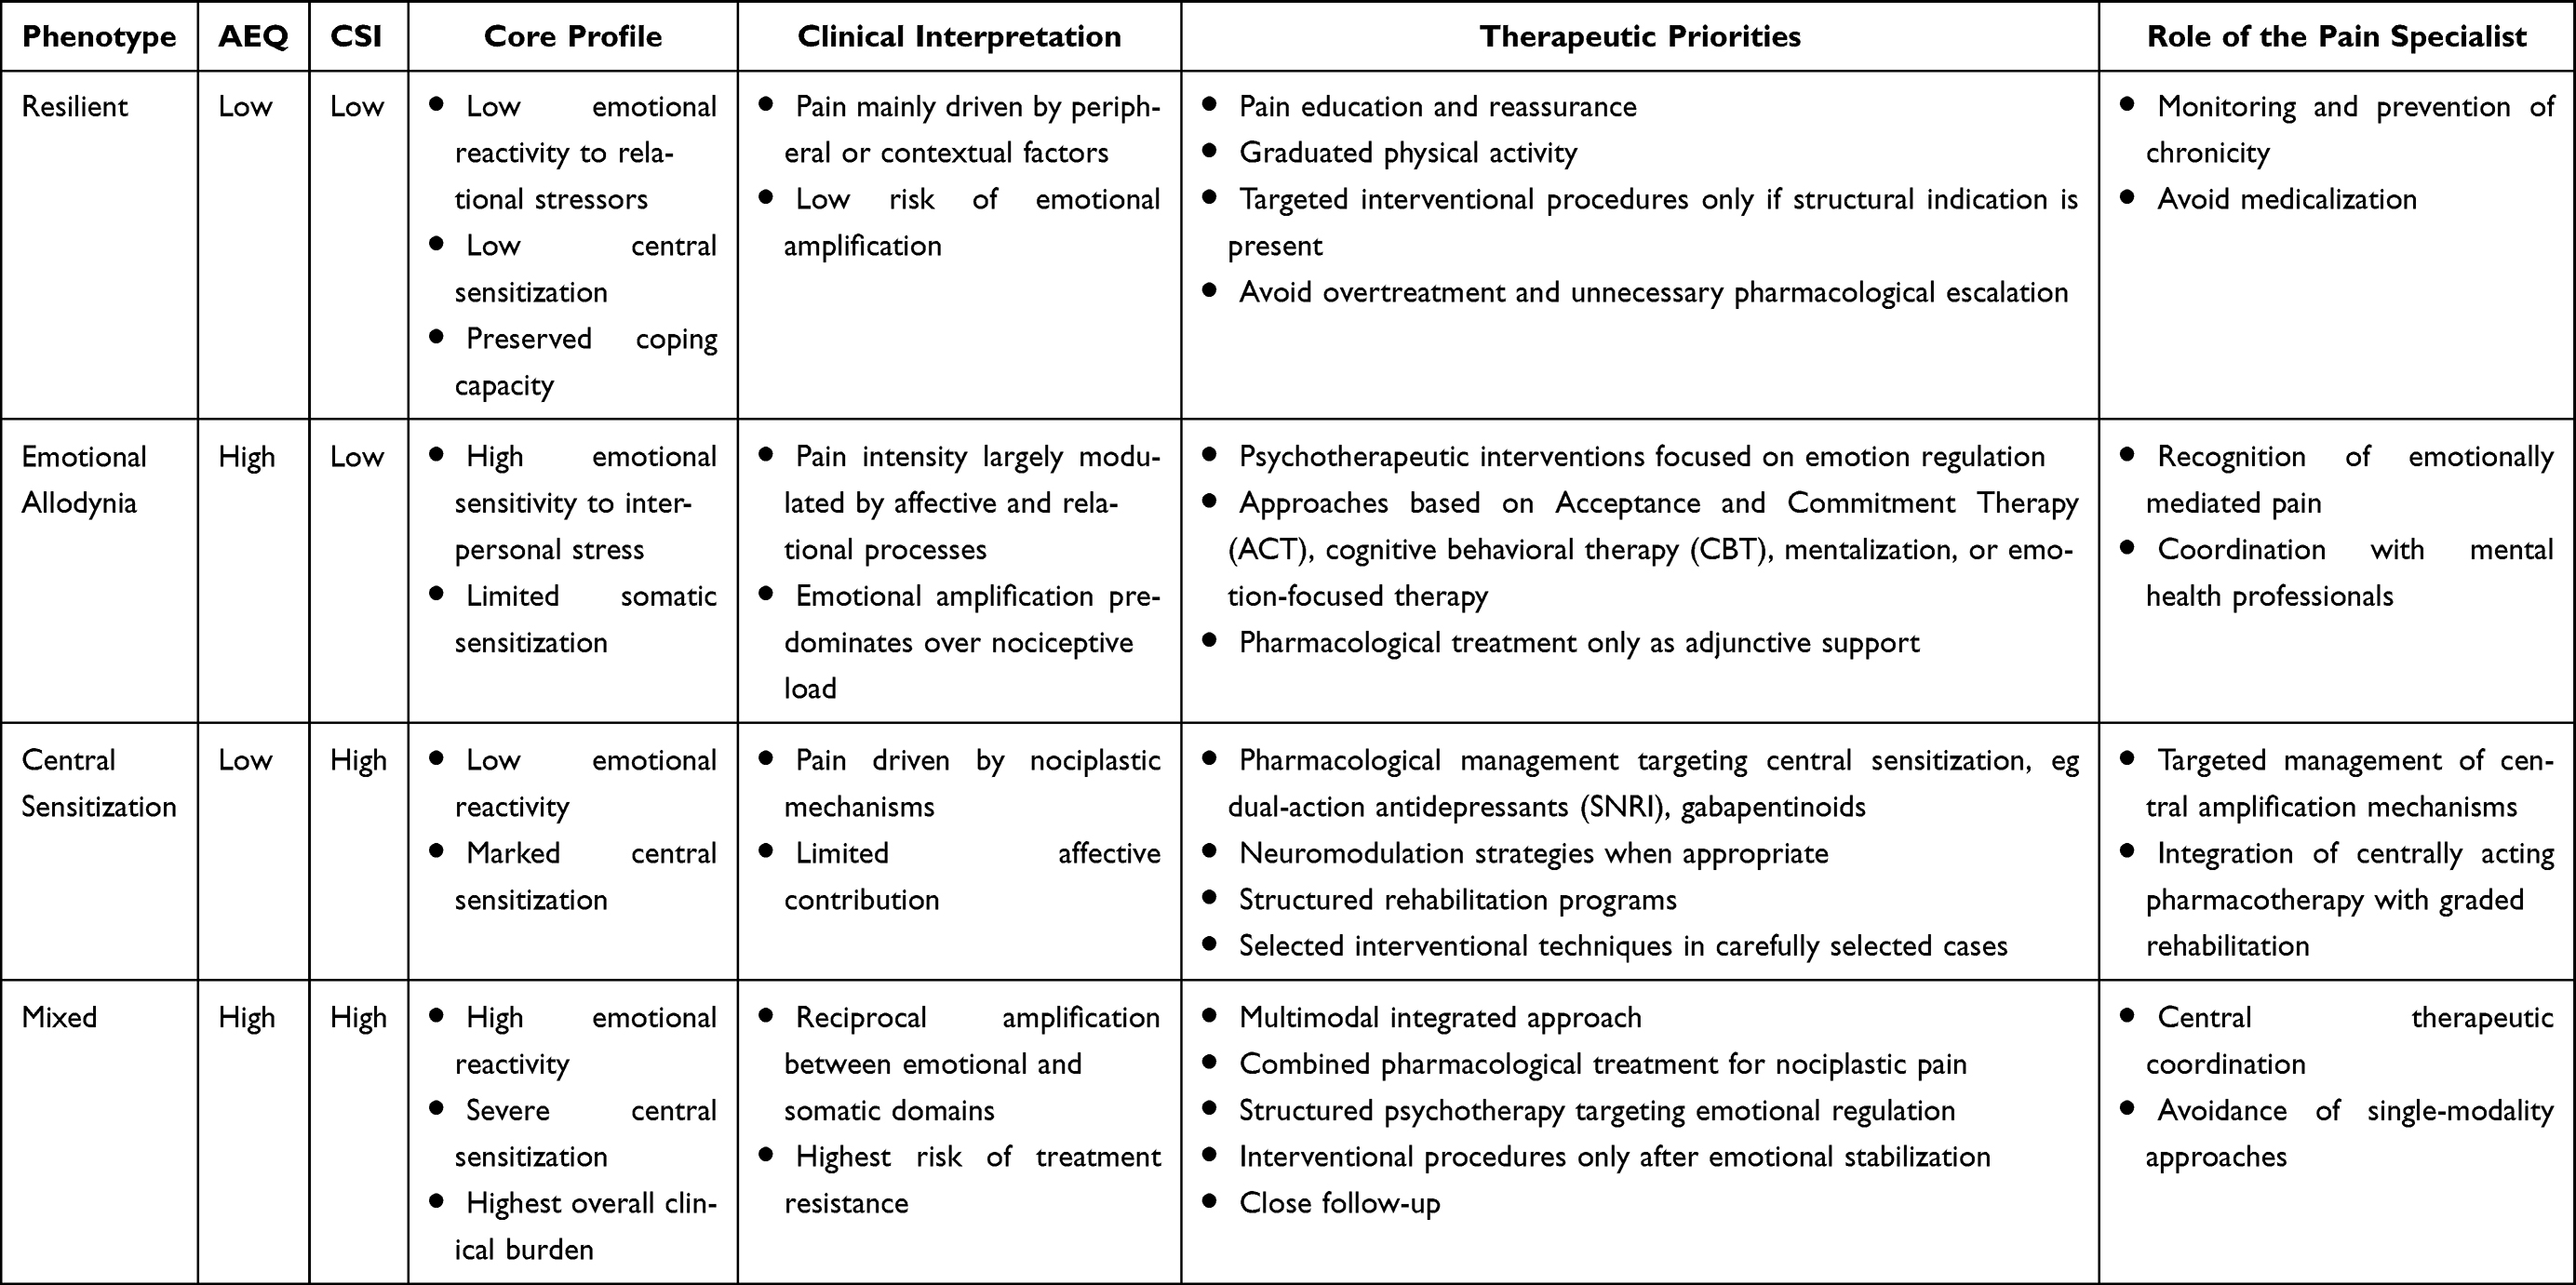 |
Table 10 Conceptual Phenotype-Driven Therapeutic Framework Based on Exploratory Profiles for Chronic Pain Management in Fibromyalgia |
This study has several limitations. Its cross-sectional design and single-center setting limit causal inference and generalizability. Although the present analyses are exploratory, they were conducted within a clinically well-characterized fibromyalgia cohort using established psychometric standards. No test-retest reliability data have been collected, which is standard for initial validation studies focusing on internal structure and convergent validity.39
Regarding the psychiatric exclusion criteria, severe diagnoses such as psychotic disorders, schizophrenia, and bipolar disorder were excluded to avoid confounding from fundamental alterations in social cognition and emotional processing that would compromise the measurement of affective-relational hypersensitivity as a distinct construct. Depressive and panic disorders were retained because they represent the most prevalent affective comorbidities in fibromyalgia,40,41 and their exclusion would have compromised ecological validity for an instrument designed for routine pain clinic use. Given that depressive symptomatology may nonetheless act as a confounding variable, stratification by depressive severity is planned in the full PEARL cohort analysis to further examine its potential moderating role.
Questionnaires were self-administered in paper format during the outpatient clinical visit. A physician was available for clarification upon request and verified completeness before data entry. Although this approach minimizes social desirability bias associated with researcher-directed administration, the clinical setting may introduce a modest degree of response bias that should be considered when interpreting the findings.
The residual covariance between EQ10 and EQ11 identified in the CFA warrants attention beyond its role as a modeling adjustment. Both items address emotional responses to delayed digital communication, and their content overlap may reflect either a substantively meaningful dimension of contemporary relational allodynia, the messaging latency as an interpersonal stressor, or item redundancy that reduces psychometric efficiency. Future refinement of the AEQ should examine whether these two items can be consolidated or whether one can be revised to capture a broader relational domain not yet represented in the current item pool.
From a statistical standpoint, the CFA was conducted using ML estimation treating items as continuous variables. While this approach is common in preliminary validation studies, weighted least squares mean and variance adjusted (WLSMV) estimation with a polychoric correlation matrix would be more appropriate for strictly ordinal data and represents a methodological refinement for future independent confirmatory studies.
Longitudinal studies will be necessary to evaluate the temporal stability of AEQ scores, transitions between phenotypic profiles, and their responsiveness to treatment. Future research should also examine the AEQ’s performance in broader chronic pain populations and assess its incremental predictive value for clinical outcomes beyond that of existing instruments. Nonetheless, these findings provide initial evidence that EA represents a clinically meaningful and quantifiable dimension of chronic pain that deserves more exploration.
Conclusions
The AEQ appears to be a promising preliminary instrument for assessing a relational-affective dimension relevant to nociplastic pain. The psychometric evidence presented here, including excellent internal consistency, preliminary factorial support, convergent validity, and initial discriminant validity from established emotion regulation measures, supports its feasibility as a research tool. Its integration with central sensitization assessment may facilitate a mechanism-based phenotyping of fibromyalgia rather than static patient classification. Replication in larger, independent, multicenter samples is needed before the AEQ can be considered a validated addition to the clinical assessment toolkit. If confirmed longitudinally, it may contribute to more precise and individualized pain management within the nociplastic pain spectrum.
Abbreviations
ACR, American College of Rheumatology; AEQ, Emotional Allodynia Questionnaire; AVE, Average Variance Extracted; BDI-II, Beck Depression Inventory-II; CFA, Confirmatory Factor Analysis; CFI, Comparative Fit Index; CSI, Central Sensitization Inventory; DERS, Difficulties in Emotion Regulation Scale; EA, Emotional Allodynia; EFA, Exploratory Factor Analysis; FIML, Full Information Maximum Likelihood; IASP, International Association for the Study of Pain; IQR, Interquartile Range; KMO, Kaiser-Meyer-Olkin; ML, Maximum Likelihood; PCA, Principal Component Analysis; PCS, Pain Catastrophizing Scale; QST, Quantitative Sensory Testing; RMSEA, Root Mean Square Error of Approximation; SD, Standard Deviation; SRMR, Standardized Root Mean Square Residual; STAI-Y, State-Trait Anxiety Inventory; TLI, Tucker-Lewis Index; VAS, Visual Analog Scale; WLSMV, Weighted Least Squares Mean and Variance adjusted.
Data Sharing Statement
All data supporting the findings of this study are available from the corresponding author upon reasonable request.
Ethics Approval and Informed Consent
This study was conducted in accordance with the ethical principles of the Declaration of Helsinki and the International Association for the Study of Pain (IASP) guidelines for pain research in humans. Ethical approval was obtained from the Local Ethics Committee of the IRCCS Oncological Institute “Gabriella Serio” — IRCCS “Giovanni Paolo II”, Bari, Italy (https://www.sanita.puglia.it/web/irccs-istituto-tumori-bari-giovanni-paolo-ii/comitato-etico; approval number: 2451/CEL, approved on September 8, 2025). All participants provided written informed consent prior to enrollment.
Acknowledgment
To Aron and Arwen.
The authors thank the rights holders and developers of the psychometric instruments used in this study for clarifying the conditions of use and, when required, granting permission. Permission to use the Pain Catastrophizing Scale (PCS) was obtained via Mapi Research Trust through the ePROVIDE platform. Authorization for research use of the Beck Depression Inventory-II (BDI-II) was confirmed by Pearson Clinical Licensing (EMEA). Use of the State-Trait Anxiety Inventory (STAI) was covered by a purchased license from the authorized distributor. The Difficulties in Emotion Regulation Scale (DERS, original 36-item version) was used as a free instrument with appropriate citation to the original publication. The Central Sensitization Inventory (CSI) was used in its official form obtained from PRIDE Research Foundation resources, with appropriate citation to the original development and validation work.
The authors thank Prof. Alessandro Bertolino for his valuable methodological suggestions.
Author Contributions
All authors made a significant contribution to the work reported, whether that is in the conception, study design, execution, acquisition of data, analysis and interpretation, or in all these areas; took part in drafting, revising or critically reviewing the article; gave final approval of the version to be published; have agreed on the journal to which the article has been submitted; and agree to be accountable for all aspects of the work.
Funding
The authors received no specific funding for this work.
Disclosure
The authors declare no competing interests in this work.
References
1. Terminology | International Association for the Study of Pain. International Association for the Study of Pain (IASP). Available from: https://www.iasp-pain.org/resources/terminology/.
2. Sullivan MJL, Bishop SR, Pivik J. The pain catastrophizing scale: development and validation. Psychol Assess. 1995;7(4):524–24. doi:10.1037/1040-3590.7.4.524
3. Neblett R, Cohen H, Choi Y, et al. The Central Sensitization Inventory (CSI): establishing clinically significant values for identifying central sensitivity syndromes in an outpatient chronic pain sample. J Pain. 2013;14(5):438–445. doi:10.1016/j.jpain.2012.11.012
4. Beck AT, Steer RA, Brown G. Beck Depression Inventory–II. APA PsycTests; 2011. doi:10.1037/t00742-000
5. Spielberger CD. State-Trait Anxiety Inventory for Adults. American Psychological Association; 2012. doi:10.1037/t06496-000
6. Gratz KL, Roemer L. Multidimensional assessment of emotion regulation and dysregulation: development, factor structure, and initial validation of the difficulties in emotion regulation scale. J Psychopathol Behav Assess. 2004;26(1):41–54. doi:10.1023/B:JOBA.0000007455.08539.94
7. Fitzcharles MA, Cohen SP, Clauw DJ, Littlejohn G, Usui C, Häuser W. Nociplastic pain: towards an understanding of prevalent pain conditions. Lancet. 2021;397(10289):2098–2110. doi:10.1016/S0140-6736(21)00392-5
8. Kosek E. The concept of nociplastic pain—where to from here? Pain. 2024;165(11S):S50. doi:10.1097/j.pain.0000000000003305
9. Bernik M, Sampaio TPA, Gandarela L. Fibromyalgia comorbid with anxiety disorders and depression: combined medical and psychological treatment. Curr Pain Headache Rep. 2013;17(9):358. doi:10.1007/s11916-013-0358-3
10. Oliva F, Merola M, Olivero A, Leombruni P. The relationship between pain and depression in fibromyalgia: structural equation modeling and network analysis. Int J Environ Res Public Health. 2026;23(3):316. doi:10.3390/ijerph23030316
11. Clauw DJ. Fibromyalgia: a clinical review. JAMA. 2014;311(15):1547–1555. doi:10.1001/jama.2014.3266
12. Sturgeon JA, Zautra AJ. Social pain and physical pain: shared paths to resilience. Pain Manag. 2016;6(1):63–74. doi:10.2217/pmt.15.56
13. Ushinsky A, Reinhardt LE, Simmons AN, Strigo IA. Further evidence of emotional allodynia in unmedicated young adults with major depressive disorder. PLoS One. 2013;8(11):e80507. doi:10.1371/journal.pone.0080507
14. Wager TD, Atlas LY, Lindquist MA, Roy M, Woo CW, Kross E. An fMRI-based neurologic signature of physical pain. N Engl J Med. 2013;368(15):1388–1397. doi:10.1056/NEJMoa1204471
15. Eisenberger NI, Lieberman MD, Williams KD. Does rejection hurt? An FMRI study of social exclusion. Science. 2003;302(5643):290–292. doi:10.1126/science.1089134
16. Kross E, Berman MG, Mischel W, Smith EE, Wager TD. Social rejection shares somatosensory representations with physical pain. Proc Natl Acad Sci U S A. 2011;108(15):6270–6275. doi:10.1073/pnas.1102693108
17. Lyu Y, Zidda F, Radev ST, et al. Gamma band oscillations reflect sensory and affective dimensions of pain. Front Neurol. 2022;12:695187. doi:10.3389/fneur.2021.695187
18. Rotge JY, Lemogne C, Hinfray S, et al. A meta-analysis of the anterior cingulate contribution to social pain. Soc Cogn Affect Neurosci. 2015;10(1):19–27. doi:10.1093/scan/nsu110
19. Eisenberger NI. The neural bases of social pain: evidence for shared representations with physical pain. Psychosom Med. 2012;74(2):126–135. doi:10.1097/PSY.0b013e3182464dd1
20. Baron R, Maier C, Attal N, et al. Peripheral neuropathic pain: a mechanism-related organizing principle based on sensory profiles. Pain. 2017;158(2):261–272. doi:10.1097/j.pain.0000000000000753
21. Jastrowski Mano KE, O’Bryan EM, Gibler RC, Beckmann E. The co-occurrence of pediatric chronic pain and anxiety: a theoretical review of a developmentally informed shared vulnerability model. Clin J Pain. 2019;35(12):989–1002. doi:10.1097/AJP.0000000000000763
22. Lee Y, Nassikas N, Clauw D. The role of the central nervous system in the generation and maintenance of chronic pain in rheumatoid arthritis, osteoarthritis and fibromyalgia. Arthritis Res Therapy. 2011;13:211. doi:10.1186/ar3306
23. Wolfe F, Clauw DJ, Fitzcharles MA, et al. 2016 Revisions to the 2010/2011 fibromyalgia diagnostic criteria. Semin Arthritis Rheum. 2016;46(3):319–329. doi:10.1016/j.semarthrit.2016.08.012
24. Rhemtulla M, Brosseau-Liard PÉ, Savalei V. When can categorical variables be treated as continuous? A comparison of robust continuous and categorical SEM estimation methods under suboptimal conditions. Psychol Methods. 2012;17(3):354–373. doi:10.1037/a0029315
25. Bennette C, Vickers A. Against quantiles: categorization of continuous variables in epidemiologic research, and its discontents. BMC Med Res Methodol. 2012;12:21. doi:10.1186/1471-2288-12-21
26. MacCallum RC, Zhang S, Preacher KJ, Rucker DD. On the practice of dichotomization of quantitative variables. Psychol Methods. 2002;7(1):19–40. doi:10.1037/1082-989x.7.1.19
27. Cabin RJ, Mitchell RJ. To bonferroni or not to bonferroni: when and how are the questions. Bull Ecol Soc Am. 2000;81(3):246–248.
28. jamovi - open statistical software for the desktop and cloud. Available from: https://www.jamovi.org/.
29. Dozois DJA, Dobson KS, Ahnberg JL. A psychometric evaluation of the Beck Depression Inventory–II. Psychol Assess. 1998;10(2):83–89. doi:10.1037/1040-3590.10.2.83
30. Quartana PJ, Campbell CM, Edwards RR. Pain catastrophizing: a critical review. Expert Rev Neurother. 2009;9(5):745–758. doi:10.1586/ern.09.34
31. Lumley MA, Cohen JL, Borszcz GS, et al. Pain and emotion: a biopsychosocial review of recent research. J Clin Psychol. 2011;67(9):942–968. doi:10.1002/jclp.20816
32. Carneiro AM, de Góes Salvetti M, Dale CS, da Silva VA. Quantitative sensory testing in fibromyalgia syndrome: a scoping review. Biomedicines. 2025;13(4):988. doi:10.3390/biomedicines13040988
33. Leone C, Galosi E, Esposito N, et al. Small-fibre damage is associated with distinct sensory phenotypes in patients with fibromyalgia and small-fibre neuropathy. Eur J Pain. 2023;27(1):163–173. doi:10.1002/ejp.2049
34. Downey G, Feldman SI. Implications of rejection sensitivity for intimate relationships. J Pers Soc Psychol. 1996;70(6):1327–1343. doi:10.1037//0022-3514.70.6.1327
35. Boyce P, Parker G. Development of a scale to measure interpersonal sensitivity. Aust N Z J Psychiatry. 1989;23(3):341–351.
36. Martínez-Lavín M. Centralized nociplastic pain causing fibromyalgia: an emperor with no cloths? Clin Rheumatol. 2022;41(12):3915–3917. doi:10.1007/s10067-022-06407-5
37. Truini A, Tinelli E, Gerardi MC, et al. Abnormal resting state functional connectivity of the periaqueductal grey in patients with fibromyalgia. Clin Exp Rheumatol. 2016;34(2 Suppl 96):S129–S133.
38. Balducci T, Garza-Villarreal EA, Valencia A, Aleman A, van Tol MJ. Abnormal functional neurocircuitry underpinning emotional processing in fibromyalgia. Eur Arch Psychiatry Clin Neurosci. 2024;274(1):151–164. doi:10.1007/s00406-023-01578-x
39. Treister R, Eaton TA, Trudeau JJ, Elder H, Katz NP. Development and preliminary validation of the focused analgesia selection test to identify accurate pain reporters. J Pain Res. 2017;10:319–326. doi:10.2147/JPR.S121455
40. Allen-Brady K, Fyer AJ, Weissman M. The multi-generational familial aggregation of interstitial cystitis, other chronic nociplastic pain disorders, depression, and panic disorder. Psychol Med. 2023;53(16):7847–7856. doi:10.1017/S0033291723001885
41. Janssens KAM, Zijlema WL, Joustra ML, Rosmalen JGM. Mood and anxiety disorders in chronic fatigue syndrome, fibromyalgia, and irritable bowel syndrome: results from the lifelines cohort study. Psychosom Med. 2015;77(4):449–457. doi:10.1097/PSY.0000000000000161
 © 2026 The Author(s). This work is published and licensed by Dove Medical Press Limited. The
full terms of this license are available at https://www.dovepress.com/terms
and incorporate the Creative Commons Attribution
- Non Commercial (unported, 4.0) License.
By accessing the work you hereby accept the Terms. Non-commercial uses of the work are permitted
without any further permission from Dove Medical Press Limited, provided the work is properly
attributed. For permission for commercial use of this work, please see paragraphs 4.2 and 5 of our Terms.
© 2026 The Author(s). This work is published and licensed by Dove Medical Press Limited. The
full terms of this license are available at https://www.dovepress.com/terms
and incorporate the Creative Commons Attribution
- Non Commercial (unported, 4.0) License.
By accessing the work you hereby accept the Terms. Non-commercial uses of the work are permitted
without any further permission from Dove Medical Press Limited, provided the work is properly
attributed. For permission for commercial use of this work, please see paragraphs 4.2 and 5 of our Terms.
Recommended articles
Fibromyalgia: Associations Between Fat Infiltration, Physical Capacity, and Clinical Variables
Gerdle B, Dahlqvist Leinhard O, Lund E, Bengtsson A, Lundberg P, Ghafouri B, Forsgren MF
Journal of Pain Research 2022, 15:2517-2535
Published Date: 27 August 2022
The Psychosocial Characteristics and Somatosensory Function of Children and Adolescents Who Meet the Criteria for Chronic Nociplastic Pain
Ocay DD, Ross BD, Moscaritolo L, Ahmed N, Ouellet JA, Ferland CE, Ingelmo PM
Journal of Pain Research 2023, 16:487-500
Published Date: 15 February 2023
The Safety and Efficacy of Low-Dose Naltrexone in Patients with Fibromyalgia: A Systematic Review
Yang J, Shin KM, Do A, Bierle DM, Abu Dabrh AM, Yin Z, Bauer BA, Mohabbat AB
Journal of Pain Research 2023, 16:1017-1023
Published Date: 21 March 2023
Latest Advancements in Transcutaneous Electrical Nerve Stimulation (TENS) and Electronic Muscle Stimulation (EMS): Revisiting an Established Therapy with New Possibilities
Patel P, Green M, Tram J, Wang E, Murphy M, Abd-Elsayed AA, Chakravarthy K
Journal of Pain Research 2025, 18:137-153
Published Date: 9 January 2025
Central Sensitization and Nociplastic Pain: Shared Mechanisms in Fibromyalgia, Osteoarthritis, and Inflammatory Arthritis
Hladkykh FV, Liadova TI, Matvieienko MS, Komorovsky R, Smiyan S, Student V
Journal of Pain Research 2026, 19:571311
Published Date: 26 March 2026