Back to Journals » Journal of Pain Research » Volume 15
Fibromyalgia: Associations Between Fat Infiltration, Physical Capacity, and Clinical Variables
Authors Gerdle B ![]() , Dahlqvist Leinhard O, Lund E, Bengtsson A, Lundberg P
, Dahlqvist Leinhard O, Lund E, Bengtsson A, Lundberg P ![]() , Ghafouri B
, Ghafouri B ![]() , Forsgren MF
, Forsgren MF
Received 29 May 2022
Accepted for publication 26 July 2022
Published 27 August 2022 Volume 2022:15 Pages 2517—2535
DOI https://doi.org/10.2147/JPR.S376590
Checked for plagiarism Yes
Review by Single anonymous peer review
Peer reviewer comments 2
Editor who approved publication: Dr Jonathan Greenberg
Björn Gerdle,1,2 Olof Dahlqvist Leinhard,2– 4 Eva Lund,3 Ann Bengtsson,1 Peter Lundberg,2,3 Bijar Ghafouri,1 Mikael Fredrik Forsgren2– 4
1Pain and Rehabilitation Centre, and Department of Health, Medicine and Caring Sciences, Linköping University, Linköping, SE 581 83, Sweden; 2Centre for Medical Image Science and Visualization (CMIV), Linköping, SE 581 83, Sweden; 3Department of Radiation Physics, and Department of Health, Medicine and Caring Sciences, Linköping University, Linköping, SE 581 83, Sweden; 4AMRA Medical AB, Linköping, Sweden
Correspondence: Björn Gerdle, Tel +46763927191, Email [email protected]
Background: Obesity is a risk factor for the development of fibromyalgia (FM) and generally most studies report increased Body Mass Index (BMI) in FM. Obesity in FM is associated with a worse clinical presentation. FM patients have low physical conditioning and obesity further exacerbates these aspects. Hitherto studies of FM have focused upon a surrogate for overall measure of fat content, ie, BMI. This study is motivated by that ectopic fat and adipose tissues are rarely investigated in FM including their relationships to physical capacity variables. Moreover, their relationships to clinical variables including are not known. Aims were to 1) compare body composition between FM and healthy controls and 2) investigate if significant associations exist between body composition and physical capacity aspects and important clinical variables.
Methods: FM patients (n = 32) and healthy controls (CON; n = 30) underwent a clinical examination that included pressure pain thresholds and physical tests. They completed a health questionnaire and participated in whole-body magnetic resonance imaging (MRI) to determine body composition aspects.
Results: Abdominal adipose tissues, muscle fat, and BMI were significantly higher in FM, whereas muscle volumes of quadriceps were smaller. Physical capacity variables correlated negatively with body composition variables in FM. Both body composition and physical capacity variables were significant regressors of group belonging; the physical capacity variables alone showed stronger relationships with group membership. A mix of body composition variables and physical capacity variables were significant regressors of pain intensity and impact in FM. Body composition variables were the strongest regressors of blood pressures, which were increased in FM.
Conclusion: Obesity has a negative influence on FM symptomatology and increases the risk for other serious conditions. Hence, obesity, dietary habits, and physical activity should be considered when developing clinical management plans for patients with FM.
Keywords: body mass index, chronic pain, fibromyalgia, physical fitness, muscle, fat, magnetic resonance imaging, body composition
Introduction
Fibromyalgia (FM) has a prevalence of 1–4% in the population and has a higher prevalence in women.1–3 It is characterized by generalized widespread pain and hyperalgesia/allodynia.4 Symptoms and comorbidities such as fatigue, psychological distress, irritable bowel syndrome, and insomnia are frequent. FM diagnosis is either based on anamnestic reports and semi-objective examination of hyperalgesia and/or anamnestic reports.4,5
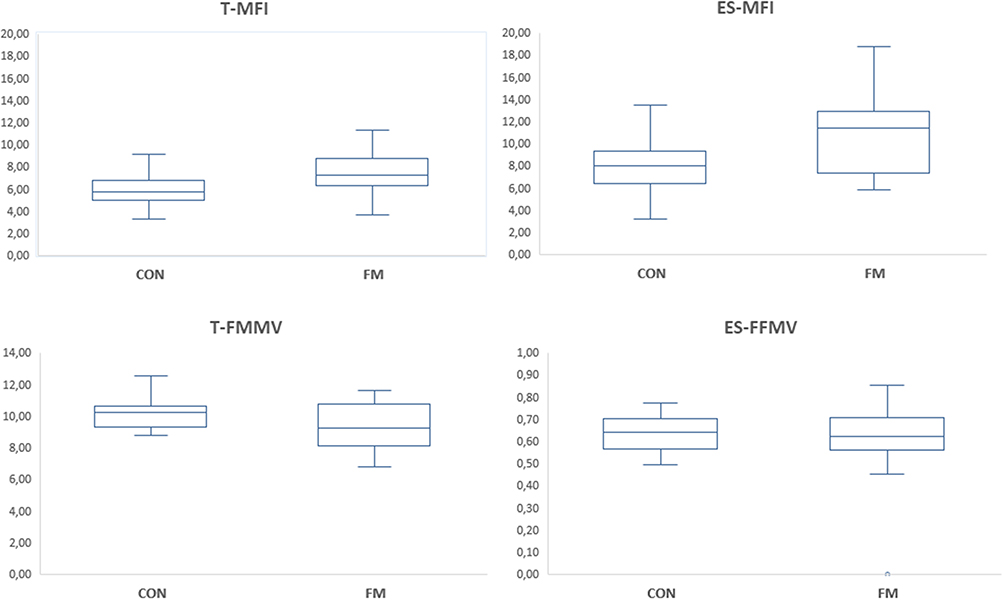 |
Figure 1 Boxplots of muscle fat infiltration (upper part) and fat-free muscle volume (lower part) in the thigh and erector spinae in healthy controls (CON) and fibromyalgia patients (FM). Note the different scales for T-FFMV and ES-FFMV. Abbreviations: T-MFI, Thigh Muscle Fat Infiltration; ES-MFI, Erector Spinae Muscle Fat Infiltration; T-FFMV, Thigh Fat-free Muscle volume; ES-FFMV, Erector Spinae Fat-free Muscle volume. |
The chronic pain field lacks mechanism-based diagnoses since the neurobiological alterations such as pathophysiological and molecular mechanisms are insufficiently known. The International Association for the Study of Pain (IASP) has defined nociplastic pain, such as nociceptive and neuropathic pain, as a pain mechanistic descriptor. FM is classified as a nociplastic pain condition,6 which includes characteristics such as increased anatomical spread of pain on the body and increased pain sensitivity. No definite pathophysiology for FM has been established and a pattern with alterations in different organs and tissues both at central and peripheral levels have been reported.7–17 Complicated interactions between peripheral and central processes are likely to be present in FM in conjunction with several psychosocial contributing factors.18
Obesity and increased fat content are associated with increased risk for conditions such as type 2 diabetes, hypertension, coronary heart disease, stroke, etc.19–21 Fibromyalgia is often accompanied by several comorbidities of which one of the most significant is obesity. Indeed, most studies report increased Body Mass Index (BMI) in FM;22,23 and a recent systematic review reported an overall obesity prevalence of 35.7% in FM.24 Also, obesity is a risk factor for the development of FM.25,26 Importantly, comorbid obesity further exacerbates the impairments associated with FM. Indeed, obesity in FM is associated with a worse clinical presentation, eg, in pain intensity, physical activity pattern, increased disability, and poor sleep, etc.24 High BMI in FM is associated with worse outcomes in pharmacotherapy and generally overweight and obesity are perceived as complex challenges in pain rehabilitation.27,28
Although BMI is an overall estimation of body mass including fat, muscles, and bones, it is used as a surrogate for overall measure of fat content. Therefore, a more detailed analysis of fat distribution in certain tissues may be warranted. Despite no significant group differences in BMI, significantly higher muscular fat infiltration (MFI) of quadriceps in FM than controls have been found.29 In whiplash associated disorders (WAD), increased MFI of cervical extensor musculature has been found.30
According to the deconditioning paradigm, physical inactivity and physical deconditioning can cause pain and contribute to intolerance of physical activities.31 Deconditioning may contribute to the development of FM.32 FM patients have reduced physical conditioning.33–36 Activity-induced pain is common and could help explain why FM patients avoid activities and exercise.37 Hence, we reported lower performance in FM on specific muscle function tests.29 Different physiological explanations for reduced strength in FM have been proposed – eg, alterations in muscle fiber, changes in neuromuscular control mechanisms, insufficient blood circulation, and alterations in energy and growth metabolism.38 The relationship between BMI and physical activity in FM is not clear.39 In a recent systematic review, only a weak association was found in FM.24 In this vicious cycle, several psychological factors play a role in patients with chronic pain and obesity. For example, with respect to chronic low back pain and obesity, recent evidence supported the role of kinesiophobia in contributing to pain intensity levels and disability,40,41 and more specifically, a recent study involving patients with obesity and FM corroborated the association between physical functioning and psychological factors such as pain catastrophizing and pain acceptance,42 highlighting that the cognitive and emotional response to pain stimuli affect behavior. The presence of several intertwining factors in the pain experience further complicates the understanding of the causal relationships.
Dietary habits in FM are insufficiently known even though some studies report significant changes in dietary patterns.43,44 Physical exercise is recommended in clinical guidelines for FM33 as both aerobic and muscle strengthening exercises are associated with reduced pain and improved well-being.45,46
To date, studies of FM have focused on the overall clinical estimate of normalized fat content – ie, BMI. However, the same BMI in two subjects can be associated with prominent differences in fat infiltration in specific tissues.20,47 Hence, ectopic fat and adipose tissues are rarely investigated in FM, including their relationships to physical capacity variables. Body composition profiling is a method that allows for assessing muscle volumes and fatty infiltration as well as visceral and abdominal subcutaneous adipose tissue volumes and liver fat infiltration using neck-to-knee MRI.20 Moreover, their relationships to clinical variables are not known.
Hence, this study has two main aims: a) to compare body composition of FM and healthy controls and b) to investigate whether significant associations exist between body composition and physical capacity aspects and important clinical variables (ie, pain intensity, psychological distress, disability, and blood pressure).
Materials and Methods
Subjects
This investigation of FM includes 32 female FM patients according to the 1990 American College of Rheumatology (ACR) criteria4 and 30 age-matched female controls (CON) between 22 and 56 years old. The CON group was recruited through advertisements in newspapers, and the FM group was recruited from former patients at the Pain and Rehabilitation Centre at the University Hospital in Linköping, Sweden. The number of subjects were determined using Power and sample size calculation (3.0.2)48 based on results both from microdialysis (concentration of lactate according to Rosendal et al49) and from ATP concentration obtained from phosphorus magnetic resonance spectroscopy31 of vastus lateralis.29 Both analyses indicated that 25 subjects in each group were necessary. Details about inclusion and exclusion criteria as well as clinical examination are given below.
The study was granted ethical clearance by Linköping University Ethics Committee (Dnr: 2016/239-31). All participants gave their written informed consent, and the study was performed in accordance with the Helsinki Declaration.
Procedures
At the first visit, the subjects underwent a clinical examination. During the examination, pressure pain thresholds were registered, and physical tests were performed. In addition, the subjects completed a health questionnaire that covered aspects of pain, health, disability, demographic data, and psychological characteristics. At another visit, a whole-body magnetic resonance imaging (WB-MRI) scan was performed.
Health Questionnaire
The questionnaire covered background data, pain aspects, psychological distress, disability, and health aspects; details including validity and the Swedish versions are reported elsewhere.38,50,51
Background Data
Age was registered.
Pain Aspects
Patients reported the duration of FM (years). Global pain intensity the previous seven days (NRS-7d) was reported using a numeric rating scale (0 = no pain and 10 = worst possible pain).
Psychological Distress
The Hospital Anxiety and Depression Scale (HADS) is used frequently in clinical practice and research.52,53 The total score (ie, the sum of the two subscales) was used to capture psychological distress (0–42).51 A lower score indicates fewer symptoms of distress.
Fibromyalgia Impact
The fibromyalgia impact questionnaire (FIQ) is comprised of ten subscales (each with a range of 0–100) of disabilities and symptoms.54 The mean of the ten subscales is calculated – higher score indicates higher impact (score range: 0–100).
Disability
The Pain Disability Index (PDI) measures the impact that pain has on a person’s ability to participate in essential life activities.55,56 PDI consists of seven items and every item is rated on a 10-point scale. The ratings of the items are summed, so the scores range between 0 and 70 (ie, high disability). The items assess perception of the specific impact of pain on disability that may preclude normal or desired performance of a wide range of functions such as sex, work, daily activities, family and social activities, and life support (sleeping, breathing, and eating).
Health Aspects
The European Quality of Life Instrument (EQ-5D), which captures a patient’s perceived state of health,57,58 consists of two parts. The first part is an index obtained from five dimensions. In this study, we used the second part – ie, the self-estimation of today’s health according to a 100-point thermometer-like scale (EQ5D-VAS) with defined end points (high values indicate better health and low values indicate worse health).
Physical Activity and Inactivity
Rating of Perceived Capacity (RPC) was used for self-assessment of perceived physical capacity.59,60 Using a scale from 1 to 20, the subjects reported, for example, what activity they could perform from a seated position (denoted 1) for at least 30 min, or, if athletes, what aerobic exercises they could perform (denoted 20) for at least 30 min. Seven other activities are denoted by a number.
Questions about physical inactivity and activity were taken from the Swedish National Board of Health and Welfare.61 One question was about the number of hours and minutes of sedentary time on an average day based on the last seven days (Physical inactivity (h)). Moreover, questions about the frequency (number of days per week) and average duration (min/day) of walking (Physical activity-2 min and Physical activity-2 days) as well as of moderately strenuous (Physical activity-3 min and Physical activity-3 days) and very strenuous physical activity (Physical activity-4 min and Physical activity-4 days) based on the previous seven days. The subjects were instructed to only consider physical activities that lasted for at least 10 min for these six variables.
Clinical Examinations
Both FM and CON underwent a brief clinical examination of heart and lungs, which included recording diastolic and systolic blood pressure (mm Hg) after two minutes of rest in a horizontal position. The proportions with systolic blood pressure ≥130 mm Hg and/or diastolic ≥85 mm Hg were determined. In addition, their weight (kg) and height (m) were recorded. Body Mass Index (BMI, kg/m2) was calculated and classified according to the World Health Organization (WHO) criteria: <18.5 = underweight; 18.5–24.9 = normal range; 25.0–29.9 = overweight; 30.0–34.9 = obesity; and ≥35.0 = severe obesity. The clinical examination also ensured that the controls were healthy with respect to anamnesis for rheumatic diseases, neurological diseases, diabetes, cardio-vascular diseases, psychiatric diseases, and high alcohol consumption (ie, Alcohol Use Disorders Identification Test (AUDIT) >6 according to the recommendations for women).
The clinical examination of the patients ensured that they met the criteria for FM according to the 1990 American College of Rheumatology (ACR) criteria.4 The number of tender points were registered both in FM and in CON. The 1990 ACR criteria are based on anamnestic reports and semi-objective examinations of hyperalgesia/allodynia (tender points). Newer criteria (2010/2011 and 2016) based on anamnestic reports have been presented.5,62,63 As we wanted to compare our study with earlier studies and consensus is lacking concerning the 2010–2016 criteria,64 we chose the 1990 ACR criteria.
Pressure Pain Thresholds
Pressure pain thresholds (PPT) were determined using a manual pressure algometer (Somedic AB, Sweden) mounted with a probe (contact area of 1 cm2) on the muscle belly (for details, see65,66). The erector spinae, tibialis anterior, and trapezius were investigated bilaterally. The pressure was increased by 30 kPa/s until the subject perceived pain, which the subject indicated by pushing a stop button, or until the maximum threshold of 600 kPa was reached. The PPT for each anatomical location was defined as the mean of two trials obtained with a minimum interval of 30s. We used the mean of the six anatomical locations (PPT-tot) as a global measure of pain sensitivity.
Physical Tests
All subjects performed strength and endurance tests to determine hand function, aerobic fitness, and lower extremity muscle performance; the results of these have been recently reported.67 Hand function was determined by measuring grip force (N) using Grippit (AB Detektor, Gothenburg, Sweden). Peak value (Grip-max), average value (Grip-average), and 10s value (Grip-endurance) were recorded for 10s for both hands (for details, see our earlier study29). The test-retest precision has been shown to be generally high for these variables.68 Mean values of dominant and non-dominant sides are reported. To determine aerobic fitness, the subjects performed a submaximal cycle ergometer aerobic fitness test, which measures MaxVO2.69 Lower extremity muscle performance was measured using the timed-stands test (TST) – ie, the number of times the subjects stand up and sit down from a standard chair for 30s.70,71
Whole-Body Magnetic Resonance Imaging
Body composition was determined by quantitative analysis of magnetic resonance imaging (MRI). The participants were scanned in a Philips Ingenia 3T MRI scanner (Philips Healthcare, Netherlands) using a 6-min dual-echo Dixon protocol, providing water and fat separated volumetric data covering a region from the neck to the knees. In addition, a dedicated mDixon Quant protocol was used to quantify liver fat.72 The body composition profiling was performed using AMRA® Researcher (AMRA Medical AB, Linköping, Sweden).20 The analysis consisted of the following steps: 1) automatic image calibration, 2) automatic labelling and registration of fat and muscle regions to the acquired image volumes, 3) quality control of anatomical regions and MR data performed by trained analysis engineers at AMRA Medical, and 4) quantification of fat and muscle volumes based on the calibrated images.72–76 The measurements included the volumes of visceral adipose tissue (VAT (L)), and abdominal subcutaneous adipose tissue (ASAT (L)), thigh fat-free muscle volume (T-FFMV (L)), fat-free muscle volume of spinal erectors (ES-FFMV (L)), the relative fat infiltration of these muscle groups (T-MFI and ES-MFI; (%)), as well as liver proton density fat-fraction (Liver fat (%)). The spinal erector group (‘spinal erectors’) measurement consisted of the following muscles iliocostalis, longissimus, spinalis, and transversospinales due to the inability to exclude this small muscle group from the rest given the spatial resolution of the image data. The spinal erectors were measured in a region limited by the top of first lumbar vertebrae (L1) and the bottom of the fifth lumbar vertebrae (L5).
For each subject, a matched virtual control group (VCG) was created to calculate a personalized muscle volume z-score based on T-FFMV (labelled T-MVZ). The muscle volume z-score measures how many standard deviations each subject deviates from the mean muscle volume of their matched group, which represents the same gender and similar body size. The reference population from which the VCG was drawn consisted of 10016 subjects aged 44 to 76 from the UK Biobank imaging sub-study.77 This research was conducted using the UK Biobank resource, project ID 6569. The study was approved by the Northwest Multicentre Research Ethics Committee, UK. Written informed consent was obtained before study entry. Below, BMI and the variables obtained from the whole-body MRI are labelled body composition variables.
Statistics
The statistics were performed using the statistical packages IBM SPSS Statistics (version 27.0; IBM Corporation, Route 100 Somers, New York, USA) and SIMCA-P+ (version 17.0; Sartorius Stedim Biotech, Umeå, Sweden). A P-value <0.05 was considered statistically significant. Text and tables report the mean value ± one standard deviation (± 1 SD) of continuous variables and percentages (%) for categorical variables. To compare groups, we used Student’s t-test for un-paired observations and Chi squared test for proportions.
Previous studies have discussed the necessity of using advanced multivariate analyses (MVDA) when accounting for system-wide aspects, including missing data and multicollinearity problems.50,78 Using SIMCA-P+, we applied advanced Principal Component Analysis (PCA) to determine multivariate outliers and multivariate correlation patterns and Orthogonal Partial Least Square Regressions (OPLS) to determine multivariate associations. SIMCA-P+ uses the Non-linear Iterative Partial Least Squares (NIPALS) algorithm to handle missing data: max 50% missing data for variables/scales and max 50% missing data for subjects. PCA extracts and displays systematic variation in the data matrix (ie, a kind of multivariate correlation analysis). A cross validation technique was used to identify nontrivial components (p). Variables loading on the same component p were correlated, and variables with high loadings but opposing signs were negatively correlated. Variables with high absolute loadings were considered significant. Per definition, the obtained components are not correlated and are arranged in decreasing order with respect to explained variation. R2 describes the goodness of fit – the fraction of sum of squares of all the variables explained by a principal component.79 Q2 describes the goodness of prediction – the fraction of the total variation of the variables that can be predicted using principal component cross validation methods.79
OPLS-discriminant analysis (OPLS-DA) was made for multivariate group analysis (CON or FM). OPLS was used for the multivariate regression analyses of the clinical variables both in all subjects taken together and in the two groups separately. The variable influence on projection (VIP) indicates the relevance of each X–variable pooled over all dimensions and Y-variables – the group of variables that best explains Y.79 VIP > 1.0 (or VIPpred if more than one component was identified) was considered significant if VIP had 95% jack-knife uncertainty confidence interval non-equal to zero. P(corr) was used to note the direction of the relationship (positive or negative) – ie, the loading of each variable was scaled as a correlation coefficient and therefore standardized the range from −1 to +1.78 P(corr) is stable during iterative variable selection and comparable between models. An absolute p(corr) of ≥0.50 was considered statistically significant.78 Thus, a variable/regressor was considered statistically significant when VIP > 1.0 and absolute p(corr) ≥0.50. A regression model will be obtained, including one or several components (the first is always the predictive component), when certain predefined criteria are fulfilled. The validity of the model is estimated using cross validation. Hence, for each regression, we report R2, Q2, and the P-value of a cross-validated analysis of variance (CV-ANOVA).
Results
Clinical Presentation
Most of the clinical variables, except diastolic blood pressure and age, differed between the two groups of subjects (Table 1). Hence, compared to the controls, patients reported higher systolic pressure, moderate to high pain intensities, together with significantly higher psychological distress, higher disability, and lower health. Systolic blood pressure was ≥130 mm Hg for 31% of FM and 7% of CON (p = 0.023), and diastolic blood pressure was ≥85 mm Hg for 22% of FM and 10% of CON (p = 0.304). Moreover, FM had lower PPT-tot and more tender points than CON.
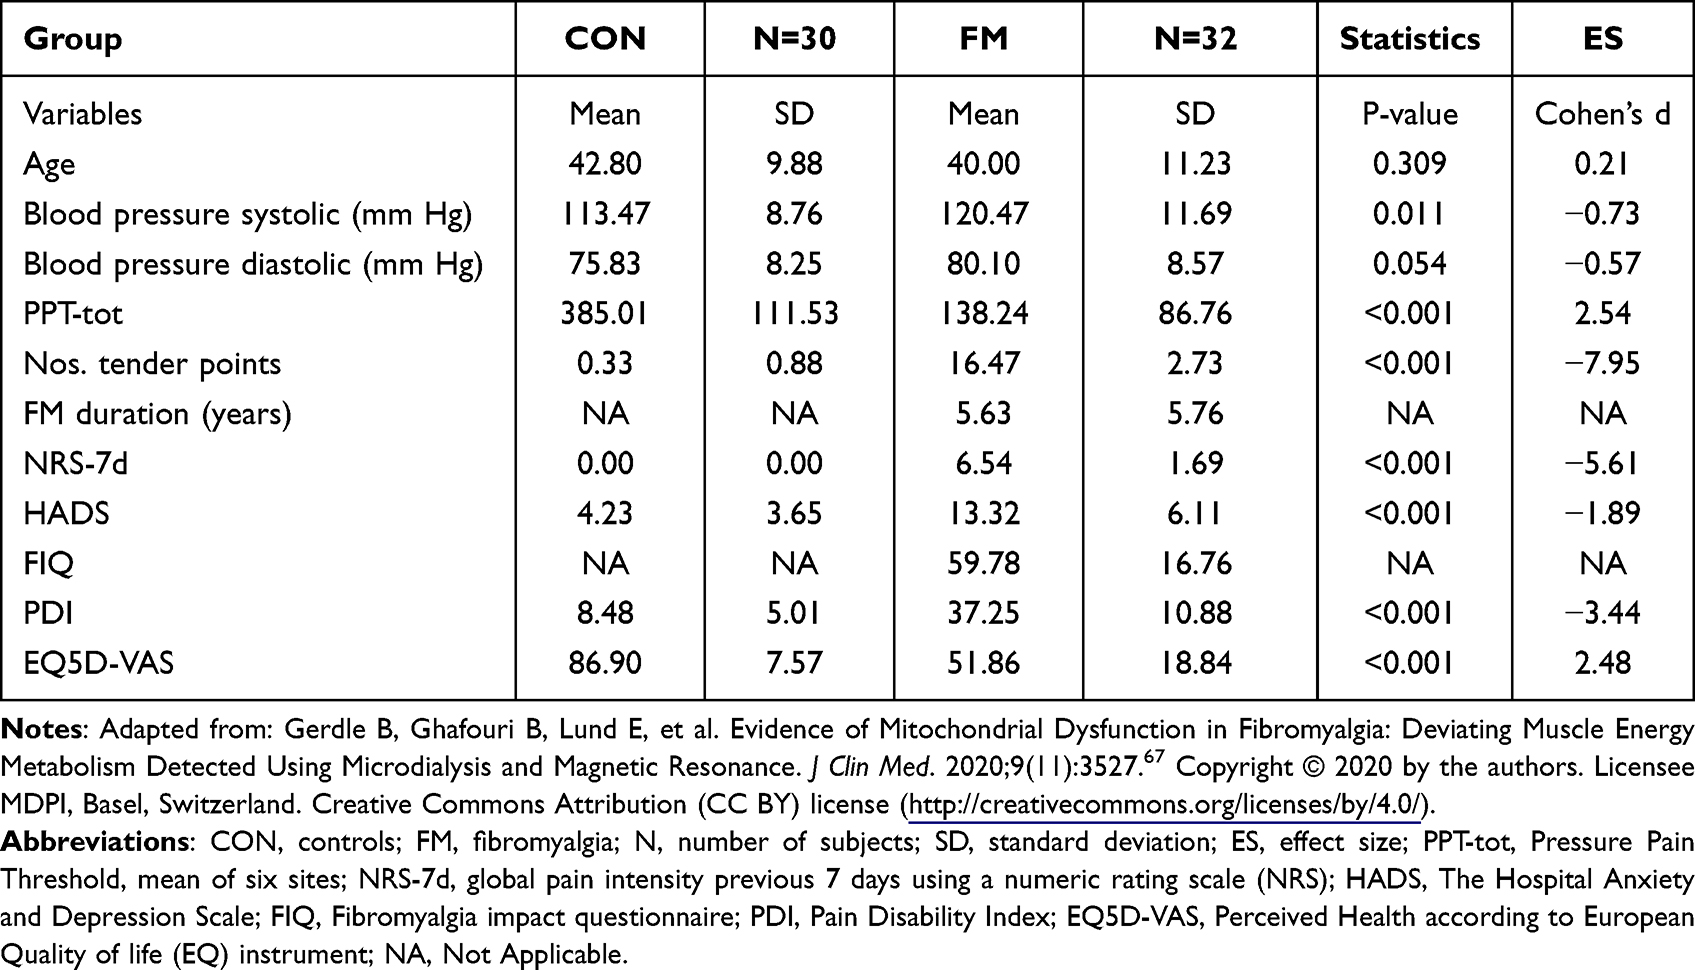 |
Table 1 Data Obtained from Questionnaires and at the Clinical Examinations in Controls (CON) and in Fibromyalgia Patients (FM) (Mean and SD). Furthest to the Right are the Results of Group Comparisons (P-value and Effect Size (ES) According to Cohen’s d) |
Body Composition Variables
BMI was significantly higher in FM than in CON (Table 2). The proportions underweight/normal weight, overweight, and obesity were 28%, 28%, and 44% in FM and 70%, 23%, and 7% in CON, respectively (Chi squared = 14.0, df = 2, P < 0.001). Hence, the proportion obesity was >6 times higher in FM.
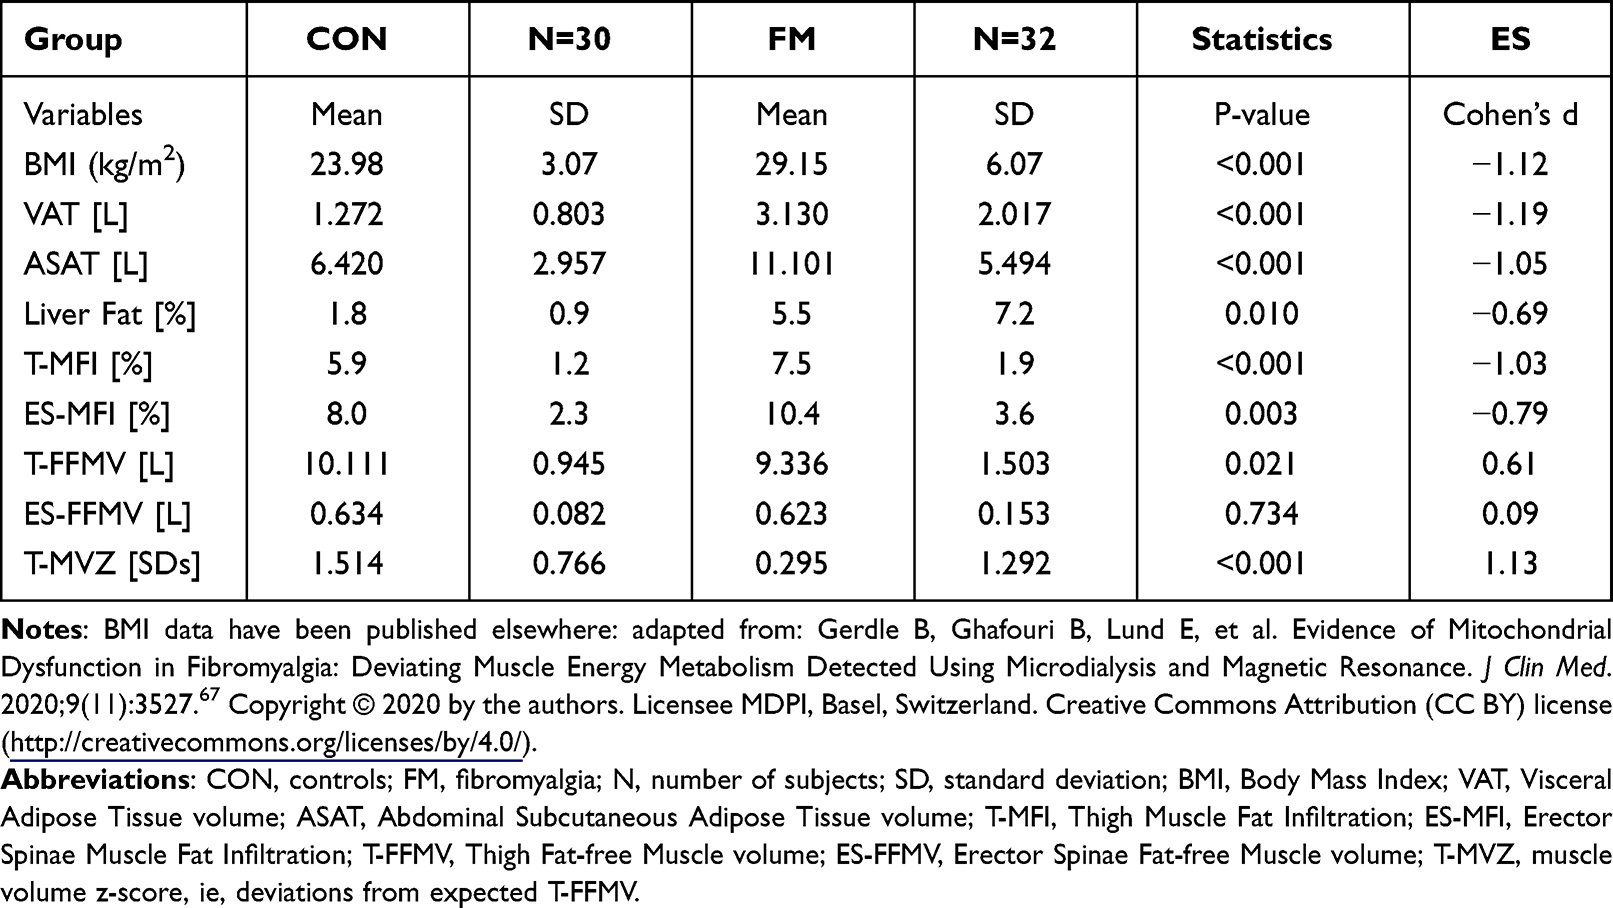 |
Table 2 Body Composition Variables in Controls (CON) and in Fibromyalgia Patients (FM) (Mean and SD). Furthest to the Right are the Results of Group Comparisons (P-value and Effect Size (ES) According to Cohen’s d) |
The volumes of visceral and abdominal subcutaneous adipose tissue (VAT and ASAT) and percentage of liver fat were significantly higher in FM than CON (Table 2). The fat infiltration in muscles – ie, in thigh (T-MFI) and in erector spinae (ES-MFI) – were significantly higher in FM than in the CON (Table 2; Figure 1). Moreover, the total fat free muscle volume of the thighs (T-FFMV), but not of erector spinae (ES-FFMV), was significantly lower in FM than CON (Table 3; Figure 1). Also, T-MVZ differed significantly between the two groups.
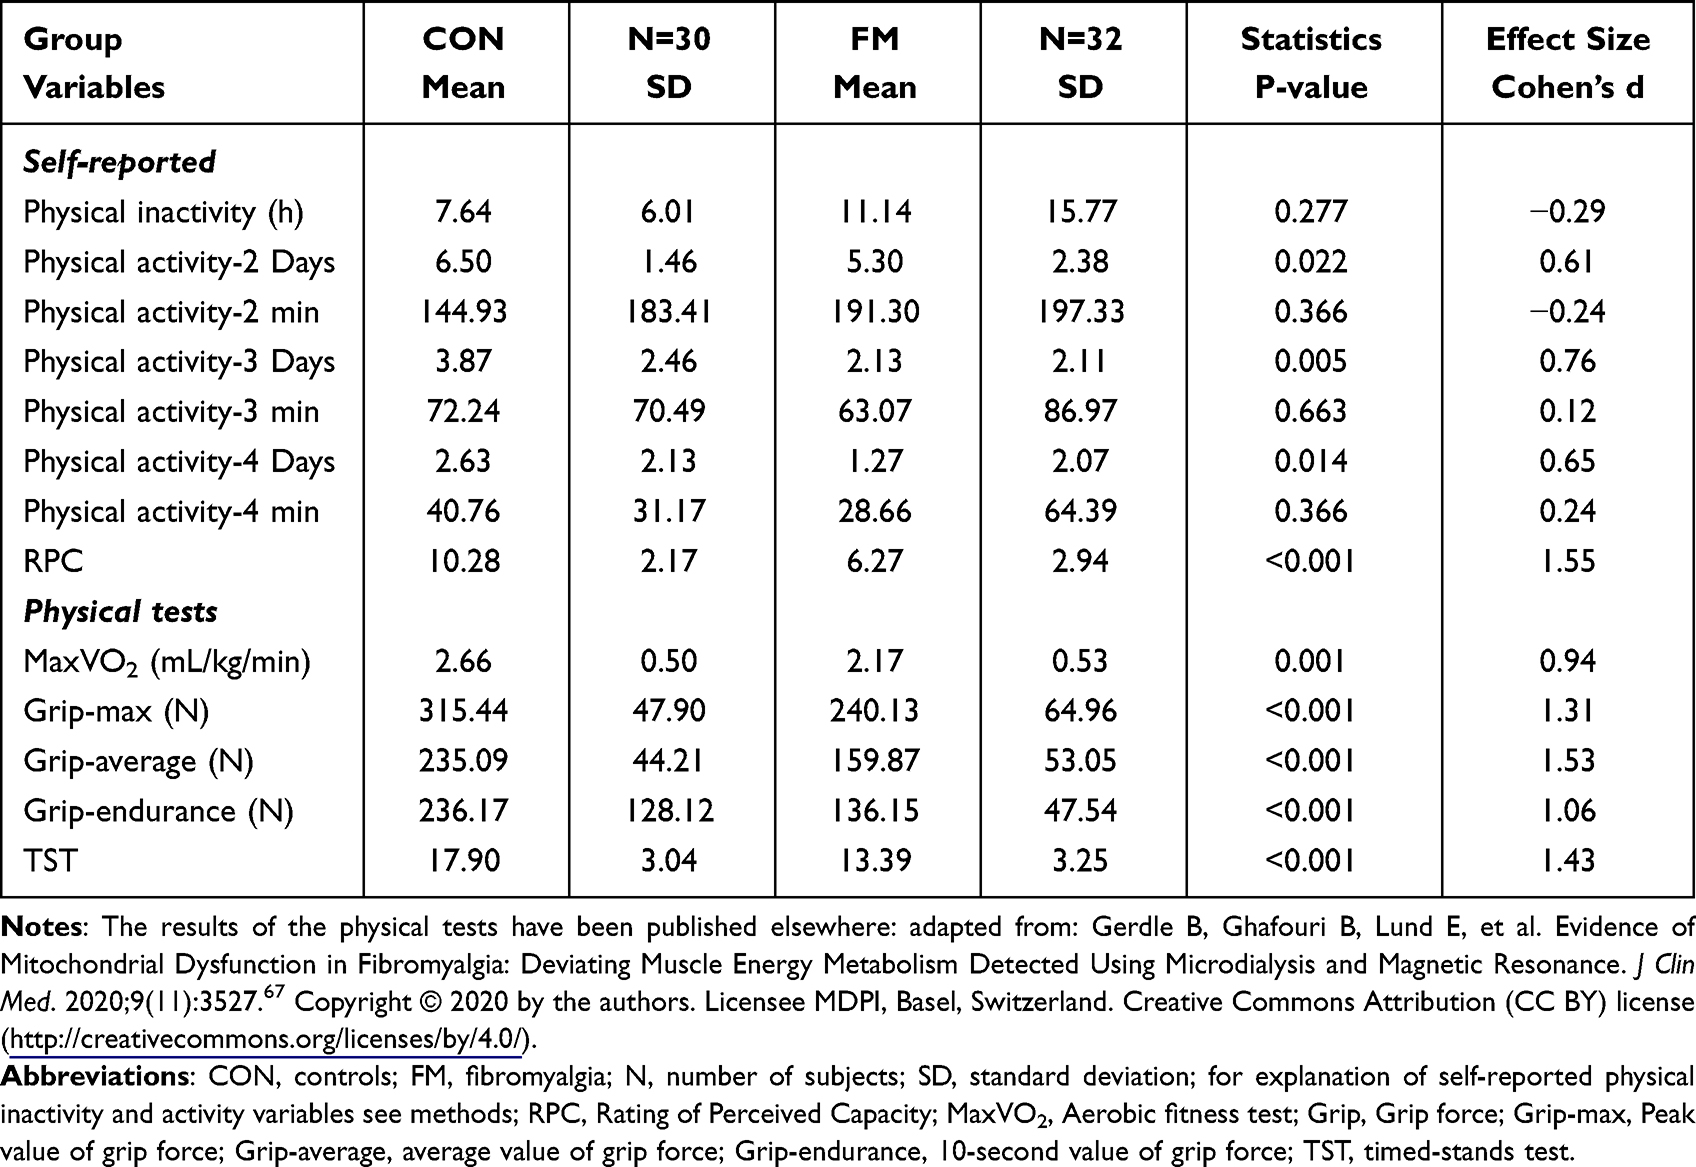 |
Table 3 Physical Capacity Variables Obtained from Self-Reports and from Physical Tests (Mean and SD) in Controls (CON) and in Patients with FM. Furthest to the Right are the Results of Group Comparisons (P-value and Effect Size (ES) According to Cohen’s d) |
The relationship between BMI and the other registered body composition variables were investigated. Hence, a highly significant OPLS regression of BMI was found in all subjects together (R2=0.88, Q2=0.84, CV-ANOVA P-value: 5.96E-20). Hence, ASAT, VAT, and T-MFI were the significant variables and correlated positively with BMI. Also, FM and in CON each had highly significant regressions that identified ASAT, VAT, and T-MFI as significantly associated with BMI (FM: R2 = 0.88, Q2 = 0.82, CV-ANOVA P-value: 1.04E-09; CON: R2 = 0.69, Q2 = 0.61, CV-ANOVA P-value: 4.98E-06). In CON, ES-MFI was also significant (third in importance before T-MFI).
We then regressed (OPLS-DA) group membership using the body composition variables (cf. Table 2) as regressors (R2 = 0.38, Q2 = 0.35, CV-ANOVA P-value = 3.80e-06). The following four variables – in descending order of importance – were significant and higher in FM than in CON: VAT (VIP = 1.27, p(corr) = 0.88); T-MFI (VIP = 1.25, p(corr) = 0.87); ASAT (VIP = 1.22, p(corr) = 0.85); and BMI (VIP = 1.21, p(corr) = 0.84).
Physical Capacity
According to most of the self-reports (ie, the three physical activity-days variables and RPC), FM reported significantly lower capacity (Table 3). As reported elsewhere, this FM cohort had lower physical capacity than CON according to the physical tests (Table 3).67 Hence, FM had lower self-reported and objective physical capacity in most investigated aspects.
When regressing group membership using both the self-reported and the physical test variables (Table 3) as regressors, a significant model was obtained (R2 = 0.52, Q2 = 0.48, CV-ANOVA P-value = 9.49e-09). The following variables were significant and correlated negatively with the FM group membership: Grip-average (VIP = 1.37, p(corr) = −0.84); Grip-max (VIP = 1.33, p(corr)= −0.82), RPC (VIP = 1.28, p(corr) = −0.79); TST (VIP = 1.21, p(corr) = −0.75); Physical activity-4 min (VIP = 1.12, p(corr) = −0.68); MaxVO2 (VIP = 1.08, p(corr) = −0.65); and Physical activity-3 days (VIP = 1.06, p(corr) = −0.65). Hence, a mix of self-reported variables and physical tests influenced group differentiation.
Relationships Between Physical Capacity and Body Composition Variables
The interrelationships between the physical capacity variables and body composition variables were analyzed using PCAs in all subjects together (R2cummulative = 0.52) and in FM (R2cummulative = 0.49) and in CON (R2cummulative = 0.41) using the two first most important components (see Table S1 in Supplementary text #1). These three analyses showed that some of the physical capacity variables (both subjective and objective) correlated negatively with several of the body composition variables even though the variables differed somewhat across the analyses. Hence, in FM VAT and liver fat correlated negatively and strongest with the three grip-variables and TST as well as with RPC and MaxVO2 (Table S1 in Supplementary text #1).
Regression of Group Membership Using Body Composition Variables and Physical Capacity Variables
The OPLS-DA regression of group (FM or CON) using body composition variables and physical capacity variables (Tables 2 and 3) as regressors was highly significant (R2 = 0.53, Q2 = 0.48, CV-ANOVA P-value = 4.26e-09) (Table 4). A mix of variables were significant and contributed to differentiate FM and CON – ie, physical tests (Grip-average, Grip-max, TST and MaxVo2), self-reported physical capacity (RPC), and body composition (VAT, T-MFI, T-MVZ, BMI, ASAT, and Liver fat) (Table 4).
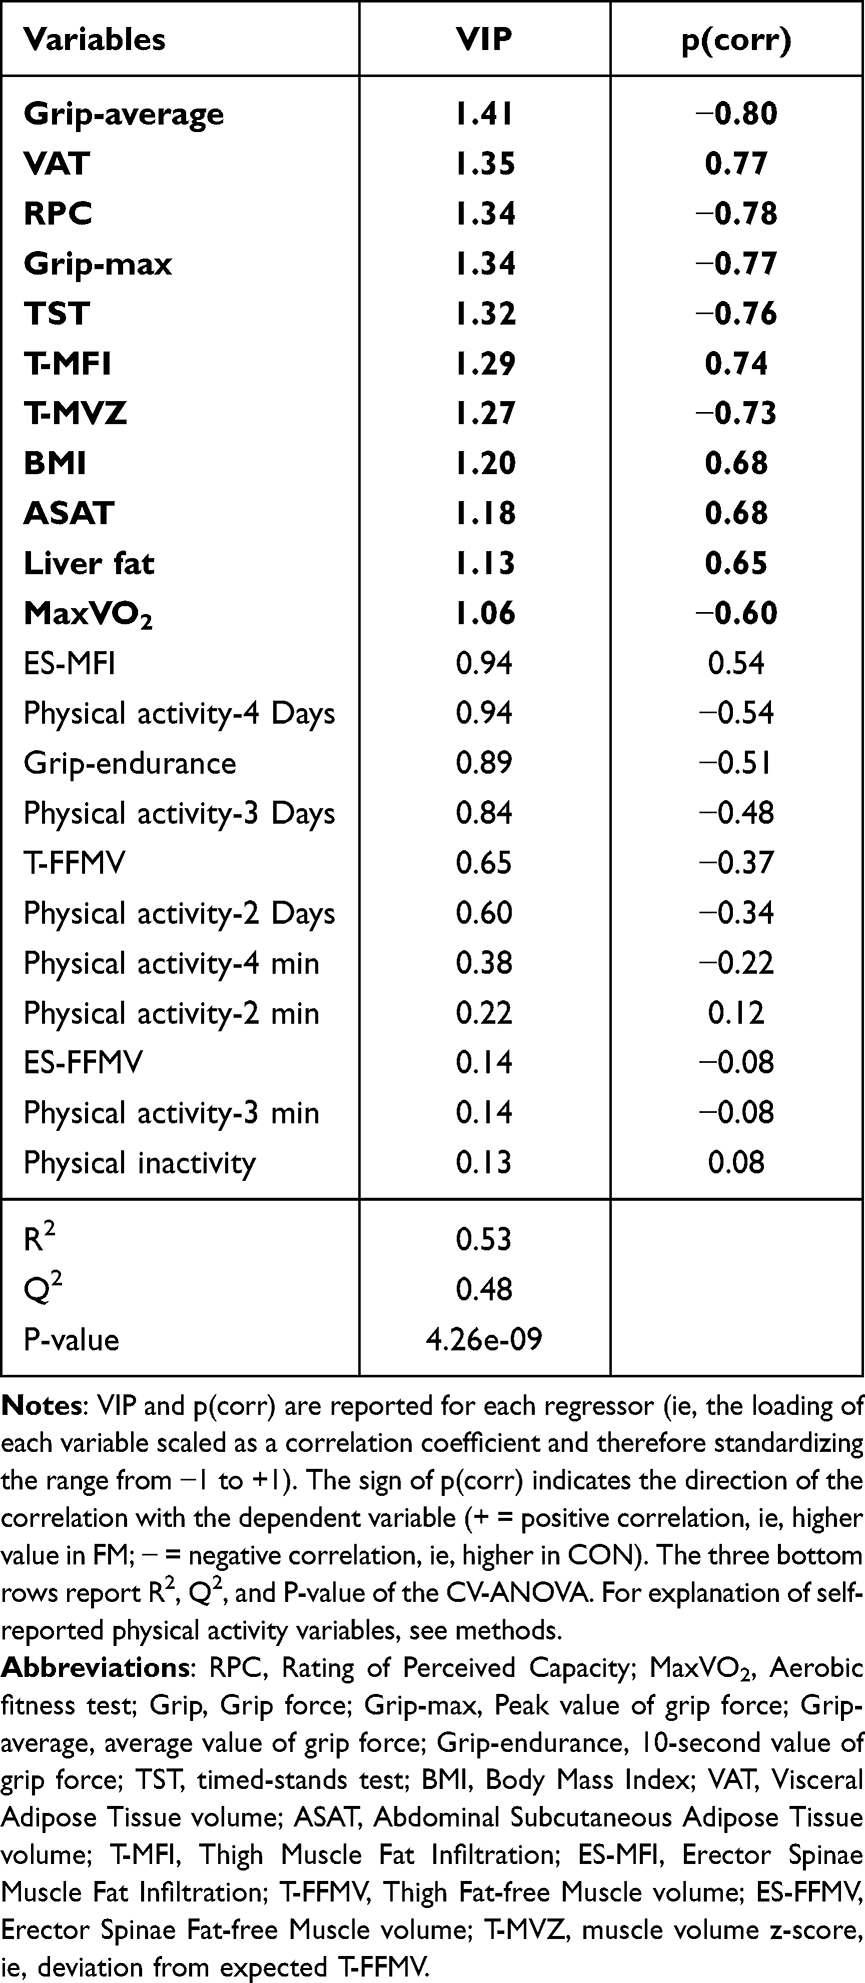 |
Table 4 OPLS-DA Regression of Group Membership (CON Denoted as 0 and FM Denoted as 1) Using Fat Infiltration Variables (Cf. Table 2) and Physical Capacity Variables (Self-Reports and Physical Tests; Cf. Table 3) as Regressors. Significant Variables in Bold Type |
Clinical Variables – Regression Analyses
Regression of Pain Intensity in FM
When pain intensity in FM was regressed using the physical capacity variables and the body composition variables, a mix of variables were significantly associated with NRS-7d (R2 = 0.45, Q2 = 0.32, CV ANOVA P-value = 0.0055) (Table 5). Hence, VAT, Liver fat, BMI, T-MFI, and ASAT were positively associated with pain intensity, and TST, the three grip variables, and RPC showed negative associations. VAT, liver fat, and TST had the strongest associations with pain intensity (Table 5).
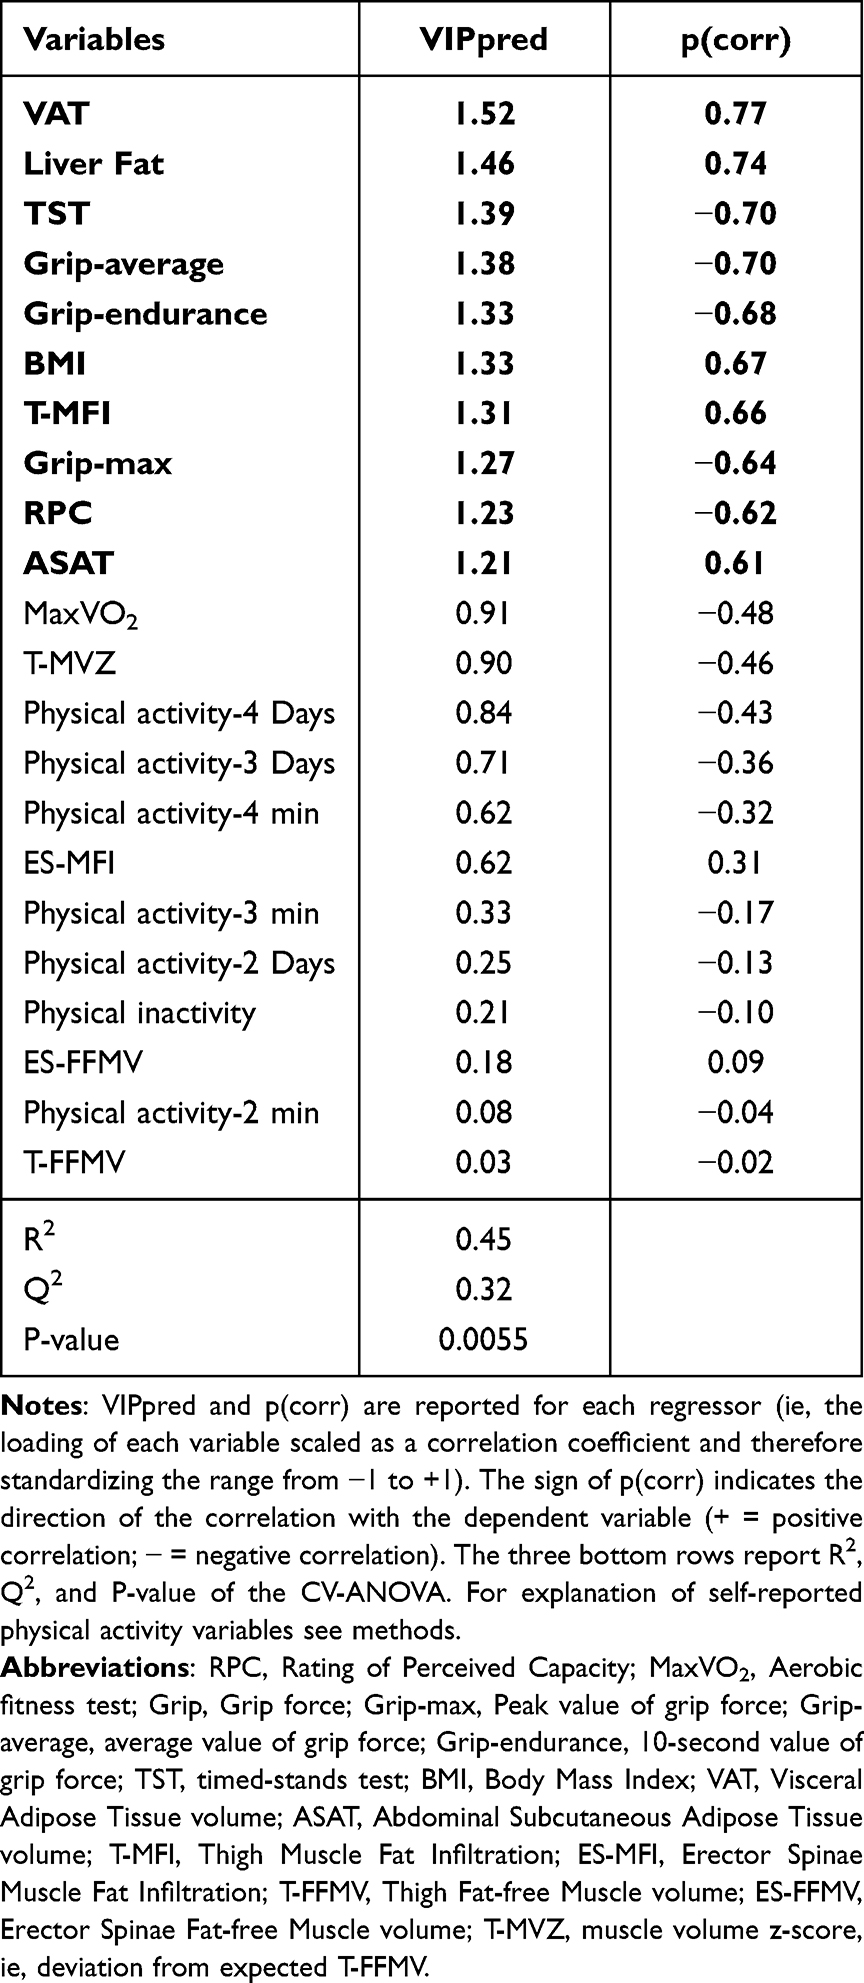 |
Table 5 OPLS Regression of Pain Intensity (NRS-7d) in Fibromyalgia Patients (FM) Using the Fat Infiltration Variables (Cf. Table 2) and the Physical Capacity Variables (Self-Reports and Physical Tests; Cf. Table 3) as Regressors (x–Variables). Variables in Bold are Significant |
A significant OPLS regression of NRS-7d was also obtained using only the physical capacity variables (R2 = 0.40, Q2 = 0.29, CV ANOVA P-value = 0.0083); the three Grip variables followed by TST, and RPC were significant regressors. No significant regression was obtained using only the fat infiltration variables as regressors (X–variables) of NRS-7d.
Regression of FIQ in FM
A significant regression was obtained for FIQ in FM using the physical capacity variables and the body composition variables (R2 = 0.45, Q2 = 0.33, CV ANOVA P-value = 0.0046) (Table 6). Hence, physical capacity variables (three grip variables, TST, RPC, and MaxVO2) showed significant negative associations with FIQ. VAT, liver fat, T-MFI, BMI, ASAT, and T-MVZ showed significant positive associations. Two grip variables, TST, and VAT showed the strongest associations with FIQ (Table 6).
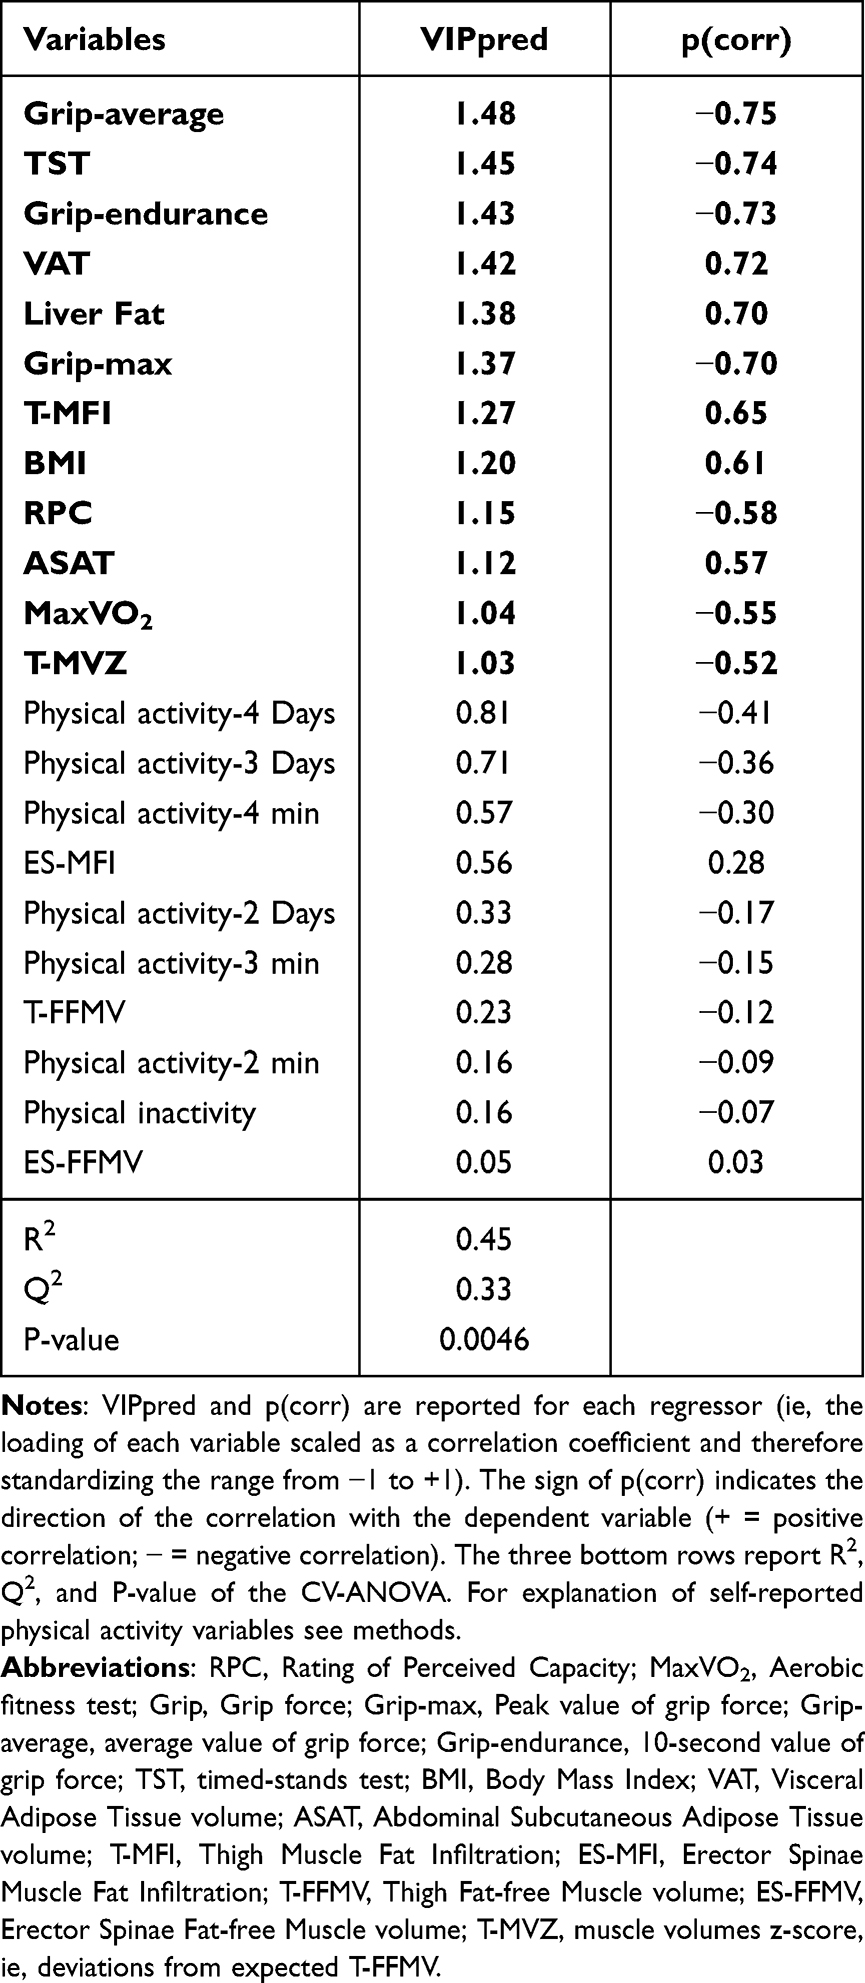 |
Table 6 OPLS Regression of FIQ in Fibromyalgia Patients (FM) Using the Fat Infiltration Variables (Cf. Table 2) and the Physical Capacity Variables (Self-Reports and Physical Tests; Cf. Table 3) as Regressors (x–Variables). Variables in Bold Type are Significant |
A significant OPLS regression was also obtained when only using the physical capacity variables as regressors (R2 = 0.39, Q2 = 0.24, CV ANOVA P-value = 0.027); the three grip variables, TST, and MaxVo2, in that order, were significant regressors. No significant regression was obtained using the body composition variables alone as regressors (X–variables).
Regression of Blood Pressures in FM
In FM (but not in CON), it was possible to significantly regress blood pressures. Body composition variables were the most important variables for both diastolic and systolic blood pressures in FM. When we also included clinical variables (ie, NRS-7d, HADS, PDI, tender points, FIQ, and PPT-tot) in the analysis, this pattern remained and the following variables were significant (R2 = 0.47, Q2 = 0.32, CV-ANOVA P-value = 0.004, one predictive component): VAT (VIP = 1.78, p(corr) = 0.86); BMI (VIP = 1.65, p(corr) = 0.79); ASAT (VIP = 1.62, p(corr) = 0.78); T-MFI (VIP = 1.50, p(corr) = 0.72); FIQ (VIP = 1.38, p(corr) = 0.68); NRS-7d (VIP = 1.37, p(corr) = 0.68); Grip average (VIP = 1.23, p(corr) = −0.59); liver fat (VIP = 1.18, p(corr) = 0.57); Grip-endur (VIP = 1.17, p(corr) = −0.56); TST (VIP = 1.11, p(corr) = −0.52); Grip-max (VIP = 1.09, p(corr) = −0.52); PDI (VIP = 1.06, p(corr) = 0.53); and ES-MFI (VIP = 1.01, p(corr) = 0.49).
Diastolic blood pressure resulted in a very similar pattern of important variables with the four most important the same and in the same order (data not shown) (R2 = 0.55, Q2 = 0.33, CV-ANOVA P-value = 0.003, and one predictive component).
Regressions of PPT-TOT, HADS, PDI, and EQ5D-VAS
A significant regression of PPT-tot was obtained for all subjects taken together but not separately in the two groups using the physical capacity variables and the body composition variables (data not shown). However, due to the prominent group differences in PPT, the results were very similar to the regression of group. Similar situations existed when regressing HADS, PDI, and EQ5D-VAS (data not shown).
Discussion
The following major results were obtained: 1) The adipose-tissue-related body composition variables, ie, VAT, ASAT, liver fat, T-MFI, ES-MFI, and BMI were significantly higher in FM. The FM group also had significantly smaller thigh muscles (T-FFMV and T-MVZ), but the spinal erector volume was not significantly different. 2) FM self-reported lower physical capacity, which agrees with results for objective physical tests reported earlier for this cohort.67 3) Both body composition variables and physical capacity variables were significantly associated with group belonging; the physical capacity variables showed stronger relationships with group membership than the body composition variables. 4) Physical capacity variables and several of the body composition variables intercorrelated negatively in FM. 5) Both pain intensity and FIQ were significantly associated with a blend of body composition variables and physical capacity variables. The physical capacity variables alone but not body composition variables could significantly regress both variables. 6) In FM, blood pressures were significantly associated with the body composition variables.
It is established that FM is associated with increased BMI and obesity,24 which also was found in the present study, and the prevalence of obesity was increased >6 times. BMI is an overall measure of body mass including fat, muscles, bones, etc. and is used as a surrogate for overall measure of fat content. In certain situations, BMI may not accurately reflect body fat content and other clinical measures have been proposed.47,80,81 Here, fat infiltration in two muscles and liver, viscera, and abdomen adipose tissue volumes were obtained. VAT, ASAT, and T-MFI were significantly associated with BMI; the regression explained 88% of the variation in BMI. Moreover, VAT was the most important fat content variable for group membership, and in FM for pain intensity, FIQ and blood pressures. VAT together with liver fat also correlated negatively with physical capacity variables in FM. Hence, it was a more important factor than BMI in these aspects. BMI, liver fat, ASAT, and T-MFI were also significant factors, but their relative importance varied across regressions. As recently summarized, increased VAT and ASAT are associated with increased risks for type 2 diabetes, cardiovascular diseases, sleep apnea, chronic obstructive pulmonary disease, stroke, and brain conditions including cancer.19 Linge et al reported that higher VAT, MFI, and liver fat but not ASAT were associated with coronary heart disease and type 2 diabetes,20 which are also prospectively verified for VAT and liver fat.21 In obese subjects, VAT and ASAT secrete, eg, inflammatory and immune compounds, and micro-RNAs, which can exert functional and pathophysiological alterations in various tissues.19
In another FM cohort, we reported increased MFI in the quadriceps muscle despite no significant group differences in BMI.29 The higher MFI is confirmed here, and we found increased MFI of the ES muscle group in FM. Hence, MFI in FM was significantly higher both in weightbearing muscles (thighs) as well as the spinal muscles.
Significantly higher fat infiltration in muscles within painful areas has been found in chronic low back pain82–84 and in chronic WAD30,85–88 compared to controls without significantly different BMI.84,85,87,89 Some studies indicate that fat infiltration in chronic WAD is local to the neck and not generalized89,90 and therefore is a direct or indirect consequence of acute trauma and/or pain. In chronic WAD, increased fat infiltration has been associated with clinical severity and poor recovery.85,91 Different explanations exist for the increased muscle fat infiltration in chronic WAD,87 and the influences of eg, age, sex, BMI, physical activity and stress, are insufficiently known.85 Local muscle fat infiltration may be associated with increased cytokine levels.92 Hence, a relationship between fat accumulation and inflammatory dysregulation was indicated even though a causal direction could not be established.92
In contrast to these local/regional chronic pain conditions, FM had higher BMI, increased fat infiltration in muscles and liver, and higher visceral and abdominal fat volumes. These findings could be the result of deconditioning in FM.33–35 We recently reported lower capacity according to physical tests for the present and another FM cohort.29,67 Most FM studies have used either self-reports or objective tests to assess physical activity levels.42 In the present study, several of the subjective reports agreed with the objective physical tests. For FM, longer sedentary time, sleep duration, and lower physical activity levels are independently associated with greater adiposity.93 The widespread pain in FM may be a barrier for physical activity and therefore deconditioning, increasing fat infiltration in a vicious circle. The present results’ significant negative associations in both groups between fat content and physical capacity variables support the idea that deconditioning is an important explanation for the increased fat infiltration even though this is a cross-sectional study. The lower FFMV in the thigh – a large weight-bearing muscle group important for mobility and physical activity – partly supports this interpretation.
Possibly, muscle fat infiltration in FM to some extent could be related to generalized pathophysiological processes in muscles and blood. For example, the present FM cohort showed signs of muscle mitochondrial dysfunction.67 In chronic widespread pain cohorts (mainly FM), have been found increased muscle interstitial metabolite concentrations,94–96 decreased phosphocreatine (PCr) and Adenosine Tri-Phosphate (ATP) muscle levels,29,67 and alterations in muscle lipid mediators.97,98 In blood, there are significant alterations in protein patterns related to immunity and inflammation99–102 and in lipid mediators.103–106 Hence, local/regional as in WAD and LBP or generalized peripheral nociceptive processes may contribute to increased fat infiltration.
Our study agrees with previous reports that obesity is associated with a worse clinical presentation (eg, pain intensity, disability, and sleep) in FM.22,24,107 However, these correlations have been weak in many studies.108 Both impact and pain intensity increased with increased fat infiltration according to the regressions (Tables 5 and 6). Segura-Jimenez et al reported significant associations between impact and total and central body fat.108 They suggested that the physical fitness may explain the association between obesity and FM symptoms.108 In agreement with those results were found that a mix of fat infiltration and volume variables and physical capacity variables were significantly associated with pain intensity and FIQ in FM. The combination of increased MFI with low FFMV has been shown to be strongly linked to poor activities of daily life, hospitalization, and all-cause mortality in the general population.77,109 Hence, signs of deconditioning together with more fat infiltration and volumes were associated with a worse clinical presentation. Our analysis shows, as in other studies, that physical activity performance is more strongly associated with pain intensity and FIQ than fat-related variables.
Obesity is a risk factor for hypertension.81 FM patients had significantly higher systolic blood pressure and a similar non-significant trend for diastolic pressure. An increased prevalence of hypertension is found in subjects with chronic pain110,111 and is more prevalent in widespread pain than in localized pain.111 This study found a significantly higher proportion of FM with a systolic blood pressure ≥130 mm Hg. Most studies report high prevalence of Metabolic syndrome (MetS) in FM,112–114 which is associated with increased risk for cardiovascular disease, diabetes mellitus, and all-cause mortality.113,115 The increased VAT, ASAT, liver fat, and BMI together with nearly a third of the patients displaying systolic hypertension may indicate that this FM cohort had increased prevalence of MetS. Moreover, we found that body composition variables (especially VAT, BMI, ASAT, and T-MFI) were significantly associated with blood pressures in FM. The clinical importance of these variables is emphasized by population-based data reporting that high VAT in combination with high or low liver fat are associated with atherosclerosis and increased risks for cardiovascular disease and type 2 diabetes.21 Resting blood pressure shows a negative relationship with pain sensitivity (blood pressure – related hypoalgesia) – ie, it is a pain inhibitory mechanism in healthy subjects and may involve endogenous opioids and α2-adrenergic pathways.110,116–118 In chronic pain conditions including FM dysfunction of this mechanism has been demonstrated.110,116,117 In subjects with resolved chronic pain, this mechanism is more effective than in patients with chronic pain.116 Obesity is associated with increased sensitivity to nociceptive stimuli in healthy subjects and in FM.23,119,120 In this study, FM had lower pain thresholds according to PPT (Table 1). However, we could not significantly regress PPT using BMI and other fat infiltration variables in FM, which could be due to the relatively small FM cohort.
Strengths and Limitations
We used MVDA to determine the relative importance of variables for group membership and in relation to clinical variables. Another strength is that we assessed the major adipose tissue and ectopic fat compartments and could do a more detailed link to body composition than would be possible with measures such as BMI. One limitation is the cross-sectional design, which does not allow for causal conclusions. Another limitation is the sample size, and our results need to be confirmed in larger studies. The 1990 ACR criteria for FM was used to compare with earlier studies. In future studies, both the 1990 ACR and newer criteria should be used.
Clinical Implications
The proportion of obesity was >6 times higher in FM. The patients also had smaller thigh muscles and higher MFI in both muscle groups. This study as well as other studies show that obesity has an additional negative influence on FM symptomatology.39,121 Our findings must be considered from the perspective that obesity is associated with increased risk for serious conditions such as type 2 diabetes, cardiovascular diseases, cancer, and dementia.122,123 Moreover, obesity can be considered a pain facilitator with contributions via mechanical stress, chronic low-grade inflammation, and neuroimmune factors in chronic pain including FM.123,124 Physical exercise can reverse part of obesity-related pathologies and result in lower body fat and weight,19 and there is clear evidence that FM patients benefit from physical exercise with respect to important clinical variables.33,96,125,126 Generally, nutrition interventions are effective on pain in patients with chronic pain conditions127 and are recommended by IASP. Hence, it is important to evaluate nutrition interventions in FM.128 Both physical exercise and a change in diet involve long-term behavioral changes and one should not underestimate the difficulties of making such changes when one has generalized pain along with frequent comorbidities, indeed several psychological factors could act as facilitators (eg, pain acceptance) or barriers (eg, pain catastrophizing),42 thus a multidisciplinary treatment is recommended.
Conclusion
The visceral, subcutaneous, liver, and muscle fat infiltration variables and BMI were significantly higher in FM, whereas muscle volume was lower in quadriceps but not in spinal erectors. Physical tests indicate deconditioning in FM. Physical capacity variables and several of the fat infiltration variables correlated negatively in FM. Body composition variables and physical capacity variables were significantly associated with group belonging (FM or CON). Both pain intensity and FIQ were significantly associated with a blend of body composition and physical capacity variables. The physical capacity variables were generally more important for group, pain intensity, and FIQ than fat infiltration variables. However, in FM, blood pressures were strongest and significantly associated with the body composition variables. Clearly, considering obesity, dietary habits, and level of physical activity should become very important in the clinical management of patients with FM.
Data Sharing Statement
The datasets generated and/or analyzed in this study are not publicly available as the Ethical Review Board has not approved the public availability of these data.
Acknowledgments
Research nurse Eva-Britt Lind and research physiotherapist Ulrika Wentzel Olausson are acknowledged for data collection and support during the clinical examinations.
Author Contributions
All authors made a significant contribution to the work reported, whether that is in the conception, study design, execution, acquisition of data, analysis and interpretation, or in all these areas; took part in drafting, revising or critically reviewing the article; gave final approval of the version to be published; have agreed on the journal to which the article has been submitted; and agree to be accountable for all aspects of the work.
Funding
This research was funded by grants from the Swedish Research Council (grant number: 2018-02470).
Disclosure
Björn Gerdle reports grants from Swedish research council during the conduct of the study. Olof Dahlqvist Leinhard reports non-financial support from AMRA Medical AB during the conduct of the study; and being an employee, board member, and share holder of AMRA Medical AB outside the submitted work. Mikael Fredrik Forsgren reports being an employee of AMRA Medical outside the submitted work. The authors declare no other potential conflicts of interest in relation to this work. The funders had no role in the design of the study, in the collection, analyses, or interpretation of data, in the writing of the article, or in the decision to publish the results.
References
1. Wolfe F, Walitt B, Perrot S, Rasker JJ, Hauser W. Fibromyalgia diagnosis and biased assessment: sex, prevalence and bias. PLoS One. 2018;13(9):e0203755. doi:10.1371/journal.pone.0203755
2. Gran JT. The epidemiology of chronic generalized musculoskeletal pain. Best Pract Res Clin Rheumatol. 2003;17(4):547–561. doi:10.1016/S1521-6942(03)00042-1
3. Queiroz LP. Worldwide epidemiology of fibromyalgia. Curr Pain Headache Rep. 2013;17(8):356. doi:10.1007/s11916-013-0356-5
4. Wolfe F, Smythe HA, Yunus MB, et al. The American College of rheumatology 1990 criteria for the classification of fibromyalgia. report of the multicenter criteria committee. Arthritis Rheum. 1990;33(2):160–172. doi:10.1002/art.1780330203
5. Wolfe F, Clauw DJ, Fitzcharles MA, et al. 2016 Revisions to the 2010/2011 fibromyalgia diagnostic criteria. Semin Arthritis Rheum. 2016;46(3):319–329. doi:10.1016/j.semarthrit.2016.08.012
6. Kosek E, Cohen M, Baron R, et al. Do we need a third mechanistic descriptor for chronic pain states? Pain. 2016;157(7):1382–1386. doi:10.1097/j.pain.0000000000000507
7. Jensen KB, Kosek E, Petzke F, et al. Evidence of dysfunctional pain inhibition in Fibromyalgia reflected in rACC during provoked pain. Pain. 2009;144(1–2):95–100. doi:10.1016/j.pain.2009.03.018
8. Schrepf A, Harper DE, Harte SE, et al. Endogenous opioidergic dysregulation of pain in fibromyalgia: a PET and fMRI study. Pain. 2016;157(10):2217–2225. doi:10.1097/j.pain.0000000000000633
9. Sluka KA, Clauw DJ. Neurobiology of fibromyalgia and chronic widespread pain. Neuroscience. 2016;338:114–129. doi:10.1016/j.neuroscience.2016.06.006
10. Goubert D, Danneels L, Graven-Nielsen T, Descheemaeker F, Meeus M. Differences in pain processing between patients with chronic low back pain, recurrent low back pain, and fibromyalgia. Pain Physician. 2017;20(4):307–318.
11. Gerdle B, Larsson B. Muscle. In: Häuser W, Perrot S, editors. Fibromyalgia Syndrome and Widespread Pain – From Construction to Relevant Recognition. Wolters Kluwer; 2018:215–231.
12. Littlejohn G, Guymer E. Neurogenic inflammation in fibromyalgia. Semin Immunopathol. 2018;40(3):291–300. doi:10.1007/s00281-018-0672-2
13. Üçeyler N, Sommer C. Small nerve fiber pathology. In: Häuser W, Perrot S, editors. Fibromylagia Syndrome and Widespread Pain - from Construction to Relevant Recognition. Philadelphia: Wolters Kluwer; 2018:204–214.
14. Albrecht DS, Forsberg A, Sandstrom A, et al. Brain glial activation in fibromyalgia - a multi-site positron emission tomography investigation. Brain Behav Immun. 2019;75:72–83. doi:10.1016/j.bbi.2018.09.018
15. Coskun Benlidayi I. Role of inflammation in the pathogenesis and treatment of fibromyalgia. Rheumatol Int. 2019;39(5):781–791. doi:10.1007/s00296-019-04251-6
16. van Ettinger-Veenstra H, Boehme R, Ghafouri B, Olausson H, Wicksell RK, Gerdle B. Exploration of functional connectivity changes previously reported in fibromyalgia and their relation to psychological distress and pain measures. J Clin Med. 2020;9(11):3560. doi:10.3390/jcm9113560
17. van Ettinger-Veenstra H, Lundberg P, Alfoldi P, et al. Chronic widespread pain patients show disrupted cortical connectivity in default mode and salience networks, modulated by pain sensitivity. J Pain Res. 2019;12:1743–1755. doi:10.2147/JPR.S189443
18. Eich W, Hartmann M, Muller A, Fischer H. The role of psychosocial factors in fibromyalgia syndrome. Scand J Rheumatol Suppl. 2000;113:30–31. doi:10.1080/030097400446607
19. Verdu E, Homs J, Boadas-Vaello P. Physiological changes and pathological pain associated with sedentary lifestyle-induced body systems fat accumulation and their modulation by physical exercise. Int J Environ Res Public Health. 2021;18(24):13333. doi:10.3390/ijerph182413333
20. Linge J, Borga M, West J, et al. Body composition profiling in the UK Biobank imaging study. Obesity. 2018;26(11):1785–1795. doi:10.1002/oby.22210
21. Tejani S, McCoy C, Ayers CR, et al. Cardiometabolic health outcomes associated with discordant visceral and liver fat phenotypes: insights from the Dallas heart study and UK Biobank. Mayo Clin Proc. 2022;97(2):225–237. doi:10.1016/j.mayocp.2021.08.021
22. Ursini F, Naty S, Grembiale RD. Fibromyalgia and obesity: the hidden link. Rheumatol Int. 2011;31(11):1403–1408. doi:10.1007/s00296-011-1885-z
23. Okifuji A, Donaldson GW, Barck L, Fine PG. Relationship between fibromyalgia and obesity in pain, function, mood, and sleep. J Pain. 2010;11(12):1329–1337. doi:10.1016/j.jpain.2010.03.006
24. D’Onghia M, Ciaffi J, Lisi L, et al. Fibromyalgia and obesity: a comprehensive systematic review and meta-analysis. Semin Arthritis Rheum. 2021;51(2):409–424. doi:10.1016/j.semarthrit.2021.02.007
25. Markkula RA, Kalso EA, Kaprio JA. Predictors of fibromyalgia: a population-based twin cohort study. BMC Musculoskelet Disord. 2016;17(1):29. doi:10.1186/s12891-016-0873-6
26. Mork PJ, Vasseljen O, Nilsen TI. Association between physical exercise, body mass index, and risk of fibromyalgia: longitudinal data from the Norwegian Nord-Trondelag Health Study. Arthritis Care Res. 2010;62(5):611–617. doi:10.1002/acr.20118
27. Migliorini F, Maffulli N, Eschweiler J, Tingart M, Driessen A, Colarossi G. BMI but not age and sex negatively impact on the outcome of pharmacotherapy in fibromyalgia: a systematic review. Expert Rev Clin Pharmacol. 2021;14(8):1029–1038. doi:10.1080/17512433.2021.1929923
28. Dong HJ, Dragioti E, Rivano Fischer M, Gerdle B. Lose pain, lose weight, and lose both: a cohort study of patients with chronic pain and obesity using a National Quality Registry. J Pain Res. 2021;14:1863–1873. doi:10.2147/JPR.S305399
29. Gerdle B, Forsgren M, Bengtsson A, et al. Decreased muscle concentrations of ATP and PCR in the quadriceps muscle of fibromyalgia patients - a 31P MRS study. Eur J Pain. 2013;17:1215. doi:10.1002/j.1532-2149.2013.00284.x
30. Elliott J, Jull G, Noteboom JT, Darnell R, Galloway G, Gibbon WW. Fatty infiltration in the cervical extensor muscles in persistent whiplash-associated disorders: a magnetic resonance imaging analysis. Spine. 2006;31(22):E847–855. doi:10.1097/01.brs.0000240841.07050.34
31. Verbunt JA, Smeets RJ, Wittink HM. Cause or effect? Deconditioning and chronic low back pain. Pain. 2010;149(3):428–430. doi:10.1016/j.pain.2010.01.020
32. Busch AJ, Webber SC, Richards RS, et al. Resistance exercise training for fibromyalgia. Cochrane Database Syst Rev. 2013;12:CD010884.
33. Masquelier E, D’Haeyere J. Physical activity in the treatment of fibromyalgia. Joint Bone Spine. 2021;88(5):105202. doi:10.1016/j.jbspin.2021.105202
34. Nelson NL. Muscle strengthening activities and fibromyalgia: a review of pain and strength outcomes. J Bodyw Mov Ther. 2015;19(2):370–376. doi:10.1016/j.jbmt.2014.08.007
35. Umay E, Gundogdu I, Ozturk EA. What happens to muscles in fibromyalgia syndrome. Ir J Med Sci. 2020;189(2):749–756. doi:10.1007/s11845-019-02138-w
36. Maquet D, Croisier JL, Renard C, Crielaard JM. Muscle performance in patients with fibromyalgia. Joint Bone Spine. 2002;69(3):293–299. doi:10.1016/S1297-319X(02)00373-1
37. Staud R, Robinson ME, Price DD. Isometric exercise has opposite effects on central pain mechanisms in fibromyalgia patients compared to normal controls. Pain. 2005;118(1–2):176–184. doi:10.1016/j.pain.2005.08.007
38. Larsson A, Palstam A, Lofgren M, et al. Resistance exercise improves muscle strength, health status and pain intensity in fibromyalgia–a randomized controlled trial. Arthritis Res Ther. 2015;17:161. doi:10.1186/s13075-015-0679-1
39. Atzeni F, Alciati A, Salaffi F, et al. The association between body mass index and fibromyalgia severity: data from a cross-sectional survey of 2339 patients. Rheumatol Adv Pract. 2021;5(1):rkab015. doi:10.1093/rap/rkab015
40. Varallo G, Scarpina F, Giusti EM, et al. Does kinesiophobia mediate the relationship between pain intensity and disability in individuals with chronic low-back pain and obesity? Brain Sci. 2021;11(6):684. doi:10.3390/brainsci11060684
41. Varallo G, Giusti EM, Scarpina F, Cattivelli R, Capodaglio P, Castelnuovo G. The association of kinesiophobia and pain catastrophizing with pain-related disability and pain intensity in obesity and chronic lower-back pain. Brain Sci. 2020;11(1):11. doi:10.3390/brainsci11010011
42. Varallo G, Scarpina F, Giusti EM, et al. The role of pain catastrophizing and pain acceptance in performance-based and self-reported physical functioning in individuals with fibromyalgia and obesity. J Pers Med. 2021;11(8):810. doi:10.3390/jpm11080810
43. Almirall M, Martinez-Mateu SH, Alegre C, et al. Dietary habits in patients with fibromyalgia: a cross-sectional study. Clin Exp Rheumatol. 2021;39(3):170–173. doi:10.55563/clinexprheumatol/5e0yzt
44. Lopez-Rodriguez MM, Granero Molina J, Fernandez Medina IM, Fernandez Sola C, Ruiz Muelle A. Patterns of food avoidance and eating behavior in women with fibromyalgia. Endocrinol Diabetes Nutr. 2017;64(9):480–490. doi:10.1016/j.endinu.2017.07.002
45. Hauser W, Klose P, Langhorst J, et al. Efficacy of different types of aerobic exercise in fibromyalgia syndrome: a systematic review and meta-analysis of randomised controlled trials. Arthritis Res Ther. 2010;12(3):R79. doi:10.1186/ar3002
46. Sosa-Reina MD, Nunez-Nagy S, Gallego-Izquierdo T, Pecos-Martin D, Monserrat J, Alvarez-Mon M. Effectiveness of therapeutic exercise in fibromyalgia syndrome: a systematic review and meta-analysis of randomized clinical trials. Biomed Res Int. 2017;2017:2356346. doi:10.1155/2017/2356346
47. Prentice AM, Jebb SA. Beyond body mass index. Obes Rev. 2001;2(3):141–147. doi:10.1046/j.1467-789x.2001.00031.x
48. Dupont W, Plummer W. Power and sample size calculations: a review and computer program. Control Clin Trials. 1990;11(2):116–128. doi:10.1016/0197-2456(90)90005-M
49. Rosendal L, Larsson B, Kristiansen J, et al.. Increase in muscle nociceptive substances and anaerobic metabolism in patients with trapezius myalgia: microdialysis in rest and during exercise. Pain. 2004;112(3):324–334. doi:10.1016/j.pain.2004.09.017
50. Ringqvist Å, Dragioti E, Björk M, Larsson B, Gerdle B. Moderate and stable pain reductions as a result of Interdisciplinary Pain Rehabilitation – a cohort study from the Swedish Quality Registry for Pain Rehabilitation (SQRP). J Clin Med. 2019;8:905. doi:10.3390/jcm8060905
51. LoMartire R, Ang BO, Gerdle B, Vixner L. Psychometric properties of short form-36 health survey, EuroQol 5-dimensions, and Hospital Anxiety and Depression Scale in patients with chronic pain. Pain. 2020;161(1):83–95. doi:10.1097/j.pain.0000000000001700
52. Bjelland I, Dahl AA, Haug TT, Neckelmann D. The validity of the Hospital Anxiety and Depression Scale. An updated literature review. J Psychosom Res. 2002;52(2):69–77. doi:10.1016/S0022-3999(01)00296-3
53. Zigmond AS, Snaith RP. The Hospital Anxiety and Depression Scale. Acta Psychiatr Scand. 1983;67(6):361–370. doi:10.1111/j.1600-0447.1983.tb09716.x
54. Hedin P, Hamne M, Burckhardt C, Engström-Laurent A. The fibromyalgia impact questionnaire, a Swedish translation of a new tool for evaluation of the fibromyalgia patient. Scand J Rheumatol. 1995;24(2):69–75. doi:10.3109/03009749509099287
55. Chibnall JT, Tait RC. The Pain Disability Index: factor structure and normative data. Arch Phys Med Rehab. 1994;75(10):1082–1086. doi:10.1016/0003-9993(94)90082-5
56. Tait RC, Chibnall JT, Krause S. The Pain Disability Index: psychometric properties. Pain. 1990;40(2):171–182. doi:10.1016/0304-3959(90)90068-O
57. EuroQol. EuroQol: a new facility for the measurement of health-related quality of life. Health Policy. 1990;16:199–208. doi:10.1016/0168-8510(90)90421-9
58. Brooks R. EuroQol: the current state of play. Health Policy. 1996;37(1):53–72. doi:10.1016/0168-8510(96)00822-6
59. Wisen AG, Wohlfart B. Aerobic and functional capacity in a group of healthy women: reference values and repeatability. Clin Physiol Funct Imaging. 2004;24(6):341–351. doi:10.1111/j.1475-097X.2004.00576.x
60. Wisen AG, Farazdaghi RG, Wohlfart B. A novel rating scale to predict maximal exercise capacity. Eur J Appl Physiol. 2002;87(4–5):350–357. doi:10.1007/s00421-002-0636-y
61. Olsson S. Studies of Physical Activity in the Swedish Population. Stockholm: The Swedish School of Sport and Health Sciences; 2016.
62. Wolfe F, Clauw DJ, Fitzcharles MA, et al. The American College of Rheumatology preliminary diagnostic criteria for fibromyalgia and measurement of symptom severity. Arthritis Care Res. 2010;62(5):600–610. doi:10.1002/acr.20140
63. Wolfe F, Clauw DJ, Fitzcharles MA, et al. Fibromyalgia criteria and severity scales for clinical and epidemiological studies: a modification of the ACR Preliminary Diagnostic Criteria for Fibromyalgia. JRheumatol. 2011;38(6):1113–1122. doi:10.3899/jrheum.100594
64. Arnold LM, Bennett RM, Crofford LJ, et al. AAPT diagnostic criteria for fibromyalgia. J Pain. 2019;20(6):611–628. doi:10.1016/j.jpain.2018.10.008
65. Wallin M, Liedberg G, Börsbo B, Gerdle B. Thermal detection and pain thresholds but not pressure pain thresholds are correlated with psychological factors in women with chronic whiplash-associated pain. Clin J Pain. 2012;28(3):211–221. doi:10.1097/AJP.0b013e318226c3fd
66. Lemming D, Borsbo B, Sjors A, et al. Single-point but not tonic cuff pressure pain sensitivity is associated with level of physical fitness–a study of non-athletic healthy subjects. PLoS One. 2015;10(5):e0125432. doi:10.1371/journal.pone.0125432
67. Gerdle B, Ghafouri B, Lund E, et al. Evidence of mitochondrial dysfunction in fibromyalgia: deviating muscle energy metabolism detected using microdialysis and magnetic resonance. J Clin Med. 2020;9(11):3527. doi:10.3390/jcm9113527
68. Nordenskiöld U, Grimby G. Grip force in patients with rheumatoid arthritis and fibromyalgia and in healthy subjects. A study with the Grippit instrument. Scand J Rheumatol. 1993;22:14–19. doi:10.3109/03009749309095105
69. Åstrand P, Rodahl K. Textbook of Work Physiology. New York: McGraw-Hill; 1986.
70. Csuka M, McCarty D. Simple method for measurement of lower extremity muscle strength. Am J Med. 1985;78(1):77–81. doi:10.1016/0002-9343(85)90465-6
71. Newcomer K, Krug H, Mahowald M. Validity and reliability of the timed-stands test for patients with rheumatoid arthritis and other chronic diseases. J Rheumatol. 1993;20(1):21–27.
72. Borga M, Ahlgren A, Romu T, Widholm P, Dahlqvist Leinhard O, West J. Reproducibility and repeatability of MRI-based body composition analysis. Magn Reson Med. 2020;84(6):3146–3156. doi:10.1002/mrm.28360
73. Borga M, Thomas EL, Romu T, et al. Validation of a fast method for quantification of intra-abdominal and subcutaneous adipose tissue for large-scale human studies. NMR Biomed. 2015;28(12):1747–1753. doi:10.1002/nbm.3432
74. Karlsson A, Rosander J, Romu T, et al. Automatic and quantitative assessment of regional muscle volume by multi-atlas segmentation using whole-body water-fat MRI. JMRI. 2015;41(6):1558–1569. doi:10.1002/jmri.24726
75. West J, Romu T, Thorell S, et al. Precision of MRI-based body composition measurements of postmenopausal women. PLoS One. 2018;13(2):e0192495. doi:10.1371/journal.pone.0192495
76. West J, Dahlqvist Leinhard O, Romu T, et al. Feasibility of MR-based body composition analysis in large scale population studies. PLoS One. 2016;11(9):e0163332. doi:10.1371/journal.pone.0163332
77. Linge J, Heymsfield SB, Dahlqvist Leinhard O. On the definition of sarcopenia in the presence of aging and obesity-initial results from UK Biobank. J Gerontol a Biol Sci Med Sci. 2020;75(7):1309–1316. doi:10.1093/gerona/glz229
78. Wheelock AM, Wheelock CE. Trials and tribulations of ‘omics data analysis: assessing quality of SIMCA-based multivariate models using examples from pulmonary medicine. Mol Biosyst. 2013;9(11):2589–2596. doi:10.1039/c3mb70194h
79. Eriksson L, Byrne T, Johansson E, Trygg J, Vikström C. Multi- and Megavariate Data Analysis: Basic Principles and Applications.
80. Chrysant SG, Chrysant GS. The single use of body mass index for the obesity paradox is misleading and should be used in conjunction with other obesity indices. Postgrad Med. 2019;131(2):96–102. doi:10.1080/00325481.2019.1568019
81. Jayedi A, Rashidy-Pour A, Khorshidi M, Shab-Bidar S. Body mass index, abdominal adiposity, weight gain and risk of developing hypertension: a systematic review and dose-response meta-analysis of more than 2.3 million participants. Obes Rev. 2018;19(5):654–667. doi:10.1111/obr.12656
82. Ozcan-Eksi EE, Eksi MS, Turgut VU, Canbolat C, Pamir MN. Reciprocal relationship between multifidus and psoas at L4-L5 level in women with low back pain. Br J Neurosurg. 2021;35(2):220–228. doi:10.1080/02688697.2020.1783434
83. Goubert D, De Pauw R, Meeus M, et al. Lumbar muscle structure and function in chronic versus recurrent low back pain: a cross-sectional study. Spine J. 2017;17(9):1285–1296. doi:10.1016/j.spinee.2017.04.025
84. Prasetyo M, Nindita N, Murdana IN, Prihartono J, Setiawan SI. Computed tomography evaluation of fat infiltration ratio of the multifidus muscle in chronic low back pain patients. Eur J Radiol Open. 2020;7:100293. doi:10.1016/j.ejro.2020.100293
85. Valera-Calero JA, Al-Buqain-Ortega A, Arias-Buria JL, Fernandez-de-Las-Penas C, Varol U, Ortega-Santiago R. Echo-intensity, fatty infiltration, and morphology ultrasound imaging assessment in healthy and whiplash associated disorders populations: an observational study. Eur Spine J. 2021;30(10):3059–3067. doi:10.1007/s00586-021-06915-z
86. Karlsson A, Leinhard OD, Aslund U, et al. An investigation of fat infiltration of the multifidus muscle in patients with severe neck symptoms associated with chronic whiplash-associated disorder. J Orthop Sports Phys Ther. 2016;46(10):886–893. doi:10.2519/jospt.2016.6553
87. Van Looveren E, Cagnie B, Coppieters I, Meeus M, De Pauw R. Changes in muscle morphology in female chronic neck pain patients using magnetic resonance imaging. Spine. 2021;46(10):638–648. doi:10.1097/BRS.0000000000003856
88. Elliott JM, Smith AC, Hoggarth MA, et al. Muscle fat infiltration following whiplash: a computed tomography and magnetic resonance imaging comparison. PLoS One. 2020;15(6):e0234061. doi:10.1371/journal.pone.0234061
89. Karlsson A, Peolsson A, Elliott J, et al. The relation between local and distal muscle fat infiltration in chronic whiplash using magnetic resonance imaging. PLoS One. 2019;14(12):e0226037. doi:10.1371/journal.pone.0226037
90. Pedler A, McMahon K, Galloway G, Durbridge G, Sterling M. Intramuscular fat is present in cervical multifidus but not soleus in patients with chronic whiplash associated disorders. PLoS One. 2018;13(5):e0197438. doi:10.1371/journal.pone.0197438
91. Elliott JM. Are there implications for morphological changes in neck muscles after whiplash injury? Spine. 2011;36(25 Suppl):S205–210. doi:10.1097/BRS.0b013e3182387f57
92. James G, Chen X, Diwan A, Hodges PW. Fat infiltration in the multifidus muscle is related to inflammatory cytokine expression in the muscle and epidural adipose tissue in individuals undergoing surgery for intervertebral disc herniation. Eur Spine J. 2021;30(4):837–845. doi:10.1007/s00586-020-06514-4
93. Gavilan-Carrera B, Acosta-Manzano P, Soriano-Maldonado A, et al. Sedentary time, physical activity, and sleep duration: associations with body composition in fibromyalgia. The Al-Andalus Project. J Clin Med. 2019;8(8):1260. doi:10.3390/jcm8081260
94. Gerdle B, Larsson B, Forsberg F, et al. Chronic widespread pain: increased glutamate and lactate concentrations in the trapezius muscle and plasma. Clin J Pain. 2014;30(5):409–420. doi:10.1097/AJP.0b013e31829e9d2a
95. Gerdle B, Soderberg K, Salvador Puigvert L, Rosendal L, Larsson B. Increased interstitial concentrations of pyruvate and lactate in the trapezius muscle of patients with fibromyalgia: a microdialysis study. J Rehabil Med. 2010;42(7):679–687. doi:10.2340/16501977-0581
96. Gerdle B, Ernberg M, Mannerkorpi K, et al. Increased interstitial concentrations of glutamate and pyruvate in vastus lateralis of women with fibromyalgia syndrome are normalized after an exercise intervention - a case-control study. PLoS One. 2016;11(10):e0162010. doi:10.1371/journal.pone.0162010
97. Ghafouri N, Ghafouri B, Larsson B, Stensson N, Fowler CJ, Gerdle B. Palmitoylethanolamide and stearoylethanolamide levels in the interstitium of the trapezius muscle of women with chronic widespread pain and chronic neck-shoulder pain correlate with pain intensity and sensitivity. Pain. 2013;154(9):1649–1658. doi:10.1016/j.pain.2013.05.002
98. Stensson N, Ghafouri B, Ghafouri N, Gerdle B. High levels of endogenous lipid mediators (N-acylethanolamines) in women with chronic widespread pain during acute tissue trauma. Mol Pain. 2016;12:1744806916662886.
99. Wåhlén K, Olausson P, Carlsson A, Ghafouri N, Gerdle B. Systemic alteration of plasma proteins from women with chronic widespread pain compared to healthy controls; a proteomic study. J Pain Res. 2017;10:797–809. doi:10.2147/JPR.S128597
100. Han CL, Sheng YC, Wang SY, Chen YH, Kang JH. Serum proteome profiles revealed dysregulated proteins and mechanisms associated with fibromyalgia syndrome in women. Sci Rep. 2020;10(1):12347. doi:10.1038/s41598-020-69271-w
101. Wåhlén K, Ernberg M, Kosek E, Mannerkorpi K, Gerdle B, Ghafouri B. Significant correlation between plasma proteome profile and pain intensity, sensitivity, and psychological distress in women with fibromyalgia. Sci Rep. 2020;10(1):12508. doi:10.1038/s41598-020-69422-z
102. Ramirez-Tejero JA, Martinez-Lara E, Rus A, Camacho MV, Del Moral ML, Siles E. Insight into the biological pathways underlying fibromyalgia by a proteomic approach. J Proteomics. 2018;186:47–55. doi:10.1016/j.jprot.2018.07.009
103. Stensson N, Ghafouri N, Ernberg M, et al. The relationship of endocannabinoidome lipid mediators with pain and psychological stress in women with fibromyalgia: a case-control study. J Pain. 2018;19(11):1318–1328. doi:10.1016/j.jpain.2018.05.008
104. Stensson N, Ghafouri B, Gerdle B, Ghafouri N. Alterations of anti-inflammatory lipids in plasma from women with chronic widespread pain - a case control study. Lipids Health Dis. 2017;16(1):112. doi:10.1186/s12944-017-0505-7
105. Gerdle B, Ghafouri B, Ghafouri N, Bäckryd E, Gordh T. Signs of ongoing inflammation in female patients with chronic widespread pain - a multivariate, explorative, cross-sectional study of blood samples. Medicine. 2017;96(9):e6130. doi:10.1097/MD.0000000000006130
106. Backryd E, Tanum L, Lind AL, Larsson A, Gordh T. Evidence of both systemic inflammation and neuroinflammation in fibromyalgia patients, as assessed by a multiplex protein panel applied to the cerebrospinal fluid and to plasma. J Pain Res. 2017;10:515–525. doi:10.2147/JPR.S128508
107. Aparicio VA, Segura-Jimenez V, Alvarez-Gallardo IC, et al. Are there differences in quality of life, symptomatology and functional capacity among different obesity classes in women with fibromyalgia? The al-Andalus project. Rheumatol Int. 2014;34(6):811–821. doi:10.1007/s00296-013-2908-8
108. Segura-Jimenez V, Castro-Pinero J, Soriano-Maldonado A, et al. The association of total and central body fat with pain, fatigue and the impact of fibromyalgia in women; role of physical fitness. Eur J Pain. 2016;20(5):811–821. doi:10.1002/ejp.807
109. Linge J, Petersson M, Forsgren MF, Sanyal AJ, Dahlqvist Leinhard O. Adverse muscle composition predicts all-cause mortality in the UK Biobank imaging study. J Cachexia Sarcopenia Muscle. 2021;12(6):1513–1526. doi:10.1002/jcsm.12834
110. Olsen RB, Bruehl S, Nielsen CS, Rosseland LA, Eggen AE, Stubhaug A. Hypertension prevalence and diminished blood pressure-related hypoalgesia in individuals reporting chronic pain in a general population: the Tromso study. Pain. 2013;154(2):257–262. doi:10.1016/j.pain.2012.10.020
111. Grimby-Ekman A, Gerdle B, Bjork J, Larsson B. Comorbidities, intensity, frequency and duration of pain, daily functioning and health care seeking in local, regional, and widespread pain - a descriptive population-based survey (SwePain). BMC Musculoskelet Disord. 2015;16:165. doi:10.1186/s12891-015-0631-1
112. Cakit O, Gumustepe A, Duyur Cakit B, Pervane Vural S, Ozgun T, Genc H. Coexistence of fibromyalgia and metabolic syndrome in females: the effects on fatigue, clinical features, pain sensitivity, urinary cortisol and norepinephrine levels: a cross-sectional study. Arch Rheumatol. 2021;36(1):26–37. doi:10.46497/ArchRheumatol.2021.7534
113. Loevinger BL, Muller D, Alonso C, Coe CL. Metabolic syndrome in women with chronic pain. Metabolism. 2007;56(1):87–93. doi:10.1016/j.metabol.2006.09.001
114. Alberti KG, Eckel RH, Grundy SM, et al. Harmonizing the metabolic syndrome: a joint interim statement of the International Diabetes federation task force on epidemiology and prevention; national heart, lung, and blood institute; American Heart Association; World Heart Federation; International Atherosclerosis Society; and International Association for the Study of Obesity. Circulation. 2009;120(16):1640–1645. doi:10.1161/CIRCULATIONAHA.109.192644
115. Grundy SM, Brewer HB, Cleeman JI, et al. Definition of metabolic syndrome: report of the National Heart, Lung, and Blood Institute/American Heart Association conference on scientific issues related to definition. Circulation. 2004;109(3):433–438. doi:10.1161/01.CIR.0000111245.75752.C6
116. de la Coba P, Bruehl S, Garber J, Smith CA, Walker LS. Is resolution of chronic pain associated with changes in blood pressure-related hypoalgesia? Ann Behav Med. 2018;52(7):552–559. doi:10.1093/abm/kax021
117. de la Coba P, Bruehl S, Duschek S, Reyes del paso GA. Reyes DEl Paso GA. Blood pressure-related pain modulation in fibromyalgia: differentiating between static versus dynamic pain indicators. Int J Psychophysiol. 2018;134:79–85. doi:10.1016/j.ijpsycho.2018.10.006
118. Sacco M, Meschi M, Regolisti G, et al. The relationship between blood pressure and pain. J Clin Hypertens. 2013;15(8):600–605. doi:10.1111/jch.12145
119. McKendall MJ, Haier RJ. Pain sensitivity and obesity. Psychiatry Res. 1983;8(2):119–125. doi:10.1016/0165-1781(83)90099-9
120. Pradalier A, Willer JC, Boureau F, Dry J. Relationship between pain and obesity: an electrophysiological study. Physiol Behav. 1981;27(6):961–964. doi:10.1016/0031-9384(81)90354-1
121. Correa-Rodriguez M, Mansouri-Yachou JE, Casas-Barragan A, Molina F, Rueda-Medina B, Aguilar-Ferrandiz ME. The association of body mass index and body composition with pain, disease activity, fatigue, sleep and anxiety in women with fibromyalgia. Nutrients. 2019;11(5):1193. doi:10.3390/nu11051193
122. Khaodhiar L, McCowen KC, Blackburn GL. Obesity and its comorbid conditions. Clin Cornerstone. 1999;2(3):17–31. doi:10.1016/S1098-3597(99)90002-9
123. Eichwald T, Talbot S. Neuro-immunity controls obesity-induced pain. Front Hum Neurosci. 2020;14:181. doi:10.3389/fnhum.2020.00181
124. Malfliet A, Quiroz Marnef A, Nijs J, et al. Obesity hurts: the why and how of integrating weight reduction with chronic pain management. Phys Ther. 2021;101(11):pzab198. doi:10.1093/ptj/pzab198
125. Gavilan-Carrera B, Segura-Jimenez V, Mekary RA, et al. Substituting sedentary time with physical activity in fibromyalgia and the association with quality of life and impact of the disease: the Al-Andalus Project. Arthritis Care Res. 2019;71(2):281–289. doi:10.1002/acr.23717
126. Gavilan-Carrera B, Segura-Jimenez V, Estevez-Lopez F, et al. Association of objectively measured physical activity and sedentary time with health-related quality of life in women with fibromyalgia: the al-Andalus project. J Sport Health Sci. 2019;8(3):258–266. doi:10.1016/j.jshs.2018.07.001
127. Brain K, Burrows TL, Rollo ME, et al. A systematic review and meta-analysis of nutrition interventions for chronic noncancer pain. J Hum Nutr Diet. 2019;32(2):198–225. doi:10.1111/jhn.12601
128. Tomaino L, Serra-Majem L, Martini S, et al. Fibromyalgia and nutrition: an updated review. J Am Coll Nutr. 2021;40(7):665–678. doi:10.1080/07315724.2020.1813059
 © 2022 The Author(s). This work is published by Dove Medical Press Limited, and licensed under a
Creative Commons Attribution License.
The full terms of the License are available at http://creativecommons.org/licenses/by/4.0/.
The license permits unrestricted use, distribution, and reproduction in any medium, provided the
original author and source are credited.
© 2022 The Author(s). This work is published by Dove Medical Press Limited, and licensed under a
Creative Commons Attribution License.
The full terms of the License are available at http://creativecommons.org/licenses/by/4.0/.
The license permits unrestricted use, distribution, and reproduction in any medium, provided the
original author and source are credited.
Recommended articles
Skeletal Myosteatosis is Associated with Systemic Inflammation and a Loss of Muscle Bioenergetics in Stable COPD
Persson HL, Sioutas A, Kentson M, Jacobson P, Lundberg P, Dahlqvist Leinhard O, Forsgren MF
Journal of Inflammation Research 2022, 15:4367-4384
Published Date: 1 August 2022
Effects of Hypnotic Analgesia and Transcranial Direct Current Stimulation on Pain Tolerance and Corticospinal Excitability in Individuals with Fibromyalgia: A Cross-Over Randomized Clinical Trial
Schein B, Beltran G, França BR, Sanches PR, Silva DP Jr, Torres IL, Fegni F, Caumo W
Journal of Pain Research 2023, 16:187-203
Published Date: 24 January 2023
The Safety and Efficacy of Low-Dose Naltrexone in Patients with Fibromyalgia: A Systematic Review
Yang J, Shin KM, Do A, Bierle DM, Abu Dabrh AM, Yin Z, Bauer BA, Mohabbat AB
Journal of Pain Research 2023, 16:1017-1023
Published Date: 21 March 2023
The Influence of Visceral Adiposity on Overall Survival: Exploring “Obesity Paradox” Among Hepatocellular Carcinoma Patients Who Receiving Immunotherapy
Zhou Y, Ouyang J, Yang H, Wang Z, Yang Y, Li Q, Zhao H, Zhou J, Li Q
Journal of Hepatocellular Carcinoma 2024, 11:1193-1206
Published Date: 24 June 2024
Hyperbaric Oxygen Therapy in Managing Chronic Pain Syndromes – A Systematic Review
Leys AM, Hans GH, Saldien V, Wildemeersch D
Journal of Pain Research 2026, 19:597243
Published Date: 24 March 2026