Back to Journals » International Journal of Chronic Obstructive Pulmonary Disease » Volume 18
Severity of Lung Function Impairment Drives Transcriptional Phenotypes of COPD and Relates to Immune and Metabolic Processes
Authors Negewo NA, Gibson PG, Simpson JL ![]() , McDonald VM
, McDonald VM ![]() , Baines KJ
, Baines KJ ![]()
Received 1 September 2022
Accepted for publication 15 February 2023
Published 14 March 2023 Volume 2023:18 Pages 273—287
DOI https://doi.org/10.2147/COPD.S388297
Checked for plagiarism Yes
Review by Single anonymous peer review
Peer reviewer comments 2
Editor who approved publication: Prof. Dr. Richard Russell
Netsanet A Negewo,1 Peter G Gibson,2– 4 Jodie L Simpson,1 Vanessa M McDonald,2– 5 Katherine J Baines1
1Immune Health Research Program, Hunter Medical Research Institute, New Lambton Heights, NSW, Australia; 2Centre of Excellence in Treatable Traits, University of Newcastle, New Lambton Heights, NSW, Australia; 3Department of Respiratory and Sleep Medicine, John Hunter Hospital, Newcastle, NSW, Australia; 4Asthma and Breathing Research Centre, Hunter Medical Research Centre, New Lambton Heights, NSW, Australia; 5School of Nursing and Midwifery, The University of Newcastle, Callaghan, NSW, Australia
Correspondence: Katherine J Baines, Hunter Medical Research Institute, Level 2 East Wing, Locked Bag 1000, New Lambton Heights, NSW, 2305, Australia, Tel +61 2 40420090, Fax +61 2 40420046, Email [email protected]
Purpose: This study sought to characterize transcriptional phenotypes of COPD through unsupervised clustering of sputum gene expression profiles, and further investigate mechanisms underlying the characteristics of these clusters.
Patients and methods: Induced sputum samples were collected from patients with stable COPD (n = 72) and healthy controls (n = 15). Induced sputum was collected for inflammatory cell counts, and RNA extracted. Transcriptional profiles were generated (Illumina Humanref-8 V2) and analyzed by GeneSpring GX14.9.1. Unsupervised hierarchical clustering and differential gene expression analysis were performed, and gene alterations validated in the ECLIPSE dataset (GSE22148).
Results: We identified 2 main clusters (Cluster 1 [n = 35] and Cluster 2 [n = 37]), which further divided into 4 sub-clusters (Sub-clusters 1.1 [n = 14], 1.2 [n = 21], 2.1 [n = 20] and 2.2 [n = 17]). Compared with Cluster 1, Cluster 2 was associated with significantly lower lung function (p = 0.014), more severe disease (p = 0.009) and breathlessness (p = 0.035), and increased sputum neutrophils (p = 0.031). Sub-cluster 1.1 had significantly higher proportion of people with comorbid cardiovascular disease compared to the other 3 sub-clusters (92.5% vs 57.1%, 50% and 52.9%, p < 0.013). Through supervised analysis we determined that degree of airflow limitation (GOLD stage) was the predominant factor driving gene expression differences in our transcriptional clusters. There were 452 genes (adjusted p < 0.05 and ≥ 2 fold) altered in GOLD stage 3 and 4 versus 1 and 2, of which 281 (62%) were also found to be significantly expressed between these GOLD stages in the ECLIPSE data set (GSE22148). Differentially expressed genes were largely downregulated in GOLD stages 3 and 4 and connected in 5 networks relating to lipoprotein and cholesterol metabolism; metabolic processes in oxidation/reduction and mitochondrial function; antigen processing and presentation; regulation of complement activation and innate immune responses; and immune and metabolic processes.
Conclusion: Severity of lung function drives 2 distinct transcriptional phenotypes of COPD and relates to immune and metabolic processes.
Keywords: COPD, gene expression, inflammation, sputum
Introduction
Chronic obstructive pulmonary disease (COPD) is a major global health problem with a high illness burden and rising incidence,1 and is expected to remain a challenge for health-care systems well into the 21st century.2 Previously, the disease management of COPD was mainly based on the severity of airflow obstruction, as assessed by forced expiratory volume in 1 second (FEV1).3,4 However, research in the field has shown that the one-dimensional analysis of FEV1 fails to adequately address the multiple dimensions of COPD.4 Heterogeneity of COPD is represented in the broad spectrum of respiratory and systemic symptoms, histopathological and radiographic findings, pulmonary physiology and likely different underlying molecular mechanisms (endotypes). There is much recent research interest surrounding the presence of disease phenotypes of COPD that may have different underlying mechanisms and the need for alternative management and treatment approaches.
The use of analytical approaches, such as cluster analysis, has advanced the study of disease phenotypes.5 Several possible phenotypes of COPD have been identified in various studies that have used cluster analysis.5,6 Some of these COPD phenotypes include non-exacerbator, exacerbation prone, emphysematous COPD, non-smoking COPD and the comorbidity or systemic phenotype.5,7,8 As Barnes et al8 noted, “it is likely that molecular phenotyping may lead to the identification of distinct phenotypes linked to specific molecular processes, which can be recognized by specific biomarkers and may be treated more precisely with new or repurposed therapies”.
Transcriptomics can provide useful information relating to disease heterogeneity, mechanisms of pathogenesis, treatment responses and classifications of COPD, along with an opportunity for novel biomarker discovery.9,10 Over the past few years, a number of studies have examined transcriptomics in COPD cohorts using samples obtained from lung tissue,11–16 blood,16–22 and spontaneous23 and induced sputum.16,20–22,24–27 However, these studies have not investigated unbiased clustering of whole transcriptomic profiles, how these clusters relate to clinical and inflammatory phenotypes, and what underlying mechanisms and features are driving these transcriptional clusters. Induced sputum has proven to be very valuable for molecular profiling of COPD, likely due to its less invasive nature compared to obtaining lung tissue.22,24–27 Gene expression patterns derived from induced sputum have been associated with disease severity,27 COPD inflammatory phenotypes25 and treatment response.20
Studies that utilize cluster analysis combining transcriptomic datasets with COPD-related clinical characteristics, comorbidities and biomarker are important in helping better understand mechanisms underlying the disease as well as strengthening the robustness of any identified COPD phenotypes.28 This study used unsupervised hierarchical clustering of induced sputum gene expression profiles of 72 stable COPD patients from Newcastle area (Australia) to identify distinct and clinically relevant transcriptional COPD phenotypes, and the driving factors behind these cluster phenotypes.
Materials and Methods
Study Design and Population
A cross-sectional analytical study was conducted involving 72 participants with stable COPD and 15 healthy controls. The data for this sub study were obtained from our previously published studies.29–31 Participants with remaining stored sputum samples available for RNA extraction, where the RNA was of appropriate quality and yield, were included in the present study. All participants provided written informed consent, and ethics approval was obtained from the Human Ethics Research Committees of the Hunter New England Local Health District (06/12/13/3.08, 05/12/07/3.11 and 08/08/20/3.10) and the University of Newcastle (H-2008-0272). This study complies with the ethical principles of the Declaration of Helsinki.
COPD diagnosis was confirmed by incompletely reversible airflow limitation (post-bronchodilator forced expiratory volume in 1 second [FEV1] <80% predicted and FEV1 to forced vital capacity [FVC] ratio of <0.7). Stable COPD was defined as no increase in bronchodilator use, no use of oral corticosteroids or antibiotics, no unscheduled doctor’s visit, or no hospitalization due to COPD in the past 4 weeks. Healthy control participants were recruited by advertisement and were eligible if they had no previous COPD diagnosis and normal lung function (FEV1 >80% predicted, FEV1/FVC >0.7).
Clinical Assessment
Adults (n = 72) with stable physician-diagnosed COPD and healthy controls (n = 15) attended the research centre, data collection included demographic information, lung function, smoking and medical history, medication use, comorbidities (Charlson Comorbidity index (CCI)),32 dyspnea (modified Medical Research Council [mMRC] scale),33 self-reported prior year exacerbation and hospitalization history, and health-related quality of life (St George’s Respiratory Questionnaire [SGRQ]).34 Airflow limitation was assessed using spirometry (Medgraphics, CPFS/D™ USB Spirometer, BreezeSuite v7.1, MGC Diagnostics, Saint Paul, MN, USA) to measure pre- and post-bronchodilator FEV1, FVC, and FEV1/FVC ratio according to the standards of the American Thoracic Society.35 Severity of COPD was graded according to the Global Initiative for Chronic Obstructive Lung Disease (GOLD) classification system of airflow limitation based on post-bronchodilator FEV1% predicted (ie, GOLD grade 1, FEV1 ≥80%; GOLD grade 2, 50%≤ FEV1 <80%; GOLD grade 3, 30%≤ FEV1 <50%; GOLD grade 4, FEV1 <30%).1 Participants were evaluated using GOLD quadrants according to the refined GOLD “ABCD” assessment tool (using mMRC for symptom assessment).1 A 6-minute walk test was performed36 and the BODE index (Body mass index [BMI], airflow Obstruction, Dyspnoea and Exercise capacity) calculated.37 Peripheral venous blood was collected and serum high-sensitivity C-reactive protein (hs-CRP) was measured using enzyme-linked immunosorbent assay.
Sputum Induction and Analysis
Sputum collection and analysis were performed as previously described38–40 and detailed methods are provided in the Methods Section of Supplementary Information.
Sputum Transcriptomics
Transcriptomic data were generated as previously described.41 Briefly, sputum RNA was extracted using the RNeasy Mini Kit (Qiagen, Hilden, Germany) and reverse transcribed into cRNA and biotin-UTP labelled using the Illumina TotalPrep RNA Amplification Kit (Ambion, Thermo Fisher Scientific, Scoresby, VIC, Australia) and hybridized to the Illumina Sentrix HumanRef-8 Version 2 Expression BeadChips (Illumina, San Diego, CA, USA). Samples and gene profiling results were included in the analysis if the sample was of suitable purity (OD 260/280 1.7–2.1) and was successfully amplified (sufficient cRNA generated) and hybridized (95th percentile of fluorescence score >500) and the data passed quality controls in GeneSpring GX (correlation coefficients and principle component analysis plots; Agilent Technologies, Santa Clara, Calif).
Statistical Analysis
Clinical and cell count data were analysed using Stata 15 (StataCorp, College Station, TX). Results are reported as mean ± standard deviation (SD) for normally distributed data and as median (quartile 1, quartile 3) for nonparametric data. Student’s t-test was used for 2 group comparisons of normally distributed data, and Wilcoxon rank sum test was used for non-parametric data. Comparisons between multiple groups were assessed using Kruskal Wallis for non-parametric data. Comparison of categorical data was done using Fisher’s exact test. P-values <0.05 were considered significant.
Sputum transcriptomic data analysis was performed as previously described,41 and is described in more detail in the Methods Section of Supplementary Information. The data reported in this paper is deposited in the National Center for Biotechnology Information’s Gene Expression Omnibus (GSE212331). To investigate the natural groupings created by the similarities and differences of the sputum from participants, gene expression profiles were subjected to unsupervised agglomerative hierarchical clustering by using the Euclidean algorithm with Ward’s linkage. Differentially expressed genes that were found to be linked with the only significant factor driving our cluster groupings (ie, GOLD stage) were further validated by investigating their differences in the ECLIPSE data set GSE2214827 which consists of 148 ex-smokers with GOLD stage 2–4 COPD (GOLD stage 2, n = 74 and GOLD stage 3 and 4, n = 74). A brief summary of the ECLIPSE cohort27 is provided in the Methods Section of Supplementary Information.
Results
Clinical Characteristics
Details of the study participants are provided in Table 1. Participants with COPD (n = 72) had a median age of 70 (64, 75.5) years and mean post-bronchodilator predicted FEV1 of 54 (15.8) %. There were 34 (47.2%) females. Fifty-seven (79.2%) participants were ex-smokers, with median (Q1-Q3) pack-years of 33 (15–63). In terms of GOLD grades, 4 (5.6%) patients were in GOLD I, 39 (54.2%) in GOLD II, 26 (36.1%) in GOLD III, and 3 (4.2%) in GOLD IV. Almost half (45.7%) were “prone to exacerbation”, having had two or more exacerbations in the past 12 months. Most (n = 65, 93%) of the participants were prescribed maintenance inhaled corticosteroids (ICS) or ICS and long-acting β2 agonist (LABA) combination therapy (ICS/LABA) with a median (Q1-Q3) daily dose of 500 (400–500) mg beclomethasone equivalents/day. Healthy controls without COPD (n = 15) were age 25 to 65 and almost half were females (Table 1). Participants with COPD were older, had greater history of smoking, higher body mass index (BMI), more comorbidity burden (higher Charlson Comorbidity Index [CCI] score) and lower lung function. Both percentage and proportion of sputum neutrophils and eosinophils as well as total cell counts were significantly higher in COPD patients compared to healthy controls. On the contrary, percentage sputum macrophage was significantly lower in COPD participants. Details of differences between COPD and healthy controls gene expression profiles are provided in the Results Section Of Supplementary Material (Tables S1 and S2).
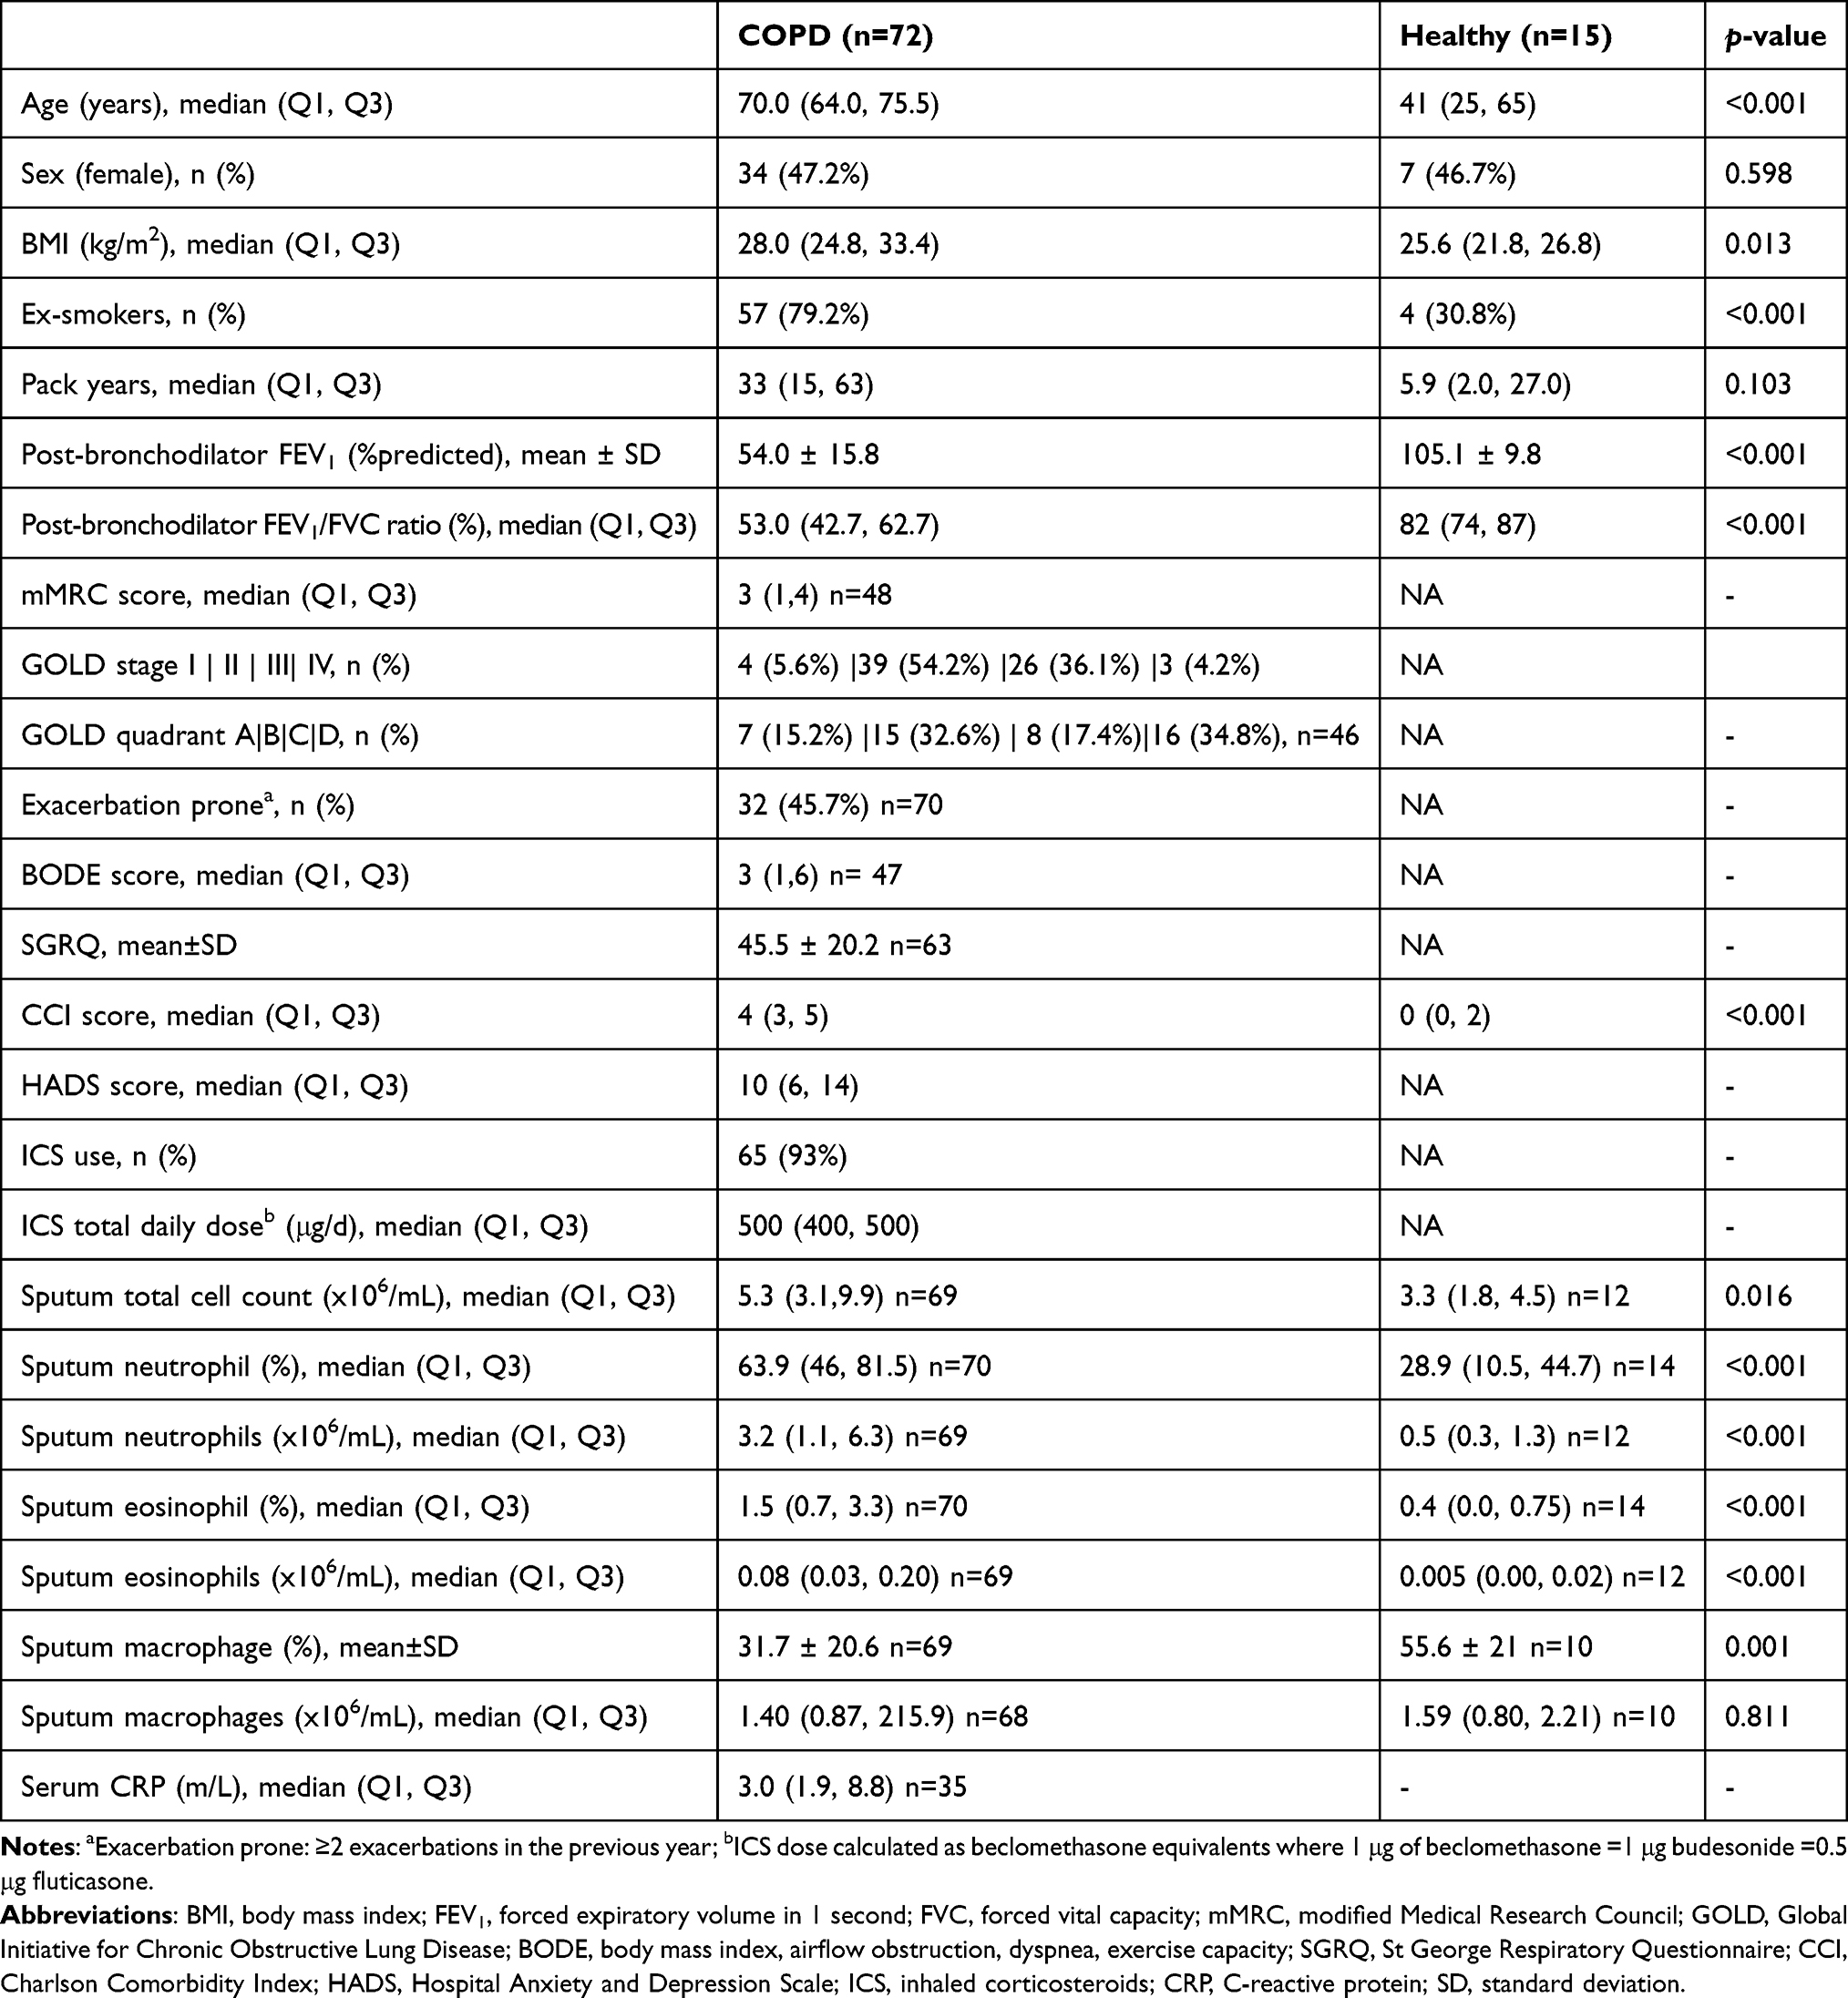 |
Table 1 Demographics and Clinical Characteristics of the Study Population |
Unsupervised Hierarchical Clustering of Sputum Gene Expression Profiles in COPD
Unsupervised hierarchical clustering of gene expression profiles showed 2 clear clusters that were quite even with 35 (48.6%) participants in the first cluster and 37 participants in the second cluster (51.4%) (Figure 1). The two clusters further divide into two distinct sub-clusters each. There were 14 (40%) participants in sub-cluster 1.1 and 21 (60%) in sub-cluster 1.2. Sub-clusters 2.1 and 2.2 had 20 (54%) and 17 (46%) participants, respectively.
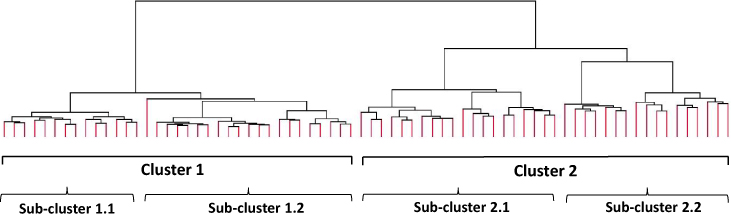 |
Figure 1 Phenotypes of COPD identified from unsupervised hierarchical clustering of gene expression profiles (18,511 entities). This approach groups expression profiles that are similar which are joined together to form this tree structure. The root of the tree consists of a single cluster containing all samples, and the leaves correspond to the individual sample profiles, which separate into 2 main clusters and 4 sub-clusters. |
Clinical Characteristics of Transcriptional Phenotypes of COPD
The clinical characteristics of the transcriptional COPD phenotypes are described in Table 2. Overall, the proportion of participants in each cluster was comparable and both groups were of similar age and sex. Compared to cluster 1, cluster 2 exhibited worse lung function, more severe disease (higher proportion of GOLD stage 3 and 4), more severe breathlessness (higher mMRC score), increased proportion of sputum neutrophils, and decreased proportion of macrophages. There were no relevant differences in health status, pack-years exposure, CCI, anxiety and depression score, ICS use and other measured inflammatory markers between the two clusters. Although not statistically significant, participants in Cluster 2 had slightly higher BODE score, lower BMI, and fewer proportion of people with comorbid cardiovascular diseases compared to those in cluster 1. There were more people with comorbid eye disease in Cluster 2 compared to Cluster 1, even though this did not reach statistical significance.
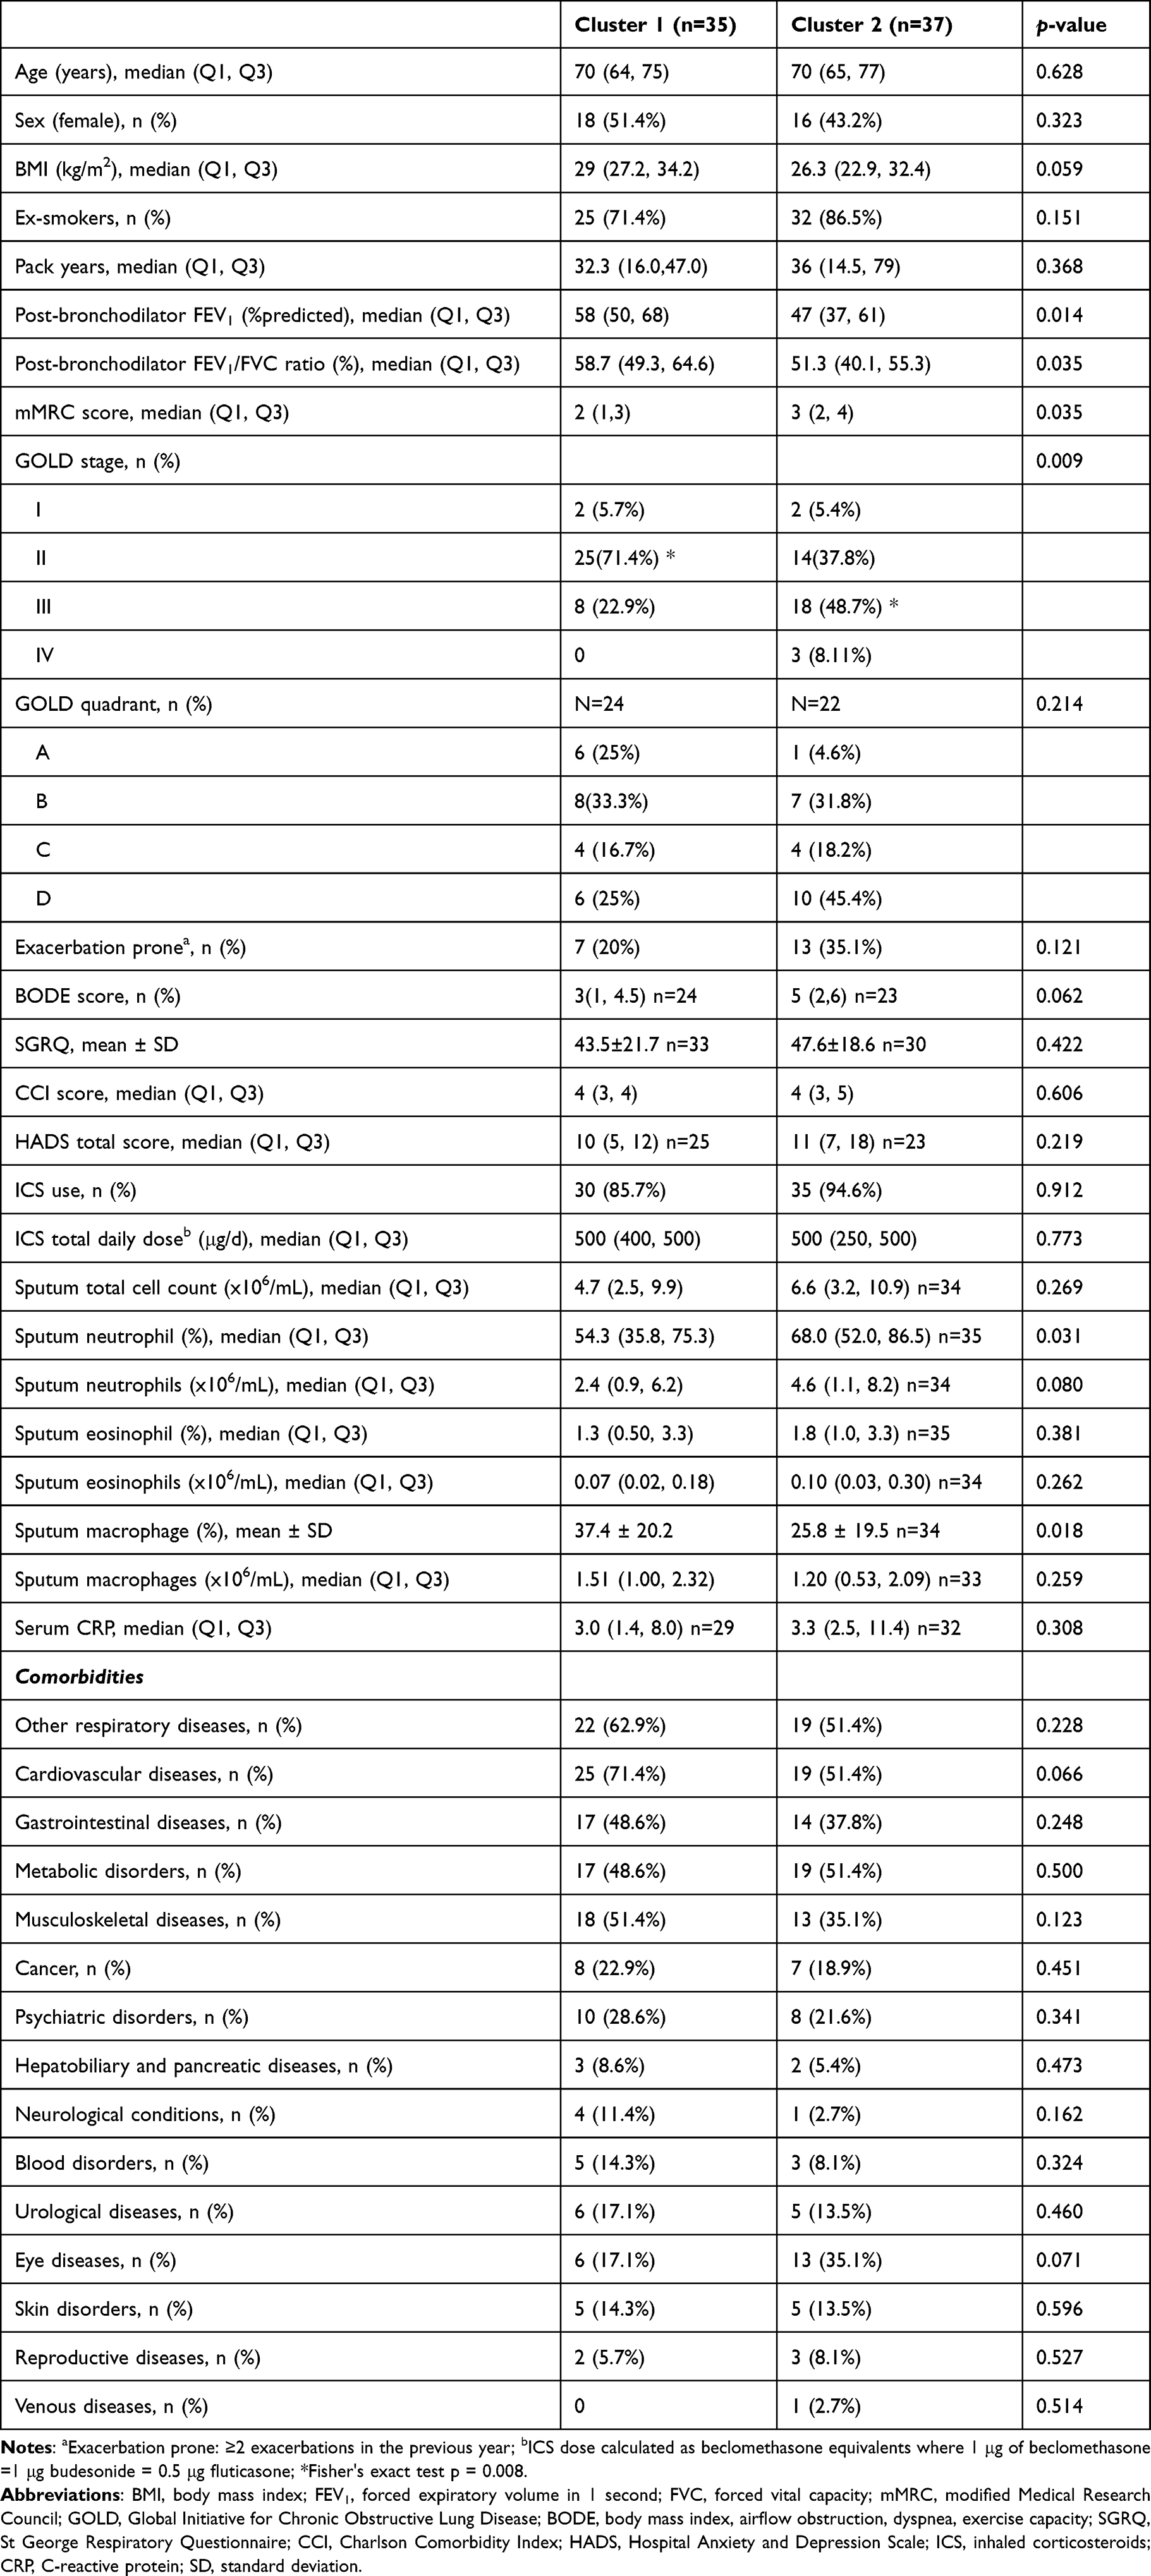 |
Table 2 Clinical Characteristics and Sputum Cell Counts of the Transcriptional COPD Phenotypes |
Differences in clinical characteristics and sputum cell counts between the sub-clusters are shown in Table S3 in Supplementary Information. The parameters that were significantly different between the four sub-clusters were lung function (FEV1) and proportion of people with cardiovascular disease (CVD) comorbidity only (Figure 2).
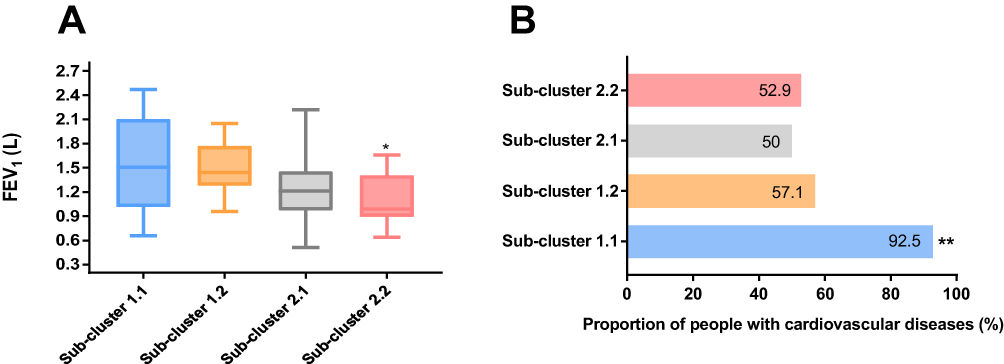 |
Figure 2 Differences in (A) lung function (forced expiratory volume in 1 second [FEV1]) and (B) proportion of people with comorbid cardiovascular disease between the four Sub-clusters 1.1, 1.2, 2.1 and 2.2. Notes: *Kwallis2 p = 0.002 vs Sub-cluster 1.2, **Fisher's exact test p < 0.013 vs Sub-clusters 1.2, 2.1 and 2.2. |
Differential Gene Expression Associated with Key Clinical and Inflammatory Differences Driving Transcriptional Clusters
To further investigate the mechanisms underlying the transcriptional clusters, a supervised analysis was performed to analyze differences in gene expression between GOLD stage groupings, GOLD quadrant groupings, BODE index quartiles, presence of breathlessness, history of exacerbation, eosinophilic airway inflammation, neutrophilic airway inflammation, and the presence of comorbidities and systemic inflammation. Out of these comparisons, it was only GOLD stage that had differentially expressed genes identified based on our strict statistical criteria. Given this, worsening lung function appears to be the main significant driver responsible for the shifts in sputum transcriptional profiles of COPD that lead to our cluster groupings.
Clinical Features, Inflammatory Characteristics, and Differential Gene Expression Between GOLD Stages
We performed comparisons of clinical features and inflammatory characteristics between GOLD stage 3 and 4 against GOLD stage 1 and 2 (Table 3). GOLD stages were grouped into two groups for the comparison as there were small number of participants in GOLD stage 1 (n = 4) and GOLD stage 4 (n = 3). As shown in Table 3, smoking history, mMRC and BODE scores were significantly different clinical parameters between the two GOLD stage groupings. GOLD stage 3 and 4 participants had significantly higher percentage neutrophil counts, but lower absolute number and proportion of sputum macrophages when compared to their GOLD stage 1 and 2 counterparts.
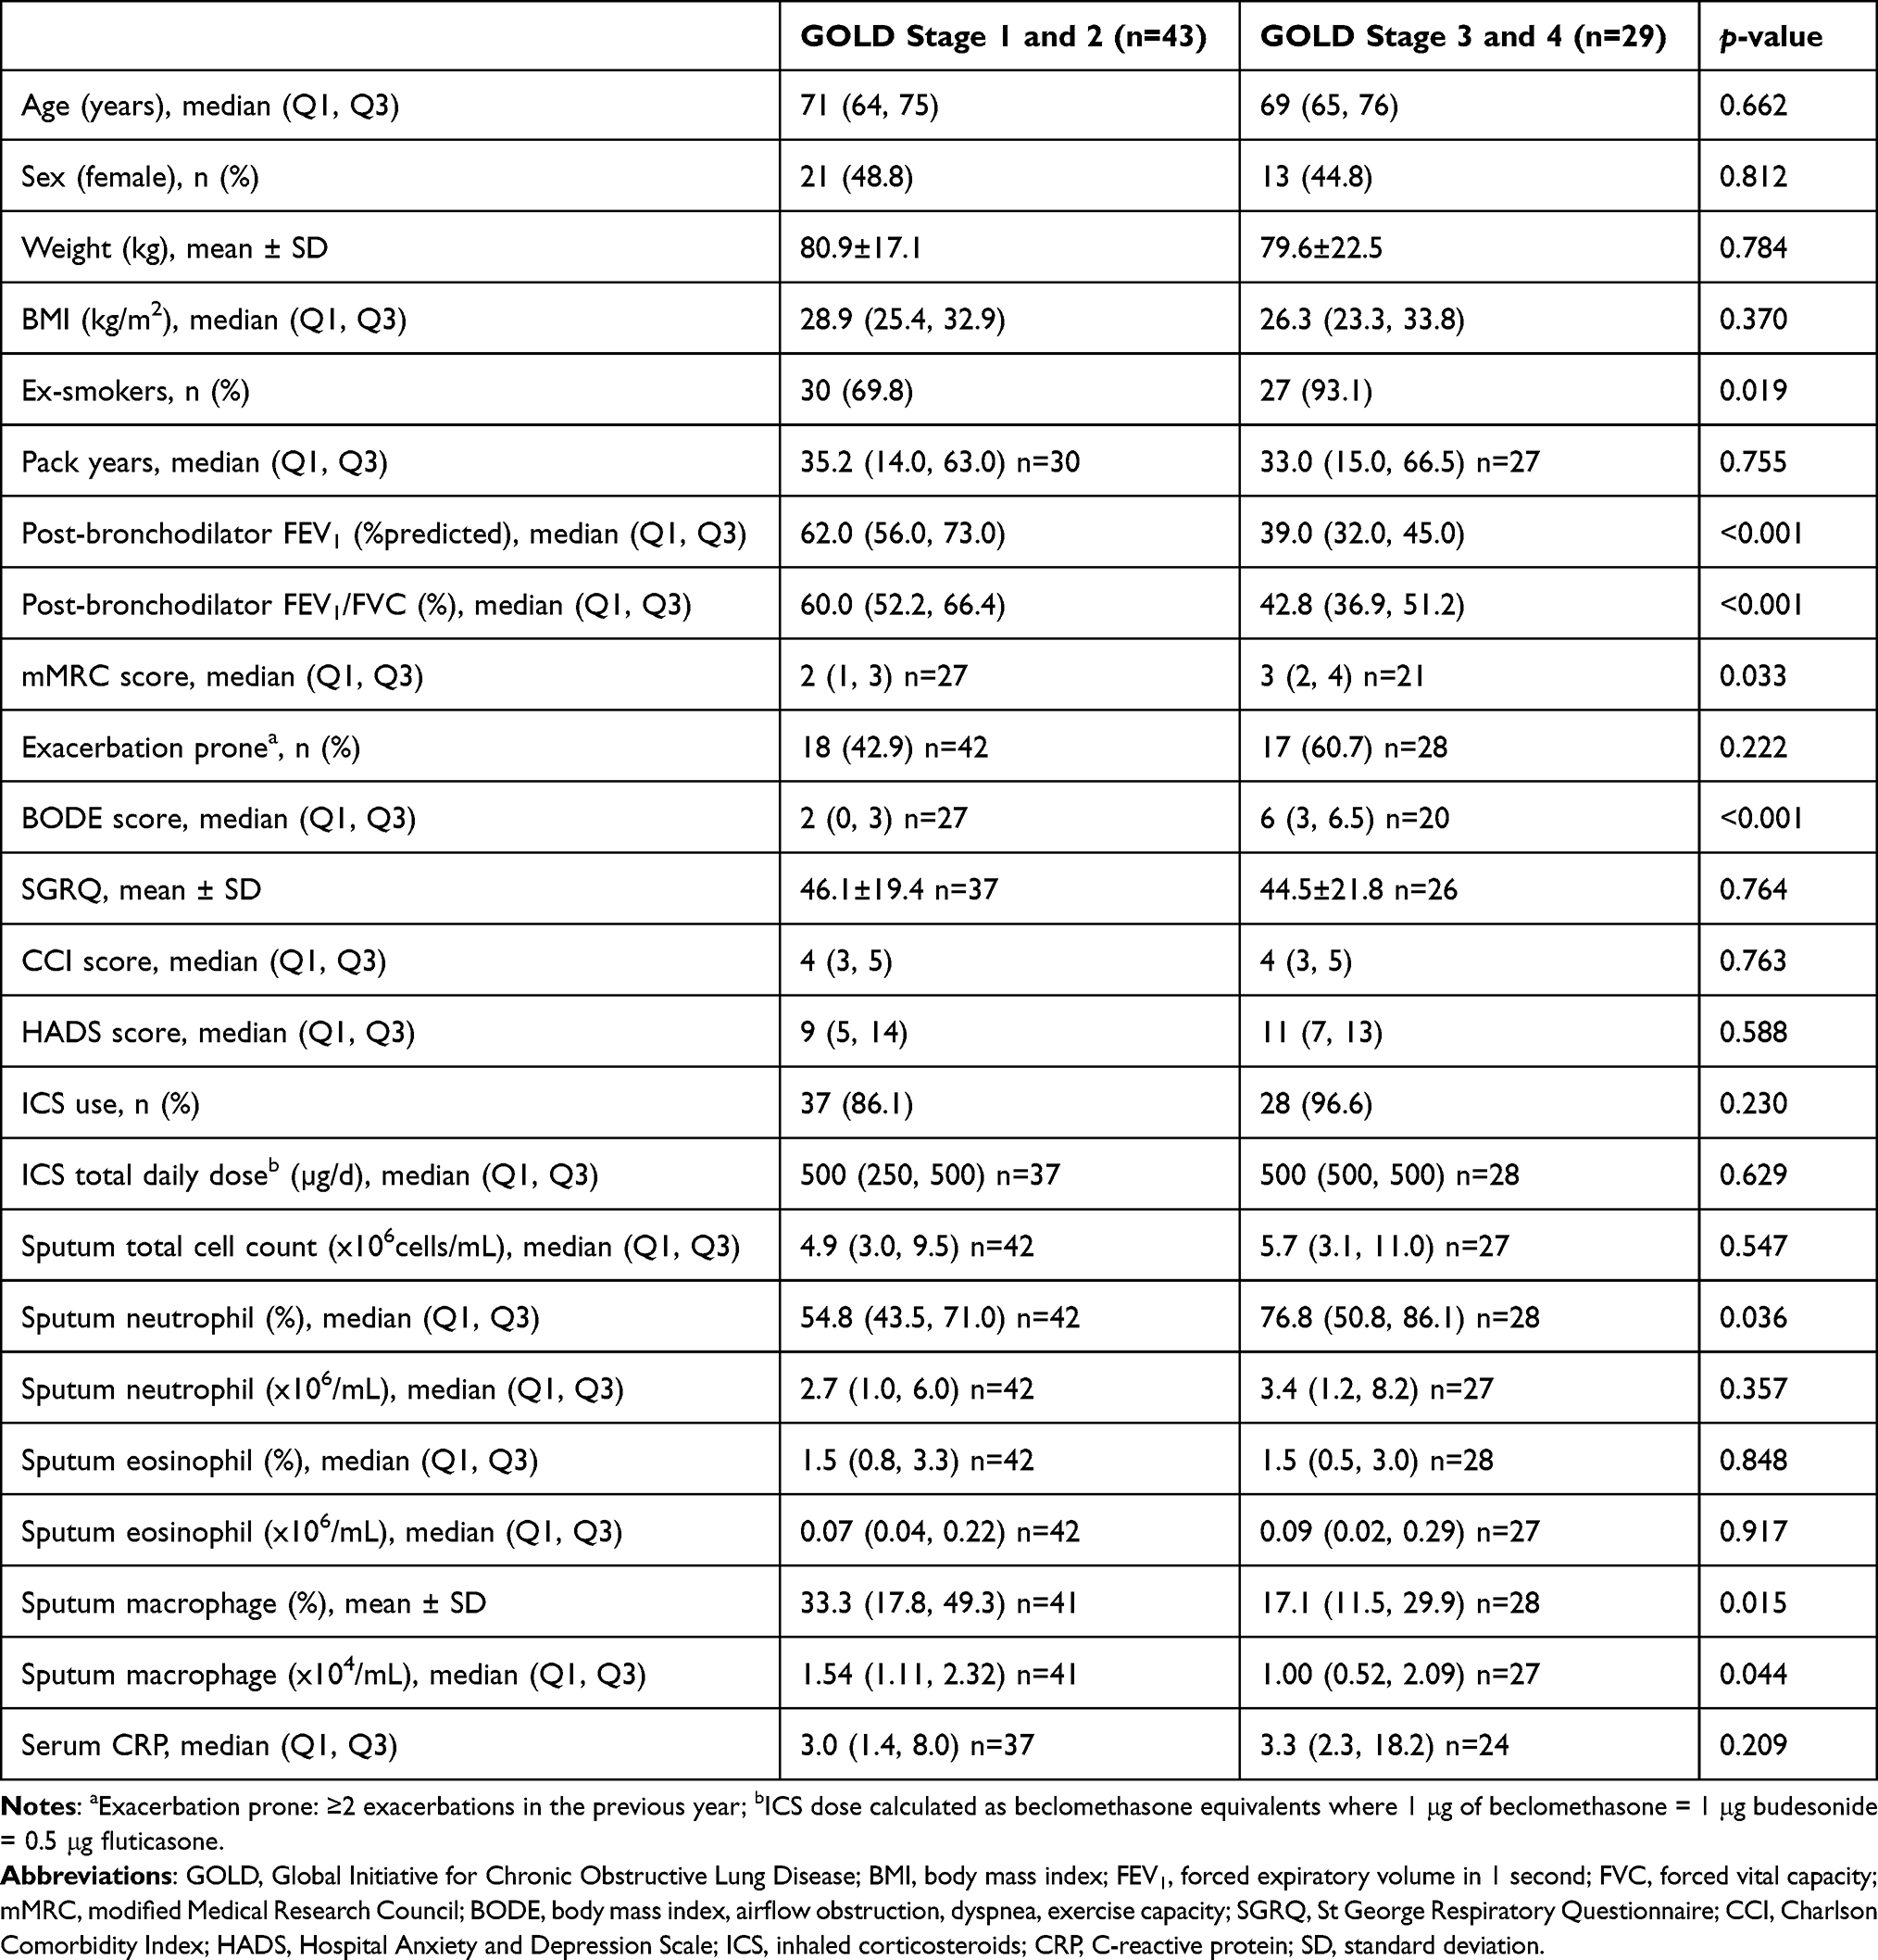 |
Table 3 Clinical Features and Inflammatory Characteristics of Study Participants Categorised by 2 GOLD Stage Groupings |
There were 4507 out of 23,337 entities significantly differentially expressed between the two GOLD stage groups, with 758 entities that were ≥2-fold change (452 genes after removing duplicates and predicted, 189 genes upregulated and 263 genes downregulated, Table S4 in Supplementary information). A heat map cluster showing the patterns of the genes significantly differentially expressed between the two GOLD stage groupings can be seen in Figure 3, with healthy control levels of expression added as a reference. Figure 3 shows the patterns in the gene expression profiles across the 3 groups, with the GOLD stages 3 and 4 being vastly different to the healthy controls and GOLD stage 1 and 2 groupings.
 |
Figure 3 Heat map cluster showing the pattern of genes differentially expressed in the two GOLD stage groupings and healthy controls with red resembling high expression and blue showing lower expression. |
To validate our differentially expressed genes, we further investigated these changes in the ECLIPSE data set (GSE22148).27 We confirmed that out of the 452 genes with ≥2-fold change in our data set, 281 genes (62.2%) were also found to be significantly differentially expressed (adjusted p < 0.05) between these GOLD stages in the ECLIPSE data set (Table S4 in Supplementary information). These 281 validated genes, related to 40 GO biological processes (Table 4) and 5 interaction networks (Figure 4). Biological processes represented by the differentially expressed genes predominantly related to (i) immune and metabolic processes, (ii) metabolic processes in oxidation/reduction and mitochondrial function, (iii) antigen processing and presentation, regulation of immune responses, (iv) lipoprotein and cholesterol metabolism and (v) regulation of complement activation and innate immune responses.
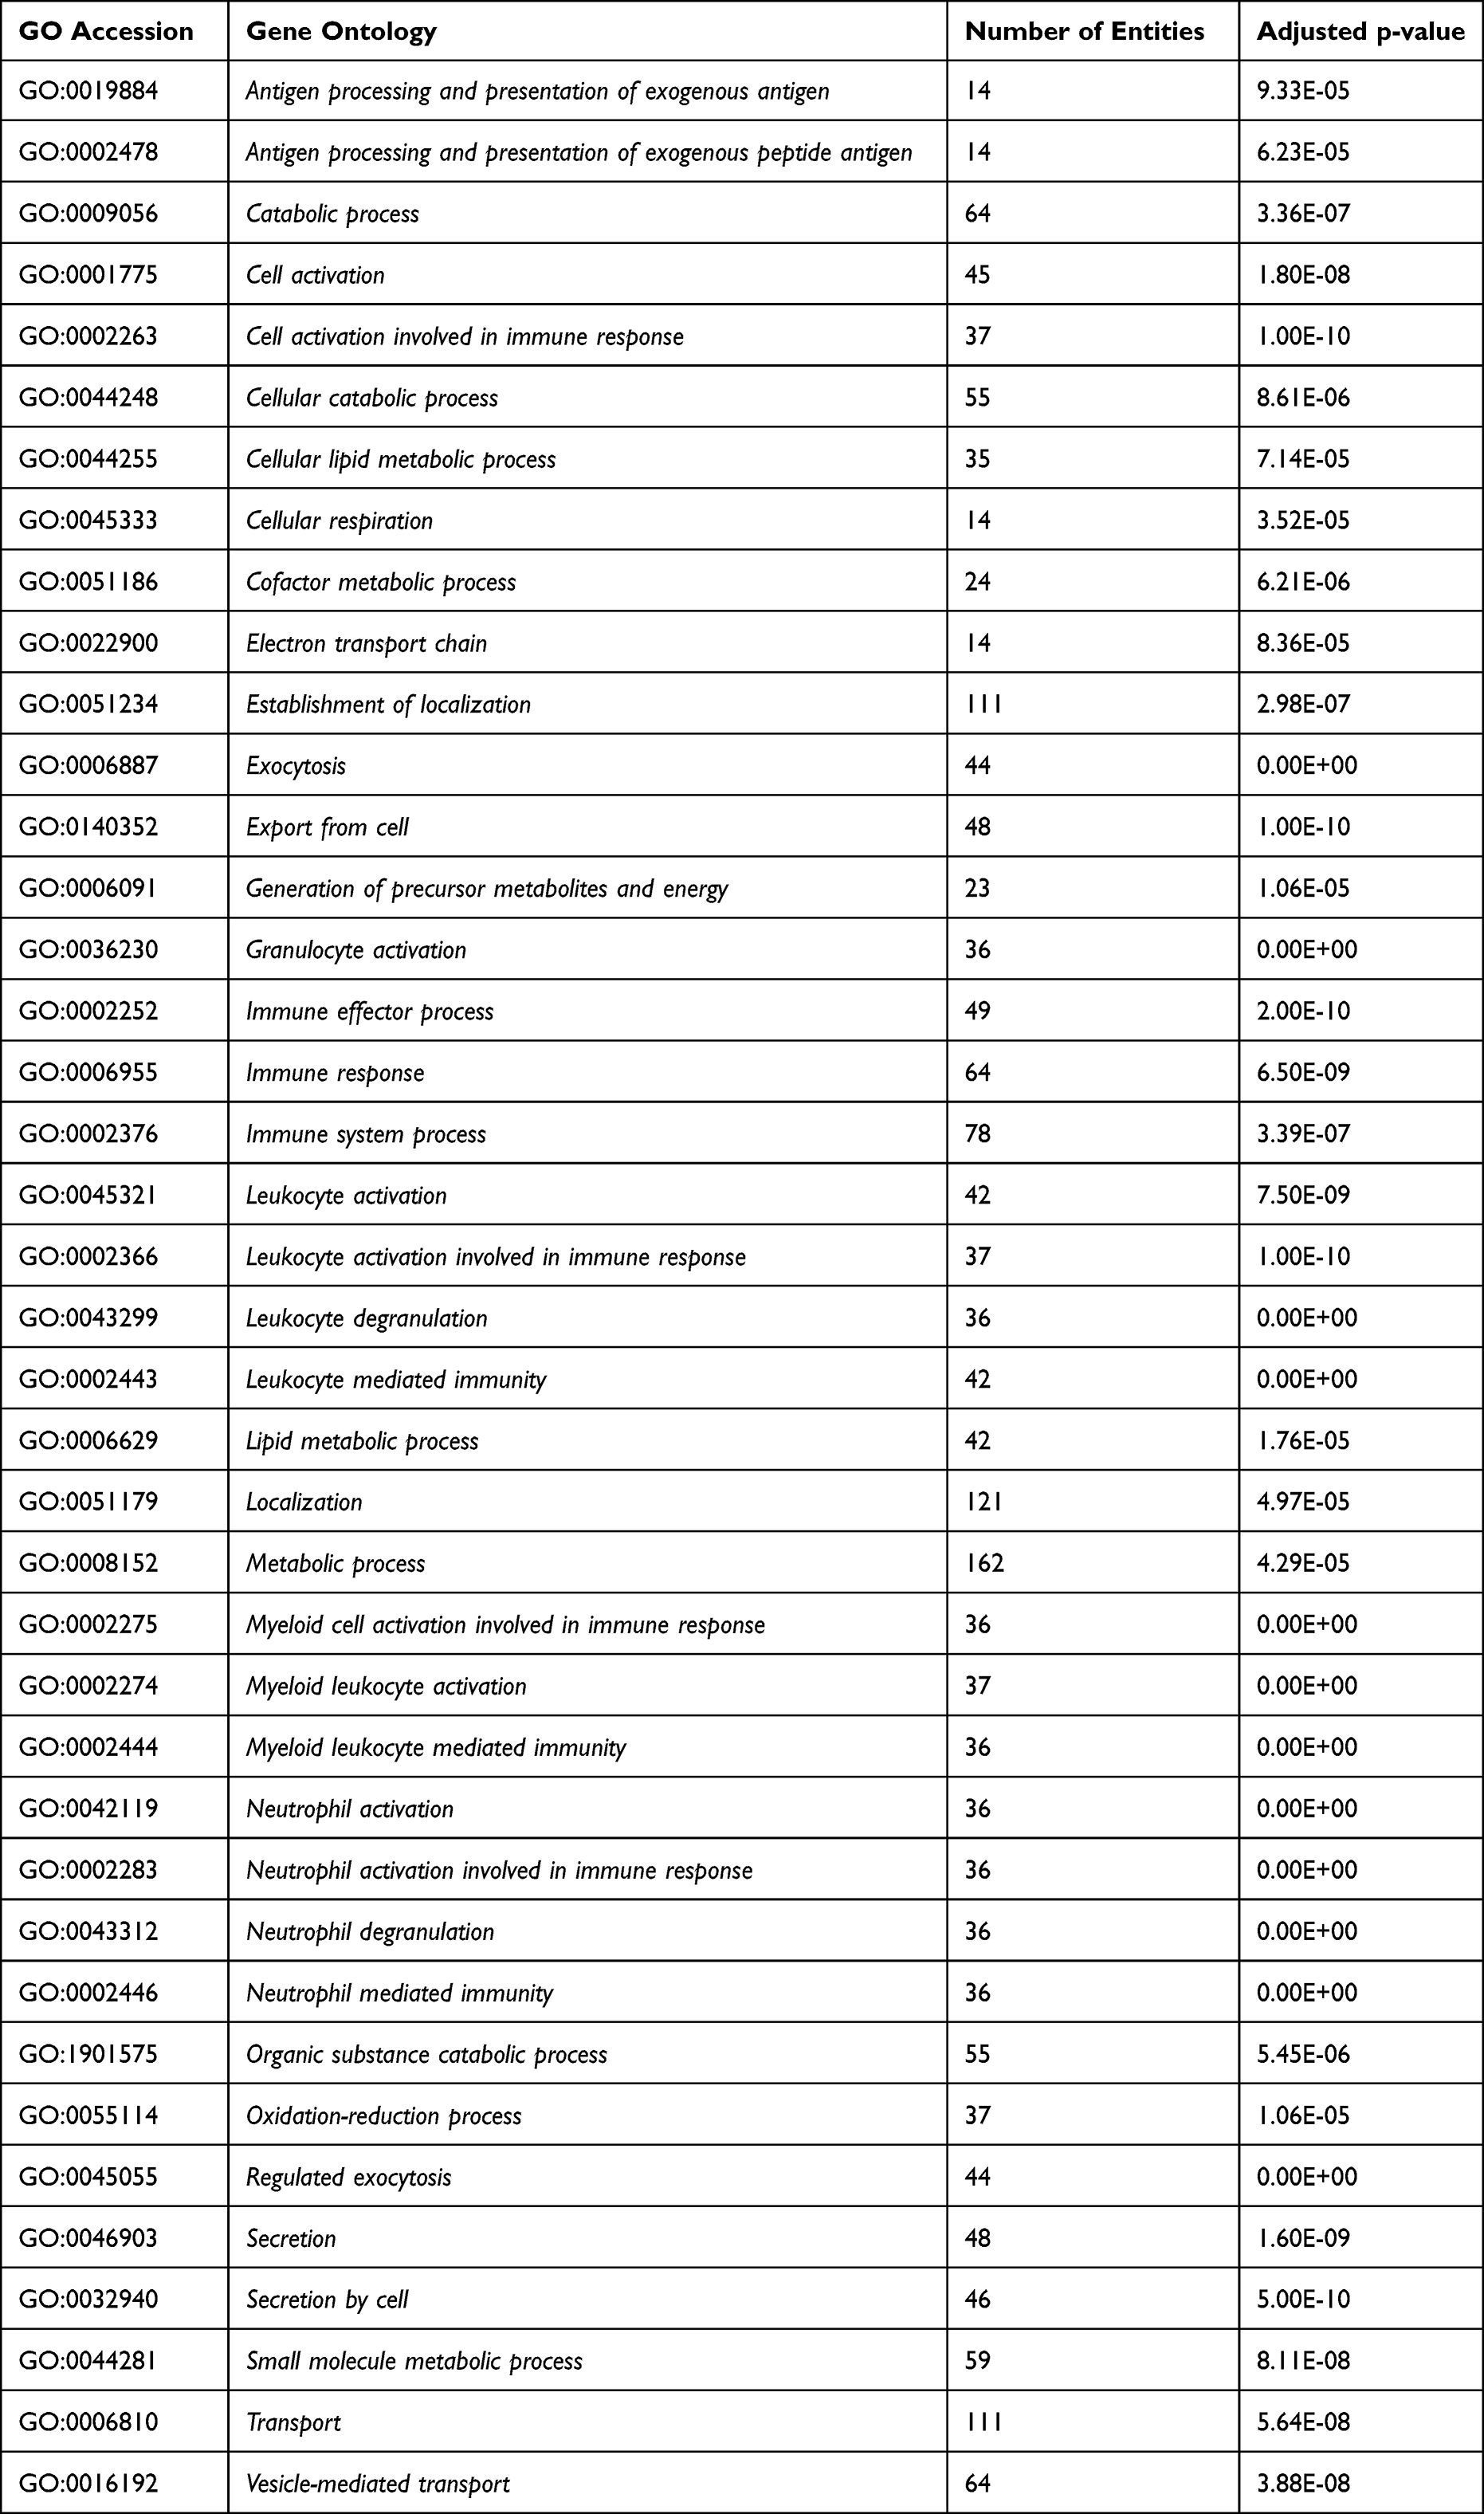 |
Table 4 Gene Ontology Categories Significantly Overrepresented in the 281 Overlapping Genes |
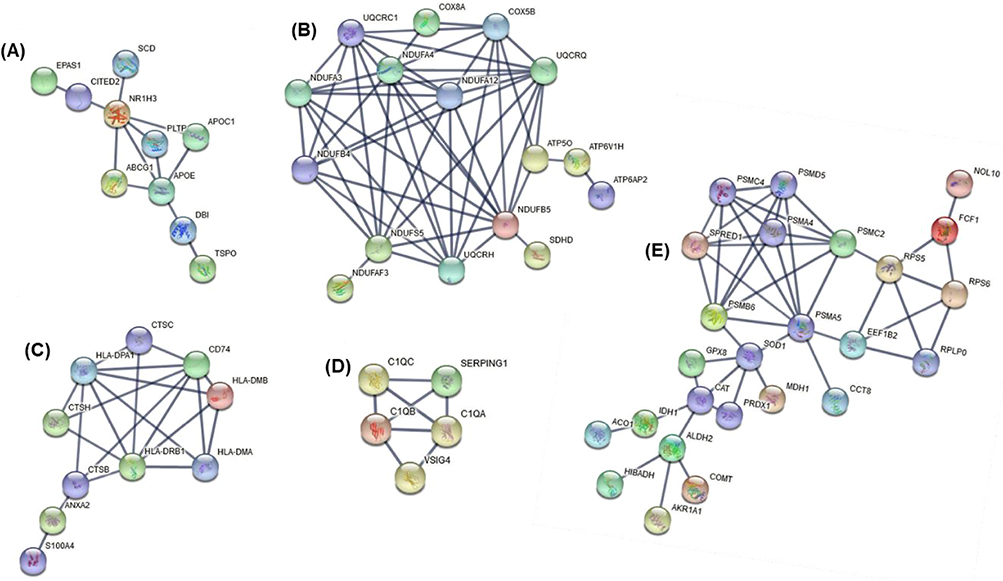 |
Figure 4 Five protein–protein interaction networks (A–E) among the 281 overlapping differentially expressed genes between our data and the ECLIPSE data set. Network A contains 10 genes relating to lipoprotein and cholesterol metabolism. Network B containing 16 genes relates to metabolic processes in oxidation/reduction and mitochondrial function. Network C contains 10 genes relating to antigen processing and presentation, regulation of immune responses (including T cells, neutrophils). Network D, with 5 genes, shows a network relating to regulation of complement activation and innate immune responses. Network E is the largest containing 25 genes relating to immune and metabolic responses. |
Discussion
This study demonstrates the use of unsupervised hierarchical clustering of induced sputum gene expression profiles to identify 2 main clusters and 4 sub-clusters in the studied population. The 2 distinct transcriptional COPD phenotypes relate to both clinical characteristics (lung function and breathlessness) and the type of airway inflammation present (sputum neutrophils). Cluster 1 was characterized by less severe lung function and breathlessness. Cluster 2, on the other hand, was neutrophil-enriched group with worsened airflow obstruction, more severe disease and breathlessness, and lower proportion of macrophages. With regard to the sub-clusters, interestingly, sub-cluster 1.1 had significantly higher proportion of people with comorbid cardiovascular disease compared to the remaining 3 sub-clusters. Through supervised analysis we determined that the predominant factor driving gene expression differences in our transcriptional clusters was lung function (GOLD stage). There were 452 genes (adjusted p < 0.05 and ≥2 fold) altered in GOLD stage 3 and 4 versus 1 and 2. Out of the 452 genes, 281 (62%) were also significantly differentially expressed between the two GOLD groupings in the ECLIPSE data set. Of importance, the validated differentially expressed genes connected in 5 networks and related to the following themes (i) lipoprotein and cholesterol mechanism (including APOE, APOC1 and SCD), (ii) metabolic processes in oxidation/reduction and mitochondrial function (NDUFs), (iii) antigen processing and presentation (including HLA complexes (MHC class II)), (iv) regulation of complement activation and innate immune responses (C1Qs) and (v) immune and metabolic processes (including PSMA5, PSMC2 and PSMDB6).
The past decade in the COPD arena has seen an enormous interest in personalized, precision medicine. To this end, the use of techniques such as cluster analysis to identify groups of COPD patients with similar clinical or physiological characteristics has been the focus of studies.6,28 For instance, in a study that utilized hierarchical cluster analysis of clinical, functional and imaging data of stable COPD patients, Burgel et al42 identified 3 distinct phenotypes of COPD with varying COPD severity and risk of mortality. Garcia-Aymerich et al43 also identified three clusters of COPD, namely moderate, severe and systemic COPD. Studies that have utilized cluster analysis integrating genetic44 or transcriptomic data15,45–47 in COPD cohorts, like ours, have great benefit in that they provide the opportunity to analytically and jointly assess COPD-related clinical characteristics, comorbidities, and biomarker data to strengthen the robustness of the COPD phenotypes as well as to better understand the underlying biological mechanisms of the condition.28 Our study has linked transcriptomic profiles underlying 2 main COPD clusters, and with thorough investigations we identified the main driving factor to these differences in airway gene expression patterns being the degree of lung function impairment. A better understanding of phenotypes of COPD on a deep cellular and molecular level will lead to the development of more targeted strategies for personalized COPD treatment and management. This study has increased the knowledge base on potential mechanistic themes further underlying lung function impairment that warrant further investigation as targets for potential intervention.
In our study, there were several mechanistic themes uncovered through network analysis associated with potential importance to lung function impairment in COPD. These themes were largely related to immune (ie, antigen presentation, complement and innate immune responses) and metabolic processes (ie, lipoprotein and cholesterol metabolism, oxidation/reduction and mitochondrial function). Of interest, all genes in the networks were downregulated in GOLD stages 3 and 4 compared with GOLD stages 1 and 2. This implies that as COPD worsens, there is a shift in gene expression that is downregulation of some important immune and metabolic functions within the cells of the airway lumen.
Antigen presentation serves to ensure adaptive immune responses are initiated to invading microorganisms.48 Dysfunction of this vital immune response may lead to increased susceptibility to viral infection and bacterial colonization, which would lead to increased inflammation. HLA-complexes corresponding to MHC Class II were one of the top downregulated class of genes with worsening of GOLD stage. MHC Class II receptors are involved in the presentation of antigens to CD4(+) T-lymphocytes, and thereby are critical for the initiation of the antigen-specific immune response.49 Previously we have reported the association of low-dose azithromycin treatment with the downregulation of several human HLA molecules in the airways of neutrophilic COPD patients, resulting in suppression of inflammatory response most likely by limiting the immune system’s capacity to identify and respond to antigen.22
Our analysis also shows that genes in the complement pathway including C1Q are highly altered. C1Q is a pattern recognition protein that is involved in the recognition and clearance of apoptotic cells. C1Q also directs macrophage polarization and limits inflammasome activity during the uptake of apoptotic cells.50 Defect in these key macrophage functions contribute to dysregulated resolution of the downstream inflammatory responses and impaired tissue repair.51 Recently, Akata et al51 have shown reduced gene expression of the complement components C1QA and C1QB in non-polarized macrophage cells isolated from BAL liquids of stable COPD patients. An earlier study by Yuan et al52 has shown that cigarette smoke downregulates C1Q produced by antigen-presenting cells isolated from emphysematous humans, and that it relates with the severity of lung obstruction, which is in line with our findings.
Macrophages constitute a heterogeneous cell population, and pro-inflammatory M1 and anti-inflammatory M2 and M2-like cells represent the extremities of a pattern of macrophage polarization.53 Studies in the literature have shown that both of these macrophage functions are altered in COPD.53 In relation to this, our analysis demonstrated that genes previously shown to be involved in macrophage polarization, either in COPD or other inflammatory diseases, were downregulated, along with a lower proportion of sputum macrophages. These genes included peroxisome proliferator activated receptor gamma (PPARG)54 and the CD74 molecule. The PPARs are known to be involved in the regulation of inflammation and lipid metabolism, important in asthma and COPD.55 A recent transcriptomic study of asthma-COPD overlap (ACO) has reported a cluster of ACO that had features of mitochondria and peroxisome dysfunction.56 Certainly, the relationship between mitochondrial function, peroxisomes, oxidative stress and inflammation in COPD warrants further investigation in its role in lung function decline.
Another interesting finding within our 4 identified subclusters was the increased rate of cardiovascular comorbidities in sub-cluster 1.1, with 93% of participants within this cluster having cardiovascular conditions. Garcia-Aymerich et al43 also identified a systemic COPD cluster that exhibited high rates of cardiovascular comorbidities, in keeping with our sub-cluster 1.1. COPD and cardiovascular disease frequently occur together, and the coexistence of these conditions may impact disease risk and prognosis.57 On differential gene expression analysis between GOLD stages, we also note that genes related to lipoprotein and cholesterol metabolism are higher in the GOLD stage 1 and 2 group compared with the more severe GOLD stage 3 and 4. One of the differentially expressed genes in this network was apolipoprotein E (APOE). APOE plays a critical role in lipid metabolism and has been linked to cardiovascular diseases.58 Of note, in our string-network (Figure 4A), APOE is connected with ABCG1. ABCG1 is a member of the superfamily of ATP-binding cassette (ABC) transporter, which is expressed in a number of tissues including lung and involved in movement of cholesterol and phospholipids.59 Results obtained from mouse models have shown that ABCG1 plays a critical role in maintaining cellular lipid homeostasis and controlling pulmonary inflammation. As such, understanding the relationship between cholesterol and inflammation in the lung, and the role that ABC transporters like ABCG1 play in this may lead to the identification of new treatment targets.60
Our study does have limitations, including a small sample size which will need to be further explored in a larger COPD cohort. However, our lung function differential gene expression findings were validated in a second cohort of COPD and led to identification of key immune and metabolic themes for future investigation. The smaller sample size limited the analysis for the comparison of sub-clusters may have been underpowered. RNA was extracted from mixed cell populations in sputum with bulk RNA-transcriptomic profiles generated, and thus groupings may reflect cell populations present, and signals from rare cell populations will potentially be missed. The majority of our population was taking inhaled corticosteroids, which may impact cell activity and transcription, and may limit the extension of the findings to patients with COPD that are not taking these medications.
Conclusion
In summary, this study has found that gene expression profiling provides a means to investigate the molecular mechanisms and classifications of COPD phenotypes. We identified 2 main clusters and 4 sub-clusters of COPD that relate to important differences in clinical characteristics, inflammatory cells, gene expression, and metabolic and immune function pathways. We found one cluster that was neutrophil-enriched with more severe disease and breathlessness. In our studied population, we have also found a sub-cluster of COPD that had high rates of cardiovascular comorbidity. The most significant characteristics that was driving the transcriptional phenotypes of our study population was the degree of lung function impairment, classified by GOLD stage. Differences between GOLD stages were largely related to genes involved in lipoprotein and cholesterol mechanism, metabolic processes in oxidation/reduction and mitochondrial function, antigen processing and presentation, regulation of complement activation and innate immune responses and immune and metabolic processes. The clinical relevance of our work lies in the fact that it has the potential to assist in clinical investigations of the underlying aetiology of COPD and in guiding effective treatment strategies given that it incorporates not only clinical, inflammatory cell, and comorbidity data but also molecular aspects of COPD.
Abbreviations
BMI, body mass index; FEV1, forced expiratory volume in 1 second; FVC, forced vital capacity; mMRC, modified Medical Research Council; GOLD, Global Initiative for Chronic Obstructive Lung Disease; BODE, body mass index, airflow obstruction, dyspnea, exercise capacity; SGRQ, St George Respiratory Questionnaire; CCI, Charlson Comorbidity Index; HADS, Hospital Anxiety and Depression Scale; ICS, inhaled corticosteroids; CRP, C-reactive protein; SD, standard deviation.
Acknowledgment
The authors would like to acknowledge the technical assistance of Naomi Fibbens, Alan Hsu, Gabrielle Le Brocq, Amber Smith, Bridgette Ridewood, Michelle Gleeson, and Kellie Fakes.
Author Contributions
All authors made a significant contribution to the work reported, whether that is in the conception, study design, execution, acquisition of data, analysis and interpretation, or in all these areas; took part in drafting, revising or critically reviewing the article; gave final approval of the version to be published; have agreed on the journal to which the article has been submitted; and agree to be accountable for all aspects of the work.
Disclosure
NA Negewo and JL Simpson have nothing to disclose for this study. KJ Baines reports grants from NHMRC, Lung Foundation of Australia, Hunter Medical Research Institute and John Hunter Hospital Charitable Trust, outside the submitted work. VM McDonald reports grants from NHMRC, Lung Foundation of Australia, grants from Ramaciotti Foundation, during the conduct of the study; grants from Medical Research Futures Fund, NHMRC, personal fees from GSK, personal fees from AstraZeneca, and guideline writer role in COPDX committee, outside the submitted work. PG Gibson reports grants from GSK, personal fees from AstraZeneca, Novartis and GSK, outside the submitted work.
References
1. Global Initiative for Chronic Obstructive Lung Disease (GOLD). Global strategy for the diagnosis, management and prevention of COPD; 2021. Available from: https://goldcopd.org/wp-content/uploads/2020/11/GOLD-REPORT-2021-v1.1-25Nov20_WMV.pdf.
2. López-Campos JL, Tan W, Soriano JB. Global burden of COPD. Respirology. 2016;21(1):14–23. doi:10.1111/resp.12660
3. Rabe KF, Hurd S, Anzueto A, et al. Global strategy for the diagnosis, management, and prevention of chronic obstructive pulmonary disease: GOLD executive summary. Am J Respir Crit Care Med. 2007;176(6):532–555. doi:10.1164/rccm.200703-456SO
4. Agusti A. The path to personalised medicine in COPD. Thorax. 2014;69(9):857–864. doi:10.1136/thoraxjnl-2014-205507
5. Corlateanu A, Mendez Y, Wang Y, Garnica RJA, Botnaru V, Siafakas N. Chronic obstructive pulmonary disease and phenotypes: a state-of-the-art. Pulmonology. 2020;26(2):95–100. doi:10.1016/j.pulmoe.2019.10.006
6. Burgel PR, Paillasseur JL, Roche N. Identification of clinical phenotypes using cluster analyses in COPD patients with multiple comorbidities. Biomed Res Int. 2014;2014:420134. doi:10.1155/2014/420134
7. Hurst JR, Vestbo J, Anzueto A, et al. Susceptibility to exacerbation in chronic obstructive pulmonary disease. N Engl J Med. 2010;363(12):1128–1138. doi:10.1056/NEJMoa0909883
8. Barnes PJ. Endo-phenotyping of COPD patients. Expert Rev Respir Med. 2021;15(1):27–37. doi:10.1080/17476348.2020.1804364
9. Zeskind JE, Lenburg ME, Spira A. Translating the COPD transcriptome: insights into pathogenesis and tools for clinical management. Proc Am Thorac Soc. 2008;5(8):834–841. doi:10.1513/pats.200807-074TH
10. Wheelock CE, Goss VM, Balgoma D, et al. Application of ‘omics technologies to biomarker discovery in inflammatory lung diseases. Eur Respir J. 2013;42(3):802–825. doi:10.1183/09031936.00078812
11. Spira A, Beane J, Pinto-Plata V, et al. Gene expression profiling of human lung tissue from smokers with severe emphysema. Am J Respir Cell Mol Biol. 2004;31(6):601–610. doi:10.1165/rcmb.2004-0273OC
12. Golpon HA, Coldren CD, Zamora MR, et al. Emphysema lung tissue gene expression profiling. Am J Respir Cell Mol Biol. 2004;31(6):595–600. doi:10.1165/rcmb.2004-0008OC
13. Bhattacharya S, Srisuma S, DeMeo DL, et al. Molecular biomarkers for quantitative and discrete COPD phenotypes. Am J Resp Cell Mol Biol. 2009;40:359–367. doi:10.1165/rcmb.2008-0114OC
14. Jeong I, Lim JH, Oh DK, Kim WJ, Oh YM. Gene expression profile of human lung in a relatively early stage of COPD with emphysema. Int J Chron Obstruct Pulmon Dis. 2018;13:2643–2655. doi:10.2147/COPD.S166812
15. Samaha E, Vierlinger K, Weinhappel W, et al. Expression profiling suggests loss of surface integrity and failure of regenerative repair as major driving forces for chronic obstructive pulmonary disease progression. Am J Respir Cell Mol Biol. 2021;64(4):441–452. doi:10.1165/rcmb.2020-0270OC
16. Faner R, Morrow JD, Casas-Recasens S, et al. Do sputum or circulating blood samples reflect the pulmonary transcriptomic differences of COPD patients? A multi-tissue transcriptomic network META-analysis. Respir Res. 2019;20(1):5. doi:10.1186/s12931-018-0965-y
17. Seo M, Qiu W, Bailey W, et al. Genomics and response to long-term oxygen therapy in chronic obstructive pulmonary disease. J Mol Med. 2018;96(12):1375–1385. doi:10.1007/s00109-018-1708-8
18. Bahr TM, Hughes GJ, Armstrong M, et al. Peripheral blood mononuclear cell gene expression in chronic obstructive pulmonary disease. Am J Respir Cell Mol Biol. 2013;49(2):316–323. doi:10.1165/rcmb.2012-0230OC
19. Morrow JD, Qiu W, Chhabra D, et al. Identifying a gene expression signature of frequent COPD exacerbations in peripheral blood using network methods. BMC Med Genomics. 2015;8:1. doi:10.1186/s12920-014-0072-y
20. Singh D, Bassi M, Balzano D, et al. COPD patients with chronic bronchitis and higher sputum eosinophil counts show increased type-2 and PDE4 gene expression in sputum. J Cell Mol Med. 2021;25(2):905–918. doi:10.1111/jcmm.16146
21. Govoni M, Bassi M, Vezzoli S, et al. Sputum and blood transcriptomics characterisation of the inhaled PDE4 inhibitor CHF6001 on top of triple therapy in patients with chronic bronchitis. Respir Res. 2020;21(1):72. doi:10.1186/s12931-020-1329-y
22. Baines KJ, Wright TK, Gibson PG, Powell H, Hansbro PM, Simpson JL. Azithromycin treatment modifies airway and blood gene expression networks in neutrophilic COPD. ERJ Open Res. 2018;4(4):00031–02018. doi:10.1183/23120541.00031-2018
23. Ricci F, Bassi M, McGeough CM, Jellema GL, Govoni M. A Novel Processing-Free Method for RNAseq analysis of spontaneous sputum in chronic obstructive pulmonary disease. Front Pharmacol. 2021;12:704969. doi:10.3389/fphar.2021.704969
24. Ditz B, Sarma A, Kerstjens HAM, et al. The sputum transcriptome better predicts COPD exacerbations after the withdrawal of inhaled corticosteroids than sputum eosinophils. ERJ Open Res. 2021;7(3):00097–2021. doi:10.1183/23120541.00097-2021
25. Baines KJ, Negewo NA, Gibson PG, et al. A sputum 6 gene expression signature predicts inflammatory phenotypes and future exacerbations of COPD. Int J Chron Obstruct Pulmon Dis. 2020;15:1577–1590. doi:10.2147/COPD.S245519
26. Begg M, Hamblin JN, Jarvis E, et al. Exploring PI3Kδ molecular pathways in stable COPD and following an acute exacerbation, two randomized controlled trials. Int J Chron Obstruct Pulmon Dis. 2021;16(16):1621–1636. doi:10.2147/COPD.S309303
27. Singh D, Fox SM, Tal-Singer R, et al. Induced sputum genes associated with spirometric and radiological disease severity in COPD ex-smokers. Thorax. 2011;66(6):489–495. doi:10.1136/thx.2010.153767
28. Nikolaou V, Massaro S, Fakhimi M, Stergioulas L, Price D. COPD phenotypes and machine learning cluster analysis: a systematic review and future research agenda. Respir Med. 2020;171:106093. doi:10.1016/j.rmed.2020.106093
29. Simpson JL, Powell H, Baines KJ, et al. The effect of azithromycin in adults with stable neutrophilic COPD: a double blind randomised, placebo controlled trial. PLoS One. 2014;9(8):e105609. doi:10.1371/journal.pone.0105609
30. McDonald VM, Higgins I, Wood LG, Gibson PG. Multidimensional assessment and tailored interventions for COPD: respiratory utopia or common sense? Thorax. 2013;68(7):691–694. doi:10.1136/thoraxjnl-2012-202646
31. Simpson JL, McDonald VM, Baines KJ, et al. Influence of age, past smoking, and disease severity on TLR2, neutrophilic inflammation, and MMP-9 levels in COPD. Mediators Inflamm. 2013;2013:462934. doi:10.1155/2013/462934
32. Charlson ME, Pompei P, Ales KL, MacKenzie CR. A new method of classifying prognostic comorbidity in longitudinal studies: development and validation. J Chronic Dis. 1987;40(5):373–383. doi:10.1016/0021-9681(87)90171-8
33. Bestall JC, Paul EA, Garrod R, Garnham R, Jones PW, Wedzicha JA. Usefulness of the Medical Research Council (MRC) dyspnoea scale as a measure of disability in patients with chronic obstructive pulmonary disease. Thorax. 1999;54(7):581–586. doi:10.1136/thx.54.7.581
34. Jones PW, Quirk FH, Baveystock CM, Littlejohns P. A self-complete measure of health status for chronic airflow limitation. The St. George’s Respiratory Questionnaire. Am Rev Respir Dis. 1992;145(6):1321–1327. doi:10.1164/ajrccm/145.6.1321
35. American Thoracic Society. Standardization of spirometry, 1994 update. American Thoracic Society. Am J Respir Crit Care Med. 1995;152(3):1107–1136. doi:10.1164/ajrccm.152.3.7663792
36. Holland AE, Spruit MA, Troosters T, et al. An official European Respiratory Society/American Thoracic Society technical standard: field walking tests in chronic respiratory disease. Eur Respir J. 2014;44(6):1428–1446. doi:10.1183/09031936.00150314
37. Celli BR, Cote CG, Marin JM, et al. The body-mass index, airflow obstruction, dyspnea, and exercise capacity index in chronic obstructive pulmonary disease. N Engl J Med. 2004;350(10):1005–1012. doi:10.1056/NEJMoa021322
38. Gibson PG, Wlodarczyk JW, Hensley MJ, et al. Epidemiological association of airway inflammation with asthma symptoms and airway hyperresponsiveness in childhood. Am J Respir Crit Care Med. 1998;158(1):36–41. doi:10.1164/ajrccm.158.1.9705031
39. Simpson JL, Scott R, Boyle MJ, Gibson PG. Inflammatory subtypes in asthma: assessment and identification using induced sputum. Respirology. 2006;11(1):54–61. doi:10.1111/j.1440-1843.2006.00784.x
40. McDonald VM, Simpson JL, Higgins I, Gibson PG. Multidimensional assessment of older people with asthma and COPD: clinical management and health status. Age Ageing. 2011;40(1):42–49. doi:10.1093/ageing/afq134
41. Baines KJ, Simpson J, Wood L, Scott R, Gibson PG. Transcriptional phenotypes of asthma defined by gene expression profiling of induced sputum samples. J Allergy Clin Immunol. 2011;127(1):153–160. doi:10.1016/j.jaci.2010.10.024
42. Burgel PR, Paillasseur JL, Peene B, et al. Two distinct chronic obstructive pulmonary disease (COPD) phenotypes are associated with high risk of mortality. PLoS One. 2012;7(12):e51048. doi:10.1371/journal.pone.0051048
43. Garcia-Aymerich J, Gómez FP, Benet M, et al. Identification and prospective validation of clinically relevant chronic obstructive pulmonary disease (COPD) subtypes. Thorax. 2011;66(5):430–437. doi:10.1136/thx.2010.154484
44. Castaldi PJ, Dy J, Ross J, et al. Cluster analysis in the COPDGene study identifies subtypes of smokers with distinct patterns of airway disease and emphysema. Thorax. 2014;69(5):415–422. doi:10.1136/thoraxjnl-2013-203601
45. Groth EE, Weber M, Bahmer T, et al. Exploration of the sputum methylome and omics deconvolution by quadratic programming in molecular profiling of asthma and COPD: the road to sputum omics 2.0. Respir Res. 2020;21(1):274. doi:10.1186/s12931-020-01544-4
46. Kurian N, Cohen TS, Öberg L, et al. Dual role for A MEK inhibitor as a modulator of inflammation and host defense mechanisms with potential therapeutic application in COPD. Int J Chron Obstruct Pulmon Dis. 2019;14:2611–2624. doi:10.2147/COPD.S211619
47. Titz B, Sewer A, Schneider T, et al. Alterations in the sputum proteome and transcriptome in smokers and early-stage COPD subjects. J Proteomics. 2015;128:306–320. doi:10.1016/j.jprot.2015.08.009
48. Waithman J, Moffat JM, Patterson NL, van Beek AE, Mintern JD. Antigen Presentation. In: Reference Module in Biomedical Sciences. Elsevier; 2014.
49. Holling TM, Schooten E, van Den Elsen PJ. Function and regulation of MHC class II molecules in T-lymphocytes: of mice and men. Hum Immunol. 2004;65(4):282–290. doi:10.1016/j.humimm.2004.01.005
50. Benoit ME, Clarke EV, Morgado P, Fraser DA, Tenner AJ. Complement protein C1q directs macrophage polarization and limits inflammasome activity during the uptake of apoptotic cells. J Immunol. 2012;188(11):5682–5693. doi:10.4049/jimmunol.1103760
51. Akata KA-O, Yamasaki K, Leitao Filho FS, et al. Abundance of non-polarized lung macrophages with poor phagocytic function in Chronic Obstructive Pulmonary Disease (COPD). Biomedicines. 2020;8(10):398. doi:10.3390/biomedicines8100398
52. Yuan X, Chang CY, You R, et al. Cigarette smoke-induced reduction of C1q promotes emphysema. JCI Insight. 2019;4(13). doi:10.1172/jci.insight.124317
53. Hiemstra PS. Altered macrophage function in chronic obstructive pulmonary disease. Ann Am Thorac Soc. 2013;10:S180–185. doi:10.1513/AnnalsATS.201305-123AW
54. Bouhlel MA, Derudas B, Rigamonti E, et al. PPARgamma activation primes human monocytes into alternative M2 macrophages with anti-inflammatory properties. Cell Metab. 2007;6(2):137–143. doi:10.1016/j.cmet.2007.06.010
55. Lea S, Plumb J, Metcalfe H, et al. The effect of peroxisome proliferator-activated receptor-γ ligands on in vitro and in vivo models of COPD. Eur Respir J. 2014;43(2):409–420. doi:10.1183/09031936.00187812
56. Lee SY, Lee HS, Park HW. Transcriptome analysis of sputum cells reveals two distinct molecular phenotypes of “asthma and chronic obstructive pulmonary disease overlap” in the elderly. Eur J Med Res. 2022;27(1):215. doi:10.1186/s40001-022-00861-2
57. Yang HY, Hu LY, Chen HJ, Chen RY, Hu CK, Shen CC. Increased risk of chronic obstructive pulmonary disease in patients with hyperlipidemia: a nationwide population-based cohort study. Int J Environ Res Public Health. 2022;19(19):12331.
58. Kothapalli D, Liu S-L, Bae Yong H, et al. Cardiovascular protection by ApoE and ApoE-HDL linked to suppression of ECM gene expression and arterial stiffening. Cell Rep. 2012;2(5):1259–1271. doi:10.1016/j.celrep.2012.09.018
59. Kerr ID, Haider AJ, Gelissen IC. The ABCG family of membrane-associated transporters: you don’t have to be big to be mighty. Br J Pharmacol. 2011;164(7):1767–1779. doi:10.1111/j.1476-5381.2010.01177.x
60. Chai AB, Ammit AJ, Gelissen IC. Examining the role of ABC lipid transporters in pulmonary lipid homeostasis and inflammation. Respir Res. 2017;18(1):41. doi:10.1186/s12931-017-0526-9
 © 2023 The Author(s). This work is published and licensed by Dove Medical Press Limited. The
full terms of this license are available at https://www.dovepress.com/terms
and incorporate the Creative Commons Attribution
- Non Commercial (unported, 3.0) License.
By accessing the work you hereby accept the Terms. Non-commercial uses of the work are permitted
without any further permission from Dove Medical Press Limited, provided the work is properly
attributed. For permission for commercial use of this work, please see paragraphs 4.2 and 5 of our Terms.
© 2023 The Author(s). This work is published and licensed by Dove Medical Press Limited. The
full terms of this license are available at https://www.dovepress.com/terms
and incorporate the Creative Commons Attribution
- Non Commercial (unported, 3.0) License.
By accessing the work you hereby accept the Terms. Non-commercial uses of the work are permitted
without any further permission from Dove Medical Press Limited, provided the work is properly
attributed. For permission for commercial use of this work, please see paragraphs 4.2 and 5 of our Terms.
Recommended articles
Mettl3 Mediated m6A Methylation Involved in Epithelial-Mesenchymal Transition by Targeting SOCS3/STAT3/SNAI1 in Cigarette Smoking-Induced COPD
Zhang Y, Wang L, Yan F, Yang M, Gao H, Zeng Y
International Journal of Chronic Obstructive Pulmonary Disease 2023, 18:1007-1017
Published Date: 30 May 2023
Analysis of Airway Thickening and Serum Cytokines in COPD Patients with Frequent Exacerbations: A Heart of the Matter
Lin Y, Sang L, Wang J, Chen Y, Lai J, Zhu X, Yang Y, Zhang Z, Liu Y, Wen S, Zhang N, Zhao D
International Journal of Chronic Obstructive Pulmonary Disease 2023, 18:2353-2364
Published Date: 30 October 2023
Lung Fibroblasts from Chronic Obstructive Pulmonary Disease Subjects Have a Deficient Gene Expression Response to Cigarette Smoke Extract Compared to Healthy
Garcia-Ryde M, van der Burg NMD, Larsson CE, Larsson-Callerfelt AK, Westergren-Thorsson G, Bjermer L, Tufvesson E
International Journal of Chronic Obstructive Pulmonary Disease 2023, 18:2999-3014
Published Date: 18 December 2023
Sputum Biomarkers in Wood and Tobacco Smoke Etiotypes of Chronic Obstructive Pulmonary Disease
Giraldo-Montoya ÁM, Torres-Duque CA, Giraldo-Cadavid LF, Laucho-Contreras ME, González-Flórez A, Santos AM, Tuta-Quintero EA, Celli BR, González-García M
International Journal of Chronic Obstructive Pulmonary Disease 2024, 19:1-10
Published Date: 30 December 2023
A Bibliometric Analysis of Global Research Trends in Psoriasis and Metabolic Syndrome
Tang ZJ, Yang JR, Yu CL, Dong MH, Wang R, Li CX
Clinical, Cosmetic and Investigational Dermatology 2024, 17:365-382
Published Date: 9 February 2024