")
Back to Journals » International Journal of Chronic Obstructive Pulmonary Disease » Volume 18
Analysis of Airway Thickening and Serum Cytokines in COPD Patients with Frequent Exacerbations: A Heart of the Matter
Authors Lin Y, Sang L, Wang J, Chen Y, Lai J, Zhu X, Yang Y, Zhang Z, Liu Y, Wen S, Zhang N , Zhao D
Received 14 July 2023
Accepted for publication 25 October 2023
Published 30 October 2023 Volume 2023:18 Pages 2353—2364
DOI https://doi.org/10.2147/COPD.S430650
Checked for plagiarism Yes
Review by Single anonymous peer review
Peer reviewer comments 2
Editor who approved publication: Dr Jill Ohar
Yiqi Lin,* Li Sang,* Jiahe Wang, Yating Chen, Jianxiong Lai, Xiaofeng Zhu, Yuhan Yang, Zhuofan Zhang, Yinghua Liu, Shenyu Wen, Nuofu Zhang, Dongxing Zhao
State Key Laboratory of Respiratory Disease, National Clinical Research Center for Respiratory Disease, Guangzhou Institute of Respiratory Health, The First Affiliated Hospital of Guangzhou Medical University, Guangzhou, Guangdong, 510160, People’s Republic of China
*These authors contributed equally to this work
Correspondence: Dongxing Zhao; Nuofu Zhang, State Key Laboratory of Respiratory Disease, National Clinical Research Center for Respiratory Disease, Guangzhou Institute of Respiratory Health, The First Affiliated Hospital of Guangzhou Medical University, Guangzhou, Guangdong, 510160, People’s Republic of China, Email [email protected]; [email protected]
Background: Differences in lung function for Chronic Obstructive Pulmonary Disease (COPD) cause bias in the findings when identifying frequent exacerbator phenotype-related causes. The aim of this study was to determine whether computed tomographic (CT) biomarkers and circulating inflammatory biomarkers were associated with the COPD frequent exacerbator phenotype after eliminating the differences in lung function between a frequent exacerbator (FE) group and a non-frequent exacerbator (NFE) group.
Methods: A total of 212 patients with stable COPD were divided into a FE group (n=106) and a NFE group (n=106) according to their exacerbation history. These patients were assessed by spirometry, quantitative CT measurements and blood sample measurements during their stable phase. Univariate and multivariate logistic regression were used to assess the association between airway thickening or serum cytokines and the COPD frequent exacerbator phenotype. Receiver operating characteristic (ROC) curves were calculated for Pi10, WA%, IL-1β and IL-4 to identify frequent exacerbators.
Results: Compared with NFE group, FE group had a greater inner perimeter wall thickness of a 10 mm diameter bronchiole (Pi10), a greater airway wall area percentage (WA%) and higher concentrations of IL-1β and IL-4 (p< 0.001). After adjusting for sex, age, BMI, FEV1%pred and smoking pack-years, Pi10, WA%, IL-β and IL-4 were independently associated with a frequent exacerbator phenotype (p< 0.001). Additionally, there was an increase in the odds ratio of the frequent exacerbator phenotype with increasing Pi10, WA%, IL-4, and IL-1β (p for trend < 0.001). The ROC curve demonstrated that IL-1β had a significantly larger calculated area under the curve (p < 0.05) than Pi10, WA% and IL-4.
Conclusion: Pi10, WA%, IL-4, and IL-1β were independently associated with the frequent exacerbator phenotype among patients with stable COPD, suggesting that chronic airway and systemic inflammation contribute to the frequent exacerbator phenotype.
Trial Registration: This trial was registered in Chinese Clinical Trial Registry (https://www.chictr.org.cn). Its registration number is ChiCTR2000038700, and date of registration is September 29, 2020.
Keywords: COPD, frequent exacerbator phenotype, airway thickening, inflammation
Introduction
Several patients with chronic obstructive pulmonary disease (COPD) may suffer frequent exacerbation events, a distinct clinical subgroup called the frequent exacerbator phenotype.1,2 Frequent exacerbation of COPD can deteriorate chronic lung function and cause irreparable damage to the airways.3 Unfortunately, both COPD patients and society incur a severe burden due to the frequent worsening and comorbidities, especially given the significant usage of medical resources.4 Considering that great financial burden and progressive symptoms are related to acute exacerbations,5,6 it is essential to understand the nature of the frequent exacerbator phenotype to inform clinical management and to determine more accurate and accessible biomarkers to identify frequent exacerbators.
The association between COPD exacerbation frequency and quantitative CT metrics has been increasingly explored.7–9 Several studies8,10–12 concluded that some factors, such as airway thickening, emphysema severity, airway diseases, and the Global Initiative for Chronic Obstructive Lung Disease (GOLD) stages, were related to the frequency of COPD exacerbation. Frequent exacerbation was independently associated with a higher emphysema index or emphysema severity.8,11 However, airway thickening, instead of emphysema, was associated with the frequency of COPD exacerbation.7 In addition, patients with airway thickening and emphysema experienced more exacerbation events than emphysema-dominant or airway thickening-dominant types.9 There was no difference in airway inflammation or exacerbation frequency between patients with emphysema alone and those with bronchiectasis and/or airway thickening.13 Consequently, the key feature of the frequent exacerbation phenotype of COPD on quantitative CT has been inconsistent and unclear. As disease severity (GOLD stage) increases, exacerbations of COPD become more frequent.12 Emphysema is associated with COPD disease severity,14 and airway thickening is associated with lung function in subjects with severe emphysema.15 In summary, differences in disease severity, especially differences in spirometry between FE group and NFE group, should be considered when identifying frequent exacerbator phenotype-related causes.
Existing airway and systemic inflammation further exacerbate COPD.16–19 In contrast to non-frequent exacerbators, frequent exacerbators have greater concentrations of interleukin-6 (IL-6), IL-8 and IL-β in sputum.20,21 Moreover, greater serum concentrations of inflammatory mediators, such as C-reactive protein (CRP), IL-6 and serum amyloid A (SAA), are associated with greater frequency of exacerbation.16,21,22 In summary, COPD frequent exacerbators have greater airway inflammation and systemic inflammation.21 However, few previous studies have investigated the association between structural changes identified on CT and systemic inflammation among patients with COPD. In addition, this study provides more evidence to determine whether airway and systemic inflammation are associated with the frequent exacerbation phenotype of COPD using more CT biomarkers and serum inflammatory cytokines.
Patients and Methods
Sample Estimation
The sample capacity was estimated as follows: airway wall area percentage (WA%) [mean: NFE group (μ1=16.99) vs FE group (μ2=17.93), SD: NFE group (σ1=3.14) vs FE group (σ2=3.44), α=0.05, 1-β=0.8]. By using PASS 15, the total sample was estimated to be 218.8
Study Design and Participants
Three hundred participants with stable COPD were selected from treated patients from the Respiratory Department of The First Affiliated Hospital of Guangzhou Medical University. Those who met the inclusion criteria and agreed to participate in the research were invited to the hospital for pre- and post bronchodilator spirometry, CT scans and venipuncture. Eligible patients were (a) aged between 40 and 85 years; (b) had a diagnosis of COPD based on an FEV1/FVC ratio < 0.70; (c) had no symptomatic deterioration in the last 4 weeks; and (d) had the capacity to provide signed written informed consent and cooperate with relevant assessments; (e) patients with other lung diseases (asthma, malignancies, bronchiectasis and tuberculosis), heart failure, gastroesophageal reflux and cognitive disorders were excluded; (f) had the restrictive ventilatory dysfunction. A total of 106 frequent exacerbators (2 exacerbations or more in the last year without any exacerbations in the previous 4 weeks) and 106 nonfrequent exacerbators (fewer than 2 exacerbations in the last year without any exacerbations in the previous 4 weeks) were selected and matched for sex, age and FEV1%pred at a 1:1 ratio (Figure 1). All participants gave written informed consent, and this study was approved by the First Affiliated Hospital of Guangzhou Medical University professional ethics committee (reference number for the study: 2016-20).
 |
Figure 1 Study diagram showing the flowchart of subject recruitment. |
CT Scans and Quantitative Image Analysis
All subjects underwent volumetric CT imaging at full inspiration and expiration.
The scanning parameters consisted of a slice thickness of 1 mm, a slice separation of 1 mm, a reconstructed thickness of 1 mm, a matrix of 512×512, tube voltage of 120 kV and tube current of 30 mAs. Reconstructed three-dimensional tracheobronchial tree images were used for airway quantitative analysis using VIDA Pulmonary Workstation, version 2.0 (Vida Diagnostics, Coralville, Iowa). Each parameter was measured in the following six segmental bronchi: right upper lobe, right middle lobe, right lower lobe, left upper lobe, posterior basal segment, and left lower lobe. The total emphysema percentage was defined as all lung voxels with a CT attenuation value of less than −950 HU (Hounsfield units), and air trapping was defined as all lung voxels with a CT attenuation value of less than −856 HU. Quantitative analysis of emphysema and air trapping was performed on segmented lung images using VIDA version 2.0.
The quantitative CT parameters included the wall area percentage WA% = (total airway area – airway lumen area)/(total airway area)*100, inner perimeter wall thickness of a 10 mm diameter bronchiole (Pi10), emphysema index [EI, CT automatic calculation of the volume fraction of the lungs below 950 HU at full inspiration (%LAA-950)] and air trapping [CT automatic calculation of the volume fraction of the lungs below 856 HU at full expiration (%LAA-856)]. Emphysema severity was categorized as follows using the Goddard score: 0=emphysema index<5%, 1=5%< emphysema index<25%, 2=25%<emphysema index<50%, 3=50%<emphysema index<75%, and 4=75%≤ emphysema index.
Spirometry
Spirometry was performed using a pulmonary function instrument (MasterScreen Pneumo, Germany) 20 min before and after inhalation of a short-acting bronchodilator and conducted based on pulmonary function test criteria released by the ATS.23 The severity of airflow limitation was assessed by post bronchodilator spirometry according to GOLD standard grades 1–4 with an FEV1: FVC ratio of <0.7. On the basis of reference values from the European Coal and Steel Community (1993) and the application of conversion factors for Chinese adults (male: 0.95, female: 0.93), we calculated predicted values.24
Blood Sampling and Cytokine Analysis
Venous blood samples were collected from patients with stable COPD, and cell counts were made using a hematological analyzer (DxH 800, Beckman Coulter, California, United States). These blood samples were centrifuged (4°C, 3000 rpm, 10 min) to retain the upper serum sample. The concentration of cytokines in this sample was detected with the human cytokine V-PLEX validated immunoassay kit (Mesoscale Discovery, Gaithersburg, MD), and the average of each variable (IL-1β, IL-4, IL-5, IL-6, IL-13, IL-17 and IFN-γ) is reported.
Statistical Analysis
SPSS Statistics 26 was used to perform a statistical analysis of data comparison. Normally distributed data are presented as the means ± standard deviations (x ± s), nonnormally distributed data are expressed as medians and interquartile ranges, and categorical variables are expressed as absolute frequencies. The associations between airway thickening or systemic inflammation and the frequent exacerbator phenotype of COPD were assessed using univariate and multivariate binary logistic regression. In the linear trend test, associations between quartiles of Pi10, WA%, IL-1β, or IL-4 [Q1-Q4, Q1: ≤25th percentile, Q2: 25th percentile-50th percentile, Q3: 50th percentile-75th percentile, Q4: ≥75th percentile-100th percentile] and the frequent exacerbator phenotype of COPD were analyzed using multivariate binary logistic regression. Moreover, receiver operating characteristic curves (ROC curves) of Pi10, WA%, IL-1β, or IL-4 were plotted, and P<0.05 indicated that the difference was statistically significant.
Results
Subject Characteristics
In all, 135 males and 77 females with an average age of 66.2±7.5 years were enrolled in this study, comprising 106 nonfrequent exacerbators and 106 frequent exacerbators (Table 1). Participants attended a baseline visit to assess demographics, smoking status, exacerbation history in the past year, medical history, medication use, symptoms (COPD assessment test, CAT, modified Medical Research Council, mMRC, St George’s Respiratory Questionnaire, SGRQ) and comorbidities. Frequent exacerbators had more exacerbations, a greater smoking index and worse quality of life, which were consistent with the characteristics of the frequent exacerbator phenotype of COPD. However, it is worth highlighting that there were no differences (P>0.05) in FEV1% pred (%), FVC% pred (%), FEV1 (%) and FVC (%) between the frequent exacerbators and nonfrequent exacerbators. Moreover, in the FE group, fewer patients were in GOLD stage 1 than in other GOLD stages.
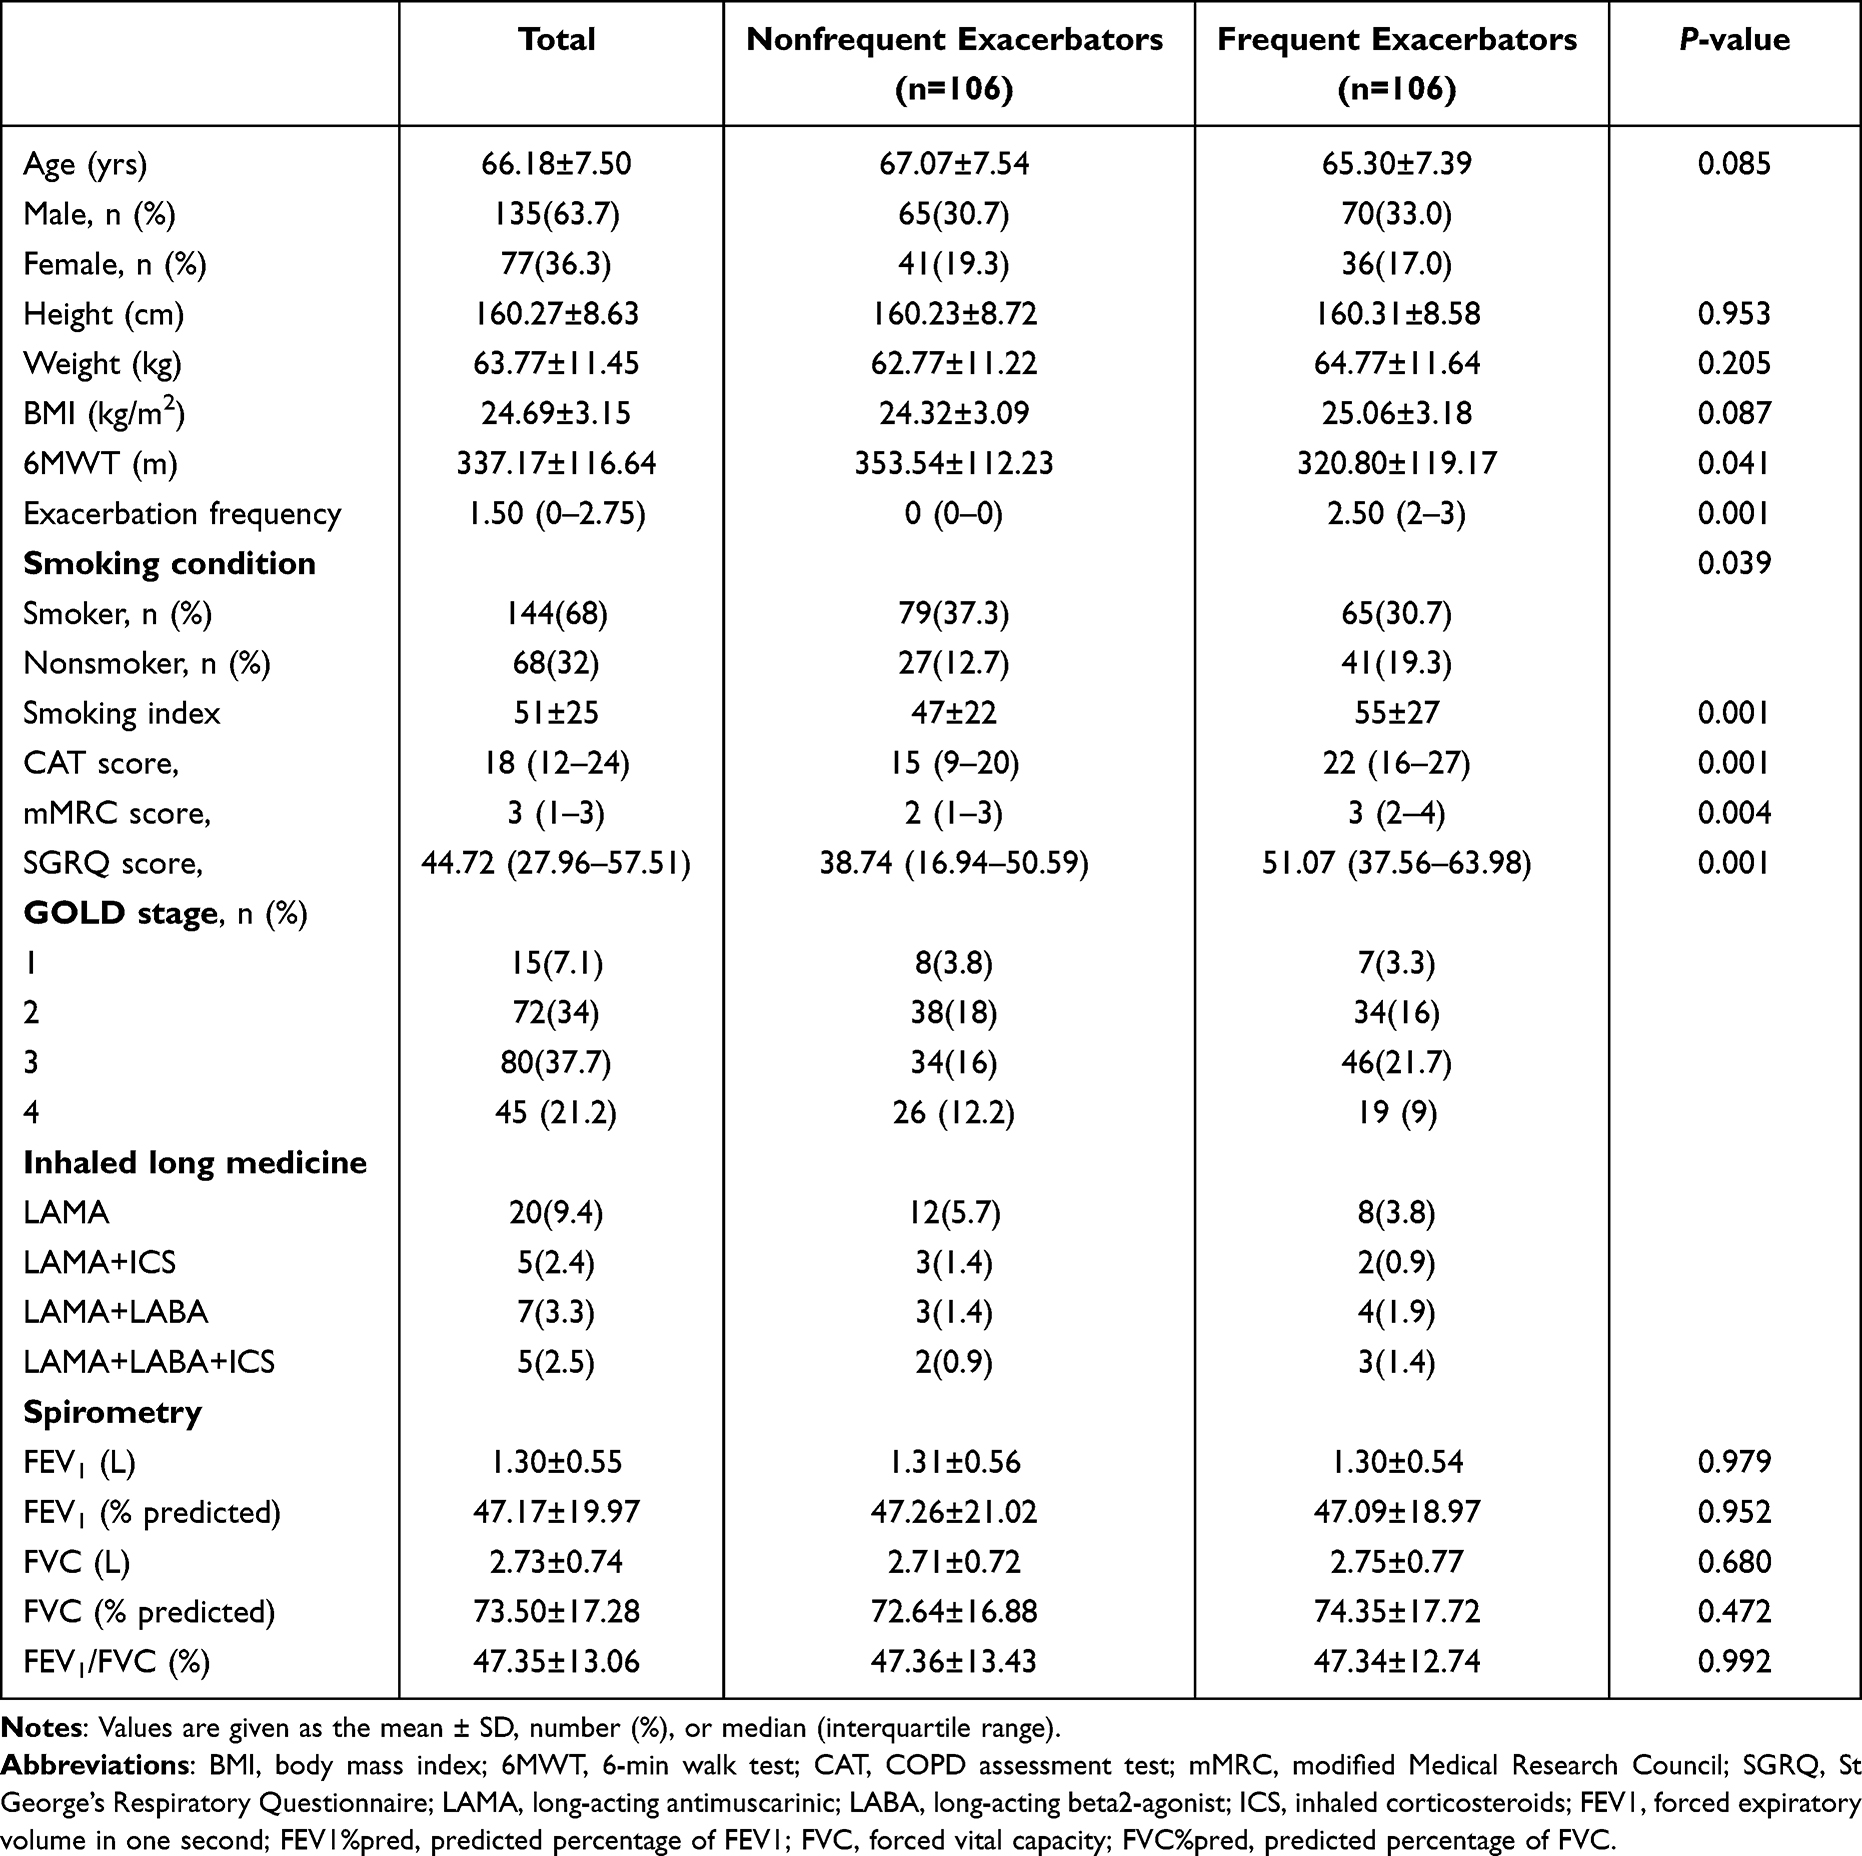 |
Table 1 Baseline Characteristics of Frequent and Nonfrequent Exacerbators |
Airway or Systemic Inflammation Between Groups
No significant associations were found between the FE and NFE groups in EI, emphysema grading and air trapping, showing that emphysema severity was hardly associated with the COPD frequent exacerbator phenotype (P>0.05) after excluding the difference in spirometry. This result is inconsistent with the conclusions of other studies.8,11 However, compared with nonfrequent exacerbators, frequent exacerbators exhibited greater Pi10 [2.89±0.48 vs 2.54±0.54, P<0.001] and WA% [57.75±6.36 vs 51.93±8.23, %, P<0.001] values. Moreover, Pi10 and WA% (P<0.001) appeared to be associated with the phenotype (Table 2), implying that frequent exacerbators had further airway thickening. Additionally, we noticed that frequent exacerbators had higher concentrations of IL-1β [2.33 (1.95–2.80) vs 1.46 (1.13–1.99) pg/mL, P < 0.001], IL-4 [4.49 (3.65–5.11) vs 3.69 (3.01–4.37) pg/mL, P < 0.001], and IL-6 [8.79 (6.60–10.69) vs 6.83 (4.90–13.40) pg/mL, P=0.037] (Table 3).
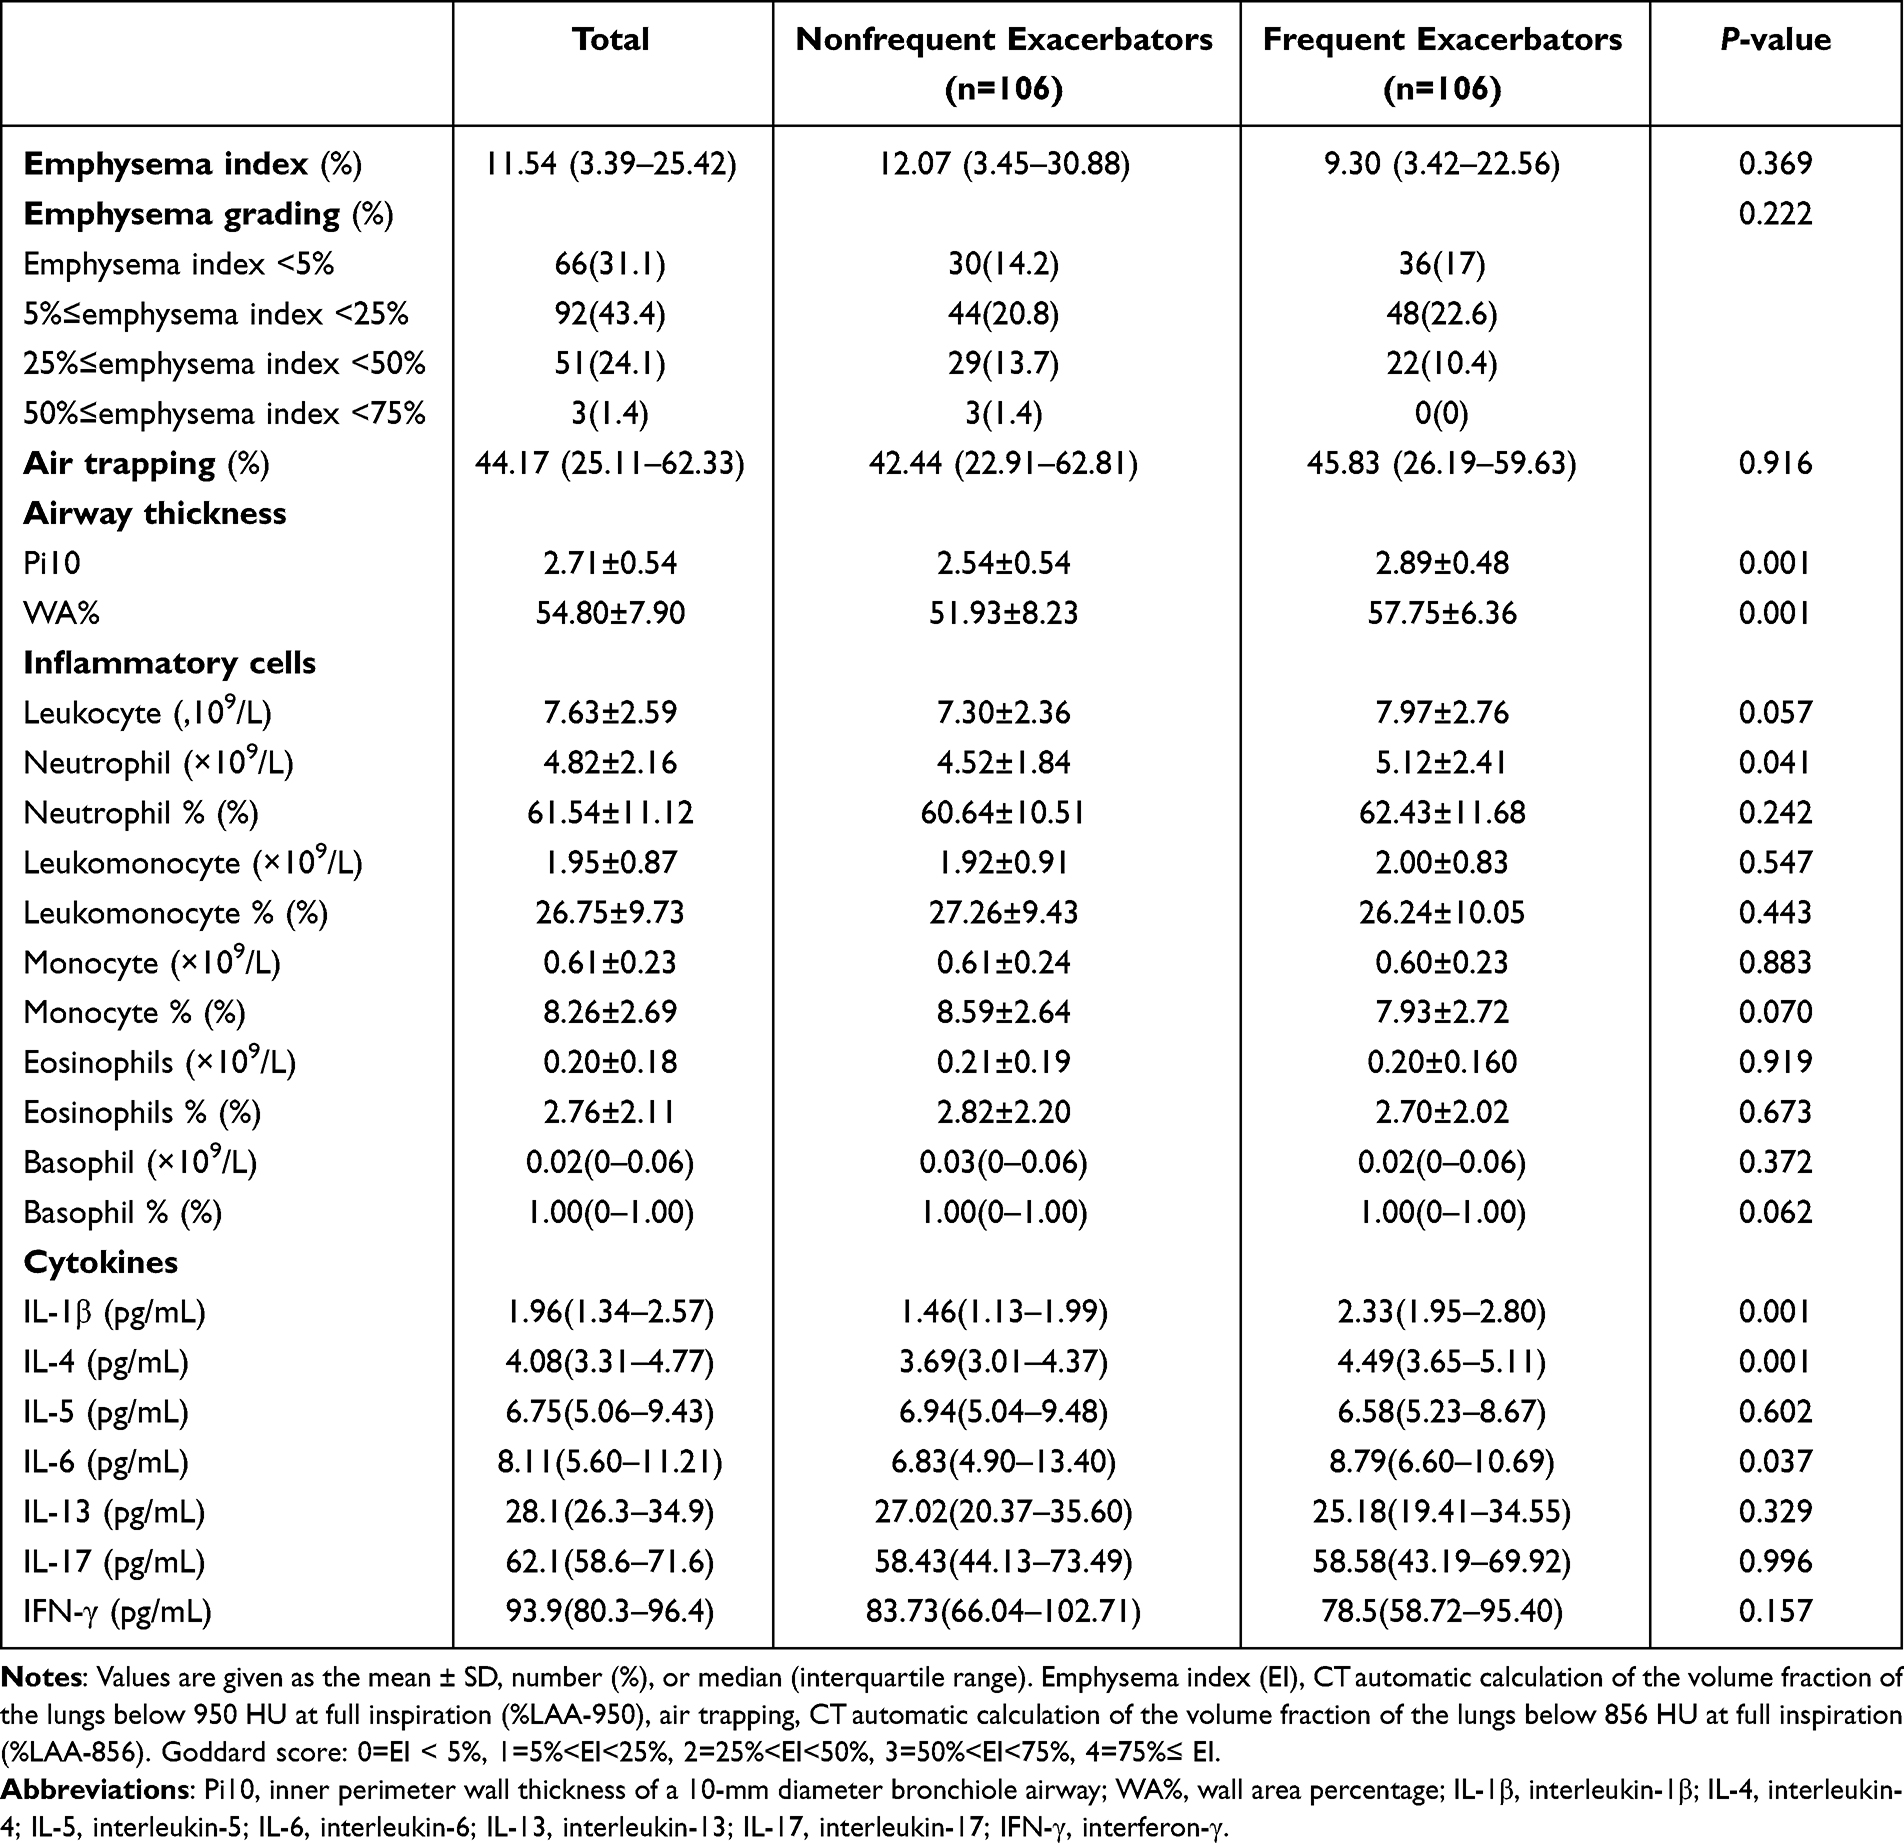 |
Table 2 Quantitative CT Parameters and Inflammatory Index Between Frequent and Nonfrequent Exacerbators |
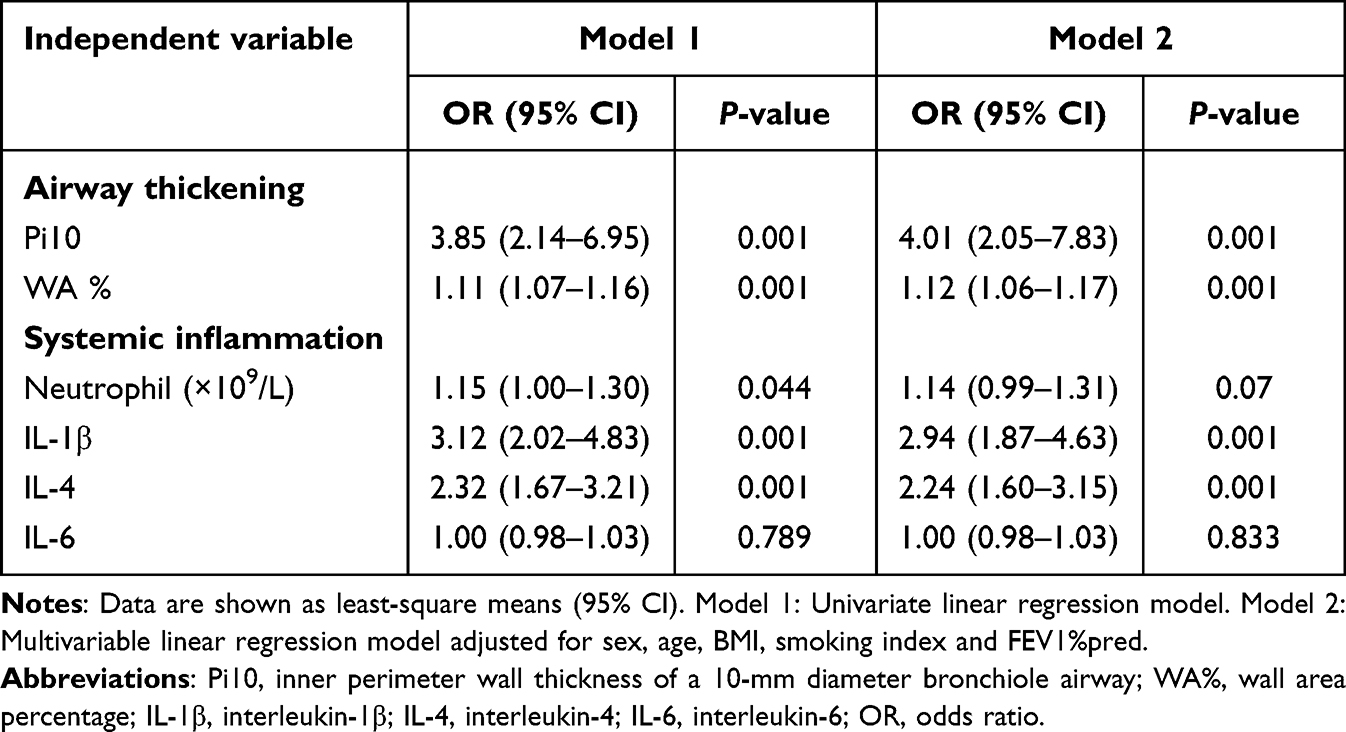 |
Table 3 Association Between the Frequent Exacerbator Phenotype in COPD and Airway Thickening or Systemic Inflammation |
Nature of the COPD Frequent Exacerbation Phenotype: Inflammation
There are strong associations between airway thickening or systemic inflammation and the frequent exacerbator phenotype (Table 3). Without adjusting for sex, age, BMI, smoking index and FEV1%pred (model 1), the results showed that Pi10 [OR 3.85, (2.14–6.95), P<0.001] and WA% [OR 1.15 (1.00–1.30), P<0.001] were related to the frequent exacerbator phenotype. After adjusting for sex, age, BMI, smoking index and FEV1%pred (model 2), an independent relationship between airway thickening based on Pi10 [OR 4.01, (2.05–7.83), P<0.001] and WA% [OR 1.12, (1.06–1.17), P<0.001] and the frequent exacerbator phenotype was revealed. Moreover, in model 1, neutrophils [OR 1.11 (1.07–1.16), P=0.044], IL-1β [OR 3.12, (2.02–4.83), P<0.001] and IL-4 [OR 2.32, (1.67–3.21), P<0.001] were associated with the frequent exacerbator phenotype. However, in model 2, only IL-1β [OR 2.94, (1.87–4.63), P<0.001] and IL-4 [OR 2.24, (1.60–3.15), P<0.001] were independently related to the frequent exacerbator phenotype. Thus, we determined that there was an independent association between systemic inflammation and the frequent exacerbating phenotype of COPD.
There was a positive association between trend changes in Pi10, WA%, IL-1β, or IL-4 and the frequent exacerbator phenotype (Figure 2). After adjusting for sex, age, BMI, smoking index and FEV1%pred, the results showed that the greater the Pi10 [Q2, OR 4.27(1.60–11.37) P<0.001, Q3, OR 13.18(4.86–35.77) P<0.001, Q4, OR 12.19(4.20–35.39) P<0.001] and WA% [Q2, OR 4.30(1.63–11.34) P=0.003, Q3, OR 12.70(4.60–35.10) P<0.001, Q4, OR 13.18(4.53–38.35) P<0.001], the greater the risk of being a frequent exacerbator was (P for trend ˂0.001). Similarly, we found the same linear association between the odds ratio of being a frequent exacerbator and increasing quartiles of IL-1β (P˂0.001) or IL-4 (P for trend ˂0.001). Moreover, the odds of being a frequent exacerbator were approximately 31 times greater in the IL-1β quartile (≤2.57 pg/mL) than in the lowest IL-1β quartile (≤1.34 pg/mL) [OR, 30.84 (9.88–96.26), P<0.001].
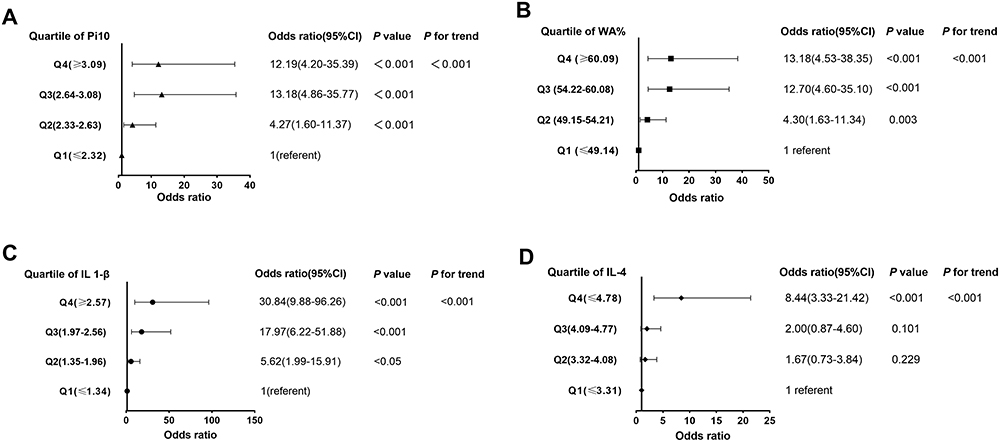 |
Figure 2 Associations between quartiles of Pi10, WA%, IL-1β, or IL-4 and the frequent exacerbation phenotype. The linear association between the odds ratio (OR) and variables was assessed by P for trend using a logistic regression model. (A) OR for quartile of Pi10 associated with the frequent exacerbator phenotype (p for trend <0.001). (B) OR for quartile of WA% associated with the frequent exacerbator phenotype (p for trend <0.001). (C) OR for quartile of IL-1β associated with the frequent exacerbator phenotype (p for trend <0.001). (D) OR for quartile of IL-4 associated with the frequent exacerbator phenotype (p for trend <0.001). |
Associations Between Airway Thickening and Systemic Inflammation
The quantitative CT parameter Pi10 was independently associated with IL-1β [β, (95% confidence interval, CI, 1.47 (1.11–1.84)), P<0.001] and IL-4 [0.41 (0.12–0.69), P<0.05] but not the neutrophil count. In addition, as Pi10 increased, the levels of IL-1β (P for trend <0.001) and IL-4 (P for trend <0.05) increased (Table 4). The findings indicated that airway thickening was independently related to systemic inflammation.
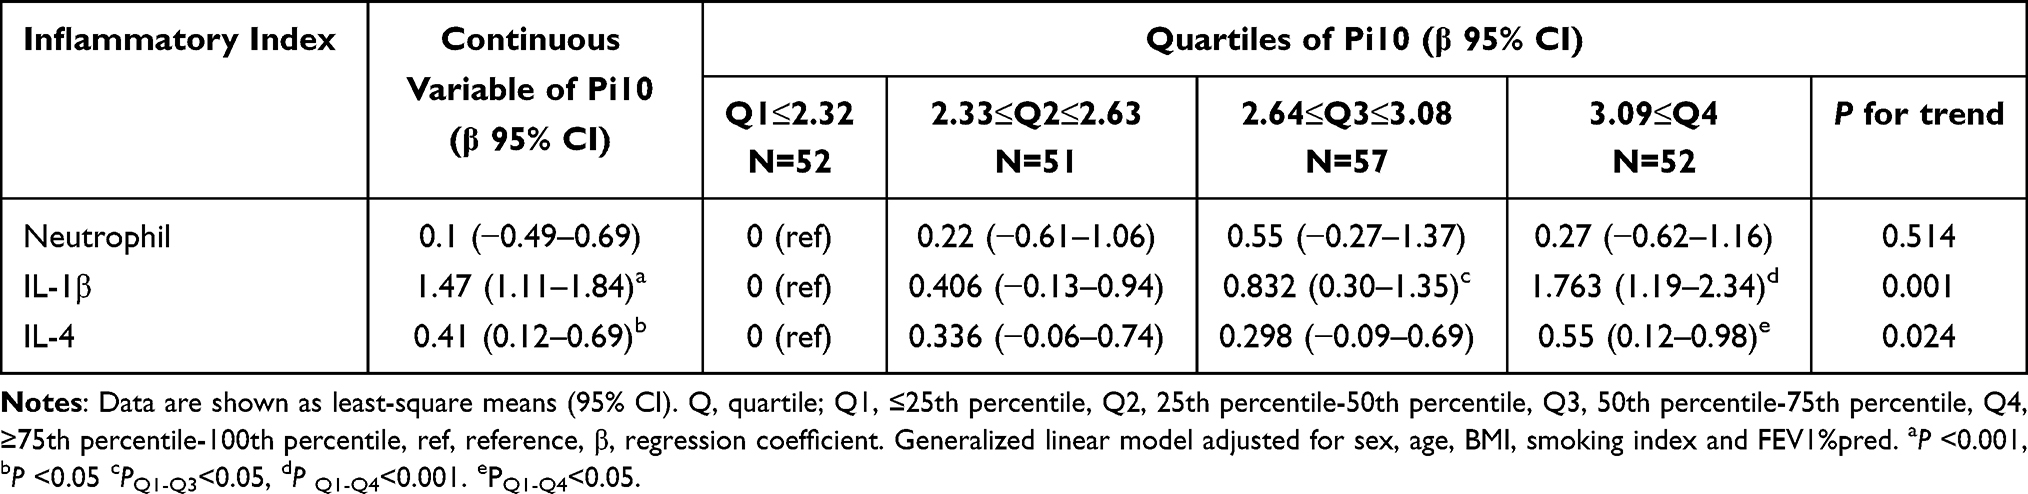 |
Table 4 Association Between Pi10 and the Inflammatory Index |
Sensitivity and Specificity of Pi10, WA%, IL-1β and IL-4 to Identify COPD Frequent Exacerbator Phenotypes
For the frequent exacerbator phenotype, the diagnostic values of Pi10, WA%, IL-1β and IL-4 were revealed and compared by drawing ROC curves (Figure 3). For Pi10, WA%, IL-1β or IL-4, the areas under the ROC curves were 0.722, 0.736, 0.807, and 0.706 for the identification of the frequent exacerbator phenotype, and the corresponding optimal cutoffs were 2.51 mm, 54.00%, 1.69 pg/mL and 4.31 pg/mL, respectively. Values above the cutoffs were associated with a significantly increased risk of being a frequent exacerbator.
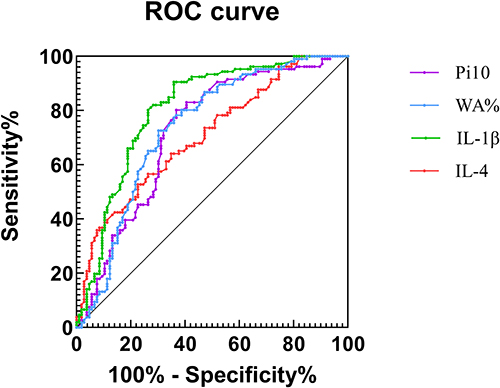 |
Figure 3 Receiver operating characteristic curve for identification of the frequent exacerbator phenotype. ROC analysis yielded areas under the curve (AUCs) of 0.722, 0.736, 0.807 and 0.706, respectively, for the identification of FE. The greatest sum of sensitivity and specificity occurred at Pi10 = 2.51 mm, WA%=54%, IL-1β=1.686 (pg/mL), and IL-4=4.316 (pg/mL). |
Discussion
The principal finding of this case–control study was that airway thickening on quantitative CT and systemic inflammation were independently associated with the frequent exacerbator phenotype of COPD after subjects were matched for sex, age and FEV1%pred, suggesting that airway and systemic inflammation contribute to the frequent exacerbation phenotype in COPD. To our knowledge, this study is the first to estimate the association between several metrics of quantitative CT or systemic inflammation and the COPD frequent exacerbation phenotype in consideration of the influence of lung function differences. Compared to other studies,7–9,11,25,26 this study has an advanced study design and more comprehensive metrics, including quantitative CT, lung function and biochemical tests. Few previous studies have investigated the association between structural changes identified on CT and systemic inflammation in patients with COPD, and quantitative CT parameters did not show any convincing associations with biomarkers.26 However, this study demonstrates that airway inflammation is associated with systemic inflammation in COPD from the perspective of airway thickening and inflammatory cytokines.
As reported, airway thickening, severity of pulmonary function and emphysema are associated with the frequent exacerbator phenotype.7,8,11,12,27 At the same time, a higher Pi10 and worse emphysema are significantly associated with worse FEV1%-predicted COPD.28,29 In addition, some emphysema phenotypes, such as panlobular emphysema, were associated with greater airflow obstruction.14 In contrast, there was no significant difference in CT-quantified emphysema between FEs and NFEs in this study, possibly because there was also no difference in spirometry or severity of COPD. Our findings partly support and explain the findings of others in terms of the nonlinear relationship between emphysema percentage and exacerbation frequency.11 Our data can be used to determine whether emphysema severity is the effect of the difference in spirometry between groups and thus possibly has a causal role. This study suggested that the relationship between emphysema percentage and exacerbation frequency partly mirrored the relationship between disease severity and exacerbation frequency, which explains the difference in factors that drive exacerbations between patients with severe emphysema and patients with severe airway disease.11 This suggests that while quantitative CT measures of emphysema are useful tools for reflecting pulmonary physiology and functional status, they may not be useful tools for assessing the frequency of COPD exacerbation.
Traditional airway measurements on CT, for example, wall thickness or luminal area, require an accurate set of labeled airway branches.28 However, Pi10 and WA%, as imaging biomarkers of airway thickening, are easily measured and associated with chronic airway inflammation in patients with COPD.30 Moreover, Pi10 is a standardized parameter for a comprehensive assessment of bronchial wall thickness and a clinical biomarker indicating smoking-related injury in smokers’ airways.28,31 Consistent with prior studies,7,11 airway thickening was associated with the frequency of COPD exacerbation. Nevertheless, our findings between FEs and NFEs provide more quantitative CT parameters and adopt advanced inclusion and exclusion criteria. Moreover, we considered that Pi10 and WA% were independently associated with the frequent exacerbator phenotype among patients with COPD. With increasing Pi10 and WA%, the risk of being a frequent exacerbator increased (p for trend <0.001). For patients with stable COPD, Pi10 and WA% would be useful imaging biomarkers to forecast the frequency of COPD exacerbations because the AUCs of Pi10 and WA% in the ROC analysis were 0.722 and 0.736, respectively, according to our results.
Neutrophils, especially the aggregation and activation of neutrophils, play a central role in inflammation in COPD.32 Frequent COPD exacerbators have further neutrophilic inflammation due to strong associations between neutrophilic inflammation and increased small airway resistance and gas trapping.33 In addition, neutrophilic inflammation disrupts elastic fiber assembly, resulting in a permanent reduction in lung function in a mouse model.34 As noted above, we found that a greater concentration of neutrophils was associated with a frequent exacerbating phenotype of COPD in this study, which was consistent with high blood neutrophil counts predicting more frequent exacerbations in patients with COPD.35 IL-1β plays an important role in cytokine-mediated neutrophilic inflammation because IL-1β not only induces bronchial epithelial cells to express the cytokines IL-6 and IL-8 but also increases the number of T lymphocytes and dendritic cells to promote the release of IL-6 and IL-17.36,37 IL-1β gene expression in sputum was significantly upregulated in frequent exacerbators, and frequent exacerbations in COPD are associated with increased airway IL-1β.21 The levels of IL-4, IL-17, and IFN-c were significantly higher during the exacerbation of COPD.38 We previously reported that there is a greater concentration of IL-4 in the serum of frequent exacerbators.22 In addition, serum IL-6 was significantly higher in frequent exacerbators than in nonfrequent exacerbators in COPD.21 In this study, frequent exacerbators had greater concentrations of IL-1β, IL-6 and IL-4 in serum. These results suggest that greater concentrations of IL-1β, IL-4 or L-6 in sputum or serum were associated with the COPD frequent exacerbation phenotype. After adjusting for sex, age, BMI, smoking index and FEV1%pred, we found that IL-1β and IL-4 were independently associated with the frequent exacerbator phenotype. In addition, the ROC analysis identified IL-1β=1.686 pg/mL as providing 90.6% sensitivity and IL-4=4.316 pg/mL as providing 56.6% sensitivity for distinguishing nonfrequent from frequent exacerbators, implying that IL-1β may be a better biomarker than IL-4 to forecast the risk of being a COPD frequent exacerbator phenotype.
Abundant evidence has shown significant systemic inflammation in patients with COPD.39–42 There is supportive evidence that systemic markers may spill over from the lungs into systemic circulation.42 Systemic inflammation was associated with airway inflammation in COPD and asthma by exploring the link between inflammation biomarkers in the airway and serum.21,43 In contrast, greater concentrations of IL-1β, IL-6 and IL-4 in serum were associated with the frequent exacerbator phenotype in this study, meaning that the frequency of COPD exacerbation was associated with further systemic inflammation. Airway thickening in COPD can be attributed to airway inflammation and airway remodeling.28,44 A previous study considered that there were no significant associations between CT parameters, such as Pi10, and blood neutrophils and eosinophils, which was consistent with the results of this study.26 However, we not only found significantly higher IL-1β or IL-4 concentrations and greater Pi10 in frequent exacerbators, but we also discovered that Pi10 was independently correlated with IL-1β or IL-4, indicating that airway inflammation and airway remodeling may be associated with systemic inflammation in COPD.
As mentioned earlier, we found that frequent exacerbators in COPD always have significantly higher IL-1β or IL-4 concentrations, greater Pi10. In order to further evaluate our findings, the researchers may consider studying relevant data in various freely accessible databases like Spiromics or COPDGene. In order to provide patients with frequent COPD deterioration with a novel kind of therapeutic intervention, we must also apply our findings to clinical practice or to some COPD deterioration prediction algorithms.45 As global population ages, recognizing and intervening early in patients with frequent acute exacerbations of chronic obstructive pulmonary disease is undoubtedly a great boon.46
We recognize that this study has limitations, for instance, the lack of sputum samples, meaning that we were unable to assert whether our findings on CT were consistent with those of cytokines or cells of sputum. However, we found strong evidence of associations between further inflammation and the frequent exacerbator phenotype in COPD with a small sample size, suggesting that these findings are worth exploring in a larger cohort to validate our findings.
Conclusion
Our findings indicated that Pi10, WA%, IL-4, and IL-1β were independently associated with the frequent exacerbator phenotype among patients with stable COPD, suggesting that chronic airway and systemic inflammation contribute to the frequent exacerbator phenotype. Additionally, Pi10 was independently related to IL-1β or IL-4 in serum, indicating that there is more supportive evidence to demonstrate an association between the airway and systemic inflammation in patients with COPD. Moreover, based on the results of this study, Pi10, WA%, IL-1β and IL-4 should be used as predictors of future exacerbation risk in COPD. In summary, treatment strategies to attenuate airway and systemic inflammation and reduce COPD exacerbation in stable patients deserve further investigation.
Abbreviations
CT, Computed tomography; COPD, Chronic obstructive pulmonary disease; FE, Frequent exacerbators; NFE, Non-frequent exacerbators; ROC, Receiver operating characteristic; 6MWT, 6-min walk test; CRP, C-reactive protein; SAA, Serum amyloid A; GOLD, Global Initiative for Chronic Obstructive Lung Disease; BMI, body mass index; CAT, COPD assessment test; Mmrc, Modified Medical Research Council; SGRQ, St George’s Respiratory Questionnaire; LAMA, long-acting antimuscarinic; LABA, long-acting beta2-agonist; ICS, inhaled corticosteroids; FEV1, Forced expiratory volume in 1 s; FEV1%pred, Predicted percentage of forced expiratory volume in 1 s; FVC, Forced vital capacity; FVC% pred, Predicted percentage of forced vital capacity; Pi10, Inner perimeter wall thickness of a 10-mm diameter bronchiole airway; WA%, Wall area percentage; IL-1β, Interleukin-1β; IL-4, Interleukin-4; IL-5, Interleukin-5; IL-6, Interleukin-6; IL-13, Interleukin-13; IL-17, Interleukin-17; IFN-γ, Interferon-γ; ref, Reference; β, Regression coefficient; Q, Quartile.
Data Sharing Statement
All data generated or analysed during this study are included in this published article.
Ethics Approval and Consent to Participate
This study was approved by the Medical Ethics Review Committee of the First Affiliated Hospital of Guangzhou Medical University, Guangzhou, China. The reference number for the study is 2016-20. Informed consent for this study was obtained from all the subjects. Furthermore, our study complied with the Declaration of Helsinki.
Acknowledgments
The authors would like to thank the investigators and patients at the investigative sites for their support of this study.
Author Contributions
All authors made substantial contributions to conception and design, acquisition of data, or analysis and interpretation of data, took part in drafting the article or revising it critically for important intellectual content, agreed to submit to the current journal, gave final approval of the version to be published, and agree to be accountable for all aspects of the work.
Funding
This work was supported by the National Natural Science Foundation of China (No. 82170043), Local Innovative and Research Teams Project of Guangdong Pearl River Talents Program (NO.2017BT01S155) and a grant of State Key Laboratory of Respiratory Disease (SKLRD-QN-201923). The sponsors have no role in design, conduct, data interpretation of the study, and preparation, review or approval of this manuscript.
Disclosure
The authors declare that they have no known competing financial interests or personal relationships that could have appeared to influence the work reported in this paper.
References
1. Soler-Cataluña JJ, Rodriguez-Roisin R. Frequent chronic obstructive pulmonary disease exacerbators: how much real, how much fictitious? COPD. 2010;7(4):276–284. doi:10.3109/15412555.2010.496817
2. Wedzicha JA, Rabe KF, Martinez FJ, et al. Efficacy of roflumilast in the COPD frequent exacerbator phenotype. Chest. 2013;143(5):1302–1311. doi:10.1378/chest.12-1489
3. Wedzicha JA, Seemungal TAR. COPD exacerbations: defining their cause and prevention. Lancet. 2007;370(9589):786–796. doi:10.1016/S0140-6736(07)61382-8
4. Soler-Cataluña JJ, Izquierdo JL, Juárez Campo M, Sicras-Mainar A, Nuevo J. Impact of COPD exacerbations and burden of disease in Spain: AVOIDEX study. Int J Chron Obstruct Pulmon Dis. 2023;18:1103–1114. doi:10.2147/COPD.S406007
5. Deniz S, Şengül A, Aydemir Y, Çeldir Emre J, Özhan MH. Clinical factors and comorbidities affecting the cost of hospital-treated COPD. Int J Chron Obstruct Pulmon Dis. 2016;11:3023–3030. doi:10.2147/COPD.S120637
6. Seneff MG, Wagner DP, Wagner RP, Zimmerman JE, Knaus WA. Hospital and 1-year survival of patients admitted to intensive care units with acute exacerbation of chronic obstructive pulmonary disease. JAMA. 1995;274(23):1852–1857. doi:10.1001/jama.1995.03530230038027
7. Han MK, Bartholmai B, Liu LX, et al. Clinical significance of radiologic characterizations in COPD. COPD. 2009;6(6):459–467. doi:10.3109/15412550903341513
8. Oh Y-M, Sheen S-S, Park JH, et al. Emphysematous phenotype is an independent predictor for frequent exacerbation of COPD. Int J Tuberc Lung Dis. 2014;18(12):1407–1414. doi:10.5588/ijtld.14.0205
9. Lim JU, Kim EK, Lim SY, et al. Mixed phenotype of emphysema and airway wall thickening is associated with frequent exacerbation in chronic obstructive pulmonary disease patients. Int J Chron Obstruct Pulmon Dis. 2019;14:3035–3042. doi:10.2147/COPD.S227377
10. Maselli DJ, Yen A, Wang W, et al. Small airway disease and emphysema are associated with future exacerbations in smokers with CT-derived bronchiectasis and COPD: results from the COPDGene cohort. Radiology. 2021;300(3):706–714. doi:10.1148/radiol.2021204052
11. Han MK, Kazerooni EA, Lynch DA, et al. Chronic obstructive pulmonary disease exacerbations in the COPDGene study: associated radiologic phenotypes. Radiology. 2011;261(1):274–282. doi:10.1148/radiol.11110173
12. Hurst JR, Vestbo J, Anzueto A, et al. Susceptibility to exacerbation in chronic obstructive pulmonary disease. N Engl J Med. 2010;363(12):1128–1138. doi:10.1056/NEJMoa0909883
13. Bafadhel M, Umar I, Gupta S, et al. The role of CT scanning in multidimensional phenotyping of COPD. Chest. 2011;140(3):634–642. doi:10.1378/chest.10-3007
14. Wilgus ML, Abtin F, Markovic D, et al. Panlobular emphysema is associated with COPD disease severity: a study of emphysema subtype by computed tomography. Respir Med. 2022;192:106717. doi:10.1016/j.rmed.2021.106717
15. Kim WJ, Silverman EK, Hoffman E, et al. CT metrics of airway disease and emphysema in severe COPD. Chest. 2009;136(2):396–404. doi:10.1378/chest.08-2858
16. Perera WR, Hurst JR, Wilkinson TMA, et al. Inflammatory changes, recovery and recurrence at COPD exacerbation. Eur Respir J. 2007;29(3):527–534. doi:10.1183/09031936.00092506
17. Gompertz S, O’Brien C, Bayley DL, Hill SL, Stockley RA. Changes in bronchial inflammation during acute exacerbations of chronic bronchitis. Eur Respir J. 2001;17(6):1112–1119. doi:10.1183/09031936.01.99114901
18. Crooks SW, Bayley DL, Hill SL, Stockley RA. Bronchial inflammation in acute bacterial exacerbations of chronic bronchitis: the role of leukotriene B4. Eur Respir J. 2000;15(2):274–280. doi:10.1034/j.1399-3003.2000.15b09.x
19. Chen -T-T, S-M W, Chen K-Y, et al. Suppressor of variegation 3–9 homologue 1 impairment and neutrophil-skewed systemic inflammation are associated with comorbidities in COPD. BMC Pulm Med. 2021;21(1):276. doi:10.1186/s12890-021-01628-x
20. Bhowmik A, Seemungal TA, Sapsford RJ, Wedzicha JA. Relation of sputum inflammatory markers to symptoms and lung function changes in COPD exacerbations. Thorax. 2000;55(2):114–120. doi:10.1136/thorax.55.2.114
21. J-J F, McDonald VM, Baines KJ, Gibson PG. Airway IL-1β and systemic inflammation as predictors of future exacerbation risk in asthma and COPD. Chest. 2015;148(3):618–629. doi:10.1378/chest.14-2337
22. Zhao D, Abbasi A, Rossiter HB, et al. Serum amyloid A in stable COPD patients is associated with the frequent exacerbator phenotype. Int J Chron Obstruct Pulmon Dis. 2020;15:2379–2388. doi:10.2147/COPD.S266844
23. Miller MR, Hankinson J, Brusasco V, et al. Standardisation of spirometry. Eur Respir J. 2005;26(2):319–338. doi:10.1183/09031936.05.00034805
24. Zheng J, Zhong N. Normative values of pulmonary function testing in Chinese adults. Chin Med J. 2002;115(1):50–54.
25. Jairam PM, van der Graaf Y, Lammers J-WJ, Willem PT, de Jong PA. Incidental findings on chest CT imaging are associated with increased COPD exacerbations and mortality. Thorax. 2015;70(8):725–731. doi:10.1136/thoraxjnl-2014-206160
26. Ostridge K, Williams NP, Kim V, et al. Relationship of CT-quantified emphysema, small airways disease and bronchial wall dimensions with physiological, inflammatory and infective measures in COPD. Respir Res. 2018;19(1):31. doi:10.1186/s12931-018-0734-y
27. Donaldson GC, Wedzicha JA. COPD exacerbations.1: epidemiology. Thorax. 2006;61(2):164–168. doi:10.1136/thx.2005.041806
28. Charbonnier J-P, Pompe E, Moore C, et al. Airway wall thickening on CT: relation to smoking status and severity of COPD. Respir Med. 2019;146:36–41. doi:10.1016/j.rmed.2018.11.014
29. Dunican EM, Elicker BM, Henry T, et al. Mucus plugs and emphysema in the pathophysiology of airflow obstruction and hypoxemia in smokers. Am J Respir Crit Care Med. 2021;203(8):957–968. doi:10.1164/rccm.202006-2248OC
30. Kim V, Davey A, Comellas AP, et al. Clinical and computed tomographic predictors of chronic bronchitis in COPD: a cross sectional analysis of the COPDGene study. Respir Res. 2014;15(1):52. doi:10.1186/1465-9921-15-52
31. Grydeland TB, Dirksen A, Coxson HO, et al. Quantitative computed tomography measures of emphysema and airway wall thickness are related to respiratory symptoms. Am J Respir Crit Care Med. 2010;181(4):353–359. doi:10.1164/rccm.200907-1008OC
32. Uddin M, Watz H, Malmgren A, Pedersen F. NETopathic inflammation in chronic obstructive pulmonary disease and severe asthma. Front Immunol. 2019;10:47. doi:10.3389/fimmu.2019.00047
33. Day K, Ostridge K, Conway J, et al. Interrelationships among small airways dysfunction, neutrophilic inflammation, and exacerbation frequency in COPD. Chest. 2021;159(4):1391–1399. doi:10.1016/j.chest.2020.11.018
34. Benjamin JT, Plosa EJ, Sucre JM, et al. Neutrophilic inflammation during lung development disrupts elastin assembly and predisposes adult mice to COPD. J Clin Invest. 2021;131(1). doi:10.1172/JCI139481
35. Mochimaru T, Chubachi S, Irie H, et al. Blood eosinophil and neutrophil counts differentially identify frequent exacerbation in patients with COPD with physician-diagnosed asthma and COPD. Allergol Int. 2021;70(2):255–257. doi:10.1016/j.alit.2020.09.004
36. Khan YM, Kirkham P, Barnes PJ, Adcock IM, Taube C. Brd4 is essential for IL-1β-induced inflammation in human airway epithelial cells. PLoS One. 2014;9(4):e95051. doi:10.1371/journal.pone.0095051
37. Pauwels NS, Bracke KR, Dupont LL, et al. Role of IL-1α and the Nlrp3/caspase-1/IL-1β axis in cigarette smoke-induced pulmonary inflammation and COPD. Eur Respir J. 2011;38(5):1019–1028. doi:10.1183/09031936.00158110
38. Wei B, Sheng Li C. Changes in Th1/Th2-producing cytokines during acute exacerbation chronic obstructive pulmonary disease. J Int Med Res. 2018;46(9):3890–3902. doi:10.1177/0300060518781642
39. Broekhuizen R, Wouters EFM, Creutzberg EC, Schols AMWJ. Raised CRP levels mark metabolic and functional impairment in advanced COPD. Thorax. 2006;61(1):17–22. doi:10.1136/thx.2005.041996
40. Fabbri LM, Rabe KF. From COPD to chronic systemic inflammatory syndrome? Lancet. 2007;370(9589):797–799. doi:10.1016/S0140-6736(07)61383-X
41. Barnes PJ, Celli BR. Systemic manifestations and comorbidities of COPD. Eur Respir J. 2009;33(5):1165–1185. doi:10.1183/09031936.00128008
42. Sinden NJ, Stockley RA. Systemic inflammation and comorbidity in COPD: a result of ‘overspill’ of inflammatory mediators from the lungs? Review of the evidence. Thorax. 2010;65(10):930–936. doi:10.1136/thx.2009.130260
43. J-j F, Baines KJ, Wood LG, Gibson PG. Systemic inflammation is associated with differential gene expression and airway neutrophilia in asthma. OMICS. 2013;17(4):187–199. doi:10.1089/omi.2012.0104
44. Wang Y, Xu J, Meng Y, Adcock IM, Yao X. Role of inflammatory cells in airway remodeling in COPD. Int J Chron Obstruct Pulmon Dis. 2018;13:3341–3348. doi:10.2147/COPD.S176122
45. Adibi A, Sin DD, Safari A, et al. The Acute COPD Exacerbation Prediction Tool (ACCEPT): a modelling study. Lancet Respir Med. 2020;8(10):1013–1021. doi:10.1016/S2213-2600(19)30397-2
46. Kreuter M, Cottin V. The threat in chronic lung diseases: acute exacerbations. Eur Respir Rev. 2017;26(145):170075. doi:10.1183/16000617.0075-2017
 © 2023 The Author(s). This work is published and licensed by Dove Medical Press Limited. The full terms of this license are available at https://www.dovepress.com/terms.php and incorporate the Creative Commons Attribution - Non Commercial (unported, v3.0) License.
By accessing the work you hereby accept the Terms. Non-commercial uses of the work are permitted without any further permission from Dove Medical Press Limited, provided the work is properly attributed. For permission for commercial use of this work, please see paragraphs 4.2 and 5 of our Terms.
© 2023 The Author(s). This work is published and licensed by Dove Medical Press Limited. The full terms of this license are available at https://www.dovepress.com/terms.php and incorporate the Creative Commons Attribution - Non Commercial (unported, v3.0) License.
By accessing the work you hereby accept the Terms. Non-commercial uses of the work are permitted without any further permission from Dove Medical Press Limited, provided the work is properly attributed. For permission for commercial use of this work, please see paragraphs 4.2 and 5 of our Terms.