Back to Journals » International Journal of Chronic Obstructive Pulmonary Disease » Volume 18
Lung Fibroblasts from Chronic Obstructive Pulmonary Disease Subjects Have a Deficient Gene Expression Response to Cigarette Smoke Extract Compared to Healthy
Authors Garcia-Ryde M ![]() , van der Burg NMD
, van der Burg NMD ![]() , Larsson CE, Larsson-Callerfelt AK, Westergren-Thorsson G, Bjermer L
, Larsson CE, Larsson-Callerfelt AK, Westergren-Thorsson G, Bjermer L ![]() , Tufvesson E
, Tufvesson E ![]()
Received 23 August 2023
Accepted for publication 16 November 2023
Published 18 December 2023 Volume 2023:18 Pages 2999—3014
DOI https://doi.org/10.2147/COPD.S422508
Checked for plagiarism Yes
Review by Single anonymous peer review
Peer reviewer comments 4
Editor who approved publication: Prof. Dr. Richard Russell
Martin Garcia-Ryde,1 Nicole MD van der Burg,1 Carin E Larsson,1 Anna-Karin Larsson-Callerfelt,2 Gunilla Westergren-Thorsson,2 Leif Bjermer,1 Ellen Tufvesson1
1Department of Clinical Sciences Lund, Respiratory Medicine, Allergology and Palliative Medicine, Lund University, Lund, Sweden; 2Department of Experimental Medical Science, Lung Biology, Lund University, Lund, Sweden
Correspondence: Ellen Tufvesson, Department of Clinical Sciences Lund, Respiratory Medicine, Allergology and Palliative Medicine, Lund University, BMC, D12, 221 84, Lund, Sweden, Email [email protected]
Background and aim: Cigarette smoking is the most common cause of chronic obstructive pulmonary disease (COPD) but more mechanistic studies are needed. Cigarette smoke extract (CSE) can elicit a strong response in many COPD-related cell types, but no studies have been performed in lung fibroblasts. Therefore, we aimed to investigate the effect of CSE on gene expression in lung fibroblasts from healthy and COPD subjects.
Patients and methods: Primary lung fibroblasts, derived from six healthy and six COPD subjects (all current or ex-smokers), were either unstimulated (baseline) or stimulated with 30% CSE for 4 h prior to RNA isolation. The mRNA expression levels were measured using the NanoString nCounter Human Fibrosis V2 panel (760 genes). Pathway enrichment was assessed for unique gene ontology terms of healthy and COPD.
Results: At baseline, a difference in the expression of 17 genes was found in healthy and COPD subjects. Differential expression of genes after CSE stimulation resulted in significantly less changes in COPD lung fibroblasts (70 genes) than in healthy (207 genes), with 51 genes changed in both. COPD maintained low NOTCH signaling throughout and upregulated JUN > 80%, indicating an increase in apoptosis. Healthy downregulated the Mitogen-activated protein kinase (MAPK) signaling cascade, including a ≥ 50% reduction in FGF2, CRK, TGFBR1 and MEF2A. Healthy also downregulated KAT6A and genes related to cell proliferation, all together indicating possible cell senescence signaling.
Conclusion: Overall, COPD lung fibroblasts responded to CSE stimulation with a very different and deficient expression profile compared to healthy. Highlighting that stimulated healthy cells are not an appropriate substitute for COPD cells which is important when investigating the mechanisms of COPD.
Plain Language Summary: We investigated, for the first time, the effect of cigarette smoke extract (CSE) on gene expression in lung fibroblasts from healthy subjects and subjects with COPD. We found that fibroblasts from subjects with COPD respond very differently than from healthy subjects by changing fewer gene expressions after CSE. Pathway enrichment suggested that fibroblasts from subjects with COPD respond to CSE by affecting genes involved in apoptosis pathways, while fibroblasts from healthy subjects respond by affecting genes involved in cell senescence. This study highlights the importance of assessing stimulated COPD cells in mechanistic studies.
Keywords: COPD, lung fibroblast, gene expression, cigarette smoke extract, GO term, signaling pathways
Introduction
It is well known that cigarette smoking is the most common cause of chronic obstructive pulmonary disease (COPD) yet there is still no treatment available to cure or stop the progression of COPD.1 This is partly due to the poorly investigated mechanisms altered in COPD cells from the smoke/pollutant exposure within the lungs. Lung fibroblasts have been identified as an important part of the remodeling process in COPD,2 particularly in the narrowing of the small airways that is the earliest and most important mechanism for COPD progression.3 Lung fibroblasts have important roles in producing extracellular matrix to form structures and stimulating/amplifying inflammatory signals. Cigarette smoke, that contains more than 4700 chemicals,4 has been shown to induce inflammation in healthy lung fibroblasts.5 Cigarette smoke extract (CSE) is a distilled version of cigarette smoke commonly used as a controlled substance to test the effects of cigarette smoke.6
Previously, we have shown that chemical stressor stimulation resulted in a more disorganized endoplasmic reticulum (ER) and a differential expression pattern of the ER stress pathway in lung fibroblasts from COPD patients compared to healthy subjects.7 As these chemical stressors are found in cigarette smoke, we hypothesized that CSE could also cause differential expression responses in lung fibroblasts from healthy versus COPD subjects. Other research has shown that exposure to CSE increases inflammation,5 and inhibits the proliferation and migration in healthy lung fibroblasts8 CSE has also been shown to induce senescence, increase collagen production, and increase apoptosis and necrosis (at CSE concentrations above 40%) in healthy lung fibroblasts.9–12 Although these studies only investigated a narrow range of variables, CSE clearly affects healthy (or cell line) lung fibroblast cells; however, the effects of CSE on lung fibroblasts from COPD subjects are still poorly understood. A concerning note is that many studies assume that healthy lung fibroblasts will respond to CSE the same way as COPD lung fibroblasts that may present false-positive biomarkers of interest for COPD.
Although several studies have compared large arrays/profiles of gene expression from cells of COPD subjects to control subjects,13–18 no studies were found in regard to the effects of CSE stimulation. A broad and quantitative assessment of lung fibroblast expression should elucidate more accurate mechanisms that differentiate healthy and COPD responses to CSE giving insight into more targetable pathways for treatments. The NanoString nCounter technology provides large-scale panels of transcripts that are individually counted giving a direct quantification of each mRNA instead of an arbitrary relative number and avoiding potential artifacts from RT switching. So far, nCounter has been used to investigate the gene expression in bronchial epithelial cells of healthy and COPD subjects in response to diesel emissions,19 but not in lung fibroblasts nor any lung cell after CSE stimulation.
This study aimed to analyze the gene expression in lung fibroblasts from healthy and COPD subjects (all with a smoking history) after stimulation with CSE. To get a large-scale view of gene expression from CSE stimulation on lung fibroblasts, the NanoString nCounter fibrosis panel was used to count the expression transcripts at baseline and after stimulation with CSE. We hypothesized that COPD lung fibroblasts would respond to the CSE stimulation with an altered gene expression compared to lung fibroblasts from healthy subjects with a smoking history.
Materials and Methods
Subject Characteristics
A total of 12 subjects, including six healthy and six with COPD, were included in the study (Table 1). All subjects were either ex-smokers or current smokers. All COPD subjects were diagnosed by a doctor and most COPD subjects had moderate COPD (GOLD stage 2). Healthy subjects had a non-obstructive spirometry. The median age was similar in the healthy and COPD subjects. None of the subjects had any co-morbidities of relevance for the study. Three of the COPD subjects and none of the healthy subjects were on inhaled corticosteroids. All COPD subjects had radiological signs of emphysema and two of the healthy subjects had discrete signs of emphysema.
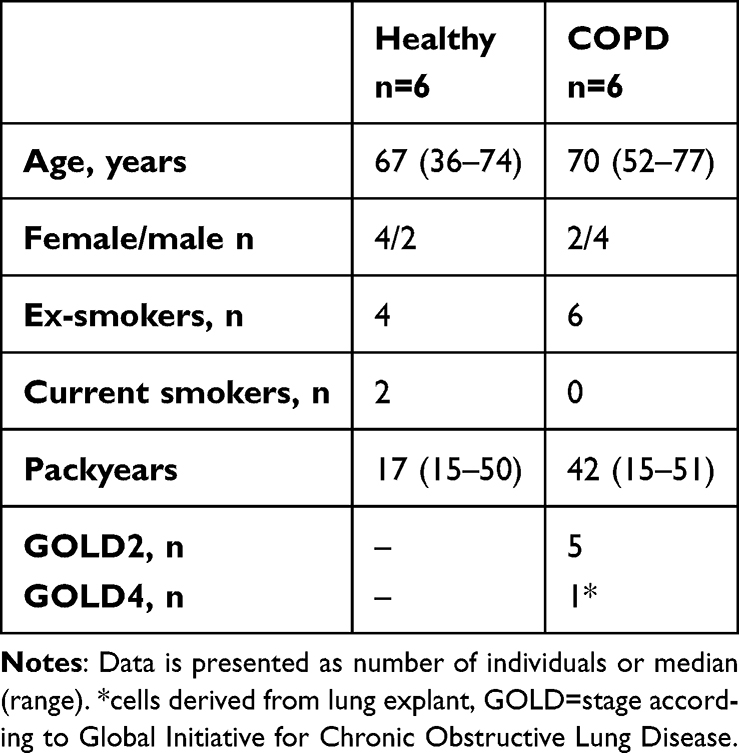 |
Table 1 Subject Characteristics of Lung Fibroblast Samples Used |
All subjects signed written informed consent, and the study was approved by the Regional Ethical Review board in Lund Dnr 2015/891 and in accordance with the Declaration of Helsinki.
Cell Culture of Lung Fibroblasts
Primary lung fibroblasts from both healthy and COPD subjects were derived from lung tissue resected during lobectomies or one lung explant (a COPD subject). When derived from lobectomies (due to lung cancer), the tissue was collected at least 1 cm away from the tumor. They were grown out from biopsies in Dulbecco’s modified Eagle’s medium (DMEM, Sigma-Aldrich, D5671, Irvine, UK) supplemented with 10% fetal clone III serum (Fischer Scientific art nr 1057–0083, USA), 1% L-Glutamine (Life Technologies, 25,030,081, Brazil), 1% amphotericin B (Sigma-Aldrich, A2942, Israel), and 0.5% gentamicin (Sigma-Aldrich, G1272, Israel) as described by Malmström et al.20 Lung fibroblasts were grown to around 80% confluency. The lung fibroblasts were harvested at passage 6–8.
Cigarette Smoke Extract Preparation
A modified version of the protocol used by Kode et al6 was used to prepare the CSE. Research cigarettes from University of Kentucky (purchasing info Center for Tobacco Reference Products, ref 3R4F, University of Kentucky) was bubbled into DMEM using a vacuum. One cigarette per 5 ml of DMEM was smoked for about 3 min. A total of 100 ml CSE was made as a batch. The extract was filtered through a 0.45 μm filter and then 1% amphotericin B and 0.5% gentamicin were added. The CSE was stored at −80°C in small aliquots to avoid freeze-thaw cycles. All experiments were done within two batches of CSE, equally distributed between healthy and COPD subjects.
CSE Stimulation
Cell culture supernatants were investigated for lactate dehydrogenase (LDH) levels as per manufacturer’s instructions using Cytotoxicity Detection KitPLUS (LDH), ref 04744934001 (Roche Diagnostics GmbH Mannheim, Germany), at CSE concentrations of 0%, 5%, 10%, 20%, and 30%, and incubation for 4 and 8 hours (Figure S1). The LDH assay showed a differential response at 30% CSE concentration at 4 hours, which was therefore chosen for the NanoString analysis. Qiagen RNeasy Mini Kit (Qiagen, Ref 74,104, Hilden, Germany) was used to harvest the RNA from the cells. The RNA was then stored at −80°C.
NanoString Analyses of Gene Expression
Gene expression levels in lung fibroblasts from healthy and COPD subjects with or without CSE stimulation were analyzed using NanoString nCounter© Human Fibrosis V2 Panel (Cat # XT-CSO-HFIB2-12), containing 760 genes of interest. In total, 50 ng RNA per panel was used (at a concentration of 25 ng/µl) in the analyses which were performed at NanoString (SpatialOmics, Lund, Sweden). The complimentary nSolver 4.0 software was used for processing the data according to recommended supplied instructions (2021 version). The average (range) optical density of 260/230 nm was 1.44 (0.48–2.01) and 1.62 (0.81–2.09) in samples from healthy and COPD subjects respectively. Despite the recommended optical density of the 260/230 to be between 1.8 and 2.1, all the samples passed the quality control requirements of NanoString. Of the positive control genes provided, all 10x transcription count groups were represented (ie tens, hundreds, thousands of counts etc.) so long as each had a >25% coefficient of variation (or as close as possible). Therefore, the following genes: ACAD9, ARMH3, GUSB, MTMR14, NOL7, PGK1, PPIA, and RPLP0 were used as positive control genes as reference genes to normalize the data to. From the negative controls we determined the lower detection limit to be 23 counts, all counts below this were set (or “thresholded”) to 23. A total of 280 genes reported below this detection limit in more than 50% of all samples and were thereby excluded.
Of the 480 genes with ≥50% subjects above threshold counts, the healthy subjects averaged 468 (baseline) and 463 (after CSE stimulation) genes above the threshold and COPD subjects averaged 464 (baseline) and 463 (after CSE stimulation) genes above threshold, there was no significant difference between healthy and COPD (Figure S2).
Pathway Enrichment
Pathway enrichment analysis was completed using Maayan Lab Enrichr.21–23 All the significant genes that changed in expression levels between baseline and after CSE stimulation, including both up and down regulated, were assessed for biological process gene ontology (GO) terms for the healthy and the COPD groups. Additionally, the genes that occurred in both groups were assessed for GO term overlap and all the genes in the panel that were above the threshold were assessed to identify any GO term bias in the genes included.
Data Presentation and Statistical Analysis
Heatmaps of significantly different/changed gene transcript counts (cut-off: p < 0.05) were generated by NanoString nSolver 4.0 based on the geomean of the transcript counts. The data set of the transcript counts that were subjected to thresholding and normalization was produced by nSolver 4.0 and further analyzed using IBM® SPSS® Statistics version 27.0.0.0 and validated by manual calculations using Excel. The graphs were created using GraphPad Prism 9. Mann-Whitney U test was used for the comparisons between healthy and COPD subjects. Wilcoxon signed rank test was used for the comparison of baseline versus after CSE stimulation within healthy and COPD subjects, where a p-value of <0.05 was considered significant and used for the Venn diagram. Enricher GO terms were considered significant if the adjusted p-value was <0.01.
Results
Gene Expression in Unstimulated Lung Fibroblasts from COPD versus Healthy Subjects
Lung fibroblasts from COPD subjects had lower expression of 16 genes and higher expression of one gene compared to healthy subjects at baseline (Figure 1A). Of these 17 differentially expressed genes, four had more than 30% geomean transcript count difference between healthy and COPD. These included JUN (30% less in COPD, p = 0.016), NOTCH1 (38% less in COPD, p = 0.010), GLI2 (38% less in COPD, p = 0.016), and CXCL8 (83% less in COPD, p = 0.025) (Figure 1B–E).
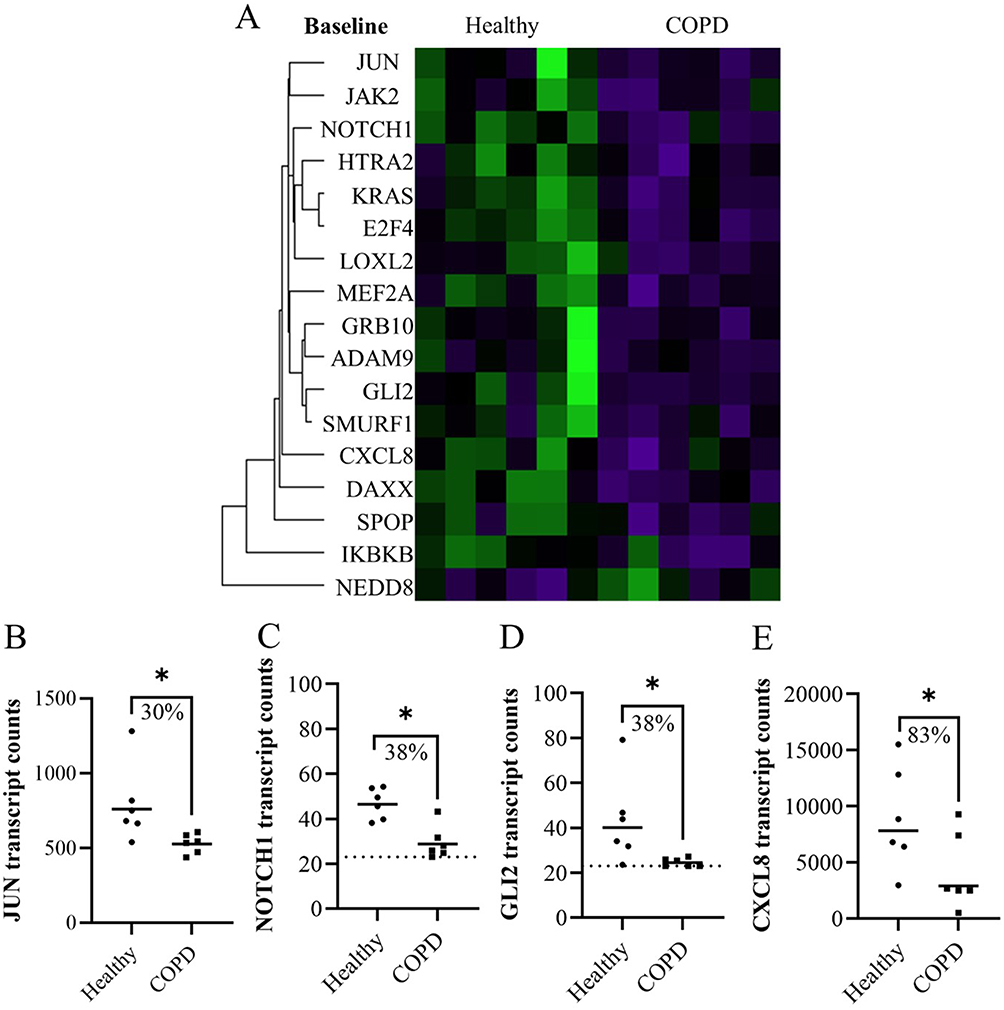 |
Figure 1 The significant differences in expression in fibroblasts from healthy and COPD subjects at baseline represented in (A) a heatmap. (B–E) Plots of genes from the heatmap with more than 30% difference in geomean transcript counts between healthy and COPD at baseline. Dotted line indicates lowest threshold of transcript counts. Statistics: Mann-Whitney U test between healthy and COPD, *p<0.05. |
In a sub-analysis between sexes, DAXX was higher in females compared to males. Since there were more females in the healthy group, the higher DAXX in the healthy subjects could be due to more females in this group. None of the other genes that differed significantly between healthy and COPD subjects showed any difference between females and males.
Gene Expression After CSE Stimulation of Lung Fibroblasts from Healthy and COPD Subjects
Lung fibroblasts from COPD subjects had lower expression of four genes and higher expression of one gene compared to healthy subjects after CSE stimulation (Figure 2A). Of these five differentially expressed genes, one had more than 30% geomean transcript count difference between healthy and COPD. This was PTCH1 (45% less in COPD, p = 0.010) (Figure 2B).
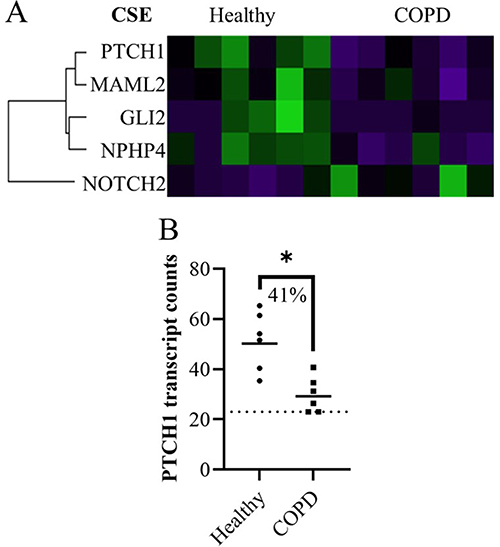 |
Figure 2 The significant differences in expression in fibroblasts from healthy and COPD subjects 4 hours after CSE stimulation represented in (A) a heatmap. (B) Plot of gene from the heatmap with more than 30% difference in geomean transcript counts between healthy and COPD after CSE stimulation. Dotted line indicates lowest threshold of transcript counts. Statistics: Mann-Whitney U test between healthy and COPD, *p<0.05. |
Alteration of Gene Expression in Response to CSE Stimulation
Changes in expression levels between unstimulated (baseline) and after CSE stimulation were found in 207 genes in healthy subjects and 70 genes in COPD subjects (Figure 3A, and see heatmaps in Figure S3 and Figure S4 respectively). There was an overlap of 51 genes that were altered (in the same direction) in both healthy and COPD subjects, of which the expression of one gene was upregulated and 50 genes were downregulated (see heatmap in Figure S5). After removing the genes that changed expression in both groups, healthy lung fibroblasts responded to CSE by upregulating 39 genes and downregulating 117 genes, while COPD lung fibroblasts responded by only upregulating 7 genes and downregulating 12 genes (see Table S1 for all gene lists).
 |
Figure 3 The significant genes that changed expression levels in lung fibroblasts from baseline to after CSE stimulation, first represented as (A) a Venn diagram (relative scale to total number) for the total number of genes in healthy (only), COPD (only) and the overlap that occurred in both. Brackets contain the number of significantly different gene expressions (p<0.05) that increased and decreased for each. (B–F) Plots of genes from the Venn diagram with more than a 50% difference from baseline to CSE stimulation (ie median of paired differences) and less than 25% coefficient of variation (CV) within each timepoint. Statistics: Wilcoxon signed rank test. (G) Other genes with more than 50% difference from baseline to CSE stimulation (ie median of paired differences) but also more than 25% CV. (H) All the absolute percent medians of the paired changes for the 207 healthy and 70 COPD genes (median ± IQR) Statistics: Mann-Whitney U test, *p<0.05, **p<0.01. |
A comparison was made with the genes that were significantly different at baseline to those that also changed in response to CSE stimulation. Of the 17 differentially expressed genes at baseline (Figure 1), 11 of the same genes changed their expression after CSE stimulation (Table S1: ADAM9, JUN, GRB10, CXCL8, DAXX, E2F4, HTRA2, JAK2, KRAS, MEF2A and SMURF1). Only one of these genes altered expression in COPD lung fibroblasts (JUN), one altered expression in both COPD and healthy (GRB10) and the other nine were only altered in healthy lung fibroblasts.
By calculating the individual change for each subject and then the median change per healthy and COPD groups, there were 17 genes (16 in healthy and 1 in COPD) that change by at least 50% from baseline to after CSE stimulation (p = 0.0028 for all). Of these, five genes varied less than 25% coefficient of variation within both baseline and after CSE stimulation (Figure 3B–F). For healthy, these included a downregulation in CRK, FNIP2, MEF2A, and KAT6A. For COPD this included an upregulation of JUN. The other 13 genes with >25% coefficient of variation at either baseline and/or after CSE stimulation are summarized in Figure 3G where bars with negative values represent a downregulation and positive values an upregulation (see Figure S6 for individual plots of the other 13 genes). When investigating the absolute change in gene expression from baseline to after CSE stimulation, the extent of gene expression change was significantly higher in healthy subjects compared to COPD subjects (p = 0.0033, Figure 3H).
Enrichr Gene Ontology of Biological Processes in Response to CSE Stimulation
Enrichr was used to investigate the unique GO terms of biological processes associated with each gene that was significantly altered in response to CSE stimulation. The gene lists for healthy (Figure 4A) and COPD (Figure 4B) groups also included the genes that overlapped in both healthy and COPD. The same analysis was completed for the 51 genes that were altered in both healthy and COPD (Figure S7A) and for all 480 genes above threshold to clarify any gene inclusion bias based on the genes examined in this study (Figure S7B).
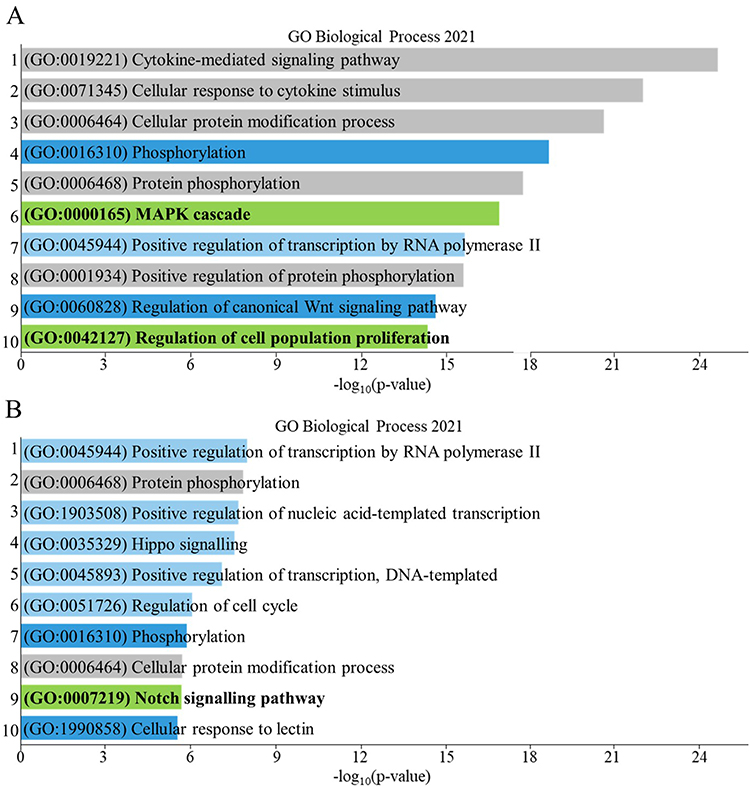 |
Figure 4 Bar graph of the top 10 enriched gene ontology (GO) terms (listed in order) based on the genes that had significant differences in expression of lung fibroblasts from baseline to after CSE stimulation in (A) healthy and (B) COPD, including genes occurring in both healthy and COPD. Dark blue bars indicate an overlap with the top 10 enriched pathways found from genes that occurred specifically in both healthy and COPD (Figure S7A), grey bars indicate an overlap with top 10 enriched pathways found from all the genes assessed that were above background threshold (Figure S7B), light blue bars indicate enriched pathways of COPD that occurred in the healthy at a lower p-value. Green bars indicate the most unique enriched pathways for each. |
To find the most unique GO terms within the top 10 results for only healthy and COPD separately, GO terms that overlapped with the additional analysis in Figure S7 were disregarded. When comparing the top 10 GO terms in all the genes that were altered in healthy or COPD: GO:0019221, GO:0071345, GO:0006464, GO:0006468 and GO:0001934 were disregarded (grey bars) due to gene inclusion bias (defined in Figure S7B) and GO:0016310, GO:0060828 and GO:1990858 were disregarded (dark blue bars) as they occurred also among GO term that were altered in both healthy and COPD (defined in Figure S7A). Of the top 10 GO terms left, Positive regulation of transcription by RNA polymerase II (GO:0045944) occurred in the top 10 of healthy and COPD but due to different genes (see Table S2 for gene lists). Checking further down the p-value list of the healthy, GO:1903508, GO:0035329, GO:0045893 and GO:0051726, which occurred in the top 10 of COPD, also occurred at lower p-values in the healthy and were therefore also disregarded. The MAPK cascade (GO:0000165, p = 4.64e-15) and Regulation of cell population proliferation (GO:0042127, p = 8.76e-13) were considered unique to the healthy lung fibroblasts response to CSE. The Notch signaling pathway (GO:0007219, p = 0.00032) was considered unique to COPD lung fibroblasts response to CSE (green bars of Figure 4).
Clusters of Biological Processes in Response to CSE Stimulation
Using the unique GO terms found in Figure 4 (green bars), similar GO terms with p < 0.01 were identified to create clusters of biological processes. Healthy had two unique clusters, the first was called MAPK cascade and the second was called Cell proliferation (Table 2). The MAPK cascade was made up of four GO terms: MAPK cascade (GO:0000165, p = 4.64e-15), stress-activated MAPK cascade (GO:0051403, p = 0.000065), positive regulation of MAPK cascade (GO:0043410, p = 0.00010) and regulation of MAPK cascade (GO:0043408, p = 0.00063). Healthy significantly downregulated all 39 genes within this cluster, where 33 genes of these occurred in the healthy only group. All MAPK cascade-related GO terms were related to “neutral regulation” or “increased regulation” of the MAPK cascade (Figure 5). The change of transcript counts from baseline to after CSE stimulation was calculated per individual then the median of the changed counts was used to summarize the change per gene. The sum of these medians for the 39 MAPK genes equated to −13 760 less transcripts after CSE stimulation. The Cell proliferation was made up of three GO terms (cell population proliferation (GO:0042127, p = 8.76e-13), positive regulation of cell population proliferation (GO:0008284, p = 2.20e-7) and negative regulation of cell population proliferation (GO:0008285, p = 0.000046)). Healthy significantly downregulated 37 of the 39 genes within this cluster, of which 33 genes occurred in the healthy only group. These GO terms were related to “neutral”, “increased” and “decreased” regulation of cell proliferation. The sum of these medians for the 39 Cell proliferation genes equated to −15 612 less transcripts after CSE stimulation.
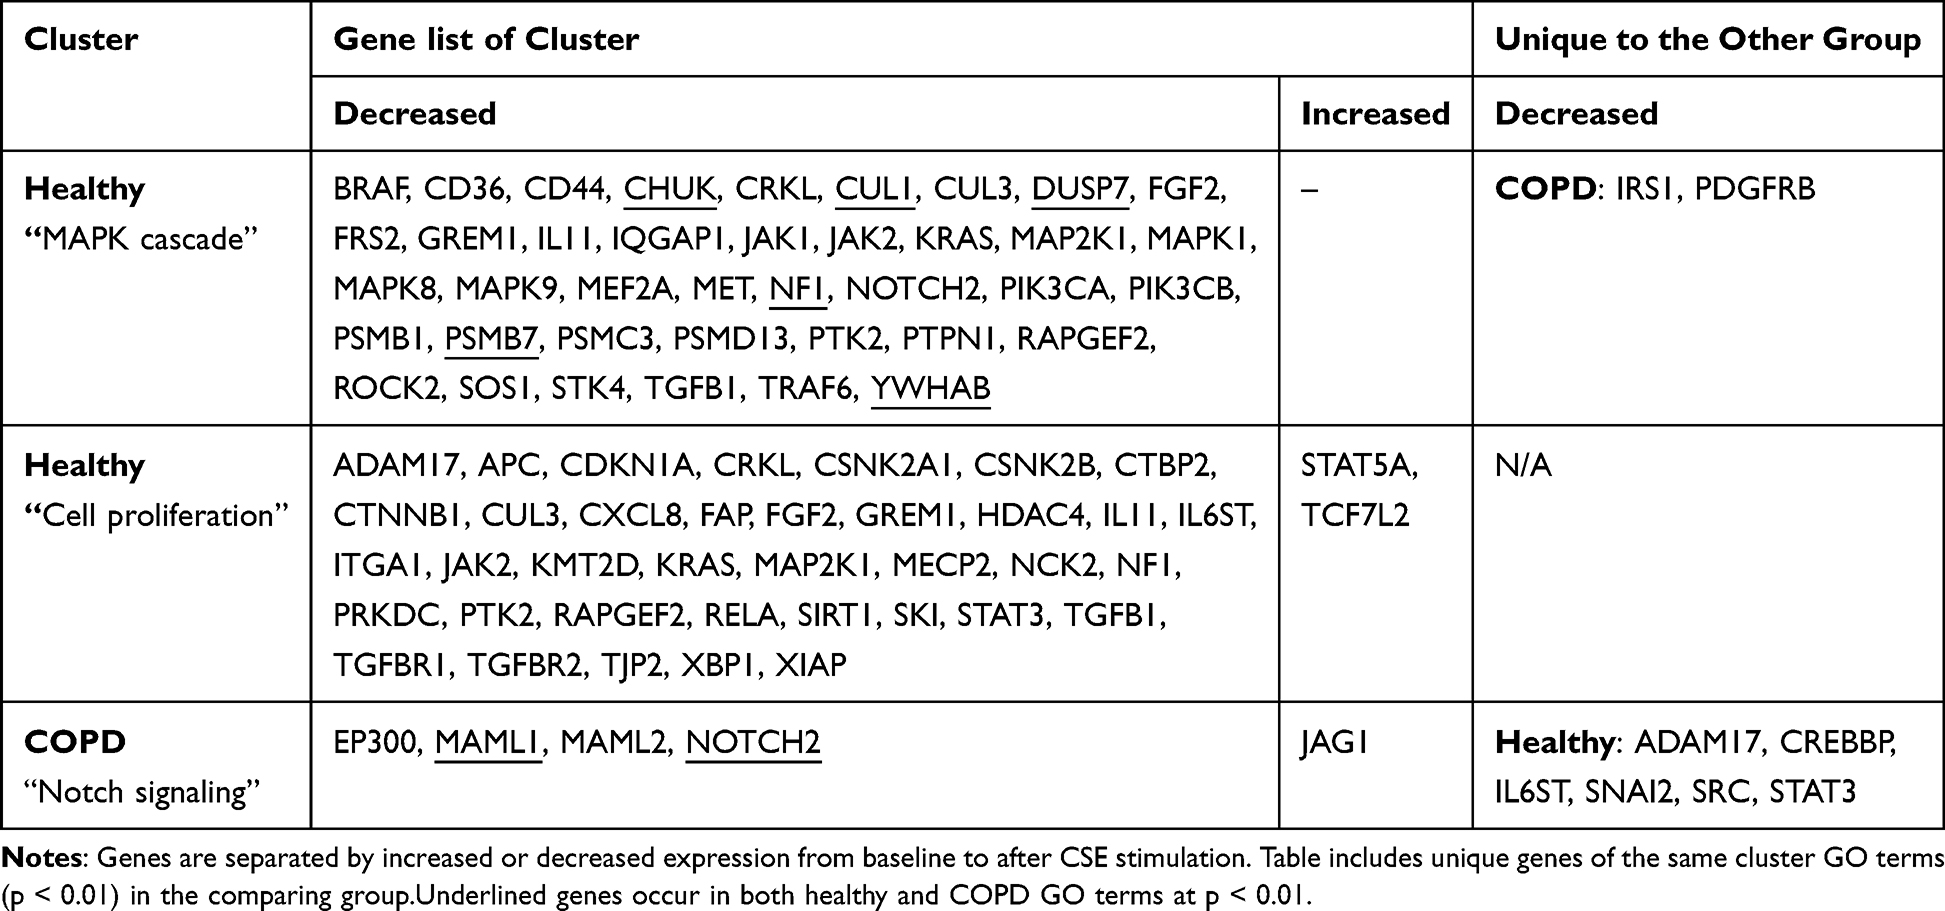 |
Table 2 Lists of Genes That Significantly Changed Expression Levels from Baseline to After CSE Stimulation That Formed the Enrichr Clusters for Healthy and COPD |
 |
Figure 5 Summary of the clusters derived from the Enrichr analysis of biological processes involved based on the genes that had significant differences in expression in fibroblasts from baseline to after CSE stimulation. Each plot contains all the genes that make up each cluster based on the transcript count change from baseline to after CSE stimulation (above zero = upregulated post-CSE, and below zero = downregulated post-CSE), using symbols to denote type of regulation. Note: 3 genes were removed from the Cell proliferation plot as they were noted as both positive and negative regulators. SUM: sum of all the values in the respective graph. |
COPD had one unique cluster called the Notch signaling. The Notch signaling cluster was made up of four GO terms (Notch signaling pathway (GO:0007219, p = 0.00032), positive regulation of Notch signaling pathway (GO:0045747, p = 0.0012), positive regulation of transcription of Notch receptor target (GO:0007221, p = 0.0014), regulation of Notch signaling pathway (GO:0008593, p = 0.0054)). All Notch signaling GO terms were related to neutral regulation or increased regulation of the Notch pathway. COPD significantly downregulated 4 out of 5 genes within this cluster, of which 2 genes occurred in the COPD only group. The sum of these medians for the 5 genes equated to −370 less transcripts after CSE stimulation.
The positions of each of the cluster GO terms were checked within the list of GO terms of p < 0.01 in the other group to see how unique the cluster was as a whole. Within COPD (p < 0.01), the MAPK-related GO terms were listed as number 18 only (data not shown) and consisted of the six overlapping genes and the two genes unique to COPD as shown in Table 2. No GO terms related to cell proliferation in COPD were p < 0.01. Within healthy, Notch-related GO terms were listed by Enricher at much higher p-values than COPD, at number 267 (positive regulation of Notch signaling pathway (GO:0045747), p = 0.00095), 366 (Notch signaling pathway (GO:0007219), p = 0.0027) and 516 on the list (regulation of Notch signaling pathway (GO:0008593), p = 0.0085), with only two genes overlapping with the COPD Notch cluster and six genes unique to the healthy Notch signaling pathway.
Discussion
This study found that COPD lung fibroblasts responded to CSE with significantly less genes and an overall lower transcript count change than healthy. COPD expression changes tended to be enriched for the downregulation of the Notch signaling pathway, while the healthy expression was more enriched for the downregulation of the MAPK and the up and downregulation of cell proliferation pathways.
The expression differences found between healthy and COPD lung fibroblasts do not reflect how COPD fibroblasts will react to stimuli. Other studies investigating only the differences between baseline healthy and COPD lung fibroblasts which can lead to inadequate conclusions that pathways involved are associated with COPD and not healthy.18 Whereas differences found here at baseline reflected that the healthy lung fibroblast responded far more than the COPD. Therefore, it is important to assume that differences in biomarkers at baseline would not reflect targetable markers for COPD therapeutics. In addition, COPD lung fibroblasts should be viewed as a differently responding fibroblast than a healthy (or cell line) lung fibroblast, as seen in this study. Therefore, CSE-stimulation studies completed in healthy (or cell line) lung fibroblasts cannot effectively relate their findings to COPD lung fibroblasts.
Notch and Hedgehog Signaling in the COPD Response
Here, COPD started with less NOTCH1 at baseline than healthy. There were no studies found to investigate NOTCH1 in COPD fibroblasts. Studies with endothelial cells resulted in similar findings, whereby COPD cells expressed less NOTCH1 than healthy controls at baseline.24 NOTCH1 has had some controversial relationships with airway diseases. In general, an increase in NOTCH1 has been associated with increased mucus hypersecretion and goblet-cell metaplasia in COPD airway cells25,26 but an overexpression of NOTCH1 can protect against CSE-induced apoptosis in healthy endothelial cells via the ERK-MAPK signaling pathway.24,27 Interestingly the levels of NOTCH1 do not change in this study after CSE stimulation and this may be due to the slight (but significant) increase in JAG1 in COPD cells that is known to downregulate NOTCH1 expression.28 Therefore, it seems that COPD lung fibroblasts actively keep NOTCH1 signaling downregulated before and after CSE stimulation. CSE stimulation led to a downregulating of the Notch signaling pathway in general, as found by the Enrichr pathway assessment. In this respect, the Notch signaling pathway was also highlighted as a unique pathway in COPD in a large multi-microarray study of blood samples, where NOTCH1, MAML and HATs were similarly downregulated in COPD compared to controls at baseline.13
GLI2 is a Hedgehog transcription factor that bridges the cross-talk between the downstream of Notch and the Hedgehog signaling by binding the promotor of Hes1 in Notch.29 Inhibiting the Notch signaling can reduce GLI2 expression, but the opposite effect does not occur.30,31 Therefore, the low GLI2 seen here in COPD lung fibroblasts could be a follow on from the low NOTCH1. The lower GLI2 expression at baseline is similar to previously reported results in COPD bronchial brushings32 and COPD airway epithelial cells,33 and GLI2 expression remained significantly lower than healthy after CSE stimulation. Less GLI2 has been shown to mitigate the pro-fibrotic phenotype in HOTAIR-expressing fibroblasts (HOTAIR not assessed here).31 Fibrosis-related GLI2 activity has been shown to increase in fibroblasts under hypoxic conditions and this activity could be blocked by an ERK-inhibitor, linking it also to the MAPK signaling pathway (discussed below).34 Indicating the COPD lung fibroblasts analyzed in this study appeared to have a low-fibrotic state and vice versa for the healthy at baseline.
PTCH1 is another gene that could affect the GLI2 expression levels. PTCH1 translates to a transmembrane receptor called Patched-1 that inhibits GLI activation in the absence of the Sonic Hedgehog and vice versa. The PTCH1 gene expression is lower in the COPD than the healthy lung fibroblasts after CSE stimulation but does not seem to change expression levels significantly in a paired manner in response to CSE. To date, no other studies have reported changes in PTCH1 in cells exposed to “smoke” but variants in the PTCH1 gene have been linked to COPD35 and it’s expression has been reported to be higher in COPD bronchial epithelial cells compared to controls.36 In this study, since the COPD fibroblasts finished stimulation with almost undetectable PTCH1, and the same cells started with lower levels of GLI2 and downregulated coactivator MAML2, we hypothesize that the COPD fibroblasts also have low levels of Sonic Hedgehog ligand, giving an overall very low Hedgehog signaling pathway response capability in COPD. Low Hedgehog capability could be related to the high number of significance SNPs found in the Hedgehog pathway of COPD subjects.37
Overall, research in cancer has found that an inhibition of both hedgehog and Notch signaling leads to an increase in apoptosis29 and we believe this is likely the main outcome for these CSE-stimulated COPD lung fibroblasts as well.
MAPK Cascade in Both the COPD and Healthy Response
The MAPK cascade is a well-known inflammatory response to cellular stress. Although several studies have found effects within the MAPK signaling pathway of CSE stimulated lung fibroblasts, all have been on fibroblast cell lines.38–45 Despite this lack of COPD-related findings, targeting the MAPK pathway with therapeutics is expected to have promising results in preventing the progression of COPD.46 In the results presented here, both COPD and healthy fibroblasts tend to respond to CSE with MAPK-related expression.
Studying this pathway carefully using KEGG, it appears that the CSE stimulated COPD fibroblasts upregulated the JNK (ie JUN) sub-pathway. JUN, also known as “c-JUN”, is a subunit of the positive transcription factor AP-1 within the JNK driven MAPK signaling cascade that most commonly leads to apoptosis. Although JUN started at a lower expression in COPD (than healthy) at baseline, the number of transcripts rose by more than 80% in response to CSE stimulation and this increase has previously been shown in peripheral blood mononuclear cells of COPD subjects.47 When Bin et al treated their peripheral blood mononuclear cells from COPD subjects with an anti-inflammatory (Erythromycin), it inhibited the MAPK signaling cascade by downregulating JUN, both their results and the results presented here suggest JUN as a potential therapeutic target for COPD.47
In contrast, healthy fibroblasts in this study downregulated both the ERK (via growth factor, ie FGF2, particularly effecting RAPGEF2 expression) and p38 (via IL1, ie IL1R, and TGFB, ie TGFBR – possibly due to the FNIP1 downregulation, see FNIP1 discussion below, particular effecting MEF2A expression also discussed below) pathways. Downregulating these signaling pathways leads to decreased cell proliferation, differentiation, and apoptosis. The aforementioned fibroblast cell line studies also found changes in the ERK- and p38-MAPK but not the JNK-MAPK pathways. CSE increased collagen production via the ERK-MAPK,41 induced senescence via p38-MAPK45 or induced apoptosis via the p38-MAPK39,42,44 signaling pathways. CSE-induced apoptosis in lung fibroblasts can be attenuated by inhibiting the ERK pathway (blocking the Fas-related apoptosis)44 or treating with an EP agonist (PGE2) to upregulate the ERK sub-pathway (via the PKA).39 Whereby, reducing both ERK-proliferation and p38-apoptosis processes is a common sign of cell senescence.48,49
Senescence in the Healthy Response
Although most of the genes belonging to the cell proliferation cluster were downregulated in healthy in response to CSE stimulation, there was a mix of both positive and negative regulation of cell proliferation. This mix in signaling and general dampening of this process is reminiscent of cell senescence. In particular, the downregulation of genes related to growth factor signaling and cell cycle progression make up some of the key senescence -associated signatures.50 Enrichr found 18 significant GO terms related to “growth signaling” and 13 significant GO terms related to “cell cycle” in the healthy response in comparison to 0 and 1 GO term in COPD, respectively. Suggesting that lung fibroblasts from healthy subjects with a smoking background respond to CSE stimulation by inducing a state of senescence. This finding is supported by Nyunoya et al, who eloquently showed that Normal human diploid lung fibroblasts, HFL-1 exposed to CSE once entered a state of lung injury repair while exposure to CSE multiple times induced irreversible senescence which seems to reflect what was seen in healthy here.10 However, the COPD lung fibroblasts response to CSE stimulation no longer included a senescent response. Even though this seems contradictive to the many studies that have shown COPD lung fibroblasts (and other cells) have an increased senescent state when compared to matched healthy cells,51 there have not been any studies on senescence in CSE-stimulated COPD cells – highlighting how current senescence targets may not be useful in current-smoker COPD patients.
Within the one significant GO term related to Cell senescence (GO:0090398) found only in healthy, the unique gene that distinguished it was KAT6A. KAT6A regulated gene expression using histone and non-histone substrates. Because of its role in regulating the expression of key protooncogenes, KAT6A is mostly regarded as a target for cancer but it’s presence in lung cancer is growing.52 Although KAT6A has not been studied in the context of COPD or “smoke” yet, recent research does show that KAT6A inhibition induced senescence in mouse embryo fibroblasts.10 As this gene was significantly downregulated in healthy lung fibroblasts after CSE stimulation, this also supports the hypothesis that these healthy fibroblasts were responding with a senescent phenotype.
CXCL8 in the Healthy Response
Levels of CXCL8 (also known as IL-8) was found to be higher in healthy lung fibroblasts, compared to COPD, at baseline but decreased by >80% after CSE stimulation. Two key studies reported baseline levels of CXCL8 in healthy compared to COPD lung cells, one study found no difference between CXCL8 expression/protein levels in COPD and healthy lung fibroblasts,53 while the other found very similar results as seen here, with healthy alveolar macrophages expressing approximately 81% more CXCL8 than COPD.54 The decrease in expression after CSE stimulation was not expected as several reports found CXCL8 increases after CSE stimulation in healthy lung fibroblasts55,56 and other lung cells.53,57 One study found that CSE stimulated increased CXCL8 in COPD lung fibroblasts, to a higher level than the healthy.55 This contradictory finding may be due to methodology differences in CSE stimulation as Li et al clearly shows that the percentage and time of CSE exposure significantly alters the CXCL8 levels, whereby, peak CXCL8 protein release was in 10–30% CSE when stimulated for 24 hours (with almost no CXCL8 at 40–50%) and within 16–24 hours when stimulating with 20% CSE (with very low levels at 4–8 hours).58 That is, the use of 30% CSE should have resulted in peak levels of CXCL8 if the stimulation was run for approximately 5–12 hours longer. Based on the similar results presented by,54 they also suggest that the CXCL8 produced by healthy cells is dependent on the p38-MAPK and ERK-MAPK signaling pathways. Since these healthy fibroblasts reduced both these signaling pathways, the reduction in CXCL8 in these healthy lung fibroblasts may also be MAPK-dependent. Overall, though the direction of regulation differs from previously reported, results here indicate that CXCL8 is an important factor in a cells response to CSE, the healthy cells tended to incorporate the changing of CXCL8 levels into their response significantly more than the COPD cells.
FNIP1 and MEF2A in the Healthy Response
Here, the healthy lung fibroblasts responded to CSE stimulation by reducing the expression of FNIP1. FNIP forms a complex with FCLN to regulate the mTOR signaling pathway that controls the cell metabolic processes. There have been no studies reported on FNIP1 expression in COPD, fibroblast cells nor with “smoke”, however, there is a functional loss of FNIP1 in Birt-Hogg-Dubé syndrome which has predisposition to lung cysts.59 In general, loss of the FCLN/FNIP complex leads to downregulation of the TGFB-related pathways.60 This coincides with the downregulation of TBFBR also seen in the healthy lung fibroblasts here.
There were no studies found on the expression of MEF2A and COPD or “smoke”, however, this gene was significantly higher in healthy lung fibroblasts at baseline (compared to COPD) and then significantly downregulated in healthy only after CSE stimulation in this study. MEF2A is also related to the p38-MAPK signaling pathway, interacting with HDAC5 to induce TGFB-related fibrosis.61,62 This also coincides with the downregulation of TBFBR also seen in the healthy lung fibroblasts here.
Therefore, the healthy downregulation of FNIP1 may be why there is a downstream downregulation of the MEF-related p38-MAPK pathway in healthy, that is likely closely related to TGFβ signaling.
CRK in the Healthy Response
The downregulation of CRK after CSE stimulation seen in healthy only enhances the hypothesis that the healthy response is to reduce MAPK signaling.63 CRK has not been reported in COPD or “smoke” studies previously, but it has been found in several fibroblast studies (not lung fibroblasts). Inhibition of CRK in fibroblasts reduces cell proliferation, reduced cell motility, and formation of adherens junctions, ie less CRK results in less fibroblast growth.64
Methodology and Limitations
Compared to other multiplex transcription reading studies in COPD and control cells, our NanoString analysis found difference in 3.5% of genes above background at baseline (unfortunately no studies completed these analyses on CSE stimulated cells), while multi-microarray analysis found 20% of genes differed in blood13 and serial analysis of gene expression (SAGE) found 1% of genes differed in lung tissue cells.14
The limitations of this study include: a relatively small study population is investigated, but both males and females were included, as well as former and current smokers, but no specific result pattern could be found based on these characteristics. Due to the small study population the generalizability of the study is limited, therefore, we focused on pathways that were highly enriched. Furthermore, the fibroblasts were taken from a smoking (or ex-smoking) pathological environment, then cultured in a healthy environment before introducing the CSE, thereby not replicating a direct CSE stimulation of the lung environment in healthy or COPD. Though we do not believe that this disregards the differences we found between healthy and COPD response to CSE stimulation. Additionally, some of the expression levels of the genes assessed here would peak at other time points that should be assessed separately to gather an appropriate response profile. Future studies should include functional assays for validation of the pathways highlighted in these results, such as a kinase activity assay. Lastly, without the full cellular spectrum responding to the CSE alongside the lung fibroblasts, some signals may reflect a secondary response to the lack of other cell types responding to initial signals.
Conclusion
COPD lung fibroblasts began with a differential expression pattern to healthy controls, leading to different responses to stimulation. COPD fibroblasts consistently maintained low signaling from Notch and Hedgehog pathways and increased JNK-MAPK signaling that are all linked to increased apoptosis. Meanwhile, healthy lung fibroblasts downregulated both cell proliferation and apoptosis signaling, indicating the induction of cell senescence. These differential responses should be taken into careful consideration when designing mechanistic studies.
Abbreviations
CSE, cigarette smoke extract; COPD, chronic obstructive pulmonary disease, GO, gene ontology; MAPK, Mitogen-activated protein kinase.
Data availability Statement
Data will be available upon request to the corresponding author.
Acknowledgments
We would like to thank Lena Thiman at Lund University for lung fibroblasts culturing.
Disclosure of Interest
The authors report that there are no competing interests to declare.
Funding
This work was supported by independent research grants from the Swedish Heart-Lung Foundation (20220322).
References
1. Choi JY, Rhee CK. Diagnosis and treatment of early Chronic Obstructive Lung Disease (COPD). J Clin Med. 2020;9(11):3426. doi:10.3390/jcm9113426
2. Osei ET, Hackett T-L. Epithelial-mesenchymal crosstalk in COPD: an update from in vitro model studies. Int J Biochem Cell Biol. 2020;125:105775. doi:doi:10.1016/j.biocel.2020.105775
3. Hogg JC, Paré PD, Hackett T-L. The contribution of small airway obstruction to the pathogenesis of chronic obstructive pulmonary disease. Physiol Rev. 2017;97(2):529–552. doi:10.1152/physrev.00025.2015
4. Rodgman A, Perfetti TA. The Chemical Components of Tobacco and Tobacco Smoke.
5. Martey CA, Pollock SJ, Turner CK, et al. Cigarette smoke induces cyclooxygenase-2 and microsomal prostaglandin E2 synthase in human lung fibroblasts: implications for lung inflammation and cancer. Am J Physiol Lung Cell Mol Physiol. 2004;287(5):L981–91. doi:10.1152/ajplung.00239.2003
6. Kode A, Rajendrasozhan S, Caito S, Yang SR, Megson IL, Rahman I. Resveratrol induces glutathione synthesis by activation of Nrf2 and protects against cigarette smoke-mediated oxidative stress in human lung epithelial cells. Am J Physiol Lung Cell Mol Physiol. 2008;294(3):L478–88. doi:10.1152/ajplung.00361.2007
7. Weidner J, Jarenbäck L, Åberg I, et al. Endoplasmic reticulum, Golgi, and lysosomes are disorganized in lung fibroblasts from chronic obstructive pulmonary disease patients. Physiol Rep. 2018;6(5):e13584. doi:10.14814/phy2.13584
8. Miglino N, Roth M, Lardinois D, Sadowski C, Tamm M, Borger P. Cigarette smoke inhibits lung fibroblast proliferation by translational mechanisms. Eur Respir J. 2012;39(3):705–711. doi:10.1183/09031936.00174310
9. Milara J, Serrano A, Peiró T, et al. Aclidinium inhibits cigarette smoke-induced lung fibroblast-to-myofibroblast transition. Euro Respirat J. 2013;41(6):1264–1274. doi:10.1183/09031936.00017712
10. Nyunoya T, Monick MM, Klingelhutz A, Yarovinsky TO, Cagley JR, Hunninghake GW. Cigarette smoke induces cellular senescence. Am J Respir Cell Mol Biol. 2006;35(6):681–688. doi:10.1165/rcmb.2006-0169OC
11. Son ES, Kyung SY, Lee SP, et al. Role of protein kinase C-η in cigarette smoke extract-induced apoptosis in MRC-5-cells. Hum Exp Toxicol. 2015;34(9):869–877. doi:10.1177/0960327114561343
12. Ishii T, Matsuse T, Igarashi H, Masuda M, Teramoto S, Ouchi Y. Tobacco smoke reduces viability in human lung fibroblasts: protective effect of glutathione S-transferase P1. Am J Physiol Lung Cell Mol Physiol. 2001;280(6):L1189–95. doi:10.1152/ajplung.2001.280.6.L1189
13. Rogers LRK, Verlinde M, Mias GI, Gaggar A. Gene expression microarray public dataset reanalysis in chronic obstructive pulmonary disease. PLoS One. 2019;14(11):e0224750. doi:10.1371/journal.pone.0224750
14. Ning W, Li CJ, Kaminski N, et al. Comprehensive gene expression profiles reveal pathways related to the pathogenesis of chronic obstructive pulmonary disease. Proc Natl Acad Sci U S A. 2004;101(41):14895–14900. doi:10.1073/pnas.0401168101
15. Yun JH, Morrow J, Owen CA, et al. Transcriptomic analysis of lung tissue from cigarette smoke-induced emphysema murine models and human chronic obstructive pulmonary disease show shared and distinct pathways. Am J Respir Cell Mol Biol. 2017;57(1):47–58. doi:10.1165/rcmb.2016-0328OC
16. Yoo S, Takikawa S, Geraghty P, et al. Integrative analysis of DNA methylation and gene expression data identifies EPAS1 as a key regulator of COPD. PLoS Genet. 2015;11(1):e1004898. doi:10.1371/journal.pgen.1004898
17. Vucic EA, Chari R, Thu KL, et al. DNA methylation is globally disrupted and associated with expression changes in chronic obstructive pulmonary disease small airways. Am J Respir Cell Mol Biol. 2014;50(5):912–922. doi:10.1165/rcmb.2013-0304OC
18. Bekker NJ, Pijkeren A, Wolters JC, et al. A proteomics approach to identify COPD-related changes in lung fibroblasts. Am J Physiol Lung Cell Mole Physiol. 2023;324(4):L521–L535. doi:10.1152/ajplung.00105.2022
19. Vaughan A, Stevanovic S, Jafari M, et al. The effect of diesel emission exposure on primary human bronchial epithelial cells from a COPD cohort: n-acetylcysteine as a potential protective intervention. Environ Res. 2019;170:194–202. doi:10.1016/j.envres.2018.12.035
20. Malmström J, Larsen K, Hansson L, et al. Proteoglycan and proteome profiling of central human pulmonary fibrotic tissue utilizing miniaturized sample preparation: a feasibility study. Proteomics. 2002;2(4):394–404. doi:10.1002/1615-9861(200204)2:4<394::AID-PROT394>3.0.CO;2-6
21. Chen EY, Tan CM, Kou Y, et al. Enrichr: interactive and collaborative HTML5 gene list enrichment analysis tool. BMC Bioinformat. 2013;14(1):128. doi:10.1186/1471-2105-14-128
22. Kuleshov MV, Jones MR, Rouillard AD, et al. Enrichr: a comprehensive gene set enrichment analysis web server 2016 update. Nucleic Acids Res. 2016;44(W1):W90–W97. doi:10.1093/nar/gkw377
23. Xie Z, Bailey A, Kuleshov MV, et al. Gene set knowledge discovery with enrichr. Current Protocol. 2021;1(3):e90. doi:10.1002/cpz1.90
24. Zong D, Li J, Cai S, et al. Notch1 regulates endothelial apoptosis via the ERK pathway in chronic obstructive pulmonary disease. Am J Physiol Cell Physiol. 2018;315(3):C330–C340. doi:10.1152/ajpcell.00182.2017
25. Zong D, Ouyang R, Li J, Chen Y, Chen P. Notch signaling in lung diseases: focus on Notch1 and Notch3. Ther Adv Respir Dis. 2016;10(5):468–484. doi:10.1177/1753465816654873
26. Bodas M, Subramaniyan B, Karmouty-Quintana H, Vitiello PF, Walters MS. The emerging role of NOTCH3 receptor signalling in human lung diseases. Expert Rev Mol Med. 2022;
27. Zong DD, Liu XM, Li JH, et al. Resveratrol attenuates cigarette smoke induced endothelial apoptosis by activating Notch1 signaling mediated autophagy. Respir Res. 2021;22(1):22. doi:10.1186/s12931-021-01620-3
28. Benedito R, Roca C, Sörensen I, et al. The notch ligands Dll4 and Jagged1 have opposing effects on angiogenesis. Cell. 2009;137(6):1124–1135. doi:10.1016/j.cell.2009.03.025
29. Kumar V, Vashishta M, Kong L, et al. The role of notch, hedgehog, and wnt signaling pathways in the resistance of tumors to anticancer therapies Review. Front Cell Develop Biol. 2021;2021:9. doi:10.3389/fcell.2021.650772
30. Ringuette R, Atkins M, Lagali PS, et al. A Notch-Gli2 axis sustains Hedgehog responsiveness of neural progenitors and Müller glia. Dev. Biol. 2016;411(1):85–100. doi:doi:10.1016/j.ydbio.2016.01.006
31. Wasson CW, Ross RL, Wells R, et al. Long non-coding RNA HOTAIR induces GLI2 expression through Notch signalling in systemic sclerosis dermal fibroblasts. Arth Res Ther. 2020;22(1):286. doi:10.1186/s13075-020-02376-9
32. Ancel J, Belgacemi R, Perotin J-M, et al. Sonic hedgehog signalling as a potential endobronchial biomarker in COPD. Respir Res. 2020;21(1):207. doi:10.1186/s12931-020-01478-x
33. Belgacemi R, Luczka E, Ancel J, et al. Airway epithelial cell differentiation relies on deficient Hedgehog signalling in COPD. EBioMedicine. 2020;51:102572. doi:doi:10.1016/j.ebiom.2019.11.033
34. Cheng Y, Lin CH, Chen JY, Li CH, Liu YT, Chen BC. Induction of connective tissue growth factor expression by hypoxia in human lung fibroblasts via the MEKK1/MEK1/ERK1/GLI-1/GLI-2 and AP-1 pathways. PLoS One. 2016;11(8):e0160593. doi:10.1371/journal.pone.0160593
35. Kang X, Guo T, Liu L, Ding SZ, Lei C, Luo H. Association between PTCH1 gene polymorphisms and chronic obstructive pulmonary disease susceptibility in a Chinese Han population: a case-control study. Chin Med J. 2020;133(17):2071–2077. doi:10.1097/cm9.0000000000000858
36. Tam A, Hughes M, McNagny KM, et al. Hedgehog signaling in the airway epithelium of patients with chronic obstructive pulmonary disease. Sci Rep. 2019;9(1):3353. doi:10.1038/s41598-019-40045-3
37. Lahmar Z, Ahmed E, Fort A, Vachier I, Bourdin A, Bergougnoux A. Hedgehog pathway and its inhibitors in chronic obstructive pulmonary disease (COPD). Pharmacol Ther. 2022;240:108295. doi:10.1016/j.pharmthera.2022.108295
38. Zhu L, Xu F, Kang X, et al. The antioxidant N-acetylcysteine promotes immune response and inhibits epithelial-mesenchymal transition to alleviate pulmonary fibrosis in chronic obstructive pulmonary disease by suppressing the VWF/p38 MAPK axis. Mol Med. 2021;27(1):97. doi:10.1186/s10020-021-00342-y
39. Sugiura H, Liu X, Togo S, et al. Prostaglandin E(2) protects human lung fibroblasts from cigarette smoke extract-induced apoptosis via EP(2) receptor activation. J Cell Physiol. 2007;210(1):99–110. doi:10.1002/jcp.20825
40. Wang M, Chen X, Jin W, Xu X, Li X, Sun L. Ginsenoside Rb3 exerts protective properties against cigarette smoke extract-induced cell injury by inhibiting the p38 MAPK/NF-κB and TGF-β1/VEGF pathways in fibroblasts and epithelial cells. Biomed Pharmacother. 2018;108:1751–1758. doi:doi:10.1016/j.biopha.2018.10.018
41. Sun C, Zhu M, Yang Z, et al. LL-37 secreted by epithelium promotes fibroblast collagen production: a potential mechanism of small airway remodeling in chronic obstructive pulmonary disease. Lab Invest. 2014;94(9):991–1002. doi:doi:10.1038/labinvest.2014.86
42. Kim S-Y, Lee J-H, Huh JW, et al. Cigarette smoke induces akt protein degradation by the ubiquitin-proteasome system*. J Biol Chem. 2011;286(37):31932–31943. doi:doi:10.1074/jbc.M111.267633
43. Volpi G, Facchinetti F, Moretto N, Civelli M, Patacchini R. Cigarette smoke and α,β-unsaturated aldehydes elicit VEGF release through the p38 MAPK pathway in human airway smooth muscle cells and lung fibroblasts. Br. J. Pharmacol. 2011;163(3):649–661. doi:10.1111/j.1476-5381.2011.01253.x
44. Park J-W, Yoon JY, Kim YJ, et al. Extracellular signal-regulated kinase (ERK) inhibition attenuates cigarette smoke extract (CSE) induced-death inducing signaling complex (DISC) formation in human lung fibroblasts (MRC-5) cells. J Toxicol Sci. 2010;35(1):33–39. doi:10.2131/jts.35.33
45. Kanaji N, Basma H, Nelson A, et al. Fibroblasts that resist cigarette smoke-induced senescence acquire profibrotic phenotypes. Am J Physiol Lung Cell Mole Physiol. 2014;307(5):L364–L373. doi:10.1152/ajplung.00041.2014
46. Wang C, Zhou J, Wang J, et al. Progress in the mechanism and targeted drug therapy for COPD. Signal Transduct Target Ther. 2020;5(1):248. doi:10.1038/s41392-020-00345-x
47. Bin YF, Ma N, Lu YX, et al. Erythromycin reverses cigarette smoke extract-induced corticosteroid insensitivity by inhibition of the JNK/c-Jun pathway. Free Radic Biol Med. 2020;152:494–503. doi:10.1016/j.freeradbiomed.2019.11.020
48. Chaturvedi V, Qin J-Z, Denning MF, Choubey D, Diaz MO, Nickoloff BJ. Apoptosis in proliferating, senescent, and immortalized keratinocytes*. J Biol Chem. 1999;274(33):23358–23367. doi:doi:10.1074/jbc.274.33.23358
49. Bennett MR, Macdonald K, Chan S-W, Boyle JJ, Weissberg PL. Cooperative Interactions Between RB and p53 regulate cell proliferation, cell senescence, and apoptosis in human vascular smooth muscle cells from atherosclerotic plaques. Circul Res. 1998;82(6):704–712. doi:10.1161/01.RES.82.6.704
50. Roger L, Tomas F, Gire V. Mechanisms and Regulation of Cellular Senescence. Int J Mol Sci. 2021;22(23):13173. doi:10.3390/ijms222313173
51. Barnes PJ. Small airway fibrosis in COPD. Int J Biochem Cell Biol. 2019;116:105598. doi:doi:10.1016/j.biocel.2019.105598
52. Aleksandra P, Aleksandra P, Konrad P, et al. The expression of histone acetyltransferase KAT6A in non-small cell lung cancer. Anticancer Res. 2022;42(12):5731. doi:10.21873/anticanres.16080
53. Osei ET, Noordhoek JA, Hackett TL, et al. Interleukin-1α drives the dysfunctional cross-talk of the airway epithelium and lung fibroblasts in COPD. Euro Respirat J. 2016;48(2):359–369. doi:10.1183/13993003.01911-2015
54. Moretto N, Facchinetti F, Southworth T, Civelli M, Singh D, Patacchini R. alpha, beta-Unsaturated aldehydes contained in cigarette smoke elicit IL-8 release in pulmonary cells through mitogen-activated protein kinases. Am J Physiol Lung Cell Mol Physiol. 2009;296(5):L839–L848. doi:10.1152/ajplung.90570.2008
55. Krimmer DI, Burgess JK, Wooi TK, Black JL, Oliver BGG. Matrix proteins from smoke-exposed fibroblasts are pro-proliferative. Am J Respir Cell Mol Biol. 2012;46(1):34–39. doi:10.1165/rcmb.2010-0426OC
56. Murata K, Fujita N, Takahashi R. Ninjinyoeito ameliorated cigarette smoke extract-induced apoptosis and inflammation through JNK signaling inhibition in human lung fibroblasts. BMC Compl Med Ther. 2022;22(1):96. doi:10.1186/s12906-022-03574-5
57. Zhan Y, Chen J, Wu J, et al. Human epididymis protein 4 aggravates airway inflammation and remodeling in chronic obstructive pulmonary disease. Respir Res. 2022;23(1):120. doi:10.1186/s12931-022-02040-7
58. Li CJ, Ning W, Matthay MA, Feghali-Bostwick CA, Choi AM. MAPK pathway mediates EGR-1-HSP70-dependent cigarette smoke-induced chemokine production. Am J Physiol Lung Cell Mol Physiol. 2007;292(5):L1297–L1303. doi:10.1152/ajplung.00194.2006
59. Hasumi H, Baba M, Hasumi Y, Furuya M, Yao M. Birt-Hogg-Dubé syndrome: clinical and molecular aspects of recently identified kidney cancer syndrome. Int J Urol. 2016;23(3):204–210. doi:10.1111/iju.13015
60. Ramirez Reyes JMJ, Cuesta R, Pause A. Folliculin: a regulator of transcription through AMPK and mTOR signaling pathways. Front Cell Dev Biol. 2021;9:667311. doi:10.3389/fcell.2021.667311
61. Gao Y, Liu Y, Zheng D, et al. HDAC5-mediated Smad7 silencing through MEF2A is critical for fibroblast activation and hypertrophic scar formation. Int J Biol Sci. 2022;18(15):5724–5739. doi:10.7150/ijbs.76140
62. Yeo Y, Yi ES, Kim JM, et al. FGF12 (Fibroblast Growth Factor 12) inhibits vascular smooth muscle cell remodeling in pulmonary arterial hypertension. Hypertension. 2020;76(6):1778–1786. doi:10.1161/hypertensionaha.120.15068
63. Chakraborty C, Sharma AR, Patra BC, Bhattacharya M, Sharma G, Lee SS. MicroRNAs mediated regulation of MAPK signaling pathways in chronic myeloid leukemia. Oncotarget. 2016;7(27):42683–42697. doi:10.18632/oncotarget.7977
64. Park T, Koptyra M, Curran T. Fibroblast growth requires CT10 regulator of kinase (Crk) and Crk-like (CrkL). J Biol Chem. 2016;291(51):26273–26290. doi:10.1074/jbc.M116.764613
 © 2023 The Author(s). This work is published and licensed by Dove Medical Press Limited. The
full terms of this license are available at https://www.dovepress.com/terms
and incorporate the Creative Commons Attribution
- Non Commercial (unported, 3.0) License.
By accessing the work you hereby accept the Terms. Non-commercial uses of the work are permitted
without any further permission from Dove Medical Press Limited, provided the work is properly
attributed. For permission for commercial use of this work, please see paragraphs 4.2 and 5 of our Terms.
© 2023 The Author(s). This work is published and licensed by Dove Medical Press Limited. The
full terms of this license are available at https://www.dovepress.com/terms
and incorporate the Creative Commons Attribution
- Non Commercial (unported, 3.0) License.
By accessing the work you hereby accept the Terms. Non-commercial uses of the work are permitted
without any further permission from Dove Medical Press Limited, provided the work is properly
attributed. For permission for commercial use of this work, please see paragraphs 4.2 and 5 of our Terms.
Recommended articles
Severity of Lung Function Impairment Drives Transcriptional Phenotypes of COPD and Relates to Immune and Metabolic Processes
Negewo NA, Gibson PG, Simpson JL, McDonald VM, Baines KJ
International Journal of Chronic Obstructive Pulmonary Disease 2023, 18:273-287
Published Date: 14 March 2023
LncRNA RP11-521C20.3 Inhibits Cigarette Smoke Extract-Induced Apoptosis in A549 Cells by Targeting BMF Signaling
Zhong Y, Li C, Xiang Y, Zhou J, Zhang J
International Journal of Chronic Obstructive Pulmonary Disease 2023, 18:669-682
Published Date: 21 April 2023
The Mechanisms of Resistin-Like Molecule-β-Mediated Airway Inflammation in Chronic Obstructive Pulmonary Disease via Autophagy
Che L, Xie Z, Chen G, Zhang W, Xia T, Lin J, Luo W, Chen L, Yin W, Cai X, Liu S
Journal of Inflammation Research 2023, 16:3853-3870
Published Date: 31 August 2023