Back to Journals » Blood and Lymphatic Cancer: Targets and Therapy » Volume 15
Serum ATIC Expression as a Novel Diagnostic and Prognostic Biomarker in Multiple Myeloma Patients
Authors Gu M, Zheng Y, Wang Y ![]() , Wang Q
, Wang Q ![]() , Wu J, Xiong Z, Nong Y
, Wu J, Xiong Z, Nong Y ![]() , Huang C, Li Z, Luo J, Ling Z
, Huang C, Li Z, Luo J, Ling Z ![]() , Li R
, Li R ![]()
Received 31 May 2025
Accepted for publication 26 August 2025
Published 30 August 2025 Volume 2025:15 Pages 133—147
DOI https://doi.org/10.2147/BLCTT.S537524
Checked for plagiarism Yes
Review by Single anonymous peer review
Peer reviewer comments 2
Editor who approved publication: Dr Wilson Gonsalves
Mengyuan Gu,1,* Yanting Zheng,1,* Yifan Wang,1,* Qicai Wang,1 Jing Wu,2 Zengyi Xiong,1 Yanyu Nong,1 Chunni Huang,1 Zhongqing Li,3 Jun Luo,3 Zhian Ling,4 Ruolin Li2
1Department of Clinical Laboratory, The First Affiliated Hospital of Guangxi Medical University, Key Laboratory of Clinical Laboratory Medicine of Guangxi Department of Education, Nanning, Guangxi, 530021, People’s Republic of China; 2Department of Scientific Research, The First Affiliated Hospital of Guangxi Medical University, Nanning, Guangxi, People’s Republic of China; 3Department of Hematology, The First Affiliated Hospital of Guangxi Medical University, Nanning, Guangxi, People’s Republic of China; 4Department of Emergency, The Second Affiliated Hospital of Guangxi Medical University, Nanning, Guangxi, People’s Republic of China
*These authors contributed equally to this work
Correspondence: Ruolin Li, Department of Scientific Research, First Affiliated Hospital of Guangxi Medical University, Nanning, Guangxi, People’s Republic of China, Email [email protected] Zhian Ling, Department of Emergency, Second Affiliated Hospital of Guangxi Medical University, Nanning, Guangxi, People’s Republic of China, Email [email protected]
Purpose: The study was constructed for investigating the serum expression levels of ATIC with multiple myeloma (MM) patients and its potential clinical value as a biomarker, and analyzing its association with disease stage, treatment response, genetic characteristics and prognosis.
Patients and Methods: The serum concentrations of ATIC were assessed in 186 MM patients and 201 healthy controls via ELISA, and the diagnostic efficacy was evaluated through ROC curve analysis. Correlation analysis was conducted based on clinical parameters, including common comorbidities, clinical stages, laboratory indicators, disease status, treatment response level, and pathological characteristics. The prognostic relevance of serum ATIC levels in MM patients was assessed using Kaplan–Meier survival analysis.
Results: Serum ATIC levels showed a significant upregulated in MM patients (median = 38.26 ng/mL) compared to healthy controls group (median = 16.98 ng/mL) (p < 0.0001). Newly diagnosed MM (NDMM) patients showed higher ATIC levels (median = 46.73 ng/mL). Results from ROC curve analysis showed that ATIC had a good diagnostic performance (AUC = 0.720, p < 0.0001). ATIC levels decreased with treatment response, and the Remission Group (R group) exhibited a notable decrease than the Active Disease Group (AD group) (p < 0.05). Higher R-ISS staging was associated with elevated ATIC levels (p < 0.05). Positive correlations were found between serum ATIC levels and ESR (p = 0.029), β 2-MG (p = 0.035), GLO (p = 0.044), UA (p = 0.037), abnormal FISH results (p = 0.02), as well as poor prognosis. Notably, MM patients with diabetes had lower ATIC levels than those without diabetes (p = 0.004).
Conclusion: This study found that serum ATIC expression levels were significantly upregulated in MM patients, which is closely related to comorbidities, disease progression, renal dysfunction, and poor prognosis.
Keywords: ATIC, MM, biomarker, serum
Introduction
Multiple myeloma (MM) represents a neoplastic disorder originating from mature B-cells. It’s also called plasmacytoma. It starts from a precancerous state named monoclonal gammaglobulinopathy of undetermined significance (MGUS). Then, it develops gradually into smoldering multiple myeloma (SMM). Finally, it turns into symptomatic myeloma.1 In symptomatic myeloma, clonal plasma cells multiply. These cells make monoclonal immunoglobulins and invade the bone marrow. This causes bone pain, bone destruction, anemia, kidney problems, and immune system abnormalities.2 MM constitutes around 1% of all cancer cases and 10% of hematological malignancies.3 Annually, the United States sees around 35,000 new diagnoses, and almost 13,000 patients succumb to the disease each year.4 The latest GBD database5 shows that although advances in diagnostic and therapeutic techniques have slowed down the overall increase6 in the burden of MM over the past decade,7 the global burden of MM is still significant,8 and the relapsed-refractory multiple myeloma (RRMM) remains a significant clinical challenge and unresolved problem.9 Therefore, it is crucial and urgent to actively explore the pathogenesis of MM and to seek potential strategies for the prevention and treatment of MM.
5-Aminoimidazole-4-carboxamide nucleotide formyl transferase/inosine cyclisation hydrolase (AICARFT/IMPCH, ATIC) serves as a crucial bifunctional enzyme10 responsible for catalyzing the two final steps of the purine synthesis pathway.11 Emerging studies have shown that blocking ATIC activity effectively halts tumor cell growth, suggesting its utility as a promising cancer therapeutic target.12 Previous studies have linked the ATIC gene to a variety of cancers, and it has been suggested to be a promoter gene for hepatocellular carcinoma,13 lung adenocarcinoma14 and other types of cancer. In addition, our previous study have shown that ATIC overexpression correlated with unfavorable prognosis in multiple myeloma and may function as an individual predictor of survival status,15 and its genetic polymorphisms were significantly associated with reduced risk of multiple myeloma.10
However, there is a gap in the research regarding the expression levels of serum ATIC in patients with MM. This study provides insights into the clinical significance of ATIC, extending from the comparison of expression levels in sera of different populations to the relationship with different clinical features and therapeutic responses, with the aim of providing informative support for ATIC as a diagnostic and therapeutic target for MM.
Materials and Methods
Selection of Patients for the Study
This study comprised 387 subjects, 186 MM patients hospitalized in the Hematology Department of the First Affiliated Hospital of Guangxi Medical University from October 2021 to September 2024, and 201 healthy controls. Blood specimens were obtained from the above participants. All participants enrolled in this study complied with the National Comprehensive Cancer Network (NCCN) guidelines.16 Exclusion criteria included patients with: (1) Active infections with HIV, HBV, or HCV; (2) Concomitant hematological malignancies or diseases; (3) Previous or current neoplastic conditions. MM patients were staged using the Revised International Staging System (R-ISS), the International Staging System (ISS) and the Durie-Salmon System (DS). This study recruited 201 healthy individuals as a control group with no previous anemia, inflammation, or tumor history. The clinical information of all the individuals participated in this experiment are shown in Table 1.
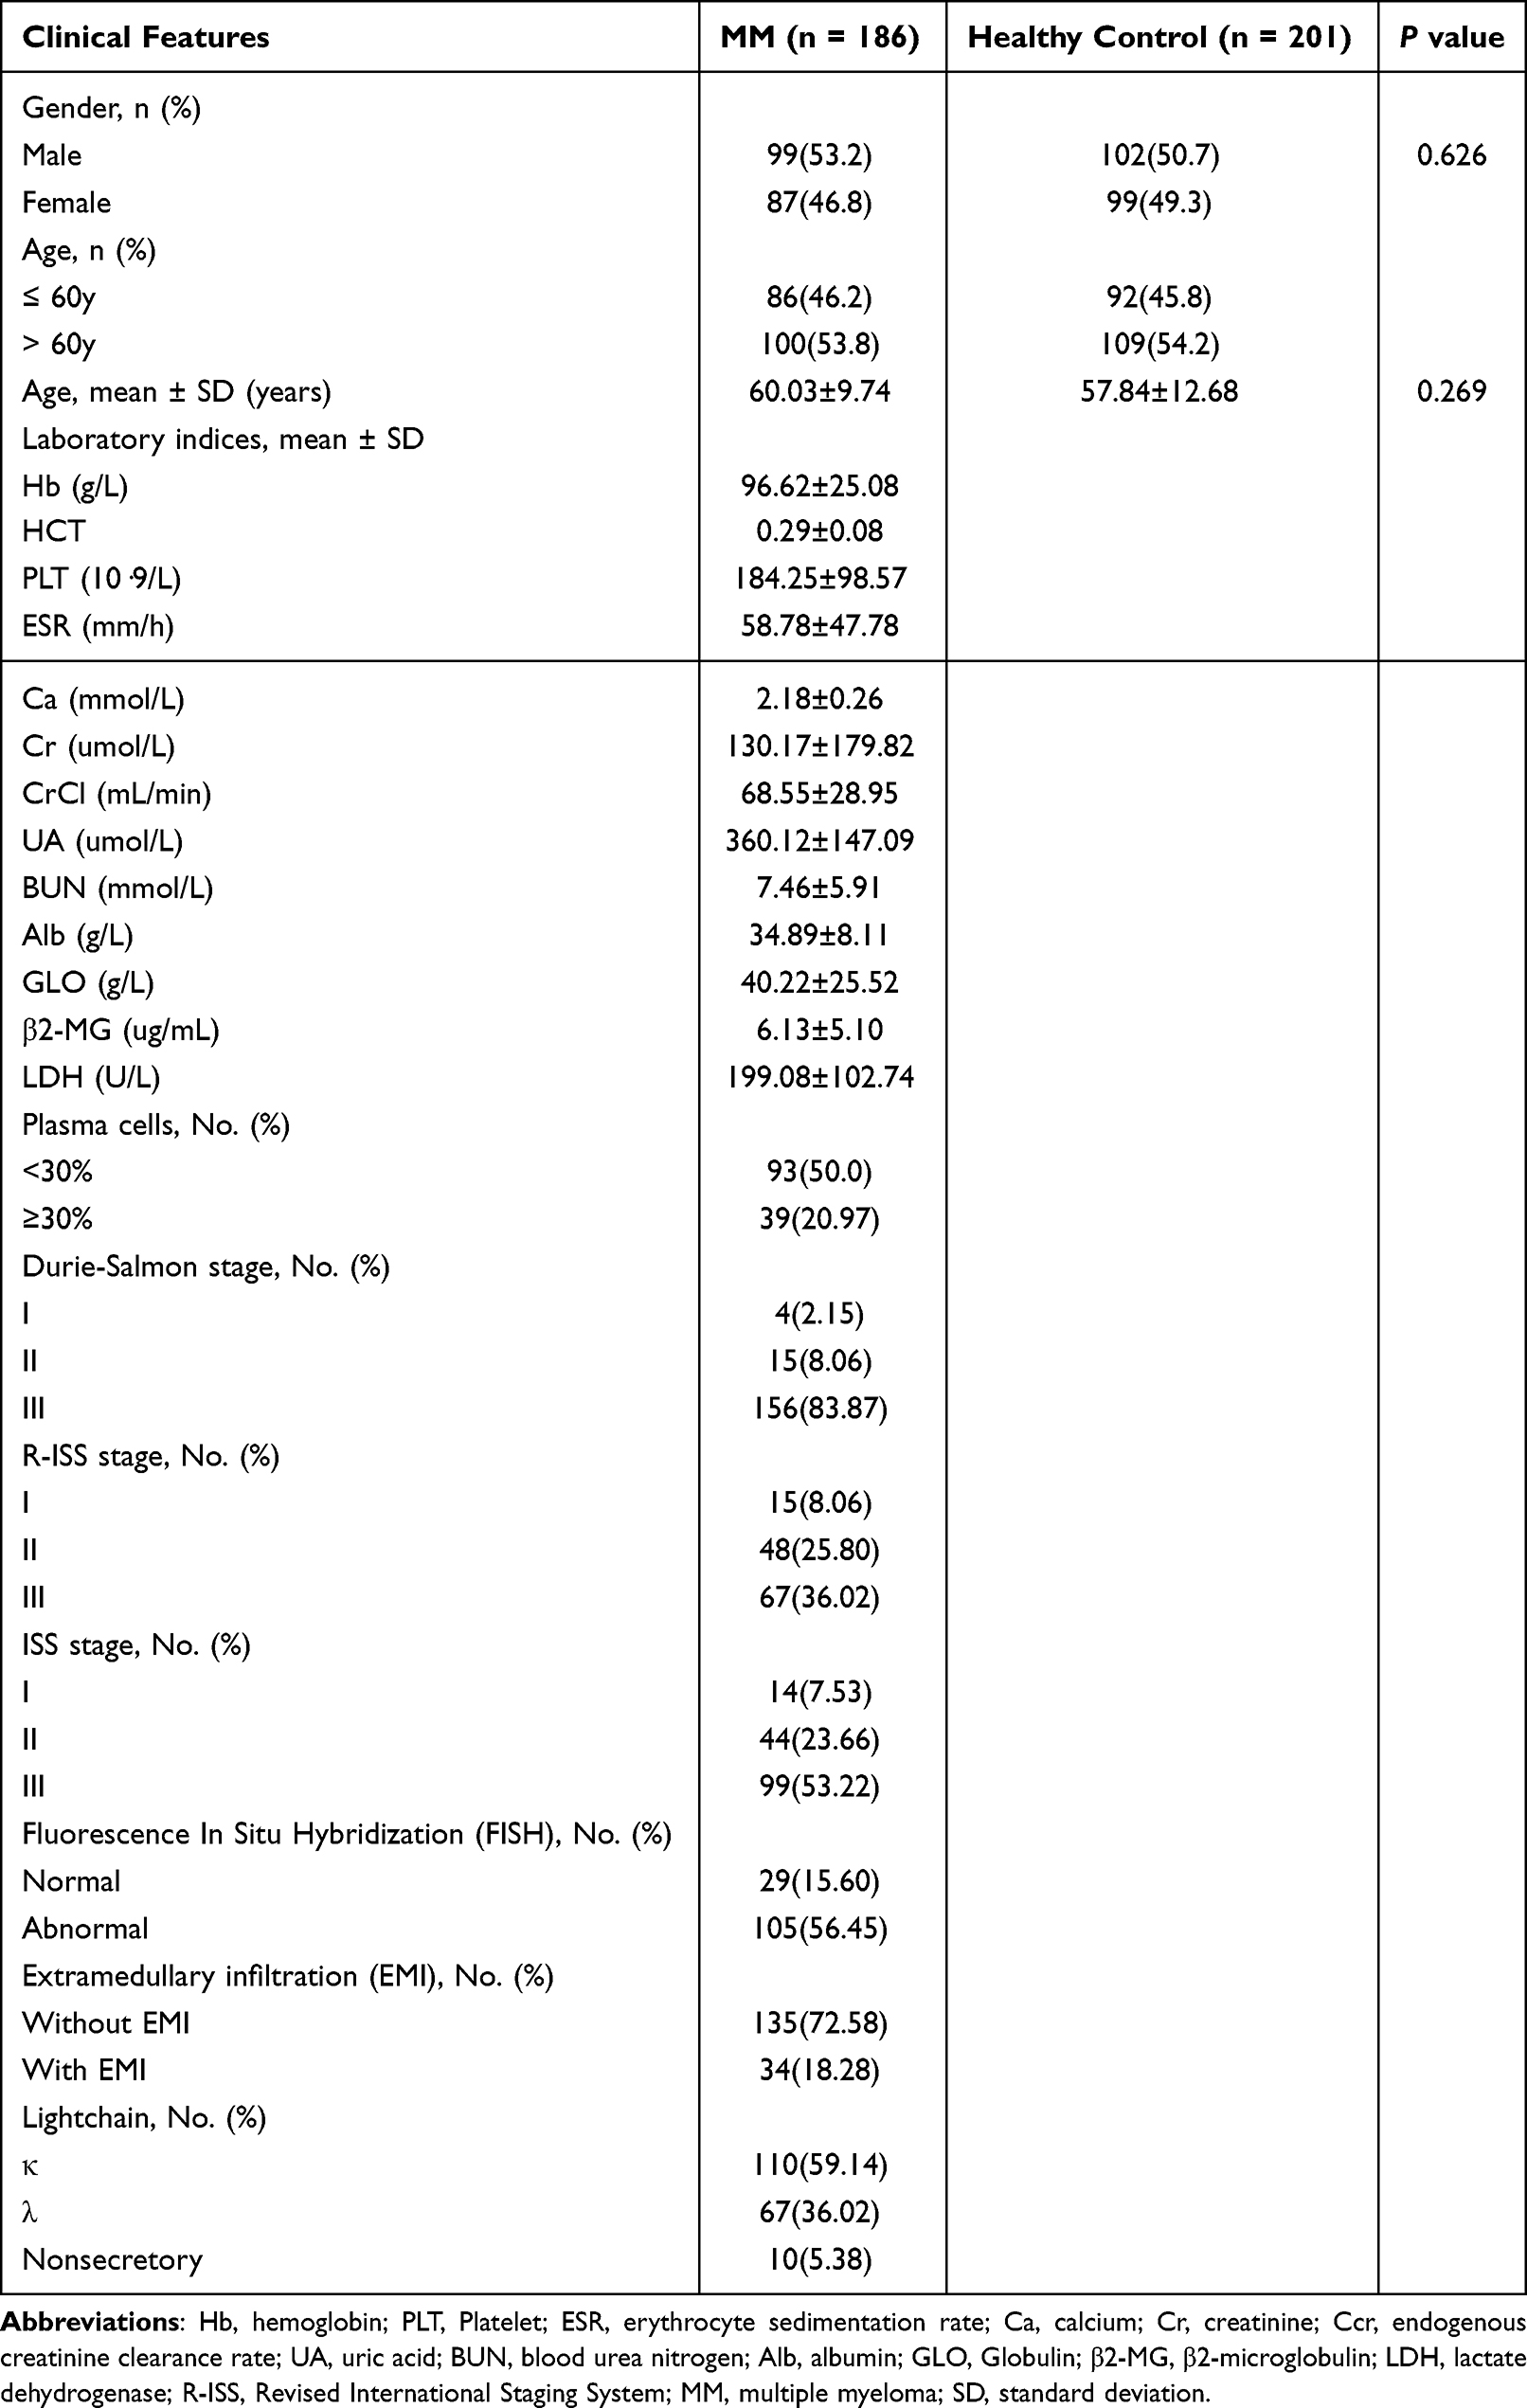 |
Table 1 Clinical Characteristics of the Patients with MM and the Healthy Controls |
Ethical approval for this study was obtained (2025-E0267). The study’s purpose, procedures, benefits, risks, and potential inconveniences were communicated to the participants, and they consented to participate by signing a written agreement.
Data Collection from Study Subjects
To assess disease status and organ function, most participants underwent a panel of laboratory and histologic tests. Laboratory analyses included total calcium and renal function markers (uric acid, serum creatinine, creatinine clearance, urea nitrogen), erythrocyte sedimentation rate (ESR), blood counts (Hgb, Hct, PLT), LDH, serum and urinary protein profiles. Protein testing involved electrophoresis, immunofixation, and light-chain assays for ALB, GLO, B2M, M-protein, and sFLC. Bone marrow samples were analyzed via cytomyelogram to determine plasma cell percentage. For nonsame-day testing, retrospective analysis was performed within 1 month for laboratory results and 6 months for histologic reports. In addition, serum expression of ATIC was evaluated according to age, sex, presence of extramedullary infiltration, disease status, different disease stages (DS, ISS, R-ISS) and cytogenetic risk classification, as well as presence of comorbidities (hypertension, hyperglycemia, hyperuricemia), and whether or not stem cell transplantation had been performed. To facilitate the comparison of progression-free survival (PFS) between different levels of serum ATIC, MM patients were stratified into two groups according to the critical value derived from the ROC curve analysis.
Measurement of ATIC Immunoreactivity by ELISA
An ELISA-based quantification of ATIC levels in clinical samples was carried out using a sandwich-type assay kit (Human ATIC ELISA Kit, Jiangsu Enzyme Immunity Industry Co., Ltd, Jiangsu, China). The following protocol adhered strictly to the manufacturer’s guidelines. First, we let frozen samples and reagents warm up to room temperature. Then, we added 50 μL of diluted ATIC standards and pre-diluted serum samples in duplicate to pre-coated 96-well plates. We filled blank wells with sample diluent. Next, each well was added with 100 μL of horseradish peroxidase conjugate, and the plates were incubated at 37°C in the dark for 60 minutes. After that, each well was washed five times with 300 μL of washing solution. Subsequently, each reaction well was successively added with 50 μL of chromogen A and B, and then placed in a 37°C incubator and protected from light for 15 minutes. Upon reaching the desired color, 50 μL of the stop solution was introduced, and the OD value was assessed at 450 nm within a 15-minute time utilizing a Multiskan GO full-wavelength microplate reader (Thermo Fisher Scientific, Shanghai). The concentration was calculated based on the direct proportionality between the OD value and the ATIC content, and invalid data were excluded according to the range.
Statistical Analysis
The MedCalc 20.0 Windows program, IBM SPSS Statistics 25.0 Windows program and GraphPad Prism version 9.0 Windows program were used for the statistical analysis. Firstly, subjects were stratified according to the clinical decision levels of laboratory indicators. Subsequently, descriptive analyses were performed for both high-level and low-level groups to determine the normality of the sample distribution. Group comparisons were conducted utilizing appropriate statistical tests based on dataset characteristics. The unpaired t-test, Mann–Whitney U-test, one-way ANOVA, or Kruskal–Walli’s test was selected according to the number of groups, data distribution (normal/non-normal), and variable type (dependent/independent). For normally distributed groups with unequal variances, Welch’s or Geisser–Greenhouse corrections were applied. Secondly, correlation analyses were conducted between ATIC values in the patient group and each laboratory indicator. Correlations between parameters were assessed using Pearson (for normal distribution) and Spearman (for non-normal distribution) tests. To account for multiple testing, we applied the Holm–Bonferroni method for pairwise group comparisons. Adjusted P (or q) value <0.05 was considered significant. Receiver operating characteristic (ROC) curve analysis evaluated the diagnostic performance of the ATIC ELISA, determining sensitivity, specificity, and optimal cut-off values. In all statistical analyses, P < 0.05 was considered significant.
Result
Serum ATIC Levels in MM Patients versus Healthy Controls
In accordance with the inclusion and exclusion criteria, a total of 186 MM patients and 201 healthy individuals were enrolled in this study. Notably, the MM group (n = 186, median = 38.26 ng/mL) exhibited significantly elevated endogenous serum ATIC levels when compared with the healthy control group (C) (n = 201, median = 16.98 ng/mL). (Figure 1A).
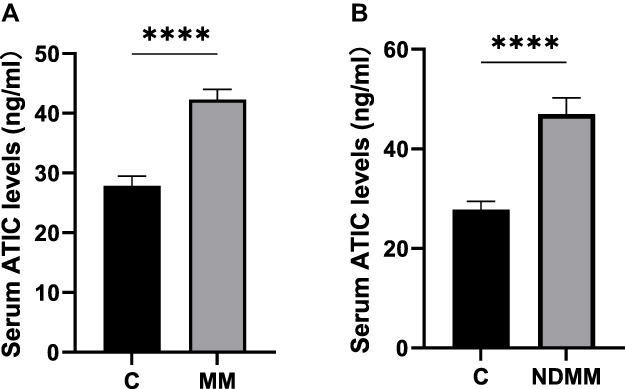 |
Figure 1 (A) The serum ATIC levels in the multiple myeloma (MM) patients and healthy controls (C). The healthy control group (C): n=201, median =16.98 ng/mL. The MM group: n=186, median = 38.26 ng/mL. (**** p < 0.0001). The Mann–Whitney U-test was used for statistical analysis. (B) The serum ATIC levels in the NDMM patients and healthy controls (C). The newly diagnosed MM group (NDMM): n=32, median=46.57ng/mL. (**** p < 0.0001). The Mann–Whitney U-test was used for statistical analysis. |
Among the 186 patients included, 32 were newly diagnosed MM (NDMM) patients who had not been treated. In contrast to the healthy controls, serum ATIC expression levels in NDMM patients (n = 32, median = 46.57 ng/mL) were higher (p < 0.0001) (Figure 1B).
The Diagnostic Efficacy of Serum ATIC Level as a Biomarker for MM
Serum ATIC values from 186 MM patients and 201 healthy controls were incorporated into ROC curve analysis, and the area under the curve (AUC) was 0.720. The results also showed a 95% confidence interval of 0.673–0.764, with p < 0.0001 (Figure 2), it indicated that ATIC has a good diagnostic performance for MM. Based on the highest Youden index, when the ATIC cutoff value was set at 26.5492 ng/mL, the diagnostic sensitivity of MM reached 77.4% and specificity is 67.7%.
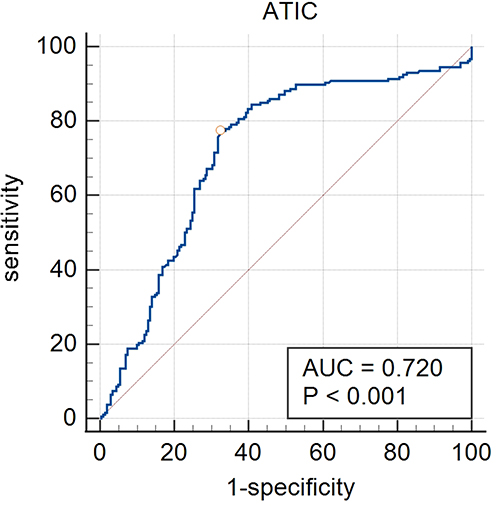 |
Figure 2 The receiver operating characteristic (ROC) curve analysis of the serum ATIC levels in MM and healthy controls. |
Serum ATIC Levels in Relation to Comorbidities of MM Patients
We found no statistical differences in either gender or age between the patient group and the healthy control group (Table 1). Furthermore, we also analyzed the relationship between ATIC levels and MM comorbidities. The results showed that compared with non-diabetic MM patients (median: 40.80 ng/mL), the serum ATIC level of diabetes MM patients (median: 28.20 ng/mL) was significantly lower (p = 0.004), indicating that there is a potential association between MM patients comorbid diabetes and those with decreased ATIC expression levels. However, no correlation was observed between ATIC expression and hypertension in MM patients (p = 0.887) (Table 2).
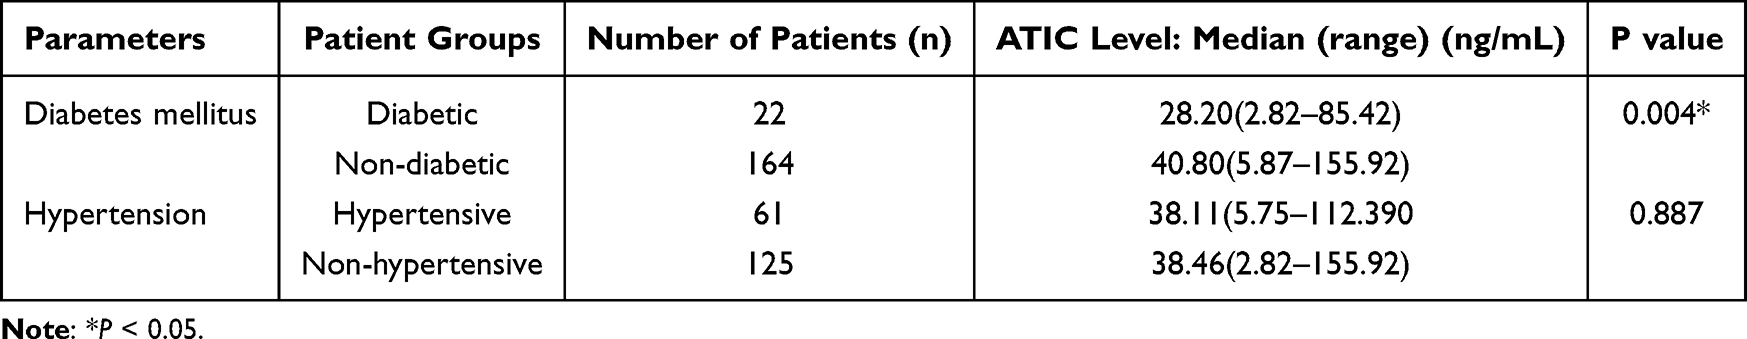 |
Table 2 The Serum ATIC Levels in Relation to the Comorbidities. The Mann–Whitney U Was Used for the Statistical Analysis |
Serum ATIC Levels in Relation to Staging of MM Patients
According to the recommendations of the IMWG for the staging and risk classification of MM, DS, ISS, and R-ISS staging system were compared for MM patients. For the RISS, we formed three groups in relation to the stages of MM. As shown in the Table 3, the ATIC levels increased progressively in the higher stages (p = 0.004), with RISS Stage I (n = 15, mean: 31.63 ± 17.48 ng/mL), Stage II (n = 51, mean: 40.40 ± 18.99 ng/mL, Stage III: n = 67, mean: 51.14 ± 26.92 ng/mL). Significant differences were found between the ATIC levels of Stage I and Stage III (p = 0.0118) and between Stage II and Stage III patients (p = 0.0220) (Figure 3). However, no significant stage-dependent variations in ATIC expression were noted for DS and ISS classifications (p > 0.05) (Table 3).
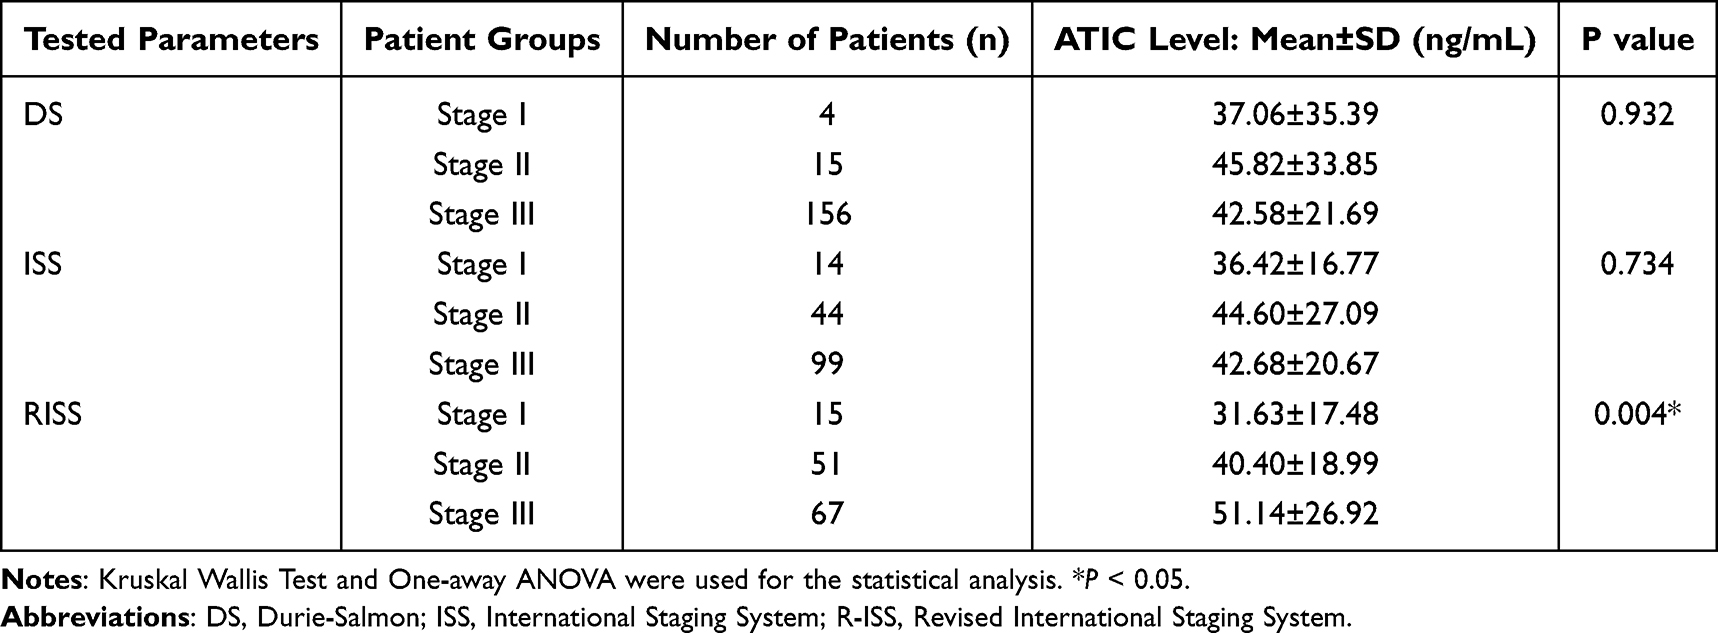 |
Table 3 The Serum ATIC Levels in Relation to Stage and Risk Stratification |
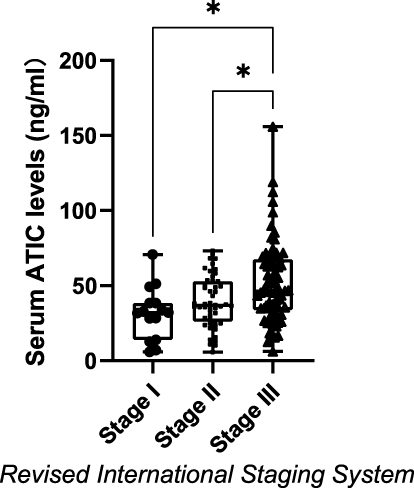 |
Figure 3 The serum ATIC levels in relation to stages of the Revised International Staging System (RISS) of MM patients. The box plot diagram represents the interquartile range and median values. Whiskers indicate the most extreme observations. The individual values are presented with black dots (Stage (I) n = 15, mean: 31.63 ± 17.48 ng/mL), squares (Stage II: n = 51, mean: 40.40 ± 18.99 ng/mL), and triangles (Stage III: n = 67, mean: 51.14 ± 26.92 ng/mL). Kruskal–Wallis Test with Dunn’s was used for the statistical analysis. (* p <0.05). |
Serum ATIC Levels in Relation to Current Disease Status of MM Patients
According to the response to treatment, previously treated MM individuals were divided into the Active Disease Cohort (AD) and the Remission Cohort (R). The AD cohort included all patients with refractory or progressive diseases who received treatment, along with those experiencing relapse after prior symptom relief (n = 77, mean: 44.86 ± 24.23ng/mL). The R cohort includes individuals who achieved PR (partial remission), VGPR (very good partial remission), CR (complete remission) and MRD negative (minimal residual disease negative activity) during therapy (n = 69, mean: 35.47 ± 18.10 ng/mL). Notably, our study showed that the R cohort had significantly lower ATIC levels compared to the AD cohort (p = 0.0245). In addition, the serum ATIC levels of patients in R cohort were significantly lower compared to the NDMM group (P = 0.0079). (Figure 4A).
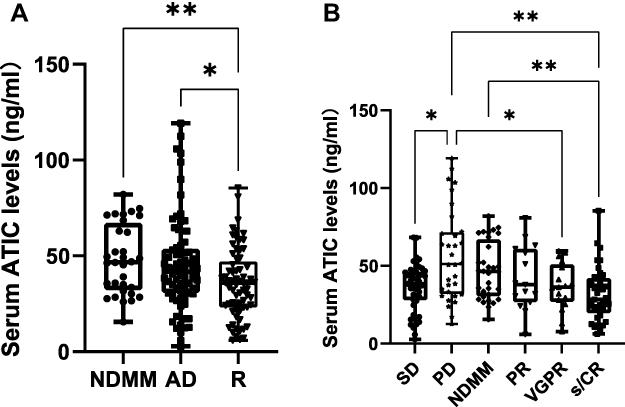 |
Figure 4 (A) Serum ATIC Levels in Relation to Current Disease Status of MM patients. The box plot diagram represents the interquartile range and median values. Whiskers indicate the most extreme observations. The individual values are presented with black dots (NDMM group: n = 32, mean: 48.13 ± 18.10 ng/mL), squares (patients with AD: n = 77, mean: 44.86 ± 24.23ng/mL), and triangles (patients in (R) n = 69, mean: 35.47 ± 18.10 ng/mL). The Kruskal–Wallis with Dunn’s multiple comparison test was used for statistical analysis. (*p < 0.05, ** p < 0.01). (B) Serum ATIC Levels in Relation to Current Disease Status of MM patients. The box plot diagram represents the interquartile range and median values. Whiskers indicate the most extreme observations. The individual values are presented with rhombuses (NDMM patients: n = 32, mean: 48.13 ± 18.10 ng/mL), downward triangles (PR: n = 18, mean: 41.30 ± 19.34 ng/mL), upward triangles (VGPR: n = 17, mean: 36.64 ± 15.24 ng/mL), squares (s/CR: n =38, mean: 31.23 ± 17.43 ng/mL), black dots (SD: n = 45, mean: 36.37 ±15.34ng/mL), black stars (PD: n = 32, mean: 56.81 ±29.21ng/mL). For statistical analysis, the ANOVA test with Welch’s multiple comparison was used. (* p < 0.05, ** p <0.01). |
Serum ATIC Levels in Relation to the Degree of Treatment Remission of MM Patients
To further explore the relationship between the degree of remission after treatment and serum ATIC levels in MM patients, we performed analysis differences in serum ATIC expression levels among NDMM group, SD group (stable disease), PD group (progressive disease), PR group, VGPR group, and s/CR group (complete remission and strict complete remission). We found that as the depth of response increased, the patients’ ATIC levels steadily decreased. The significance shown in the previous figure between the NDMM and R groups persisted when the NDMM and s/CR (n = 38, mean: 31.23 ± 17.43 ng/mL) groups were examined (p = 0.0082) with a similar, and simply tendency between the PD (n = 32, mean: 56.81 ± 29.21 ng/mL) and s/CR groups (p = 0.0011). Compared with PD group, a marked decrease in the serum ATIC expression level was observed in the VGPR group (n = 17, mean: 36.64 ± 15.24 ng/mL) (p = 0.0038) and SD group (n = 45, mean: 36.37 ± 15.34 ng/mL) (P = 0.0114). (Figure 4B).
Serum ATIC Levels in Relation to Clinical Parameters of MM Patients
In this study, we compared the differences in serum ATIC expression levels between different cut-off values of anemia related indicators, including Hb (hemoglobin), HCT (hematocrit), PLT (platelet) and ESR (erythrocyte sedimentation rate). Surprisingly, significantly higher serum ATIC levels were observed in the low Hb group (Hb < 100 g/L) and high PLT group (PLT > 300*109/L) of MM patients than in the high Hb group (Hb ≥ 100 g/L) and low PLT group (PLT < 100*109/L), respectively (p < 0.05) (Table 4). However, correlation analysis has shown that elevated ESR is significantly positively correlated with high expression levels of serum ATIC in MM patients, while high-expression states of Hb, Hct, and PLT are not significantly associated with ATIC levels. This reflects the differences in statistical methods and the complexity of biological mechanisms.
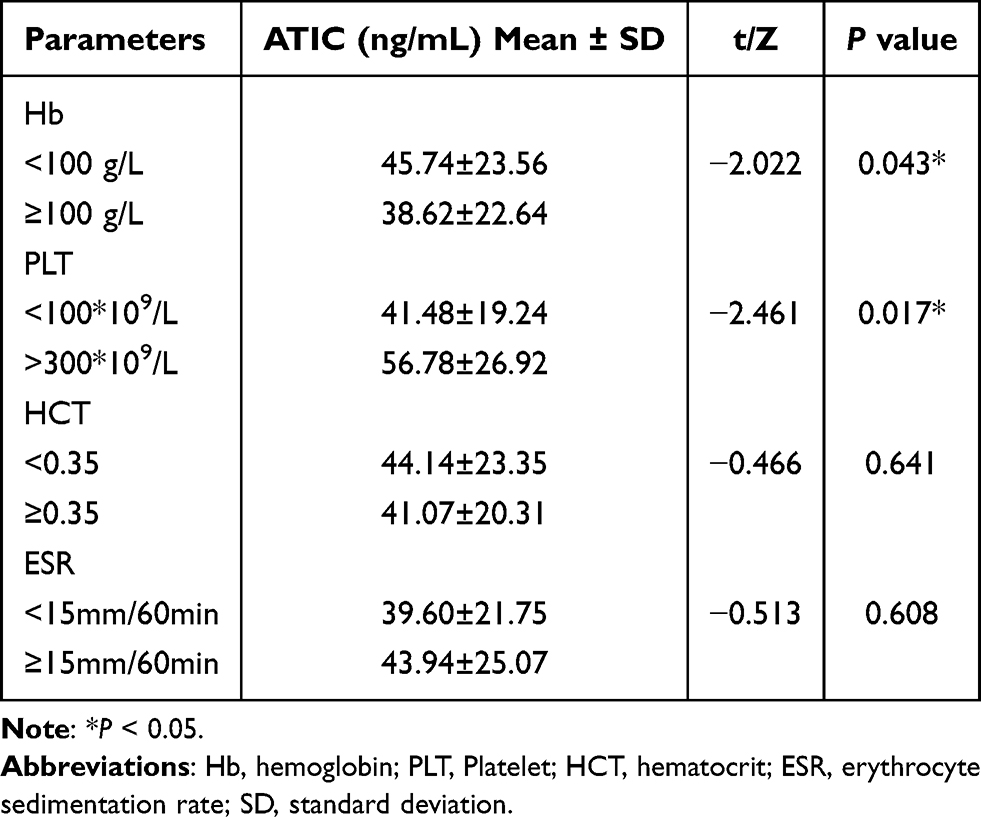 |
Table 4 Serum ATIC Expression Levels Between Different Cut-off Values of Anemia Related Indicators |
Additionally, the correlation between serum ATIC levels and parameters related to liver and kidney function was analyzed. These parameters were collected from patient groups stratified according to the Chinese Guidelines for the Diagnosis and Management of Multiple Myeloma (2022 revision),17 including β2-microglobulin (β2-MG), urea nitrogen (BUN), blood calcium (Ca), lactate dehydrogenase (LDH), serum creatinine (Cr), creatinine clearance rate (CrCl), uric acid (UA), globulin (GLO), and albumin (ALB). Findings revealed that serum ATIC concentrations were notably elevated in the high GLO group (≥35 g/L), high UA group (UA ≥ 360 μmol/L), and high β2-MG group (β2-MG ≥ 5.5 mg/L) of MM patients than in the normal GLO group (GLO < 35 g/L), normal UA group (UA < 360 μmol/L), and normal β2-MG group (β2-MG <5.5 mg/L) (p < 0.05), respectively (Table 5). Moreover, high serum ATIC levels were significantly positively correlated with elevated levels of GLO (n = 178, r = 0.151, p = 0.044), UA (n = 179, r = 0.156, p = 0.037), and β2-MG (n = 177, r = 0.159, p = 0.035) (Table 6). After FDR correction, correlations between ATIC and β2-MG, UA and GLO (all yielded q = 0.044) remained significant, indicating a correlation between high expression of serum ATIC and liver and kidney function damage in MM patients.
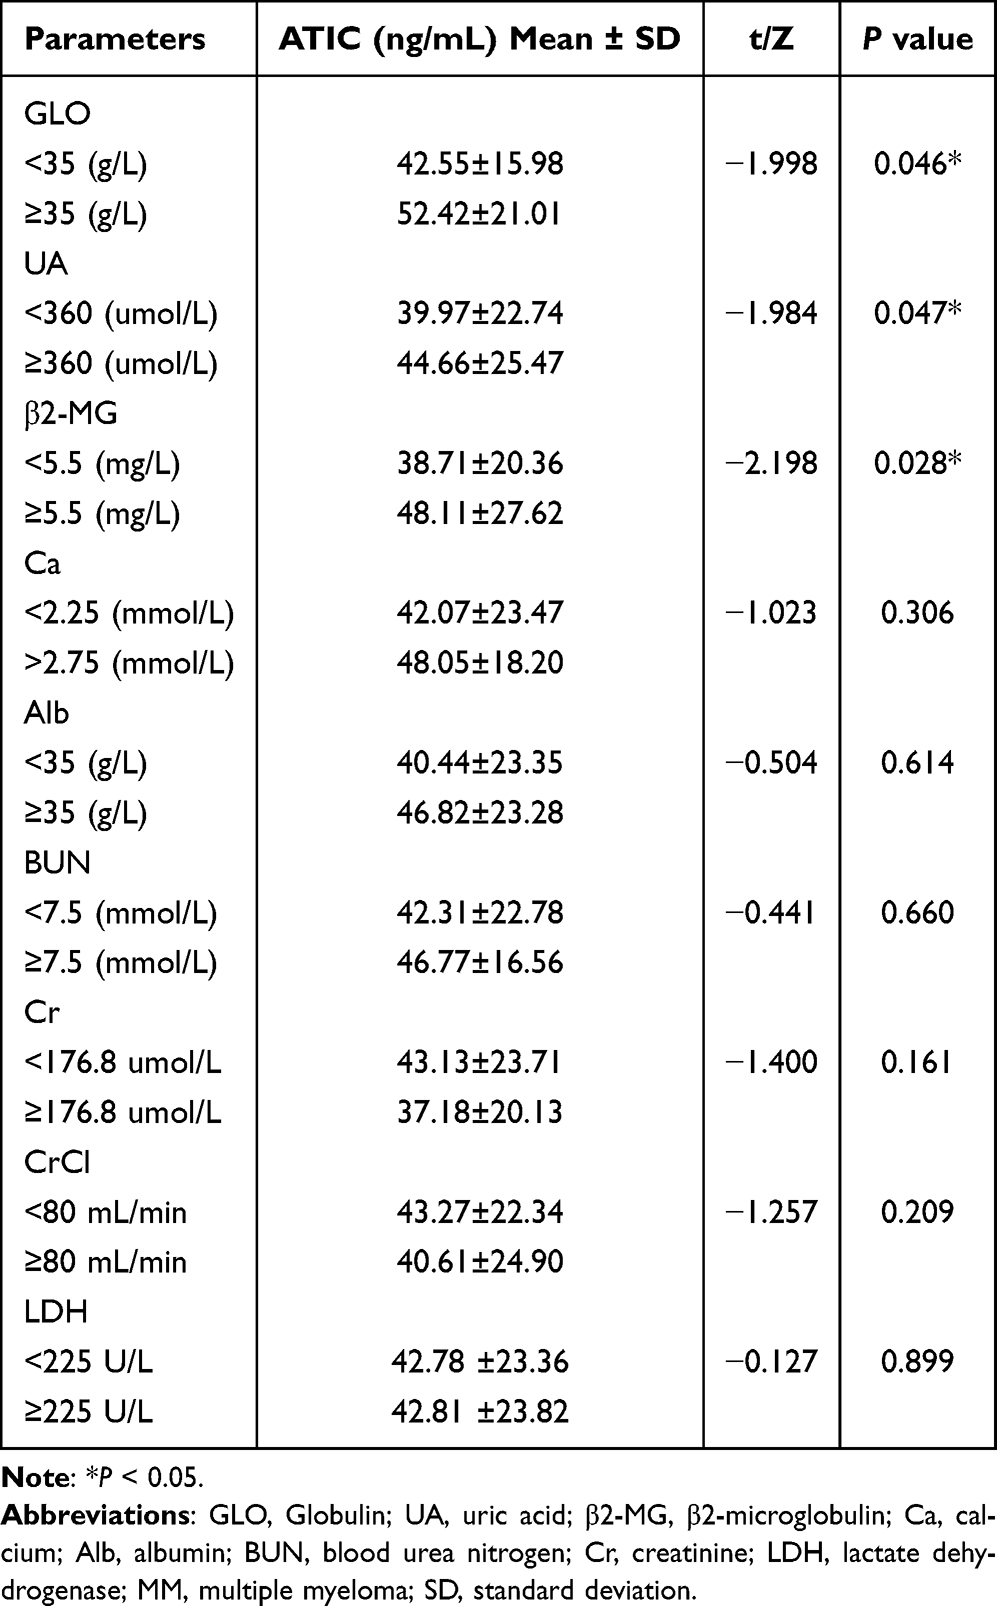 |
Table 5 Comparison of Serum ATIC Levels Between Different Clinical Parameter Groups in MM Patients |
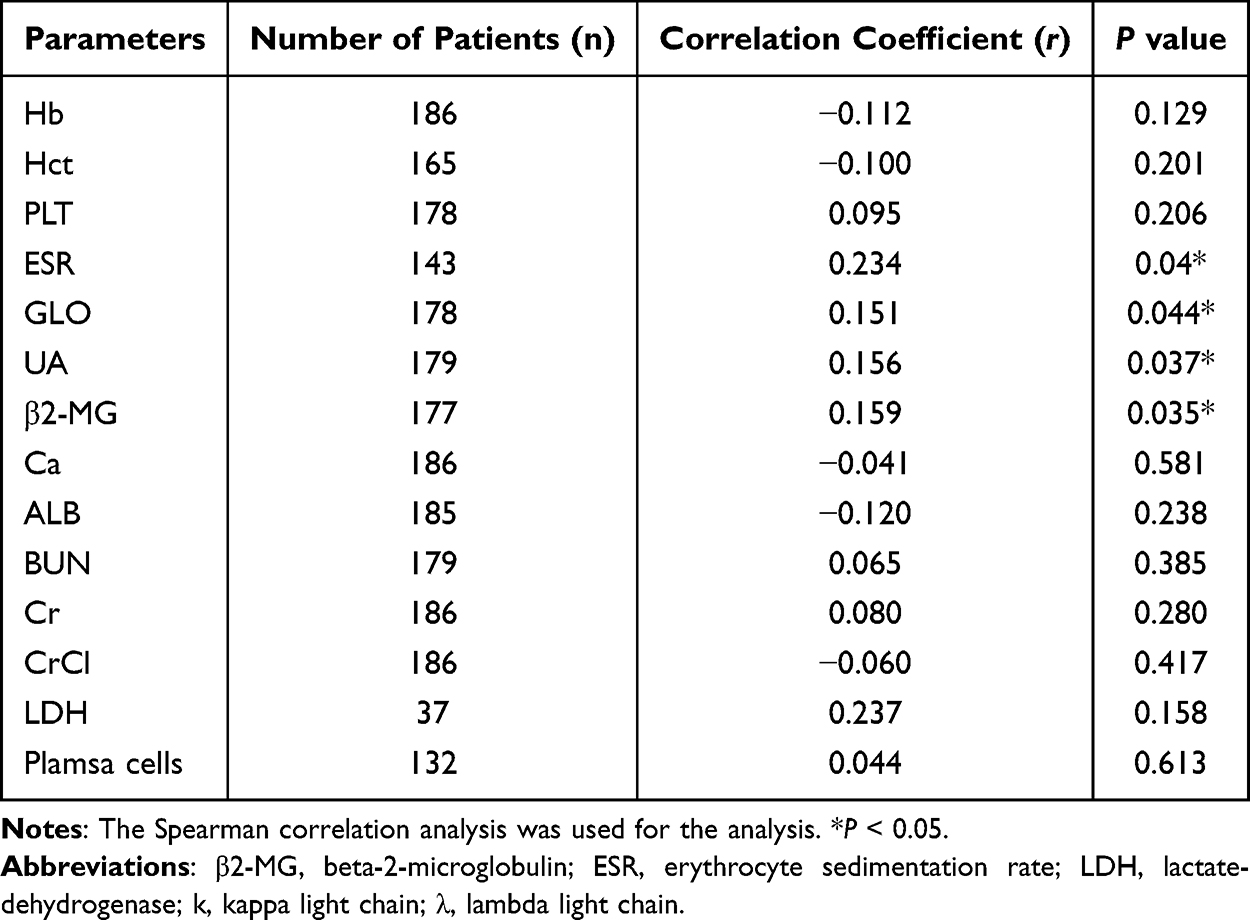 |
Table 6 Comparison of the Correlation for General Biochemical Parameters Related to the Serum ATIC Levels of MM Patients |
Serum ATIC Levels in Relation to Clinicopathological Features of MM Patients
To compare the association between serum ATIC levels and clinical pathological characteristics of MM patients, we collected some representative clinical pathological parameters from enrolled MM patients, including fluorescence in situ hybridization (FISH), light-chain typing, plasma cells and extramedullary infiltration (EMI). The results showed that 105 cases (56.4%) showed abnormal FISH results and 34 (18.2%) MM patients had EMI. Among the light-chain typing, 110 (59.1%) MM patients had k-chain and 67 (36.0%) MM patients had λ-chain, and MM patients with abnormal FISH results exhibited significantly higher serum ATIC levels than those with normal FISH results. Besides, the serum ATIC levels of MM patients with λ-chain were significantly higher than those of patients with k-chain (P < 0.05). However, no significant differences in serum ATIC concentration were observed between groups stratified by plasma cell count (with a threshold of ≥30%) and extramedullary infiltration status. (Table 7).
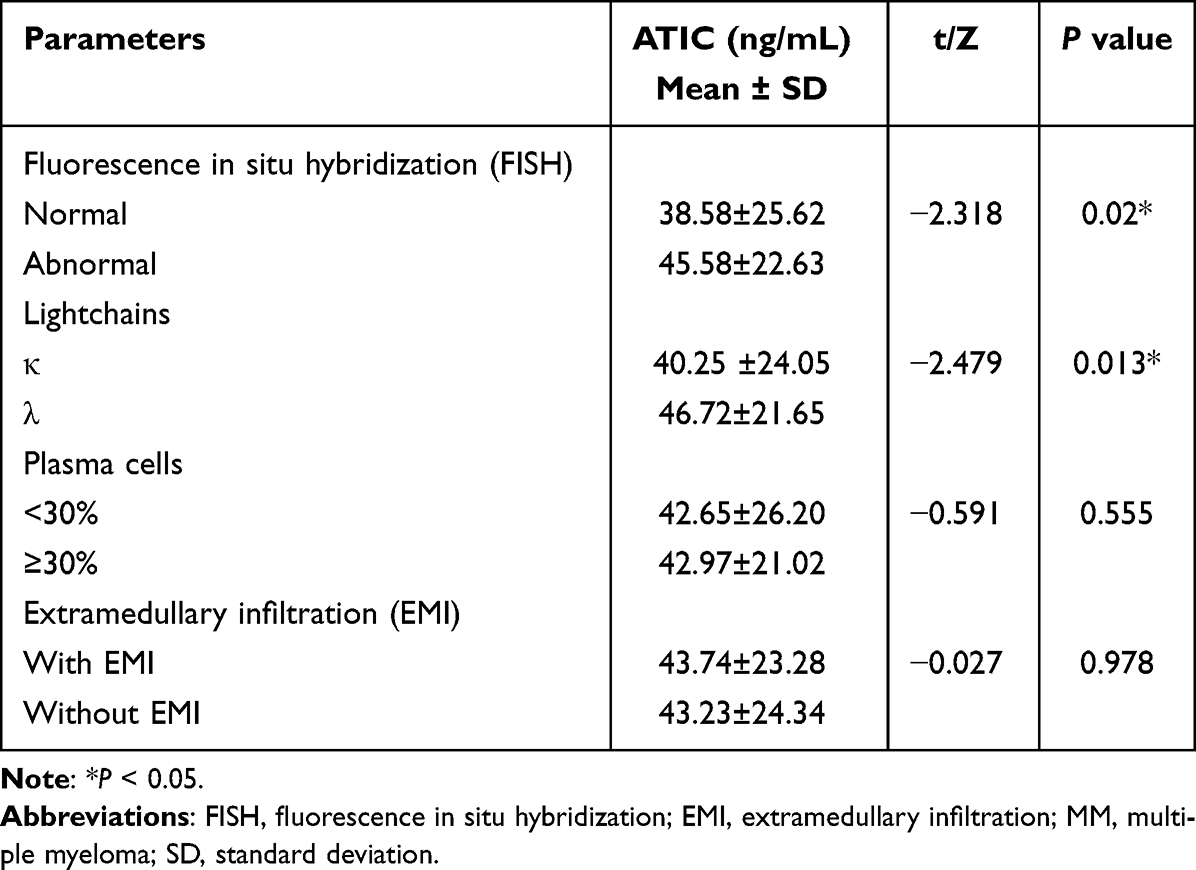 |
Table 7 Serum ATIC Levels in Relation to Clinic Pathological Features of MM Patients |
Serum ATIC Levels in Relation to Progression-Free Survival of MM Patients
Through continuous follow-up of MM patients, we collected progression-free survival (PFS) data, defined as the time interval from the start of induction therapy to disease progression or death from any cause, calculated in months. Based on the ATIC cutoff value determined by ROC analysis, MM patients were divided into high and low ATIC expression groups, and Kaplan Meier curves were used to calculate the changes in PFS time. Findings indicated that in comparison with the low ATIC expression group, the PFS time of the high ATIC expression group among MM patients was shorter, indicating faster disease progression. These results suggest that high serum ATIC expression may influence MM progression (Figure 5).
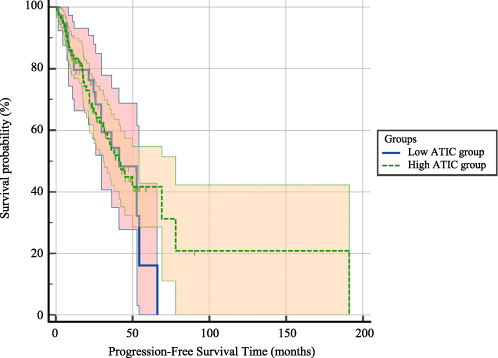 |
Figure 5 Serum ATIC Levels in Relation to Survival analysis of MM patients. The Kaplan–Meier curves indicate that the high ATIC group (1) showed a trend toward shorter PFS compared to the low ATIC group (0), suggesting a potential association between elevated ATIC levels and poorer clinical outcomes. |
Discussion
Within our research, a notable elevation of ATIC concentrations in serum was detected in MM patients when contrasted with healthy controls matched for age and gender. Besides, neither age nor sex in the MM patients and healthy individuals could influence the levels of ATIC. These findings suggest a potential role for ATIC as a diagnostic biomarker for MM, warranting further exploration in clinical settings. Subsequently, we referred to the patients who had not yet received treatment after admission to the hospital as NDMM patients, which had higher expression levels of ATIC in serum compared to healthy controls. ROC analysis indicated that ATIC had a good diagnostic performance for MM, and the area under the curve (AUC) was 0.720. Based on the highest Youden index, when the ATIC cutoff value was set at 26.5492 ng/mL, the diagnostic sensitivity for MM reached 77.4%, with a specificity of 67.7%.
We investigated the link between serum ATIC level and common comorbidities among individuals with MM and found a potential association between diabetes and serum ATIC levels in MM. A study conducted at the University of Toronto in Canada examined the association between diabetes and hematological malignancies by utilizing healthcare databases from Ontario. The findings indicated that individuals with diabetes exhibited a 15% increased risk of developing MM.18 In addition, a Meta-analysis also showed that patients with type 2 diabetes had a 20% increased risk of developing MM.19 One of the core pathological mechanisms of diabetes is insulin resistance, and the purine nucleotide metabolic processes involved in ATIC may play an important role in cellular energy metabolism.20 Insulin is an important hormone that regulates blood glucose levels and it has an inhibitory effect on autophagy. When blood insulin levels are elevated, the downstream PI3K–AKT–mTOR signaling pathway is activated, while the initiation of autophagy is inhibited.21 In a related study, we found that ATIC also inhibits autophagy like insulin, and we hypothesized that a reduction in ATIC would have an effect similar to that of insulin resistance and cause an increase in blood glucose levels. Research indicates that the reduction of ATIC can promote autophagy, similar to the effect of glucagon. When blood glucose levels are decreased, the secretion of glucagon increases, activating the cAMP-PKA signaling pathway and inhibiting mTOR activity, thereby inducing autophagy and breaking down substances such as glycogen within cells into glucose.22,23
We also examine the serum ATIC level and staging classification systems recommended by IMWG among the patients. Significantly elevated ATIC levels were observed in the higher RISS stages, which may indicate that ATIC may play a potentially valuable role as a prognostic biomarker. For DS and ISS, there was an upward trend from stage I to stage III, but no significant differences were observed among these groups. This finding may be attributed to the fact that assess DS staging by Hb and serum calcium,24 and assess ISS staging by β2-MG and albumin, which this indicators significantly related to disease burden25 itself affects grouping.
In our study, we also explored the relation of serum ATIC Levels and the degree of treatment remission of patients with MM. The results demonstrated that patients with active disease had significantly higher ATIC levels than those in remission. When patients achieved significant remission, their ATIC levels were markedly lower than those in NDMM cohort and the active disease cohort. Further subgrouping of patients in remission based on the response of treatment revealed that serum ATIC levels steadily decreased with treatment remission until s/CR, suggesting that the lower the ATIC level, the more optimistic the prognosis for the patient. Similarly, the worse the disease, the higher the ATIC level. These results corroborated our hypothesis that ATIC may serve as a detection marker reflecting clinical efficacy and can also be used for prognostic evaluation.
When we examined laboratory indicators related to anemia, we found significant changes in Hb, PLT, ESR and ATIC. The results showed that serum ATIC levels showed high expression in the anemia group and platelet high expression group of MM patients, and correlation analysis found no significant correlation between them, indicating that their relationship may be non-linear or dependent on other factors. Of course, this also reflects that ATIC may be a biomarker for MM inflammation or metabolic status. The ESR26 was positively correlated with ATIC expression in serum of patients with MM. The level of PLT in serum was directly regulated by TPO. Interestingly, the level of TPO varied significantly at each stage of MM. For example, when MM progresses from MGUS/SMM, BM and serum levels of TPO are significantly elevated, suggesting its potential as a diagnostic and prognostic biomarker for MM.27 When we examined laboratory markers of liver and renal function, we found that serum ATIC levels were highly expressed and positively correlated with high levels of GLO, UA, and b2-MG groups. Based on these findings, we can hypothesize that accelerated ESR may be associated with elevated GLO in MM patients.28 A notable positive link was discovered between UA and ATIC. UA, as the final metabolite of purine catabolism, often reflects vigorous cellular metabolism and a substantial tumor burden when its levels are elevated,29 whereas elevated levels of ATIC also reflect proliferation of tumor cells and disease activity.14 In the case of LDH, although there was no significant difference, we still observed that ATIC values were associated with higher LDH values (greater than 225 U/L). The elevated values of these two laboratory parameters, β2-MG30 and LDH,31 are markers of poor prognosis.32
MM is characterized by a variety of chromosomal abnormalities. FISH technology can detect these chromosomal aberrations, which are of great significance, prognosis and treatment of the disease.33 In this investigation, it was demonstrated that serum ATIC levels in patients with abnormal FISH results were strikingly elevated compared to those with normal FISH outcomes. Following the guidelines set by the international myeloma working group,34 this study categorized several cytogenetic aberrations linked to a poor prognosis in MM as abnormal FISH results. These abnormalities include t (11,14), t (6,14), t (4;14), del (17p), t (14;16), t (14;20), and 1q21 amplification. The results showed that high serum ATIC levels were associated with an unfavorable prognosis for MM. In MM, we analyzed ATIC by grouping the two types of light chains and found a marked differences in ATIC levels between the two groups. Although the prognosis of MM is influenced by light chain-related factors, our research indicates that ATIC has potential prognostic value as a serum biomarker for MM. Consequently, in future clinical practice, integrating ATIC levels with the κ/λ ratio of serum-free light chains could enable more precise prognoses for MM patients.
In the final part of this study, we also discovered some associations between serum ATIC level and PFS of MM. In the Log rank test for comparing survival curves, the hazard ratio analysis indicated that the hazard ratio of the high expression group of ATIC with MM patients compared to the low expression group of serum ATIC was 1.1061, suggesting that with higher expression group of ATIC had a slightly higher risk of MM disease progression. Considering the trend of the survival curves, although the survival probability of the high expression group of ATIC was slightly higher than that of the low expression group of ATIC in the later stage, the faster decline in the early stage suggests that patients with a high expression of ATIC may experience disease progression-related events earlier, thereby affecting prognosis. That is, the higher expression of ATIC, the worse the prognosis of MM, which is consistent with our previous reports.
Our research results suggest that ATIC may play a vital role in the pathogenesis and development of MM, as we demonstrated that the serum levels of ATIC in patients with MM were higher than those in healthy individuals, and the high expression levels of serum ATIC were closely related to MM patients with higher RISS staging, abnormal FISH results, high level of UA, high level of β2-MG, treatment incomplete remission and short PFS time. Of course, this study also has some potential limitations. Firstly, the sample size is insufficient. Increasing the sample size can more accurately evaluate the relationship between ATIC levels and certain clinical features, especially in specific subgroups of patients (such as extramedullary infiltration, specific cytogenetic abnormalities, etc). Secondly, there is a lack of overall survival time data in this study. The follow-up period can be extended in the future to obtain more overall survival data; it will help to better and more comprehensively evaluate the prognostic impact of ATIC on MM patients. Third, the control group comprised healthy volunteers without diabetes, which precluded evaluation of the impact of diabetes state on ATIC levels; therefore, individuals with diabetes will be included in future studies.
Conclusion
In conclusion, this study reveals significantly elevated serum ATIC levels in patients with MM versus healthy controls. ROC curve demonstrated that ATIC has good diagnostic performance for MM (AUC = 0.720). Notably, serum ATIC levels in patients with MM exhibited a decreasing trend as the treatment response improved, and the Remission Group showed a marked decrease compared to the Active Disease Group (p < 0.05). Serum ATIC levels were positively associated with higher R-ISS stages (p < 0.05) and lower in diabetic MM patients compared to non-diabetic counterparts (p = 0.004). Elevated ATIC levels strongly correlated with increased ESR, β2-MG, GLO, UA, and abnormal FISH results (p < 0.05). Collectively, these findings establish ATIC as a multifunctional biomarker for MM diagnosis, prognostic assessment, and treatment efficacy monitoring.
Abbreviations
AD, Active Disease Group; ATIC, 5-Aminoimidazole-4-carboxamide ribonucleotide formyl transferase/IMP cyclohydrolase; β2-MG, β2-microglobulin; CR, complete remission; DS, Durie-Salmon system; ESR, Erythrocyte sedimentation rate; FISH, Fluorescence in situ hybridization; GLO, Globulin; Hb, Hemoglobin; ISS, International Staging System; LDH, Lactate dehydrogenase; MM, Multiple myeloma; NDMM, newly diagnosed multiple myeloma; PLT, platelet; SD/PD, stable or progressive disease; s/CR, complete remission and strict complete remission; PFS, Progression-free survival; PR, Partial remission; R-ISS, Revised International Staging System; UA, Uric acid; VGPR, Very good partial remission.
Ethics Approval
Ethical approval was granted by the First Affiliated Hospital of Guangxi Medical University Research Ethics Committee (Approval No. 2025-E0267).
Author Contributions
All authors made a significant contribution to the work reported, whether that is in the conception, study design, execution, acquisition of data, analysis and interpretation, or in all these areas; took part in drafting, revising or critically reviewing the article; gave final approval of the version to be published; have agreed on the journal to which the article has been submitted; and agree to be accountable for all aspects of the work.
Funding
Financial support for this study was provided by the National Natural Science Foundation of China (Grant No. 82360411) and the Guangxi Province Health Technology Development and Application Project (Project No. S2018076).
Disclosure
The authors report no conflicts of interest in this work.
References
1. Huang J, Chan SC, Lok V, et al. The epidemiological landscape of multiple myeloma: a global cancer registry estimate of disease burden, risk factors, and temporal trends. Lancet Haematol. 2022;9(9):e670–e677. doi:10.1016/S2352-3026(22)00165-X
2. Manier S, Huynh D, Shen YJ, et al. Inhibiting the oncogenic translation program is an effective therapeutic strategy in multiple myeloma. Sci Transl Med. 2017;9(389). doi:10.1126/scitranslmed.aal2668.
3. Rajkumar SV, Dimopoulos MA, Palumbo A, et al. International myeloma working group updated criteria for the diagnosis of multiple myeloma. Lancet Oncol. 2014;15(12):e538–548. doi:10.1016/S1470-2045(14)70442-5
4. Siegel RL, Giaquinto AN, Jemal A. Cancer statistics, 2024. CA A Cancer J Clin. 2024;74(1):12–49. doi:10.3322/caac.21820
5. Cowan AJ, Allen C, Barac A, et al. Global burden of multiple myeloma: a systematic analysis for the global burden of disease study 2016. JAMA Oncol. 2018;4(9):1221–1227. doi:10.1001/jamaoncol.2018.2128
6. Kumar SK, Dispenzieri A, Lacy MQ, et al. Continued improvement in survival in multiple myeloma: changes in early mortality and outcomes in older patients. Leukemia. 2014;28(5):1122–1128. doi:10.1038/leu.2013.313
7. Zhang N, Wu J, Wang Q, et al. Global burden of hematologic malignancies and evolution patterns over the past 30 years. Blood Cancer J. 2023;13(1):82. doi:10.1038/s41408-023-00853-3
8. Laubach J, Garderet L, Mahindra A, et al. Management of relapsed multiple myeloma: recommendations of the international myeloma working group. Leukemia. 2016;30(5):1005–1017. doi:10.1038/leu.2015.356
9. Dima D, Ullah F, Mazzoni S, et al. Management of relapsed-refractory multiple myeloma in the era of advanced therapies: evidence-based recommendations for routine clinical practice. Cancers. 2023;15(7):2160. doi:10.3390/cancers15072160
10. Wang Y, Ling Z, Hu Z, et al. 5-Amino-4-imidazolecarboxamide ribonucleotide transformylase/IMP cyclohydrolase polymorphisms affect the susceptibility to multiple myeloma. Lab Med. 2022;53(5):465–474. doi:10.1093/labmed/lmac022
11. Zhang Y, Morar M, Ealick SE. Structural biology of the purine biosynthetic pathway. Cell Mol Life Sci. 2008;65(23):3699–3724. doi:10.1007/s00018-008-8295-8
12. Brooks HB, Meier TI, Geeganage S, et al. Characterization of a novel AICARFT inhibitor which potently elevates ZMP and has anti-tumor activity in murine models. Scient Rep. 2018;8(1):15458. doi:10.1038/s41598-018-33453-4
13. Luo B, Zhuang L, Huang J, et al. LncRNA ZFAS1 regulates ATIC transcription and promotes the proliferation and migration of hepatocellular carcinoma through the PI3K/AKT signaling pathway. J Cancer Res Clin Oncol. 2024;150(7):351. doi:10.1007/s00432-024-05877-1
14. Niu N, Zeng J, Ke X, et al. ATIC facilitates cell growth and migration by upregulating Myc expression in lung adenocarcinoma. Oncol Lett. 2022;23(4):131. doi:10.3892/ol.2022.13251
15. Li R, Chen G, Dang Y, et al. Upregulation of ATIC in multiple myeloma tissues based on tissue microarray and gene microarrays. Int J Lab Hematol. 2021;43(3):409–417. doi:10.1111/ijlh.13397
16. Callander NS, Baljevic M, Adekola K, et al. NCCN guidelines® insights: multiple myeloma, version 3.2022. J Nat Comprehensive Cancer Network. 2022;20(1):8–19. doi:10.6004/jnccn.2022.0002
17. Chinese Hematology Association. Guidelines for the diagnosis and management of multiple myeloma in China (2022 revision). Zhonghua Nei Ke Za Zhi. 2022;61(5):480–487. doi:10.3760/cma.j.cn112138-20220309-00165
18. Gong IY, Cheung MC, Read S, Na Y, Lega IC, Lipscombe LL. Association between diabetes and haematological malignancies: a population-based study. Diabetologia. 2021;64(3):540–551. doi:10.1007/s00125-020-05338-7
19. Castillo JJ, Mull N, Reagan JL, Nemr S, Mitri J. Increased incidence of non-Hodgkin lymphoma, leukemia, and myeloma in patients with diabetes mellitus type 2: a meta-analysis of observational studies. Blood. 2012;119(21):4845–4850. doi:10.1182/blood-2011-06-362830
20. Blagov A, Nedosugova L, Kirichenko T, Sukhorukov V, Melnichenko A, Orekhov A. Mitochondrial dysfunction as a factor of energy metabolism disorders in type 2 diabetes mellitus. Front Biosci. 2024;16(1):5. doi:10.31083/j.fbs1601005
21. Hopkins BD, Goncalves MD, Cantley LC. Insulin-PI3K signalling: an evolutionarily insulated metabolic driver of cancer. Nat Rev Endocrinol. 2020;16(5):276–283. doi:10.1038/s41574-020-0329-9
22. Li E, Shan H, Chen L, et al. OLFR734 mediates glucose metabolism as a receptor of asprosin. Cell Metabol. 2019;30(2):319–328.e318. doi:10.1016/j.cmet.2019.05.022
23. Zhao Y, Li S, Chen Y, et al. Histone phosphorylation integrates the hepatic glucagon-PKA-CREB gluconeogenesis program in response to fasting. Mol Cell. 2023;83(7):1093–1108.e1098. doi:10.1016/j.molcel.2023.02.007
24. Palumbo A, Avet-Loiseau H, Oliva S, et al. Revised international staging system for multiple myeloma: a report from international myeloma working group. J Clin Oncol. 2015;33(26):2863–2869. doi:10.1200/JCO.2015.61.2267
25. Greipp PR, San Miguel J, Durie BG, et al. International staging system for multiple myeloma. J Clin Oncol. 2005;23(15):3412–3420. doi:10.1200/JCO.2005.04.242
26. Alexandrakis MG, Passam FH, Ganotakis ES, et al. The clinical and prognostic significance of erythrocyte sedimentation rate (ESR), serum interleukin-6 (IL-6) and acute phase protein levels in multiple myeloma. Clin Lab Haematol. 2003;25(1):41–46. doi:10.1046/j.1365-2257.2003.00492.x
27. Lamanuzzi A, Saltarella I, Frassanito MA, et al. Thrombopoietin promotes angiogenesis and disease progression in patients with multiple myeloma. Am J Pathol. 2021;191(4):748–758. doi:10.1016/j.ajpath.2020.12.016
28. Hussain A, Almenfi HF, Almehdewi AM, Hamza MS, Bhat MS, Vijayashankar NP. Laboratory features of newly diagnosed multiple myeloma patients. Cureus. 2019;11(5):e4716. doi:10.7759/cureus.4716
29. Du L, Zong Y, Li H, et al. Hyperuricemia and its related diseases: mechanisms and advances in therapy. Signal transduction Targeted Ther. 2024;9(1):212. doi:10.1038/s41392-024-01916-y
30. Stella-Holowiecka B, Czerw T, Holowiecka-Goral A, Giebel S, Wojnar J, Holowiecki J. Beta-2-microglobulin level predicts outcome following autologous hematopoietic stem cell transplantation in patients with multiple myeloma. Transpl Proceed. 2007;39(9):2893–2897. doi:10.1016/j.transproceed.2007.08.052
31. Simonsson B, Brenning G, Källander C, Ahre A. Prognostic value of serum lactic dehydrogenase (S-LDH) in multiple myeloma. Eur J Clin Investig. 1987;17(4):336–339. doi:10.1111/j.1365-2362.1987.tb02197.x
32. Kyrtsonis MC, Maltezas D, Tzenou T, Koulieris E, Bradwell AR. Staging systems and prognostic factors as a guide to therapeutic decisions in multiple myeloma. Seminars Hematol. 2009;46(2):110–117. doi:10.1053/j.seminhematol.2009.02.004
33. Clarke SE, Fuller KA, Erber WN. Chromosomal defects in multiple myeloma. Blood Rev. 2024;64:101168. doi:10.1016/j.blre.2024.101168
34. Sonneveld P, Avet-Loiseau H, Lonial S, et al. Treatment of multiple myeloma with high-risk cytogenetics: a consensus of the international myeloma working group. Blood. 2016;127(24):2955–2962. doi:10.1182/blood-2016-01-631200
 © 2025 The Author(s). This work is published and licensed by Dove Medical Press Limited. The
full terms of this license are available at https://www.dovepress.com/terms
and incorporate the Creative Commons Attribution
- Non Commercial (unported, 4.0) License.
By accessing the work you hereby accept the Terms. Non-commercial uses of the work are permitted
without any further permission from Dove Medical Press Limited, provided the work is properly
attributed. For permission for commercial use of this work, please see paragraphs 4.2 and 5 of our Terms.
© 2025 The Author(s). This work is published and licensed by Dove Medical Press Limited. The
full terms of this license are available at https://www.dovepress.com/terms
and incorporate the Creative Commons Attribution
- Non Commercial (unported, 4.0) License.
By accessing the work you hereby accept the Terms. Non-commercial uses of the work are permitted
without any further permission from Dove Medical Press Limited, provided the work is properly
attributed. For permission for commercial use of this work, please see paragraphs 4.2 and 5 of our Terms.
Recommended articles
TMT-Based Quantitative Proteomic and Physiological Analyses on Serums of Chinese Patients with Active Vitiligo
Chen Z, Li Y, Nie S, Wu Z
Clinical, Cosmetic and Investigational Dermatology 2023, 16:1407-1417
Published Date: 5 June 2023
Peripheral Complement Factor-Based Biomarkers for Patients with First-Episode Schizophrenia
Cao Y, Xu Y, Xia Q, Shan F, Liang J
Neuropsychiatric Disease and Treatment 2023, 19:1455-1462
Published Date: 23 June 2023
Diagnostic Roles of circXPNPEP3 as Biomarker for Diabetic Nephropathy
Liu M, Zhan Q, Zhu J, Zhao J, Min D
Diabetes, Metabolic Syndrome and Obesity 2025, 18:4287-4297
Published Date: 17 November 2025
Circulating miR-148a-3p Correlates with Inadequate Induction Response in Pediatric Hodgkin Lymphoma
Rohde M, Singh VK, Wolfermann A, Burkhardt B, Blattmann C, Steinbach D, Schneider DT, Ebinger M, Maecker-Kolhoff B, Braun M, Kurch L, Mauz-Körholz C, Körholz D
ImmunoTargets and Therapy 2026, 15:577426
Published Date: 1 April 2026