Back to Journals » Clinical, Cosmetic and Investigational Dermatology » Volume 16
TMT-Based Quantitative Proteomic and Physiological Analyses on Serums of Chinese Patients with Active Vitiligo
Authors Chen Z ![]() , Li Y, Nie S, Wu Z
, Li Y, Nie S, Wu Z
Received 11 March 2023
Accepted for publication 13 May 2023
Published 5 June 2023 Volume 2023:16 Pages 1407—1417
DOI https://doi.org/10.2147/CCID.S412124
Checked for plagiarism Yes
Review by Single anonymous peer review
Peer reviewer comments 2
Editor who approved publication: Dr Jeffrey Weinberg
Zile Chen,* Yiting Li,* Shu Nie, Zhouwei Wu
Department of Dermatology, Shanghai General Hospital, Shanghai Jiao Tong University School of Medicine, Shanghai, People’s Republic of China
*These authors contributed equally to this work
Correspondence: Zhouwei Wu, Department of Dermatology, Shanghai General Hospital, Shanghai Jiao Tong University School of Medicine, Shanghai, People’s Republic of China, Email [email protected]
Purpose: Vitiligo is an acquired depigmented skin disorder. Though genetic background, autoimmune dysregulation, and oxidative stress were reported involved in the development of vitiligo, the exact pathogenesis remains largely unknown. This study aimed to investigate potential functional proteins, pathways, and serum biomarkers involved in active vitiligo.
Patients and Methods: Tandem Mass Tags (TMT) method was used to determine differentially expressed proteins (DEPs) in serum samples between 11 active vitiligo patients and 7 healthy controls of Chinese Han population.
Results: A total of 31 DEPs were identified (P < 0.05, fold change > 1.2), with 21 proteins upregulated and 10 proteins downregulated in the vitiligo group. DEPs were enriched in GO terms such as “extracellular exosome” and “immunoglobulin receptor binding”, as well as KEGG pathways including “cysteine and methionine metabolism” and other immune-related pathways. Furthermore, ALDH1A1 and EEF1G achieved areas under receiver-operating characteristic (ROC) curve of 0.9221 and 0.8571, respectively. The expression levels of these 2 proteins were validated in another active vitiligo patient group.
Conclusion: Our research provided novel insight into serum proteomic profile for vitiligo patients, detecting ALDH1A1 and EEF1G as potential biomarkers for active vitiligo and therapeutic intervention. Our work also detected several DEPs and associated pathways in the serum of active vitiligo patients, reinforcing the roles of retinoic acid and exosome processes in vitiligo pathogenesis.
Keywords: vitiligo, active, proteomic profile, serum, biomarker
Introduction
Vitiligo is an acquired skin depigmentation disease afflicting 1% of the world population.1 Although vitiligo is neither a lethal disease nor affects normal physiological function, it is detrimental to patients, particularly psychologically, due to its disfiguring tendency. Vitiligo has great negative impacts on the quality of life (QOL) for patients by lowering self-esteem and causing severe stress.2,3 This decline in QOL is comparable to that of other frustrating skin disorders like psoriasis and eczema.2
Currently, the diagnosis of vitiligo is mostly based on the typical clinical manifestation, sometimes with the aid of a Wood’s lamp examination. It is quite challenging for physicians to differentiate some atypical or early-stage cases of vitiligo from other hypopigmented diseases,4,5 which may lead to delayed or inappropriate treatment. Hence, it will be extremely valuable if some objective indicators such as serum biomarkers, can be identified to aid physicians in making correct diagnoses.
It has been commonly accepted that the depigmentation in vitiligo is due to the loss of epidermal melanocytes, the exact mechanism remains yet unclear. Previous studies have pointed out that T cells induce CXCL9 and CXCL10 production by keratinocytes via secreting IFN-γ to recruit more T cells and attack melanocytes.6–8 Meanwhile, it has been reported that the degeneration and loss of melanocytes caused by oxidative stress may be one of the mechanisms of vitiligo development.9 Furthermore, the study on the allelic association of candidate genes and genome-wide linkage analyses have been conducted in the past few years.10 To date, most of the profiling research studies of vitiligo focused on gene transcription or expression, while proteomic profiling analysis is also needed to identify key potential proteins playing roles in the development of vitiligo and explore the pathogenesis of vitiligo from a proteomic perspective.
In this study, we investigated the proteomics of serums from active vitiligo patients and healthy controls by the Tandem Mass Tags (TMT) assay. We aimed to identify the potential proteins and serum biomarkers for vitiligo development, hence providing novel insights into the pathogenesis of vitiligo.
Materials and Methods
Participants
Twenty-one non-segmental vitiligo patients and 17 gender- and age-matched healthy controls were recruited between January 2022 and March 2022 from Shanghai General Hospital. All participants were Chinese Han population. The diagnosis of vitiligo and assessment of disease activity was made by two experienced dermatologists based on the typical clinical presentation of depigmented lesions. The Vitiligo Disease Activity Score (VIDA score) was used to evaluate disease activity. Active disease was defined as the appearance of a new lesion or the enlargement of an existing lesion within 6 months (VIDA ≥ 2). All enrolled patients were active and received no systemic treatment in the last 3 months. Eleven vitiligo patients and 7 healthy controls were first enrolled for proteomic profiling assay, and the other 10 vitiligo patients and 10 healthy controls were tested for validation. This study was conducted per the Declaration of Helsinki and was approved by the Shanghai General Hospital’s ethics committee. Signed informed consent was obtained from all participants.
Sample Preparation
Blood samples were collected and immediately centrifuged at 1000 rpm for 10 minutes before being stored at −80°C. The total protein was obtained from the serum, and the protein concentration and molecular weight were determined by BCA assay (ThermoScientific, 23225) and SDS-PAGE (GenScript, M00669). Fifty micrograms of protein from each sample were adjusted to the same concentration and volume by diluting with lysate. Then the protein solution was incubated with DTT (Titan, 01064272) at 55°C for 30 min, followed by incubation with iodoacetamide and acetone, separately. After centrifugation, sample pellets were reconstituted in 100 μL TEAB (200 mM) buffer (Sangon Biotech, A510932-0500) and digested into peptides by 1mg/mL Trypsin-TPCK (Beijing Hualishi Tech, HLS TRY001C) at 37 °C overnight. The digested peptides were resuspended in 50 μL TEAB (100 mM) and then transferred into new tubes for labeling. The TMTpro label reagent (ThermoScientific, A52045) was then added to each sample vial and then mixed with the vortex, followed by incubation at room temperature for 1 h. The reaction was stopped with 5% hydroxylamine (Sigma, 438227), then the peptide labeling solutions were lyophilized and stored at −80°C.
Instrumentation and Analytical Conditions
To separate the labeled peptides for later MS analysis, an 1100 HPLC System (Agilent) with an Agilent Zorbax Extend RP column (5 μm, 2.1×150 mm) was used. The detection wavelength was 210 nm with mobile phases A being ACN-H2O (2: 98, v/v) and mobile phases B being ACN-H2O (90: 10, v/v). The reversed-phase (RP) separation was carried out with 300 μL/min fluent flow rate. The solvent gradient was set as “0~8 min, 98% A: 8~8.01 min, 98%~95% A; 8.01~48 min, 95%~75% A; 48~60 min, 75~60% A; 60~60.01 min, 60~10% A; 60.01~70 min, 10% A; 70~70.01 min, 10~98% A; 70.01~75 min, 98% A”. Samples eluent was collected in tube 1–15 every minute in turn with recycling in this order for 8–60 minutes, then the eluent was lyophilized for mass spectrometry.
For MS analysis, a Q-Exactive mass spectrometer (Thermo Fisher Scientific) with Easy nanoLC-1200 (Thermo Fisher Scientific) was used for further labeled peptides analysis. We used two different types of columns (Acclaim PepMap100 100 μm×2 cm and Acclaim PepMap RSLC, 75 μm×50 cm) and different mobile phases consisting of water and formic acid (FA) mixed with varying proportions of ACN to separate the peptides. To be specific, fluent flow rate was 300 μL/min with mobile phases A being H2O-FA (99.9: 0.1, v/v) and mobile phases B being ACN-H2O-FA (80: 19.9: 0.1, v/v/v). The solvent gradient was set as “0~50 min, 2–28% B; 50~60 min, 28–42% B; 60~65 min, 42–90% B; 65~75 min, 90% B”.
The specific MS analysis condition was set as follows: Mass resolution was set as 60,000, with AGG target being 3e6 and max injection time being 50 ms. Full MS scans were set in the mass range of 350–1500 m/z and MS/MS scans were conducted in the 20 most intense peaks. All MS/MS spectra were acquired using data-dependent high-energy collisional dissociation (HCD) fragmentation with NCE of 32 under positive mode, which helped to identify the specific amino acid sequence of each peptide. MS/MS spectra resolution was set as 45,000, with AGC target of 2e5, max injection time of 80 ms, and Q-E dynamic exclusion as 30s.
Proteomics Profiling
The acquired raw data were analyzed with Proteome Discover 2.4 (Thermo Fisher Scientific), with the main parameters of searching being: static modification as TMT (N-term, K); Carbamidomethyl (C), dynamic modification as Oxidation (M), Acetyl (N-term), instrument as Q Exactive HF, MS1 tolerance as 10 ppm, MS2 tolerance as 0.02 Da, missed cleavages as 2, and database as uniprot-reviewed_yes+taxonomy_9606.fasta. After the database searching, we used “SEQUEST-HT scores > 0 and minimum of 1 unique peptide” as a criterion to identify confident proteins. Student’s t-test was used to generate a list of statistically significant proteins with “P < 0.05, fold change > 1.2” as a cutoff. To better visualize the statistically significant proteins and their differential expressions, a volcano plot was drawn with GraphPad Prism 9.0 and a heat map was generated with OECloud tools. A protein–protein interaction (PPI) network was constructed among DEPs based on the STRING database by Cytoscape 3.7.1 to demonstrate the relationship between DEPs. The enrichment pathway analysis was carried out with the Gene Ontology (GO) database and Kyoto Encyclopedia of Genes and Genomes (KEGG) database to predict the possible function of DEPs.
Enzyme-Linked Immunosorbent Assay (ELISA)
Two selected candidate biomarkers, namely aldehyde dehydrogenase 1A1 (ALDH1A1) and elongation factor 1-gamma (EEF1G) were then detected in the validation group (n = 10). Serum samples were collected from 10 vitiligo patients and 10 healthy controls and then tested by ELISA assays according to the Manufacturer’s instructions (Cloud-Clone, USA). To be specific, serum samples were added to the plate for 1-hour incubation, followed by subsequent incubation with reagent A and B after proper washing. After 20 minutes incubation with substrate solution, the samples were mixed with stop solution and measured at 450 nm using a microplate reader (SpectraMax cmax plus, Molecular Devices).
Statistical Analysis
The Shapiro–Wilk test was utilized to assess the normality of the data distribution, while the unpaired t-test was used to make comparisons between groups. P value < 0.05 was considered statistically significant. The diagnostic value of differentially expressed proteins was estimated using receiver operating characteristic (ROC) curve analysis. GraphPad Prism 9.0 was used for all statistical analyses.
Results
Clinical Characteristics of Participants
In total, 21 active vitiligo patients were enrolled, including 11 patients in proteomics group and 10 in validation group. The age of patients in proteomics group ranged from 13 to 57 years with a mean age of 28.45 ± 13.71 years; while the age of patients in validation group ranged from 12 to 62 years with a mean age of 31.50 ± 17.61 years. The mean disease duration was 2.64 ± 1.80 and 2.82 ± 2.79 years in proteomics and validation groups, respectively. In the proteomics group, 2 patients had relatives with vitiligo. Two patients in validation group had other comorbidities (autoimmune thyroiditis and alopecia areata). The age or gender of healthy volunteers was comparable to that of vitiligo patients. Relevant data are summarized in Table 1.
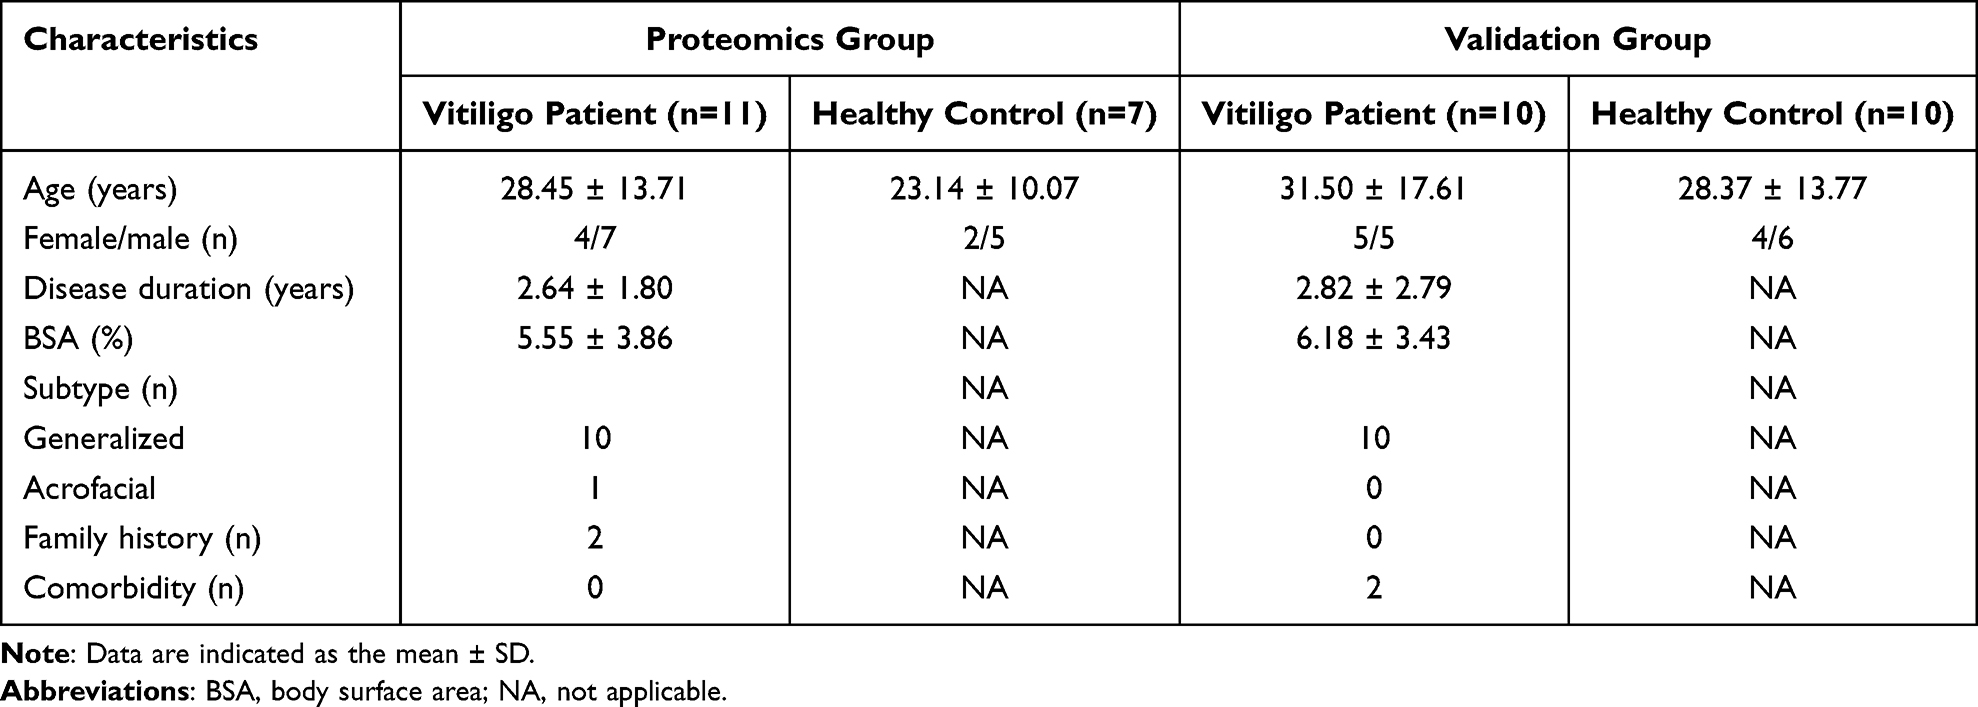 |
Table 1 Demographics of Vitiligo Patients and Healthy Controls |
Overview of Proteomic Profiling
Figure 1 depicts the experimental and computational scheme for TMT proteome profiling. Total proteins were extracted from serums, then their quality was assessed using SDS-PAGE. After trypsin digestion and TMT labeling, the samples were then divided into equal parts and mixed for chromatographic separation before being analyzed using LC-MS/MS. A volcano plot and heat map were generated to show the differential expression of proteins while pathway enrichment analysis was conducted to predict the possible function of these differentially expressed proteins.
 |
Figure 1 Workflow of proteomic profiling. The proteins were extracted from serum, followed by SDS-PAGE quality testing, trypsin digestion, and TMT labeling. The samples were then taken in equal parts and mixed for chromatographic separation before being subjected to LC-MS/MS analysis and bioinformatic analysis. Abbreviations: SDS-PAGE, sodium dodecyl-sulfate polyacrylamide gel electrophoresis; TMT, tandem mass tags; LC-MS/MS, liquid chromatography-tandem mass spectrometry. |
Differentially Expressed Proteins in Non-Segmental Vitiligo Patients
Out of the 1019 proteins, 31 differentially expressed proteins (DEPs) were identified using “P < 0.05, fold change > 1.2” as a cutoff, with 21 proteins upregulated and 10 proteins downregulated in the vitiligo group compared with the levels of that in the healthy control group (Figure 2A). A heat map was generated to display the differential expression level of each protein (Figure 2B). The upregulated proteins were aldehyde dehydrogenase 1A1 (ALDH1A1), elongation factor 2 (EEF2), proteasome subunit alpha type-2 (PSMA2), elongation factor 1-gamma (EEF1G), adenosylhomocysteinase (AHCY), proteasome subunit alpha type-5 (PSMA5), serine/threonine-protein phosphatase 6 catalytic subunit (PPP6C), elongation factor 1-alpha 1 (EEF1A1), lupus La protein (SSB), D-3-phosphoglycerate dehydrogenase (PHGDH), proteasome subunit beta type-5 (PSMB5), synaptic vesicle membrane protein VAT-1 homolog (VAT1), keratin, type I cytoskeletal 18 (KRT18), cytosolic non-specific dipeptidase (CNDP2), alanine--tRNA ligase, cytoplasmic (AARS1), importin-7 (IPO7), immunoglobulin heavy variable 3–48 (IGHV3-48), kinectin (KTN1), 60S ribosomal protein L31 (RPL31), myeloid-derived growth factor (MYDGF), and aspartate aminotransferase, cytoplasmic (GOT1). Whereas the downregulated proteins included leukocyte immunoglobulin-like receptor subfamily A member 3 (LILRA3), HLA class I histocompatibility antigen (HLA-A), haptoglobin-related protein (HPR), immunoglobulin heavy variable 1–46 (IGHV1-46), plastin-2 (LCP1), ICOS ligand (ICOSLG), inhibin beta C chain (INHBC), HIG1 domain family member 1A, mitochondrial (HIGD1A), immunoglobulin heavy variable 1–18 (IGHV1-18), FERM and PDZ domain-containing protein 1 (FRMPD1). ALDH1A1, EEF2, PSMA2, and EEF1G were the top 4 dysregulated proteins with the highest foldchange level. Scatter plots were used to visualize the expression levels of these proteins in vitiligo and healthy group based on abundances detected in the serum proteomic profiling (Figure 2C).
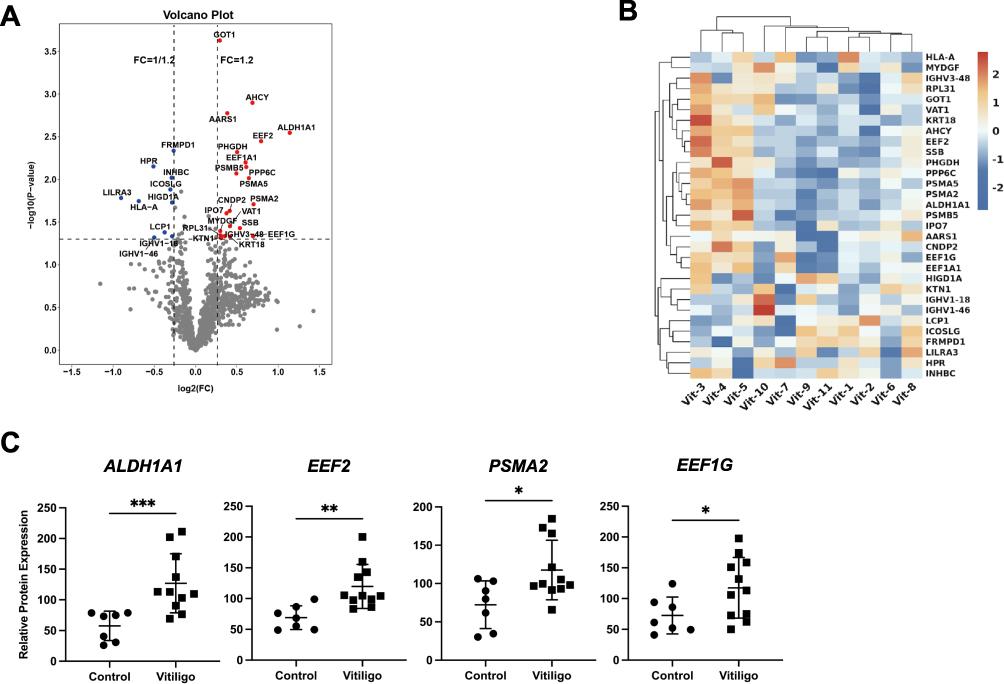 |
Figure 2 DEPs detected in the serum of vitiligo patients and healthy control. (A) DEPs were identified using “fold change > 1.2 and P value < 0.05” as a cutoff. Upregulated proteins were shown in red, while downregulated proteins were in blue. (B) Hierarchical Clustering analysis of DEPs in vitiligo patients based on Log2 fold change to healthy control. (C) Protein expression levels of ALDH1A1, EEF2, PSMA2, and EEF1G detected by serum proteomic profiling in vitiligo patients and healthy control. *P<0.05, **P<0.01, ***P<0.001. Abbreviations: DEPs, differentially expressed proteins; FC, fold change; ALDH1A1, aldehyde dehydrogenase 1A1; EEF2, elongation factor 2; PSMA2, proteasome subunit alpha type-2; EEF1G, elongation factor 1-gamma. |
PPI Network Construction of DEPs
The network of PPI among DEPs was constructed using the STRING database to demonstrate how these vitiligo DEPs were connected. The size of hub genes indicated the interactive degree of DEPs in the PPI network (Figure 3A). The top 5 hub genes were EEF1G, EEF2, EEF1A1, AHCY, and PSMA2 according to their interactive degree with other DEPs. The scatter plots of these proteins’ expression levels by serum proteomic profiling were shown in Figures 2C and 3B.
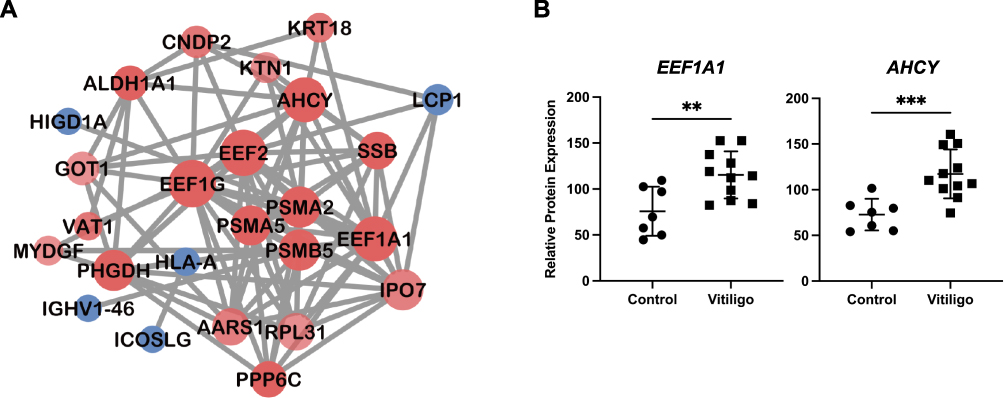 |
Figure 3 PPI network of DEPs. (A) PPI network of vitiligo DEPs constructed based on STRING database. Upregulated proteins were shown in red, while downregulated proteins were in blue. The transparency of nodes indicated the fold-change of proteins, while size of nodes represented the connections with other proteins. (B) The expression level of EEF1A1 and AHCY detected by serum proteomic profiling. **P<0.01, ***P<0.001. Abbreviations: PPI, protein–protein interaction; DEPs, differentially expressed proteins; EEF1A1, elongation factor 1-alpha 1; AHCY, adenosylhomocysteinase. |
Pathway Enrichment Analysis of DEPs
The enrichment analysis of GO terms was performed to predict the possible biological function of DEPs, including terms of biological process, cellular component, and molecular function (Figure 4A). The top 5 terms of biological process predicted included translational elongation, proteasomal ubiquitin-independent protein catabolic process, positive regulation of B cell activation, phagocytosis, recognition, and innate immune response. Extracellular exosome was the most significantly indicated cellular component term, followed by proteasome core complex, alpha-subunit complex, proteasome core complex, secretory granule lumen, and ficolin-1-rich granule lumen. The highlighted items in molecular function included NAD binding and immunoglobulin receptor binding, translation elongation factor activity, tRNA binding, and endopeptidase activity.
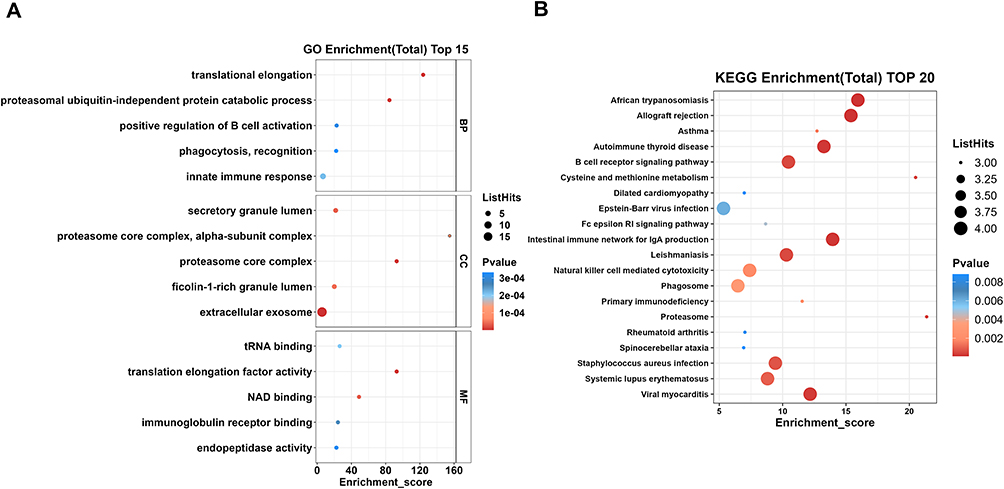 |
Figure 4 GO and KEGG pathway enrichment of DEPs. (A) Bubble plots for top 15 GO terms. Top 5 terms for each category: biological process, cellular component, and molecular function. (B) Top 20 pathways in KEGG enrichment of DEPs. The enrichment score was calculated using the number of annotated genes in this pathway as well as the total number of annotated genes. The size of the plot indicated the number of altered proteins each term containing, while the color of the plot represented the level of the P-value. Abbreviations: GO, Gene Ontology; KEGG, Kyoto Encyclopedia of Genes and Genomes; DEPs, differentially expressed proteins. |
To identify the distinguished pathways in vitiligo patients, KEGG analysis was performed. Twenty significant pathways with P values < 0.002 were observed (Figure 4B). In terms of enrichment score, the proteasome and cysteine and methionine metabolism were the top two altered pathways in vitiligo patients. Apart from them, other immune-related pathways were also identified, such as allograft rejection, intestinal immune network for IgA production, autoimmune thyroid disease, asthma, primary immunodeficiency, B cell receptor signaling pathway, systemic lupus erythematosus, Fc epsilon RI signaling pathway, natural killer cell mediated cytotoxicity, and rheumatoid arthritis, emphasizing the importance of immune response in the pathogenesis of vitiligo.
ALDH1A1 and EEF1G Exhibited Diagnostic Potential for Vitiligo Patients
To reveal the differential capacity of altered proteins in the serum from vitiligo patients, ROC curve analysis was conducted. ALDH1A1 and EEF1G were good with AUCs of 0.9221 and 0.8571, respectively (Figure 5A). To validate the diagnostic potential of the above 2 DEPs, we detected the expression level of ALDH1A1 and EEF1G in 10 other vitiligo patients. As a result, we showed that the expression level of ALDH1A1 and EEF1G were higher in the serum of vitiligo patients than that of healthy controls (Figure 5B).
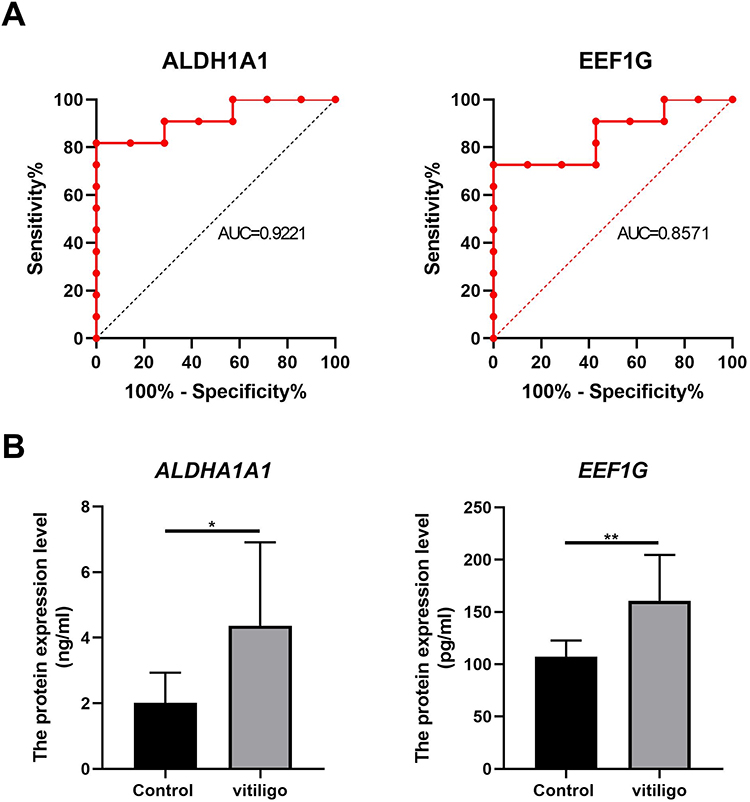 |
Figure 5 ROC analysis and validation of potential biomarkers for vitiligo. (A) The ROC curve of ALDH1A1 and EEF1G. ALDH1A1 showed an AUC of 0.9221. EEF1G presented an AUC of 0.8571. (B) The expression level of ALDH1A1 and EEF1G in validation group by ELISA assay. *P<0.05, **P<0.01. Abbreviations: ROC, receiver-operating characteristic; ALDH1A1, aldehyde dehydrogenase 1A1; EEF1G, elongation factor 1-gamma; AUC, area under the ROC curve; ELISA, enzyme-linked immunosorbent assay. |
Discussion
In this study, we presented the serum proteomic profile of vitiligo patients, which may provide a hint about its pathogenesis and indicate the potential functional molecules and biomarkers for this disease.
Thirty-one (21 upregulated and 10 downregulated) DEPs were detected, and ALDH1A1 was the most upregulated protein in vitiligo group according to fold change level. ALDH1A1 has been reported to catalyze the conversion of 9-cis retinal to 9-cis retinoic acid,11 and the latter could inhibit melanogenesis via downregulation of TYR, TRP-1, and TRP-2.12–16 Besides, ALDH1A1 per se has also been reported to impact melanogenesis via MITF and TYR mRNA expression regulation in human cells.17 However, Paterson and others suggested that 9-cis retinoic acid led to the accumulation of MITF mRNA and TYR mRNA, and melanin production.11 Though the exact mechanism remained unclear, we supposed that ALDH1A1 played an important role in vitiligo pathogenesis. As previously reported, AHCY is a potential vitiligo susceptibility loci18–20 and transcriptional regulators in vitiligo.21 Our data showed an upregulation of AHCY protein expression in the vitiligo group supporting the role of AHCY in vitiligo onset from a proteomic standpoint.
In addition, the upregulation of nuclear antigen SSB in vitiligo patients may also participate in the pathogenesis of active vitiligo. A previous study reported SSB as one of the nuclear antigens translocated to apoptotic bodies during oxidative stress-induced apoptosis of vitiligo melanocytes.22
It has been reported that the frequency of HLA-A*2501, -A*30 were significantly increased, while the frequency of HLA-A*66 was decreased in Chinese vitiligo patients.23 Consistent with this evidence, our data revealed that HLA-A protein expression was downregulated in vitiligo patients of Chinese Han population. However, the results of HLA-A investigation were not consistent in Japanese, Slovak, and Italian patients,24–26 indicating that the association between HLA-A genetic markers and vitiligo varies depending on the different race and ethnic background.
Our data showed the upregulation of GOT1, a participant in phenylalanine, tyrosine, and tryptophan metabolism in vitiligo patients. Tyrosine is commonly accepted to be involved in the canonical melanin synthesis process. Besides, some reports indicated tryptophan as a non-canonical melanin precursor.27 Tryptophan metabolites, 6-formylindolo[3,2-b]carbazole (FICZ) has been reported to activate the aryl hydrocarbon receptor (AhR) in melanocytes, and then caused tanning responses.28 Our data reinforced the role of GOT1 and phenylalanine, tyrosine, and tryptophan metabolism in vitiligo patients.
Previous studies suggested that EEF1G played a role in the extracellular exosome processes.29,30 Besides, 18 of 31 DEPs detected in this study were enriched in the extracellular exosome pathway. In the past decades, emerging evidence showed that exosomes played important roles in the pathogenesis of vitiligo, including immune regulation, melanocyte-keratinocyte interactions, and melanogenesis. The exosome was reported not only necessary for the regulation of CD8+ T, Treg, and Th17 cells,31–34 but involved in melanosome transfer and other forms of melanocyte-keratinocyte interactions.35–38 These results implied that the upregulation of EEFG1 might somehow be involved in vitiligo pathogenesis via extracellular exosome pathway.
Other enriched GO terms worth noting included NAD binding and immunoglobulin receptor binding. Three DEPs identified in this research, namely ALDH1A1, PHGDH, and AHCY, were enriched in NAD binding pathway. It was not surprising to find NAD binding altered in vitiligo patients in our study since it was associated with oxidative stress, an acknowledged contributor to the pathogenesis of vitiligo.39,40 The immune response is a constant theme in vitiligo etiology research. Previous research has pointed out the alterations in immunoglobulins in vitiligo,41,42 which was consistent with the change we found in immunoglobulin receptor binding in the present study.
KEGG enrichment analysis highlighted the cysteine and methionine metabolism pathway. The former mentioned DEP, GOT1, also participates in the cysteine and methionine metabolism pathway. Methionine and cysteine metabolism enrichment has been found in vitiligo patients through urinary metabolomics.43 Our data demonstrated the same finding from a serum proteomic observation. It was reported that methionine and cysteine metabolism might take part in the progression of vitiligo in an oxidative-stress-mediated manner.44
Moreover, results of AUC analysis showed that ALDH1A1 and EEF1G could be potential vitiligo biomarkers. The EEF1G was engaged in the extracellular exosome process, while ALDH1A1 was involved in retinoic acid conversion, reinforcing the roles of retinoic acid and exosome in vitiligo pathogenesis. However, the mechanism that these proteins actually participate in the development of vitiligo remained to be further elucidated.
There were some limitations in the present study. First of all, the sample size of participants was small which was partially because we used TMT assay. The advantages of TMT method are excellent replicability and wider range of proteins detection. However, the major disadvantage of TMT method is sample size limitation. The TMT system enabled up to 18 samples each time. And if conducting TMT analysis in batches, some important proteins might be missed because data need to be correct to minimize batch effects. But, it is true that the small sample size is the limitation of this study, and we would like to validate our results on a larger cohort in the future. In addition, although study on serum may represent the systemic changes, proteomics of lesional skin may provide a more intuitive perspective in functional protein screening in vitiligo. Thus, further investigation of protein expression in lesional skin and their correlation with serum altered proteins is needed. The study conclusions were drawn in the context of Chinese Han population, so caution must be applied when it comes to other ethnicities.
Conclusion
In this study, several DEPs and associated pathways in the serum of active vitiligo patients were detected. ALDH1A1 and EEF1G could be potential active vitiligo biomarkers, and also reinforced the roles of retinoic acid and exosome processes in the vitiligo pathogenesis.
Ethics Approval and Informed Consent
This study was approved by the Shanghai General Hospital’s ethics committee. Consent to participant was acquired before recruitment from each participant.
Acknowledgments
This study was supported by Innovative Research Team of High-level Local Universities in Shanghai.
Funding
This research did not receive any specific grant from funding agencies in the public, commercial, or not-for-profit sectors.
Disclosure
The authors report no conflicts of interest in this work.
References
1. Ezzedine K, Eleftheriadou V, Whitton M, van Geel N. Vitiligo. Lancet. 2015;386(9988):74–84. doi:10.1016/s0140-6736(14)60763-7
2. Linthorst Homan MW, Spuls PI, de Korte J, Bos JD, Sprangers MA, van der Veen JP. The burden of vitiligo: patient characteristics associated with quality of life. J Am Acad Dermatol. 2009;61(3):411–420. doi:10.1016/j.jaad.2009.03.022
3. Salzes C, Abadie S, Seneschal J, et al. The Vitiligo Impact Patient Scale (VIPs): development and validation of a vitiligo burden assessment tool. J Invest Dermatol. 2016;136(1):52–58. doi:10.1038/jid.2015.398
4. Thatte SS, Khopkar US. The utility of dermoscopy in the diagnosis of evolving lesions of vitiligo. Indian J Dermatol Venereol Leprol. 2014;80(6):505–508. doi:10.4103/0378-6323.144144
5. Colucci R, Arunachalam M, Dragoni F, Galeone M, Berti S, Moretti S. Misdiagnosis and patient negation: a case of universal vitiligo. Eur J Dermatol. 2012;22(3):423–424. doi:10.1684/ejd.2012.1708
6. Harris JE, Harris TH, Weninger W, Wherry EJ, Hunter CA, Turka LA. A mouse model of vitiligo with focused epidermal depigmentation requires IFN-γ for autoreactive CD8+ T-cell accumulation in the skin. J Invest Dermatol. 2012;132(7):1869–1876. doi:10.1038/jid.2011.463
7. Rashighi M, Agarwal P, Richmond JM, et al. CXCL10 is critical for the progression and maintenance of depigmentation in a mouse model of vitiligo. Sci Transl Med. 2014;6(223):223ra23. doi:10.1126/scitranslmed.3007811
8. Richmond JM, Bangari DS, Essien KI, et al. Keratinocyte-derived chemokines orchestrate T-cell positioning in the epidermis during vitiligo and may serve as biomarkers of disease. J Invest Dermatol. 2017;137(2):350–358. doi:10.1016/j.jid.2016.09.016
9. Jian Z, Li K, Song P, et al. Impaired activation of the Nrf2-ARE signaling pathway undermines H2O2-induced oxidative stress response: a possible mechanism for melanocyte degeneration in vitiligo. J Invest Dermatol. 2014;134(8):2221–2230. doi:10.1038/jid.2014.152
10. Spritz RA. The genetics of generalized vitiligo. Curr Dir Autoimmun. 2008;10:244–257. doi:10.1159/000131501
11. Paterson EK, Ho H, Kapadia R, Ganesan AK. 9-cis retinoic acid is the ALDH1A1 product that stimulates melanogenesis. Exp Dermatol. 2013;22(3):202–209. doi:10.1111/exd.12099
12. Roméro C, Aberdam E, Larnier C, Ortonne JP. Retinoic acid as modulator of UVB-induced melanocyte differentiation. Involvement of the melanogenic enzymes expression. J Cell Sci. 1994;107(4):1095–1103. doi:10.1242/jcs.107.4.1095
13. Sato K, Morita M, Ichikawa C, Takahashi H, Toriyama M. Depigmenting mechanisms of all-trans retinoic acid and retinol on B16 melanoma cells. Biosci Biotechnol Biochem. 2008;72(10):2589–2597. doi:10.1271/bbb.80279
14. Kasraee B, Fallahi MR, Ardekani GS, et al. Retinoic acid synergistically enhances the melanocytotoxic and depigmenting effects of monobenzylether of hydroquinone in black guinea pig skin. Exp Dermatol. 2006;15(7):509–514. doi:10.1111/j.1600-0625.2006.00441.x
15. Hu N, Yi Q, Wang X, Wang L. Irritant contact dermatitis, multiple pyogenic granulomas and vitiligo following topical application of tretinoin. Dermatol Ther. 2020;33(6):e13966. doi:10.1111/dth.13966
16. Nair X, Parab P, Suhr L, Tramposch KM. Combination of 4-hydroxyanisole and all-trans retinoic acid produces synergistic skin depigmentation in swine. J Invest Dermatol. 1993;101(2):145–149. doi:10.1111/1523-1747.ep12363627
17. Ganesan AK, Ho H, Bodemann B, et al. Genome-wide siRNA-based functional genomics of pigmentation identifies novel genes and pathways that impact melanogenesis in human cells. PLoS Genet. 2008;4(12):e1000298. doi:10.1371/journal.pgen.1000298
18. Jin Y, Andersen G, Yorgov D, et al. Genome-wide association studies of autoimmune vitiligo identify 23 new risk loci and highlight key pathways and regulatory variants. Nat Genet. 2016;48(11):1418–1424. doi:10.1038/ng.3680
19. Tang X, Fang F, Yang J, et al. Association study reveals one susceptibility locus with vitiligo in the Chinese Han population. Genet Test Mol Biomarkers. 2019;23(11):791–796. doi:10.1089/gtmb.2019.0129
20. Wu W, Amos CI, Lee JE, Wei Q, Sarin KY, Han J. Inverse relationship between vitiligo-related genes and skin cancer risk. J Invest Dermatol. 2018;138(9):2072–2075. doi:10.1016/j.jid.2018.03.1511
21. Dey-Rao R, Sinha AA. Interactome analysis of gene expression profile reveals potential novel key transcriptional regulators of skin pathology in vitiligo. Genes Immun. 2016;17(1):30–45. doi:10.1038/gene.2015.48
22. Tian J, Wang Y, Ding M, et al. The formation of melanocyte apoptotic bodies in vitiligo and the relocation of vitiligo autoantigens under oxidative stress. Oxid Med Cell Longev. 2021;2021:7617839. doi:10.1155/2021/7617839
23. Zhang XJ, Liu HS, Liang YH, et al. Association of HLA class I alleles with vitiligo in Chinese Hans. J Dermatol Sci. 2004;35(2):165–168. doi:10.1016/j.jdermsci.2004.05.003
24. Ando I, Chi HI, Nakagawa H, Otsuka F. Difference in clinical features and HLA antigens between familial and non-familial vitiligo of non-segmental type. Br J Dermatol. 1993;129(4):408–410. doi:10.1111/j.1365-2133.1993.tb03167.x
25. Buc M, Busová B, Hegyi E, Kolibásová K. Vitiligo is associated with HLA-A2 and HLA-Dw7 in the slovak populations. Folia Biol. 1996;42(1–2):23–25.
26. Orecchia G, Perfetti L, Malagoli P, Borghini F, Kipervarg Y. Vitiligo is associated with a significant increase in HLA-A30, Cw6 and DQw3 and a decrease in C4AQ0 in northern Italian patients. Dermatology. 1992;185(2):123–127. doi:10.1159/000247426
27. Ahmad S, Mohammed M, Mekala LP, Chintalapati S, Chintalapati VR. Tryptophan, a non-canonical melanin precursor: new L-tryptophan based melanin production by rubrivivax benzoatilyticus JA2. Sci Rep. 2020;10(1):8925. doi:10.1038/s41598-020-65803-6
28. Jux B, Kadow S, Luecke S, Rannug A, Krutmann J, Esser C. The aryl hydrocarbon receptor mediates UVB radiation-induced skin tanning. J Invest Dermatol. 2011;131(1):203–210. doi:10.1038/jid.2010.269
29. Burke M, Choksawangkarn W, Edwards N, Ostrand-Rosenberg S, Fenselau C. Exosomes from myeloid-derived suppressor cells carry biologically active proteins. J Proteome Res. 2014;13(2):836–843. doi:10.1021/pr400879c
30. Chaput N, Théry C. Exosomes: immune properties and potential clinical implementations. Semin Immunopathol. 2011;33(5):419–440. doi:10.1007/s00281-010-0233-9
31. Wang X, Shen H, He Q, Tian W, Xia A, Lu XJ. Exosomes derived from exhausted CD8+ T cells impaired the anticancer function of normal CD8+ T cells. J Med Genet. 2019;56(1):29–31. doi:10.1136/jmedgenet-2018-105439
32. Okoye IS, Coomes SM, Pelly VS, et al. MicroRNA-containing T-regulatory-cell-derived exosomes suppress pathogenic T helper 1 cells. Immunity. 2014;41(1):89–103. doi:10.1016/j.immuni.2014.05.019
33. Kimura K, Hohjoh H, Fukuoka M, et al. Circulating exosomes suppress the induction of regulatory T cells via let-7i in multiple sclerosis. Nat Commun. 2018;9(1):17. doi:10.1038/s41467-017-02406-2
34. Li Y, Wang F, Guo R, et al. Exosomal sphingosine 1-phosphate secreted by mesenchymal stem cells regulated Treg/Th17 balance in aplastic anemia. IUBMB Life. 2019;71(9):1284–1292. doi:10.1002/iub.2035
35. Blanc L, Vidal M. New insights into the function of Rab GTPases in the context of exosomal secretion. Small GTPases. 2018;9(1–2):95–106. doi:10.1080/21541248.2016.1264352
36. Liu Y, Xue L, Gao H, et al. Exosomal miRNA derived from keratinocytes regulates pigmentation in melanocytes. J Dermatol Sci. 2019;93(3):159–167. doi:10.1016/j.jdermsci.2019.02.001
37. Lo Cicero A, Delevoye C, Gilles-Marsens F, et al. Exosomes released by keratinocytes modulate melanocyte pigmentation. Nat Commun. 2015;6:7506. doi:10.1038/ncomms8506
38. Kim NH, Choi SH, Kim CH, Lee CH, Lee TR, Lee AY. Reduced MiR-675 in exosome in H19 RNA-related melanogenesis via MITF as a direct target. J Invest Dermatol. 2014;134(4):1075–1082. doi:10.1038/jid.2013.478
39. Zalba G, San José G, Moreno MU, et al. Oxidative stress in arterial hypertension: role of NAD(P)H oxidase. Hypertension. 2001;38(6):1395–1399. doi:10.1161/hy1201.099611
40. Passi S, Grandinetti M, Maggio F, Stancato A, De Luca C. Epidermal oxidative stress in vitiligo. Pigment Cell Res. 1998;11(2):81–85. doi:10.1111/j.1600-0749.1998.tb00714.x
41. Kemp EH, Gavalas NG, Gawkrodger DJ, Weetman AP. Autoantibody responses to melanocytes in the depigmenting skin disease vitiligo. Autoimmun Rev. 2007;6(3):138–142. doi:10.1016/j.autrev.2006.09.010
42. Ali R, Ahsan MS, Azad MA, et al. Immunoglobulin levels of vitiligo patients. Pak J Pharm Sci. 2010;23(1):97–102.
43. Liu W, Liu XY, Qian YT, et al. Urinary metabolomic investigations in vitiligo patients. Sci Rep. 2020;10(1):17989. doi:10.1038/s41598-020-75135-0
44. Schallreuter KU, Rübsam K, Gibbons NC, et al. Methionine sulfoxide reductases A and B are deactivated by hydrogen peroxide (H2O2) in the epidermis of patients with vitiligo. J Invest Dermatol. 2008;128(4):808–815. doi:10.1038/sj.jid.5701100
 © 2023 The Author(s). This work is published and licensed by Dove Medical Press Limited. The
full terms of this license are available at https://www.dovepress.com/terms
and incorporate the Creative Commons Attribution
- Non Commercial (unported, 3.0) License.
By accessing the work you hereby accept the Terms. Non-commercial uses of the work are permitted
without any further permission from Dove Medical Press Limited, provided the work is properly
attributed. For permission for commercial use of this work, please see paragraphs 4.2 and 5 of our Terms.
© 2023 The Author(s). This work is published and licensed by Dove Medical Press Limited. The
full terms of this license are available at https://www.dovepress.com/terms
and incorporate the Creative Commons Attribution
- Non Commercial (unported, 3.0) License.
By accessing the work you hereby accept the Terms. Non-commercial uses of the work are permitted
without any further permission from Dove Medical Press Limited, provided the work is properly
attributed. For permission for commercial use of this work, please see paragraphs 4.2 and 5 of our Terms.
Recommended articles
Peripheral Complement Factor-Based Biomarkers for Patients with First-Episode Schizophrenia
Cao Y, Xu Y, Xia Q, Shan F, Liang J
Neuropsychiatric Disease and Treatment 2023, 19:1455-1462
Published Date: 23 June 2023
Serum ATIC Expression as a Novel Diagnostic and Prognostic Biomarker in Multiple Myeloma Patients
Gu M, Zheng Y, Wang Y, Wang Q, Wu J, Xiong Z, Nong Y, Huang C, Li Z, Luo J, Ling Z, Li R
Blood and Lymphatic Cancer: Targets and Therapy 2025, 15:133-147
Published Date: 30 August 2025
Diagnostic Roles of circXPNPEP3 as Biomarker for Diabetic Nephropathy
Liu M, Zhan Q, Zhu J, Zhao J, Min D
Diabetes, Metabolic Syndrome and Obesity 2025, 18:4287-4297
Published Date: 17 November 2025
Circulating miR-148a-3p Correlates with Inadequate Induction Response in Pediatric Hodgkin Lymphoma
Rohde M, Singh VK, Wolfermann A, Burkhardt B, Blattmann C, Steinbach D, Schneider DT, Ebinger M, Maecker-Kolhoff B, Braun M, Kurch L, Mauz-Körholz C, Körholz D
ImmunoTargets and Therapy 2026, 15:577426
Published Date: 1 April 2026