Back to Journals » Clinical Epidemiology » Volume 14
Routine Clinical Care Creatinine Data in Denmark – An Epidemiological Resource for Nationwide Population-Based Studies of Kidney Disease
Authors Jensen SK ![]() , Heide-Jørgensen U
, Heide-Jørgensen U ![]() , Vestergaard SV
, Vestergaard SV ![]() , Sørensen HT
, Sørensen HT ![]() , Christiansen CF
, Christiansen CF ![]()
Received 23 August 2022
Accepted for publication 4 November 2022
Published 22 November 2022 Volume 2022:14 Pages 1415—1426
DOI https://doi.org/10.2147/CLEP.S380840
Checked for plagiarism Yes
Review by Single anonymous peer review
Peer reviewer comments 2
Editor who approved publication: Dr Eyal Cohen
Simon Kok Jensen,1,2 Uffe Heide-Jørgensen,1,2 Søren Viborg Vestergaard,1,2 Henrik Toft Sørensen,1,2 Christian Fynbo Christiansen1,2
1Department of Clinical Epidemiology, Aarhus University Hospital, Aarhus, Denmark; 2Department of Clinical Medicine, Aarhus University, Aarhus, Denmark
Correspondence: Simon Kok Jensen, Department of Clinical Epidemiology, Department of Clinical Medicine, Aarhus University and Aarhus University Hospital, Olof Palmes Allé 43-45, Aarhus, 8200, Denmark, Tel +45 8716 8481, Email [email protected]
Purpose: Creatinine data are key in identifying acute and chronic kidney disease. In Denmark, routine clinical care creatinine data have been collected regionally in the Clinical Laboratory Information System Research Database (LABKA) since the 1990s and nationwide in the Register of Laboratory Results for Research (RLRR) since 2013. Here we describe the geographical coverage of the databases and characteristics of Danish individuals with creatinine tests. This information is pivotal for the design and interpretation of studies using these data to examine kidney disease epidemiology.
Patients and Methods: We included all creatinine tests in LABKA and RLRR from 1990 through 2018. The daily number of creatinine tests by municipality and region of residence were plotted and geographical coverage was ascertained. In addition, we characterized a contemporary cohort of creatinine-tested individuals in 2016– 2018.
Results: During 1990– 2018, 61,011,941 creatinine tests were available for 4,647,966 unique Danish residents. The North Denmark Region was the first region to achieve complete reporting in November 2004, and nationwide reporting was complete starting in October 2015. In each year from 2016 to 2018, more than a third of Danish residents had a recorded creatinine measurement, with the highest proportion of tested individuals aged 77– 87 years and the lowest proportion aged 3– 5 years. During 2016– 2018, the creatinine-tested cohort had a median age of 53 years (IQR, 35– 67 years) and included 54.3% women. The most common comorbidity was a hospital-based diagnosis of hypertension (12.0%), and the most common prescription drug was angiotensin-converting enzyme inhibitors and angiotensin II receptor blockers (15.8%).
Conclusion: In combination, the population-based LABKA and RLRR databases provide regional creatinine data with long follow-up and nationwide data for the Danish population. There was considerable variation in the time of complete geographical coverage by region, which needs to be considered when using these data for studies on kidney disease epidemiology.
Keywords: cohort, creatinine, epidemiology, glomerular filtration rate, kidney disease, registries
Introduction
Kidney diseases represent a heterogeneous group of acute and chronic conditions with high morbidity and mortality.1,2 Chronic kidney disease (CKD) has an estimated global prevalence of 9%,1 and acute kidney injury (AKI) occurs in up to one in five hospitalized patients.3 Both CKD and AKI are associated with an increased risk of cardiovascular disease and mortality.4–6 In the most recent international guidelines, the Kidney Diseases Improving Global Outcomes (KDIGO) defines CKD and AKI based mainly on serum creatinine and urine albumin-creatinine ratio levels.7,8 Routinely collected healthcare data from laboratory databases are therefore increasingly used to study CKD and AKI. This permits more accurate, timely, and complete identification of patients than by use of diagnosis codes.9–12
Denmark has a long tradition of collecting and storing individual-level healthcare information.13 Laboratory data have been collected in the North and Central Denmark Regions since the 1990s,14 in Funen during 2000–2015,12 in the Region of Southern Denmark during 2006–2013,15 and nationwide since 2013.16 The coverage and completeness of recorded creatinine tests in the databases covering Funen and the Region of Southern Denmark have previously been described.12,15 However, similar detailed characteristics of the Clinical Laboratory Information System Research Database (LABKA) covering the North and Central Denmark Regions and the nationwide Register of Laboratory Results for Research (RLRR) have yet to be examined.
Information on database coverage and patient characteristics are pivotal for the accurate interpretation of findings when laboratory data are used for population-based research. Therefore, the purpose of the study was to describe the combined creatinine data from LABKA and RLRR. We aimed to identify the time point when each municipality and region achieved complete reporting to the databases, describe the characteristics of creatinine-tested individuals and the source population, and describe the annual proportions of individuals with a recorded creatinine test.
Materials and Methods
Setting
This study was conducted in Denmark, which has a tax-funded healthcare system allowing for universal access to both general practitioners and specialized care, free of charge.13 Following a 2007 government reform, the number of Danish municipalities was substantially reduced and the country’s five regions (the North Denmark Region, the Central Denmark Region, the Region of Southern Denmark, the Region Zealand, and the Capital Region of Denmark) became the main administrative units overseeing hospitals, general practices, and specialists in private practice.17 When assessing reporting to the laboratory databases by geographical area, we applied the structure of regions and municipalities of 2007 to the entire study period. This allowed us to make our findings relevant to contemporary Denmark.
In 2018, Denmark had a population of 5.8 million residents of whom 0.6 million resided in the North Denmark Region, 1.3 million resided in the Central Denmark Region, 1.2 million resided in the Region of Southern Denmark, 0.8 million resided in the Region Zealand, and 1.8 million resided in the Capital Region of Denmark.18
Creatinine Databases
Conventional venipuncture blood samples from general practices and hospitals in Denmark are analyzed at hospital-based laboratories. Results from these blood samples are then stored in the National Lab Databank (“Den Nationale Labdatabank”), making them available to both the individual who was tested and treating physicians. The data are then transferred to the Register of Laboratory Results (“Laboratoriedatabasen”) and from there to the RLRR (“Laboratoriedatabasens Forskertabel”), which provides data for research through the Danish Health Data Authority.19 In addition to laboratory test results, coded according to the Nomenclature for Properties and Units (NPU), the RLRR contains information on an individual’s unique Civil Personal Register (CPR) number, date and time of sampling, identification codes for the original laboratory and requisitioning physician, unit, and reference intervals.16,19
The regional LABKA database contains laboratory information on blood samples drawn in general practices and hospitals in two of the five Danish regions (the North and Central Denmark Regions) since the 1990s.14 The database contains the same variables as the RLRR and has information on more than 1700 different blood test analyses recorded according to NPU codes and/or by specific analysis numbers.14
Study Cohort
In the cohort of creatinine-tested individuals, we included all individuals with results of one or more plasma creatinine tests in LABKA and RLRR databases from 1 January 1990 until 31 December 2018.14,16 Clinical care creatinine testing is widely used in patients with acute disease and for monitoring chronic diseases such as diabetes, kidney diseases, and cardiovascular diseases. Therefore, individuals with creatinine tests are expected to differ from the general population. To illustrate potential differences in a contemporary cohort, we identified a general population cohort using a monthly 2% random sample of all active CPR numbers belonging to individuals residing in Denmark during 2016–2018.
Individual-Level Linkage to Other Data Sources
All Danish citizens are assigned a unique CPR number at birth or upon immigration.20 This allows for individual-level linkage of data across Danish medical databases such as disease, procedure, prescription, and population registries, which are renowned for their high quality, long recording periods, and completeness.13,21 Examples of databases and registries that can be linked by CPR number are shown in Figure 1. These include:
- The Danish Civil Registration System, which contains the CPR number and data on sex, date of birth, vital status, residence, and immigration status.20,22
- The Danish National Patient Registry, which contains longitudinal information on dates of hospital admission, outpatient clinic visits, treating department and hospital, diagnoses, examinations, and treatments (including dialysis and surgical procedures) for all patients discharged from non-psychiatric hospitals since 1977 and from emergency clinics, outpatient clinics, and psychiatric hospitals since 1995.23
- The Danish National Prescription Registry, which contains individual-level information on all prescriptions for drugs sold in Danish pharmacies or used at nursing homes since 1995.24
- The National Health Insurance Service Registry, which contains nationwide information on health services delivered by health care professionals in the primary health care sector (eg general practitioners, private practice specialists, physiotherapists, dentists, and psychologists) since 1990.25
- The Danish National Pathology Registry, which contains nationwide records of all pathology specimens analyzed in Denmark since 1997 and records from some pathology departments back to the 1970s.26
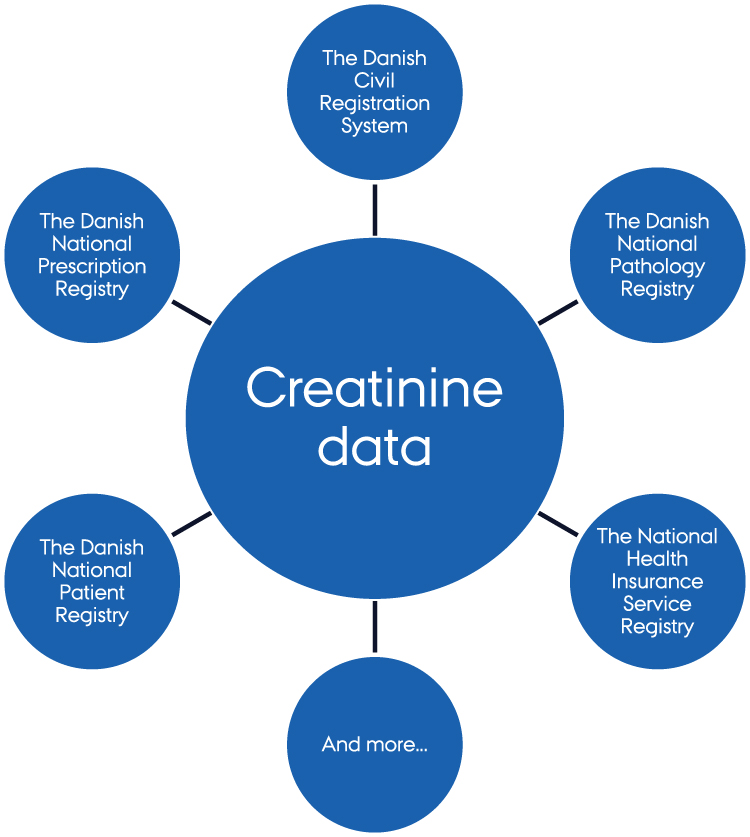 |
Figure 1 Data linkage possibilities. Notes: Creatinine data from the Clinical Laboratory Information System Research Database (LABKA) and the Register of Laboratory Results for Research (RLRR) can be enriched with data from a wide range of nationwide registries. |
Variables
Creatinine test results in LABKA were identified by NPU or local analysis codes and in RLRR by NPU codes. eGFR was calculated based on creatinine, age, and sex using the Chronic Kidney Disease Epidemiology Collaboration (CKD-EPI) equation, assuming non-black race.27 Information on patient characteristics was obtained at the time of the first creatinine test for individuals with a creatinine test in 2016–2018 and at the time of sampling for individuals in the general population cohort. Information about sex and age was obtained from the Danish Civil Registration System.20 We also extracted information on inpatient and outpatient diagnoses within 10 years before the index date,23 prescriptions filled within 90 days before the index date,24 contacts (including in-person visits, telephone calls, and online consultations) with general practitioners,25 and any prior kidney biopsies.26 Location at the time of the test was defined as: 1) inpatient if the patient was admitted or in the emergency room on the day of the test; 2) outpatient if the patient had a visit to an outpatient clinic on the day of the test; and 3) primary care if 1) or 2) were not fulfilled.
Statistical Analyses
To ascertain when each municipality and region achieved complete reporting to the LABKA and RLRR databases, we extracted data on place of residency of all included individuals on 1 January each year from 1990 to 2018. The total number of tests within each municipality and region was computed and plotted against calendar year. We furthermore estimated and plotted the annual proportion of individuals with a creatinine test by region from 2008 to 2018, using census data from Statistics Denmark as the denominators.18 We also plotted the daily number of creatinine tests for each municipality. Achievement of complete geographical coverage was defined as the timepoint when daily numbers of reported test results became stable. Reporting for regions was considered complete when all municipalities within the region achieved complete reporting. Figure S1 illustrates the typical pattern of reporting and the transition from incomplete to complete coverage in a municipality. To support the assessment of complete coverage, we performed a quantitative analysis in which complete coverage in a municipality was defined as the time from which, each month at least 8% of individuals with diabetes had a creatinine test (except for July, which is the principal month of summer vacation in Denmark). We choose 8% per month because current Danish guidelines recommend that all individuals with diabetes have a least one annual creatinine measurement (ie, on average 8% should have a monthly test).28–32 When the quantitative analysis showed a later time of complete coverage than the visual inspection, the plots were reassessed and a consensus on the time point of complete reporting was reached among the authors. The ascertainment of complete reporting was done for the combined data from LABKA and RLRR and in a supplementary analysis for RLRR alone.
When characterizing individuals with a creatinine test and the random sample drawn from the general population in 2016–2018, we present categorical variables as counts with proportions and continuous variables as medians with interquartile range (IQR).
We assessed creatinine test coverage by plotting the proportion of individuals with a creatinine test during 2016–2018 against age as of 1 January 2016 overall and by sex. The denominator for each year of age was defined as the number of residents in each region on 1 January 2016 using census numbers from Statistics Denmark.18 Analyses, with accompanying illustrations, were carried out using SAS version 9.4 (Cary, NC, USA) and R version 4.1.233 including the Tidyverse package.34
Under Danish law, ethics approval and informed consent are not required for registry-based observational studies. In accordance with the General Data Protection Regulation, the study was reported to the Danish Data Protection Agency (record number 2015–57-0002) by registration at Aarhus University (record number 2016–051-000001/812). The pseudonymized data were stored and analyzed on secure servers hosted by the Danish Health Data Authority.
Results
The study cohort included 4,647,966 unique Danish residents with 61,011,941 creatinine tests performed during the 1990–2018 period.
Geographical Coverage
The overall pattern of annual reported tests showed a steady increase from regions reporting to LAKBA (North and Central Denmark Regions), while regions reporting only to RLRR (the Capital Region of Denmark, the Region of Southern Denmark, and the Region Zealand) showed a sudden increase corresponding to the initiation of reporting to that database (Figure 2). The annual number of creatinine tests from the Central Denmark Region increased markedly during the 2000s and continued to increase, though at a lower rate, in the 2010s. The North Denmark Region showed a stable increase in creatinine tests starting around 1997. The Capital Region of Denmark, the Region of Southern Denmark, and the Region Zealand showed a sharp increase in reported creatinine tests, and most municipalities within one of these regions had the same time of reporting onset (Figure 2).
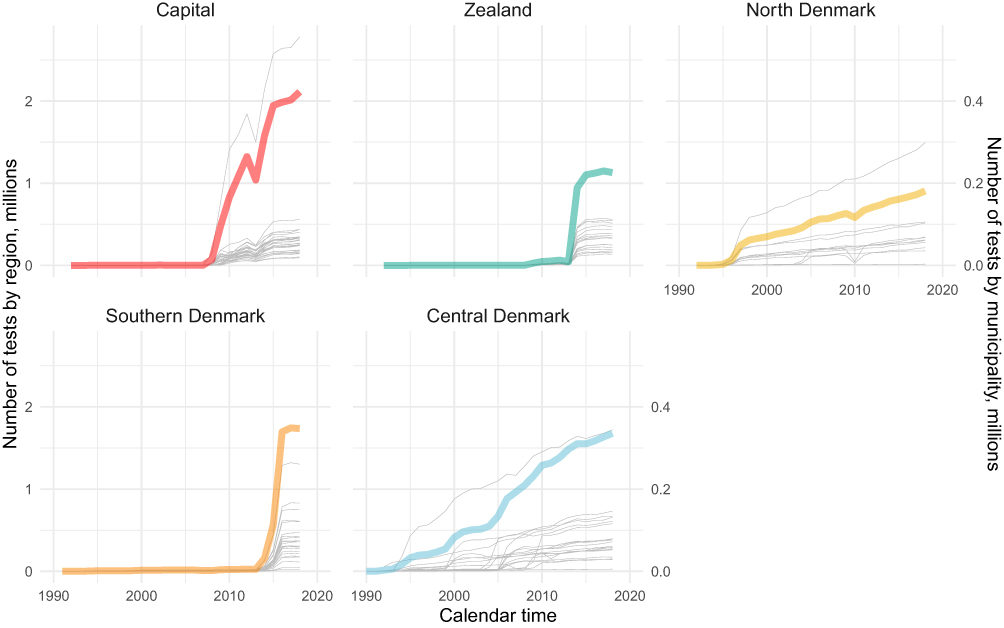 |
Figure 2 Number of creatinine tests in Danish municipalities and regions per year. Notes: The colored lines represent the annual number of tests by region and the gray lines represent the annual number of tests by municipality within the region. The Y-axis shows the annual number of tests in millions. |
Based on visual inspection and the quantitative measure of when each month at least 8% of individuals with diabetes had a creatinine test, the North Denmark Region achieved complete geographical coverage of all municipalities in November 2004 (except for a transient small drop in recorded tests from the municipalities of Thisted and Morsø from September 2009 to March 2011). Using the same approach, the Central Denmark Region achieved complete coverage in November 2009, the Capital Region of Denmark in October 2014, the Region of Southern Denmark in October 2015, and the Region Zealand in February 2014 (Figure 3 and Table S1).
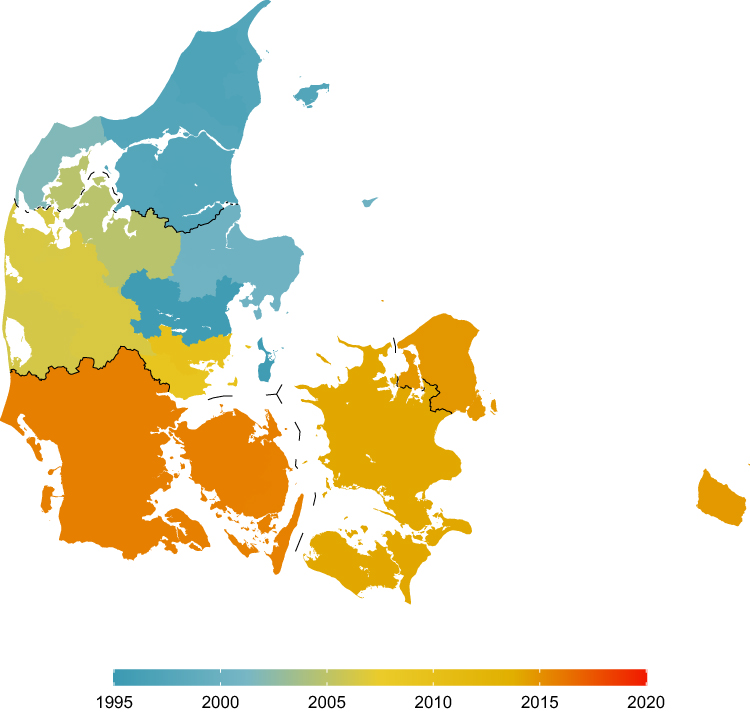 |
Figure 3 Map of Denmark showing the time when complete reporting was achieved by municipality. Notes: The color of the municipality corresponds with the time when complete reporting was achieved. The black lines demarcate the regional borders. |
In recent years, the North and Central Denmark Regions have been reporting to both LABKA and RLRR. However, temporal coverage differs as complete historical data have not been transferred from LABKA to RLRR. When restricting the analysis to data from RLRR, the North Denmark Region shows complete coverage starting in January 2014 and the Central Denmark Region from April 2011 (Table S2).
The annual proportion of individuals with a creatinine test showed a steady increase within all regions after achieving complete coverage (Figure 4 and Table S3). During the 2016–2018 period, when all regions had complete reporting, we found similar annual proportions of individuals with a creatinine test across regions. The Region of Southern Denmark had the highest annual proportion of tested individuals (40.9%-41.8%) and the Capital Region of Denmark had the lowest proportion (33.7%-35.1%) during the period.
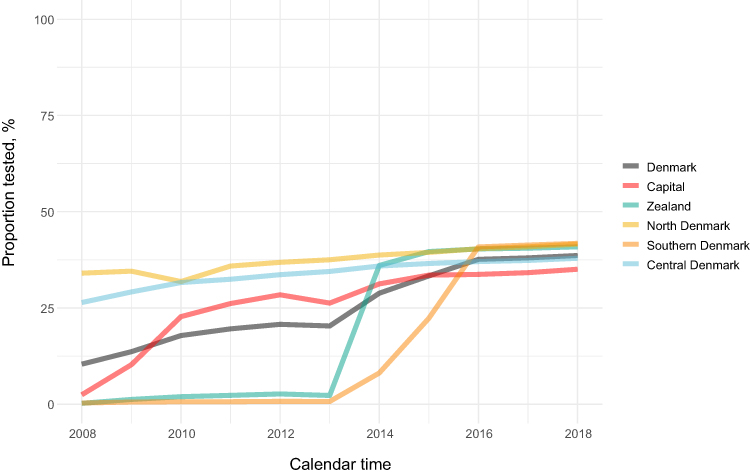 |
Figure 4 Annual proportions of individuals with a recorded creatinine test. |
Characteristics of the Creatinine-Tested Cohort
During the period from 2016 to 2018, 3,403,441 unique Danish residents had a creatinine test (Table 1). Of the 22,186,849 tests performed in the period more than half were done in the primary care setting. Among individuals with a creatinine test, 54.3% were women and the median age was 53 years (IQR, 35–67 years) (Table 1). The median number of tests in the period was 3 (IQR, 1–7) and the median eGFR was 92 mL/min/1.73m2 (IQR, 77–107 mL/min/1.73m2). The most common comorbidity was a hospital-based diagnosis of hypertension (12.0%) and the most common prescription drugs was angiotensin-converting enzyme inhibitors (ACE-I) and angiotensin II receptor blockers (ARBs) (15.8%). During the month leading up to the first creatinine test, 48.3% of individuals had one or more contacts with a general practitioner, 12.0% had one or more hospitalizations, and 4.1% had surgery.
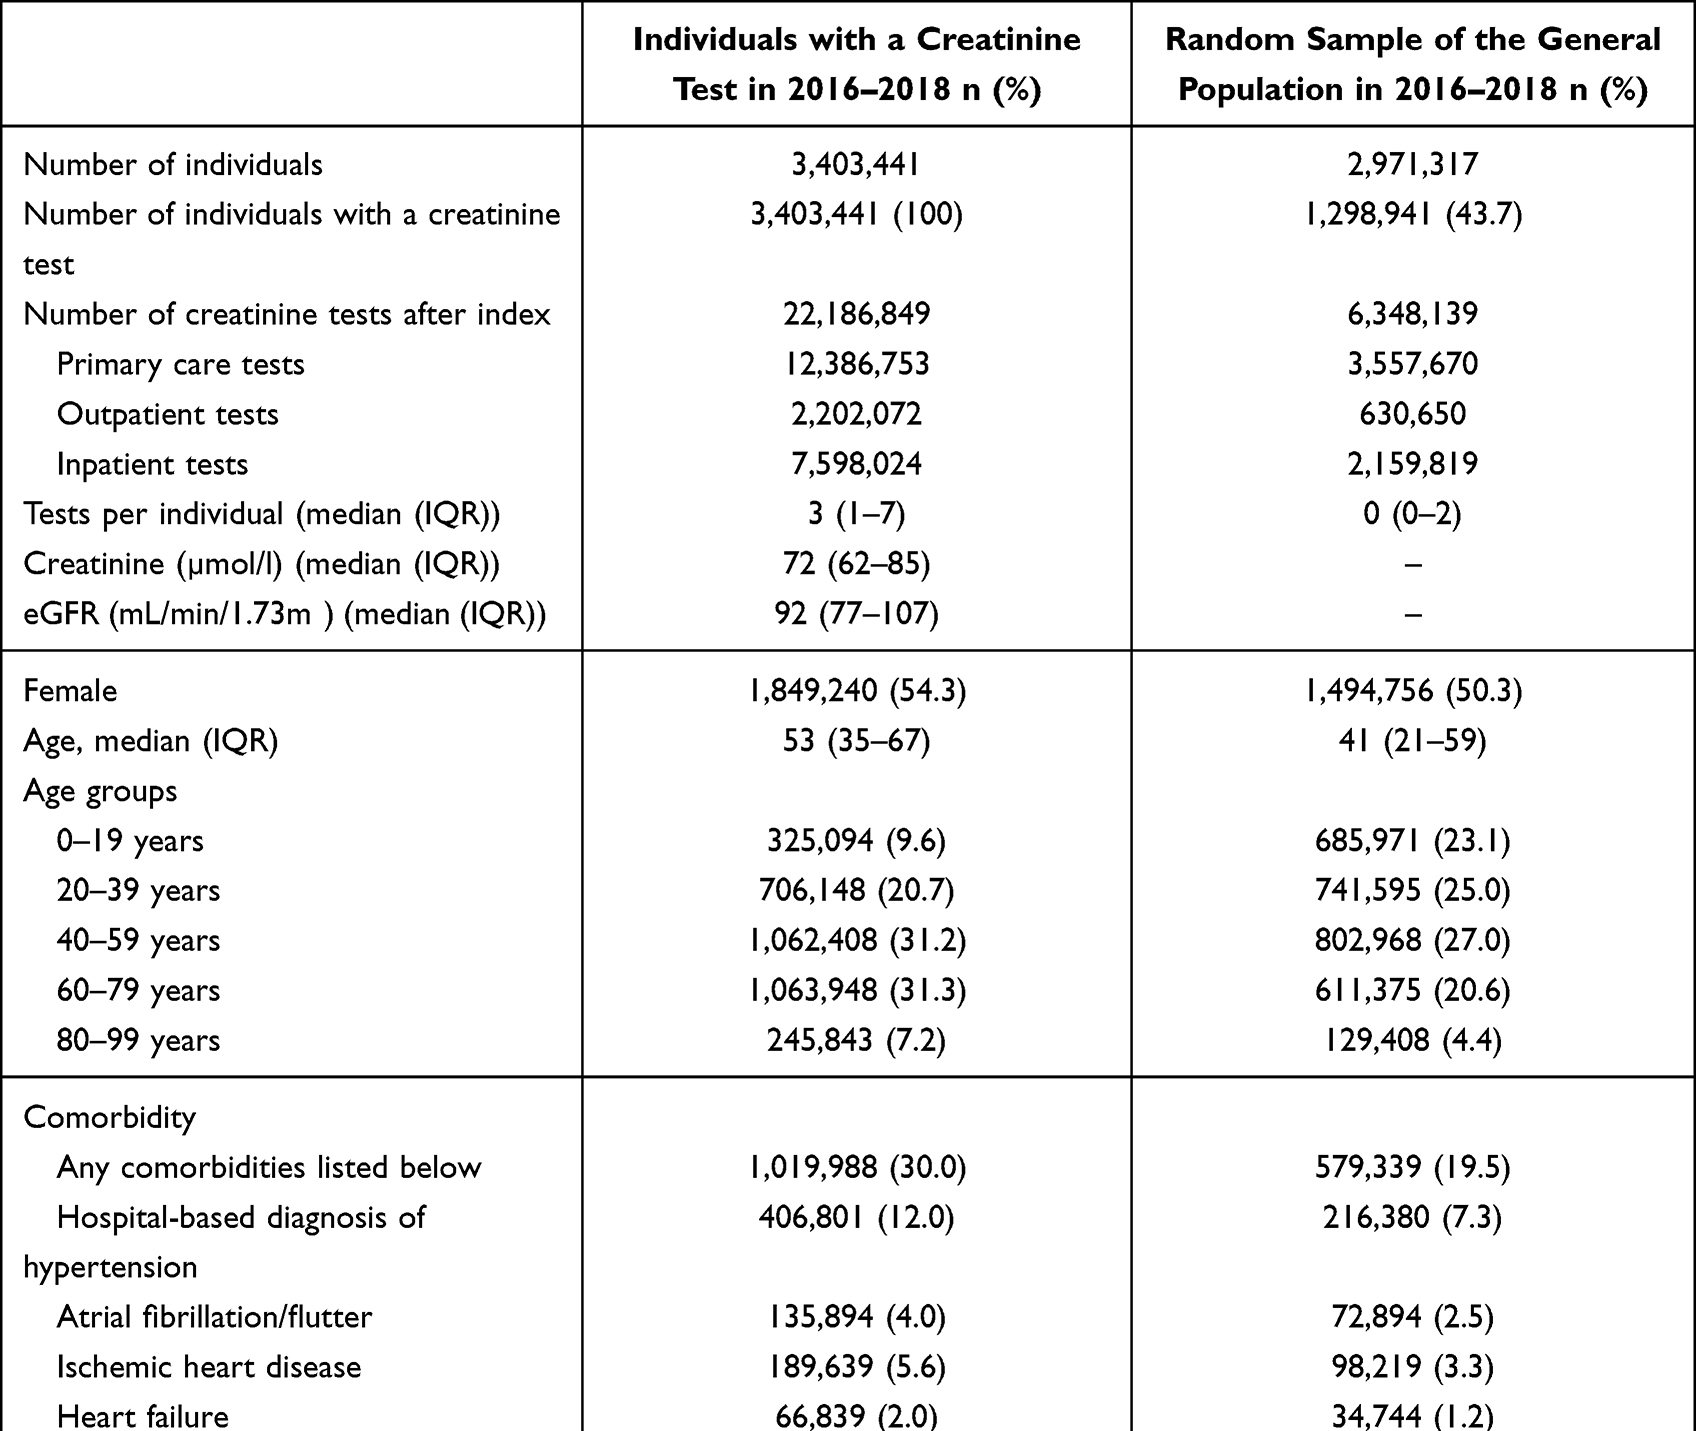 |
Table 1 Characteristics of Individuals with a Creatinine Test and of a Random Sample of the General Population in 2016–2018 |
The random sample from the general population in the 2016–2018 period included 2,971,317 unique residents (Table 1). This cohort included 1,298,941 (43.7%) individuals who had a creatinine test in the period and were therefore also included in the creatinine cohort. Compared with the general population cohort, the cohort of creatinine-tested individuals had a higher proportion of women (54.3% vs 50.3%) and a higher median age (53 vs 41 years) (Table 1). Additionally, individuals with a creatinine test had a higher prevalence of most comorbidities (eg 7.2% vs 4.4% for diabetes) and prescription drug use (eg 67.2% vs 47.0% used any prescription drugs) compared with the general population cohort. Similarly, the proportion of creatinine-tested individuals with a contact with a general practitioner (48.3% vs 30.1%), hospitalization (12.0% vs 1.5%), or surgery within the prior month (4.1% vs 1.8%) was considerably higher than in the general population cohort.
Coverage by Age and Sex
In each year from 2016 to 2018, more than a third of Danish residents had a recorded creatinine measurement (Table S3). The testing patterns as a function of age were similar within all regions (Figure 5). In early childhood, there was generally a low proportion of tested individuals except in the first two years of life. The lowest proportion of tested individuals was found in children aged 3–5 years. Starting in early adulthood, the proportion of tested individuals showed a nearly linear increase, reaching maximum coverage of 94%-96% in persons aged 77–87 years, followed by a sharp decline, especially after age 90. Proportions of tested individuals in the early years of life were similar for males and females, while a higher proportion of females were tested from early adolescence until around 60 years of age. Thereafter the proportions were comparable (Figure 5). For individuals aged 20 to 60 years, the Capital Region of Denmark had a lower proportion of covered individuals compared with the other regions.
 |
Figure 5 Proportion of individuals with a recorded creatinine test in 2016–2018 by age. |
Discussion
In this study describing the combined creatinine data from the LABKA and RLRR databases, we found that the first region achieved complete reporting in November 2004 and that nationwide reporting was completed in October 2015. In each year from 2016 to 2018, more than a third of Danish residents had a recorded annual creatinine test, with the highest proportion of tested individuals aged 77–87 years and the lowest proportion aged 3–5 years. Creatinine-tested individuals were more often females, were older, had more comorbidities, used more prescription drugs, and had more contacts with primary and secondary health services than a random sample of the general population.
The population-based setting with complete follow-up of all Danish residents allowed for unbiased collection of biochemical test results, independent of socioeconomic and insurance status.13 Overall data quality is high in Denmark, as most hospital laboratory databases are accredited according to the International Organization for Standardization (ISO15189).16,35 Furthermore, the CPR number allows for individual-level linkage across population-based registries. Thus, biochemical test results can be utilized in a broad array of epidemiological studies.20
Some limitations need consideration. First, in the North and Central Denmark Regions, the methods of measuring plasma creatinine changed from Jaffe´s method to enzymatic methods during 2004–2008 and isotope dilution mass spectrometry (IDMS) standardization was implemented during 2005–2010.36 After 1 April 2010 all laboratories used enzymatic methods with IDMS standardization. Changing methods of analysis and the introduction of IDMS standardization can influence results when studying temporal changes in creatinine levels, especially in patients with normal to high eGFR values.37,38 Second, results of point-of-care tests are recorded in LABKA; however, they may not be included in RLRR, as some are recorded using local analysis codes rather than NPU codes, which are required for inclusion in RLRR. Still, approximately 95% of laboratory analyses are currently NPU-coded.19 Third, when assessing the geographical coverage of recorded data, we used visual inspection of recording patterns. While this introduces the risk of subjectivity, most municipalities showed a distinct pattern when the recording of test results was complete (Figure S1). Furthermore, visual inspection was supported by a quantitative analysis of the timepoint when at least 8% of individuals with diabetes within a municipality had a monthly creatinine test. While current guidelines recommend that all individuals with diabetes should have at least one annual test, this testing regime is now stricter than in the 1990s.39 Furthermore, full adherence to the guidelines is not expected. For other biochemical tests recommended annually, the proportions of Danish individuals with diabetes tested in 2020–2021 were 84% for plasma cholesterol and 78% for urine albumin.40 Thus, our quantitative assessment was most likely conservative throughout the period, but particularly in the early years. The impact of these limitations on future studies depends on the study design and should be considered when designing and interpreting findings.
Other Danish databases of creatinine tests exist, including the Funen Laboratory Cohort (FLaC) and the Kidney Disease Cohort (KidDiCo) of Southern Denmark.12,15 The FLaC covers 460,365 residents with creatinine tests living on the island of Funen from 2000 to 2015, while the KidDiCo covers 669,929 residents with creatinine tests in the Region of Southern Denmark from 2007 to 2013. Consistent with our findings, both studies reported that individuals with creatinine tests were more likely to be female and older than the general population. Furthermore, the FLaC study found that testing frequency increased with rising age, with 10% of persons aged 5–10 years and 90%-100% of persons aged 65–90 years having a test, annually. Additionally, they found that approximately 40% of residents had a creatinine test in 2015, which is also comparable to our findings.
Conclusion
We reported on the combined creatinine data from the LABKA and RLRR databases. In combination these unique Danish databases record longitudinal and nationwide creatinine data, providing a valuable resource for studying kidney disease epidemiology in a population-based setting. Danish residents are frequently tested with annual creatinine tests for more than one-third of the population in recent years and higher proportions being tested with increasing age. However, the timing of complete geographical coverage showed substantial variation across regions and municipalities. This needs to be taken into consideration when using these data in future studies.
Data Sharing Statement
By Danish law, data used for this study cannot be shared or made available to other parties. Requests from researchers at certified Danish research institutions to access the databases used in this study may be emailed to the Danish Health Data Authority ([email protected]).
Funding
The study was funded by Aarhus University, the A.P. Moller Foundation (grant number 19-L-0332), the Health Research Foundation of Central Denmark Region, and the Independent Research Fund of Denmark (grant number 0134-00407B). The funding sources had no role at any stage of the study.
Disclosure
The authors have no personal conflicts of interest to declare regarding this study. The Department of Clinical Epidemiology is involved in studies with funding from various companies in the form of research grants to (and administered by) Aarhus University or Aarhus University Hospital. None of these grants are related to the present study.
References
1. Cockwell P, Fisher L-A. The global burden of chronic kidney disease. Lancet. 2020;395(10225):662–664. doi:10.1016/S0140-6736(19)32977-0
2. Go AS, Chertow GM, Fan D, McCulloch CE, Hsu CY. Chronic kidney disease and the risks of death, cardiovascular events, and hospitalization. N Engl J Med. 2004;351(13):1296–1305. doi:10.1056/NEJMoa041031
3. Susantitaphong P, Cruz DN, Cerda J, et al. World Incidence of AKI: a Meta-Analysis. Clin J Am Soc Nephrol. 2013;8(9):1482–1493. doi:10.2215/cjn.00710113
4. Odutayo A, Wong CX, Farkouh M, et al. AKI and long-term risk for cardiovascular events and mortality. J Am Soc Nephrol. 2017;28(1):377–387. doi:10.1681/asn.2016010105
5. Gansevoort RT, Correa-Rotter R, Hemmelgarn BR, et al. Chronic kidney disease and cardiovascular risk: epidemiology, mechanisms, and prevention. Lancet. 2013;382(9889):339–352. doi:10.1016/S0140-6736(13)60595-4
6. Matsushita K, van der Velde M, Astor BC, et al. Association of estimated glomerular filtration rate and albuminuria with all-cause and cardiovascular mortality in general population cohorts: a collaborative meta-analysis. Lancet. 2010;375(9731):2073–2081. doi:10.1016/s0140-6736(10)
7. Kidney Disease: Improving Global Outcomes (KDIGO) CKD Work Group. KDIGO 2012 clinical practice guideline for the evaluation and management of chronic kidney disease. Kidney Inter. 2013;1(3):1–150.
8. Kidney Disease: improving Global Outcomes (KDIGO). Acute Kidney Injury Work Group. KDIGO Clinical Practice Guideline for Acute Kidney Injury. Kidney Inter. 2012. 2: 1–138.
9. Sawhney S, Fraser SD. Epidemiology of AKI: utilizing Large Databases to Determine the Burden of AKI. Adv Chronic Kidney Dis. 2017;24(4):194–204. doi:10.1053/j.ackd.2017.05.001
10. Hwang YJ, Shariff SZ, Gandhi S, et al. Validity of the International Classification of Diseases, Tenth Revision code for acute kidney injury in elderly patients at presentation to the emergency department and at hospital admission. BMJ Open. 2012;2(6):e001821. doi:10.1136/bmjopen-2012-001821
11. Kern EF, Maney M, Miller DR, et al. Failure of ICD-9-CM codes to identify patients with comorbid chronic kidney disease in diabetes. Health Serv Res. 2006;41(2):564–580. doi:10.1111/j.1475-6773.2005.00482.x
12. Henriksen DP, Damkier P, Hallas J, Nybo M. Sixteen years of creatinine measurements among 460 000 individuals-The Funen Laboratory Cohort (FLaC), a population-based pharmacoepidemiological resource to study drug-induced kidney disease. Basic Clin Pharmacol Toxicol. 2019;124(5):582–590. doi:10.1111/bcpt.13167
13. Schmidt M, Schmidt SAJ, Adelborg K, et al. The Danish health care system and epidemiological research: from health care contacts to database records. Clin Epidemiol. 2019;11:563–591. doi:10.2147/clep.S179083
14. Grann AF, Erichsen R, Nielsen AG, Froslev T, Thomsen RW. Existing data sources for clinical epidemiology: the clinical laboratory information system (LABKA) research database at Aarhus University, Denmark. Clin Epidemiol. 2011;3:133–138. doi:10.2147/clep.S17901
15. Kampmann JD, Goya Heaf J, Mogensen CB, Mickley H, Brandt F. Kidney Disease Cohort (KidDiCo) of Southern Denmark: design, Coverage, Generalizability and Implications for Use. Clin Epidemiol. 2021;13:971–980. doi:10.2147/clep.S328512
16. Arendt JFH, Hansen AT, Ladefoged SA, Sørensen HT, Pedersen L, Adelborg K. Existing Data Sources in Clinical Epidemiology: laboratory Information System Databases in Denmark. Clin Epidemiol. 2020;12:469–475. doi:10.2147/clep.S245060
17. Christiansen T. Ten years of structural reforms in Danish healthcare. Health Policy (New York). 2012;106(2):114–119. doi:10.1016/j.healthpol.2012.03.019
18. Statistics Denmark [homepage on the Internet]. Population figures. Available from: https://www.dst.dk/da/Statistik/emner/borgere/befolkning/befolkningstal.
19. The Danish Health Data Authority [homepage on the Internet]. Laboratoriedatabasen. Available from: https://sundhedsdatastyrelsen.dk/da/registre-og-services/om-de-nationale-sundhedsregistre/doedsaarsager-og-biologisk-materiale/laboratoriedatabasen.
20. Schmidt M, Pedersen L, Sørensen HT. The Danish Civil Registration System as a tool in epidemiology. Eur J Epidemiol. 2014;29(8):541–549. doi:10.1007/s10654-014-9930-3
21. Frank L. Epidemiology. When an entire country is a cohort. Science. 2000;287(5462):2398–2399. doi:10.1126/science.287.5462.2398
22. Pedersen CB. The Danish Civil Registration System. Scand J Public Health. 2011;39(7 Suppl):22–25. doi:10.1177/1403494810387965
23. Schmidt M, Schmidt SA, Sandegaard JL, Ehrenstein V, Pedersen L, Sorensen HT. The Danish National Patient Registry: a review of content, data quality, and research potential. Clin Epidemiol. 2015;7:449–490. doi:10.2147/clep.S91125
24. Pottegård A, Schmidt SAJ, Wallach-Kildemoes H, Sørensen HT, Hallas J, Schmidt M. Data resource profile: the Danish national prescription registry. Int J Epidemiol. 2017;46(3):798–798f. doi:10.1093/ije/dyw213
25. Andersen JS, Olivarius Nde F, Krasnik A. The Danish national health service register. Scand J Public Health. 2011;39(7 Suppl):34–37. doi:10.1177/1403494810394718
26. Erichsen R, Lash TL, Hamilton-Dutoit SJ, Bjerregaard B, Vyberg M, Pedersen L. Existing data sources for clinical epidemiology: the Danish National Pathology Registry and Data Bank. Clin Epidemiol. 2010;2:51–56. doi:10.2147/CLEP.S9908
27. Levey AS, Stevens LA, Schmid CH, et al. A new equation to estimate glomerular filtration rate. Ann Intern Med. 2009;150(9):604–612. doi:10.7326/0003-4819-150-9-200905050-00006
28. Region Nordjylland [homepage on the Internet]. Samarbejdsaftalen for Diabetes Type 2. Available from: https://rn.dk/sundhed/til-sundhedsfaglige-og-samarbejdspartnere/rehabiliteringsindsatser-for-mennesker-med-kronisk-sygdom/diabetes-type-2.
29. Region Hovedstaden [homepage on the Internet]. Forløbsprogram for Type 2 Diabetes. Available from: https://www.regionh.dk/til-fagfolk/Sundhed/Tvaersektorielt-samarbejde/kronisk-sygdom/Forl%C3%B8bsprogrammer/Documents/Revideret%20FP%20for%20T2DM.pdf.
30. Region Midtjylland [homepage on the Internet]. Forløbsprogram for type 2 diabetes. Available from: https://www.rm.dk/globalassets/zdesign/media/sundhed/sundhedsstaben/regionalt-sundhedssamarbejde/kronisk-sygdom/kronikeromradet/diabetes-type-2/forlobsprogram-for-type-2-diabetes-godkendt.pdf.
31. Region Syddanmark [homepage on the Internet]. Nye rammer for kronisk sygdom. Available from: https://regionsyddanmark.dk/fagfolk/det-naere-sundhedsvaesen/samarbejdsaftaler/nye-rammer-for-kronisk-sygdom.
32. Region Sjælland [homepage on the Internet]. Diabetes Type 2. Available from: https://www.regionsjaelland.dk/Sundhed/patient-i-region-sjaelland/Sundhedsaftalen/Forebyggelse/Forloebsprogrammer/Documents/Forl%C3%B8bsprogram%20T2DM%2024102017.pdf.
33. R: A language and environment for statistical computing [homepage on the Internet]. R Foundation for Statistical Computing, Vienna, Austria. Available from: https://www.R-project.org/.
34. Wickham H, Averick M, Bryan J, et al. Welcome to the Tidyverse. J Open Source Softw. 2019;4(43):1686. doi:10.21105/joss.01686
35. Medical laboratories — Requirements for quality and competence [homepage on the Internet]. International Organization for Standardization; 2012. Available from: https://www.iso.org/standard/56115.html.
36. Gammelager H. Prognosis After Acute Kidney Injury Among Intensive Care Patients. Accra: Aarhus University; 2013.
37. Cleary F, Prieto-Merino D, Hull S, Caplin B, Nitsch D. Feasibility of evaluation of the natural history of kidney disease in the general population using electronic healthcare records. Clin Kidney J. 2021;14(6):1603–1609. doi:10.1093/ckj/sfaa175
38. Syme NR, Stevens K, Stirling C, McMillan DC, Talwar D. Clinical and Analytical Impact of Moving from Jaffe to Enzymatic Serum Creatinine Methodology. J Applied Lab Med. 2020;5(4):631–642. doi:10.1093/jalm/jfaa053
39. Standards of Medical Care for Patients With Diabetes Mellitus: American Diabetes Association. Standards of Medical Care for Patients With Diabetes Mellitus: American Diabetes Association. Diabetes Care. 1994;17(6):616–623. doi:10.2337/diacare.17.6.616
40. The Danish Clinical Quality Program – National Clinical Registries (RKKP) [homepage on the Internet]. Dansk Voksen Diabetes Database og Dansk Register for Børne- og Ungdomsdiabetes Årsrapport 2020-2021. Available from: https://www.rkkp.dk/kvalitetsdatabaser/databaser/dansk-voksen-diabetes-databasen/resultater/.
 © 2022 The Author(s). This work is published and licensed by Dove Medical Press Limited. The
full terms of this license are available at https://www.dovepress.com/terms
and incorporate the Creative Commons Attribution
- Non Commercial (unported, 3.0) License.
By accessing the work you hereby accept the Terms. Non-commercial uses of the work are permitted
without any further permission from Dove Medical Press Limited, provided the work is properly
attributed. For permission for commercial use of this work, please see paragraphs 4.2 and 5 of our Terms.
© 2022 The Author(s). This work is published and licensed by Dove Medical Press Limited. The
full terms of this license are available at https://www.dovepress.com/terms
and incorporate the Creative Commons Attribution
- Non Commercial (unported, 3.0) License.
By accessing the work you hereby accept the Terms. Non-commercial uses of the work are permitted
without any further permission from Dove Medical Press Limited, provided the work is properly
attributed. For permission for commercial use of this work, please see paragraphs 4.2 and 5 of our Terms.
Recommended articles
The Serum Uric Acid to Serum Creatinine Ratio is an Independent Risk Factor for Diabetic Kidney Disease
Chen L, Zhu Z, Ye S, Zheng M
Diabetes, Metabolic Syndrome and Obesity 2022, 15:3693-3703
Published Date: 28 November 2022
The Danish Heart Failure Registry: A Validation Study of Content
Andersen C, Schjødt I, Nakano A, Johnsen SP, Egstrup K, Løgstrup BB
Clinical Epidemiology 2022, 14:1585-1594
Published Date: 28 December 2022
Epidemiological Factors Associated with Prescription of Opioids for Chronic Non-Cancer Pain in Adults: A Country-Wide, Registry-Based Study in Denmark Spans 2004–2018
Hansen CA, Ernst MT, Smith CD, Abrahamsen B
Journal of Pain Research 2023, 16:463-485
Published Date: 16 February 2023
A Review of Major Danish Biobanks: Advantages and Possibilities of Health Research in Denmark
Laugesen K, Mengel-From J, Christensen K, Olsen J, Hougaard DM, Boding L, Olsen A, Erikstrup C, Hetland ML, Høgdall E, Kjaergaard AD, Sørensen E, Brügmann A, Petersen ERB, Brandslund I, Nordestgaard BG, Jensen GB, Skajaa N, Troelsen FS, Fuglsang CH, Svingel LS, Sørensen HT
Clinical Epidemiology 2023, 15:213-239
Published Date: 21 February 2023
Evaluation of Renal Function Profile in Human Visceral Leishmaniasis (Kala-Azar) Patients: A Case of Western Tigray, Ethiopia
Asfaw KG, Gizaw ST, Gnanasekaran N
Research and Reports in Tropical Medicine 2023, 14:21-33
Published Date: 28 June 2023