")
Back to Journals » Diabetes, Metabolic Syndrome and Obesity » Volume 15
The Serum Uric Acid to Serum Creatinine Ratio is an Independent Risk Factor for Diabetic Kidney Disease
Authors Chen L , Zhu Z , Ye S, Zheng M
Received 24 August 2022
Accepted for publication 11 November 2022
Published 28 November 2022 Volume 2022:15 Pages 3693—3703
DOI https://doi.org/10.2147/DMSO.S387426
Checked for plagiarism Yes
Review by Single anonymous peer review
Peer reviewer comments 3
Editor who approved publication: Dr Konstantinos Tziomalos
Li Chen,1,* Zhangxiang Zhu,1,* Shandong Ye,2,3 Mao Zheng2,3,*
1Department of Endocrinology, the Third Affiliated Hospital of Anhui Medical University (The First People’s Hospital of Hefei), Hefei, People’s Republic of China; 2Department of Endocrinology, the First Affiliated Hospital of USTC, Division of Life Sciences and Medicine, University of Science and Technology of China, Hefei, People’s Republic of China; 3Laboratory of Diabetes, Department of Endocrinology, the First Affiliated Hospital of USTC, Hefei, People’s Republic of China
*These authors contributed equally to this work
Correspondence: Li Chen, Department of Endocrinology, the Third Affiliated Hospital of Anhui Medical University (The First People’s Hospital of Hefei), Hefei, Anhui, 230001, People’s Republic of China, Tel +86 13855169122, Fax +86 055162283524, Email [email protected] Mao Zheng, Department of Endocrinology, the First Affiliated Hospital of USTC, Division of Life Sciences and Medicine, University of Science and Technology of China, Hefei, Anhui, 230001, People’s Republic of China, Tel +86 13215603125, Fax +86 0551-62283524, Email [email protected]
Purpose: A retrospective study was designed to evaluate whether the serum uric acid to serum creatinine ratio (SUA/SCr) can be used as an indicator of diabetic kidney disease (DKD) and macroangiopathy in patients with type 2 diabetes mellitus (T2DM).
Patients and Methods: We screened 2227 patients diagnosed with T2DM, and 450 patients were finally included. They were assigned to three groups based on the tertile of SUA/SCr (Group Tertile 1, Tertile 2, Tertile 3). Demographic information and biochemical parameters were collected from Electronic Patient Record (EPR).
Results: The estimated glomerular filtration rate (eGFR) values were lowest in Group Tertile 1 and highest in Group Tertile 3 (P < 0.05). There was no significant difference in urinary albumin creatinine ratio (UACR) among the three groups (P > 0.05). Partial correlation analyses revealed that SUA/SCr levels were significantly and positively correlated with eGFR, SUA, body mass index, gamma-glutamyl transpeptidase, alanine transaminase, triglycerides, C-peptide, high-density lipoprotein cholesterol and fatty liver, while they were negatively correlated with SCr, blood urea nitrogen, cystatin-c, age, male sex, DM duration and hypertension history (P < 0.05). Logistic regression analysis revealed that SUA/SCr was an independent risk factor for eGFR < 60 mL/min/1.73 m² (P < 0.05). The ROC curve showed that the cutoff value of SUA/SCr for the identification of eGFR < 60 mL/min/1.73 m² was 3.434. In patients with normal UACR, SUA/SCr levels of patients with eGFR < 60 mL/min/1.73 m² were lower than those with eGFR ≥ 60 mL/min/1.73 m² (P < 0.05). Regression analysis did not show SUA/SCr associate to macrovascular disease after adjusting for confounding factors.
Conclusion: SUA/SCr is an independent risk factor for DKD in patients with T2DM and may be helpful for identifying normoalbuminuric DKD.
Keywords: diabetes mellitus, glomerular filtration rate, serum uric acid, creatinine
Introduction
Diabetic kidney disease (DKD) and diabetic macroangiopathy are major complications of diabetes mellitus (DM).1,2 A variety of pathophysiological mechanisms are involved in the development of DKD, including hemodynamic changes, inflammation, fibrosis and mesangial expansion, endothelial cell and podocyte injury, leading to the occurrence of proteinuria and decreased renal function.3,4 Epidemiological investigation shows DKD occurs in 20%-40% of DM patients.5,6 Patients with DKD are at higher risk of cardiovascular disease (CVD) and end-stage renal disease (ESRD), leading to a significant increase in all-cause mortality and overall medical costs.7,8 From 2000 to 2015, the proportion of ESRD patients with DM increased from 19.0% to 29.7%, and the annual incidence increased from 375.8 per million people to 1016 per million people.9 The overall prognosis of DM patients with DKD is poor and the mortality rate is high. Although there are many treatment and intervention methods, the overall prevalence of ESRD has not decreased significantly.10 Therefore, early detection, diagnosis and treatment of chronic diabetic complications, including DKD and macroangiopathy, are of great importance during the early stage of DM.
Hyperuricemia (HUA) is an increase in serum uric acid (SUA) caused by increased production or decreased urinary excretion of UA, or a combination of both. In recent decades, research on the association between SUA and chronic kidney disease (CKD)11–17or macroangiopathy18–24 has not reached a unified consensus and has attracted extensive attention. These conflicting data may be attributed to the fact that the level of endogenous SUA depends primarily on renal clearance function, and some studies have ignored the effect of renal function. Thus, the serum uric acid to serum creatinine ratio (SUA/SCr) has emerged as a new biomarker that assesses SUA levels after standardizing the degree of renal function and it reflects the net production of UA.25,26 Recent studies reported SUA/SCr was relevant to the metabolic change or the preserved function of kidney.26,27 In the present study, we evaluated the relationship between SUA/SCr and renal function as well as macroangiopathy in patients with type 2 DM (T2DM).
Materials and Methods
Ethics Statement
This investigation was approved by the Research Ethics Committee of the Third Affiliated Hospital of Anhui Medical University (No. 2022–007-01) and adhere to the tenets of the Declaration of Helsinki. Informed consent was obtained from all participants.
Patients
In this single-center retrospective study, 2227 patients diagnosed with T2DM21 from August 2019 to September 2021 in the Endocrinology Department of the Third Affiliated Hospital of Anhui Medical University were screened. After rigorous screening, 450 patients with T2DM were included in the present study (Figure 1). The exclusion criteria were as follows: patients with type 1 DM, acute complications of DM, specific types of diabetes due to other causes, pregnancy, malignant tumor, liver disease, primary kidney disease, acute and chronic infections, severe cardiac dysfunction, taking drugs that affect the SUA level (such as uric acid-lowering drugs, diuretics, sodium glucose cotransporter 2 inhibitors, pyrazinamide, ethambutol, levodopa and etcetera).
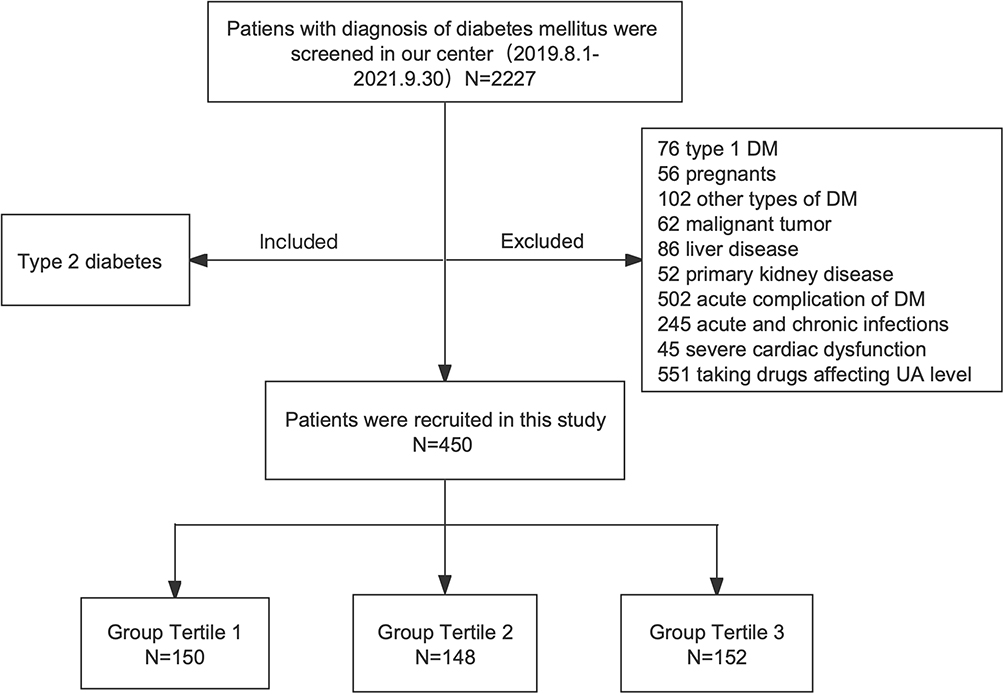 |
Figure 1 Flow chart of the study. Abbreviations: DM, diabetes mellitus; UA, uric acid. |
Data Collection
We obtained demographic information (including age, sex, smoking history, family history of DM (at least one first-degree relative with diabetes), duration of DM, history of hypertension (HBP), and previous medication history), and biochemical parameters from Electronic Patient Record (EPR) of our hospital.
Blood samples were collected after an 8–10 hour overnight fast for biochemical tests. Blood urea nitrogen (BUN), SUA, SCr, cystatin-c (Cysc), fasting blood glucose (FBG), triglycerides, total cholesterol (TCH), high-density lipoprotein cholesterol (HDL-C), low-density lipoprotein cholesterol (LDL-C), gamma-glutamyl transpeptidase (GGT), alanine transaminase (ALT), and aspartate transaminase (AST) were measured using serum by the standard enzymatic methods (Beckman Coulter Unicel DxC800, Beckman Coulter in vitro diagnostic, Cartridge Reagents). Glycosylated hemoglobin A1c (HbA1C) was measured using whole blood with high-performance liquid chromatography (Arkray HA-1880, ARKRAY Factory, Inc. ELUENT 80A, ELUENT 80B, Hemolysis Washing Solution 80H) using whole blood. C-peptide (C-P) was performed with serum using electrochemiluminescence (ROCHE Cobase 602, Roche Diagnostics GmbH, Elecsys C-Peptide). Spot urine was collected in the morning for urinary albumin creatinine ratio (UACR) test, which was estimated using the dry immunomarker scattering quantitative method (Abbott AFINION 2, Abbott Diagnostics Technologies AS, Afinion ACR).
DKD was defined as UACR ≥ 30 mg/g and/or eGFR < 60 mL/min/1.73 m² in the absence of signs or symptoms of other primary causes of kidney damage.28 The estimated glomerular filtration rate (eGFR) was calculated by the CKD-EPI-SCr-Cycs formula:29–31
eGFR=135×min(SCr/κ,1)α×max(SCr/κ,1)-0.601×min(Cycs/0.8,1)-0.375×max(Cycs/0.8,1)-0.711×0.995year×0.969 (Female).
κ: Female: 0.7; Male: 0.9; α: Female: −0.248; Male: −0.207, min refers to the small value of both and max refers to the large value of both.
Anthropometry
The height and weight were measured by pointer mechanical height and weight scale (Tianjin Weighing Instrument Factory Co., Ltd. Xiheng, RGZ-120-RT). The scale was placed on a smooth flat ground, and zero correction was performed before use. After overnight fasting, the subject was asked to remove the shoes, bulky clothing, and hair ornaments, and unbraid hair that interferes with the measurement. Make sure the subject looking straight ahead and that the line of sight is parallel with the floor.The height and weight of the patients were measured three times by the same method, and the average value was recorded for the calculation of body mass index (BMI, kg/m2). The patients underwent a liver ultrasound examination by using high-resolution B-mode ultrasound (Philips-iu22, C5-2 probe), and fatty liver disease was defined as an excessive accumulation of fat in more than 5% of liver cells or a fat content greater than 5.6% in the liver. High-resolution B-mode ultrasound (Philips- IU22, L12-3 probe) was applied to examine the carotid arteries and lower limb arteries of each subject. Carotid artery lesions were defined as thickened or roughened walls of the common carotid artery or the formation of carotid plaques. Carotid intima-media thickness (CIMT) > 0.11 cm was defined as common carotid artery wall thickening. A lower limb atherosclerotic lesion (LLAL) was defined as an intima-media thickness of the lower extremity artery higher than 1.5 mm or a protrusion displaying a thickness 50% higher than the surrounding area.
Data Analyses
Statistical analyses were carried out using IBM SPSS version 24.0 (SPSS, Inc., Chicago, IL, USA). Descriptive analyses were presented based on tertiles of SUA/SCr. Data following the normal distribution were described as the mean ± standard deviation (SD), and t-tests or one-way analysis of variance (ANOVA) were used to compare differences among groups. Data following the skewed distribution are described as the median and interquartile range, and the Mann‒Whitney U-test was performed. The rates or ratios were compared using the chi-square test. Partial correlation analysis was conducted to investigate the correlation between SUA/SCr and the other parameters. Binary logistic regression analysis was performed to evaluate the association of SUA/SCr with DKD and macroangiopathy after adjusting for other covariates. Receiver operating characteristic (ROC) curve analysis of SUA/SCr was performed for predicting DKD. A P value < 0.05 was considered statistically significant.
Results
Characteristics of T2DM Patients According to the SUA/SCr Tertiles
Based on their tertiles of SUA/SCr, the patients were divided into three groups of Tertile 1, Tertile 2 and Tertile 3. As shown in Table 1, many parameters, including age, sex, BMI, SUA, SCr, BUN, Cysc, triglycerides, GGT, ALT and HDL-C, as well as the proportions of HBP history and fatty liver, showed significant differences among the three groups. Figure 2A demonstrates that the eGFR values were lowest in the Tertile 1 group and highest in the Tertile 3 group, accompanied by an SUA/SCr increase (86.40±25.33 versus 101.18±19.50 versus 108.23±18.43 mL/min/1.73 m², P < 0.05). There was no significant difference in UACR among the three groups (P > 0.05) (Figure 2B). The prevalence of carotid lesions (108 (74.5%) versus 90 (62.9%) versus 88 (59.1%), P < 0.05) and LLAL (119 (81.5%) versus 94 (62.7%) versus 93 (62.4%), P < 0.05%) showed significant differences among the three groups (Figure 3).
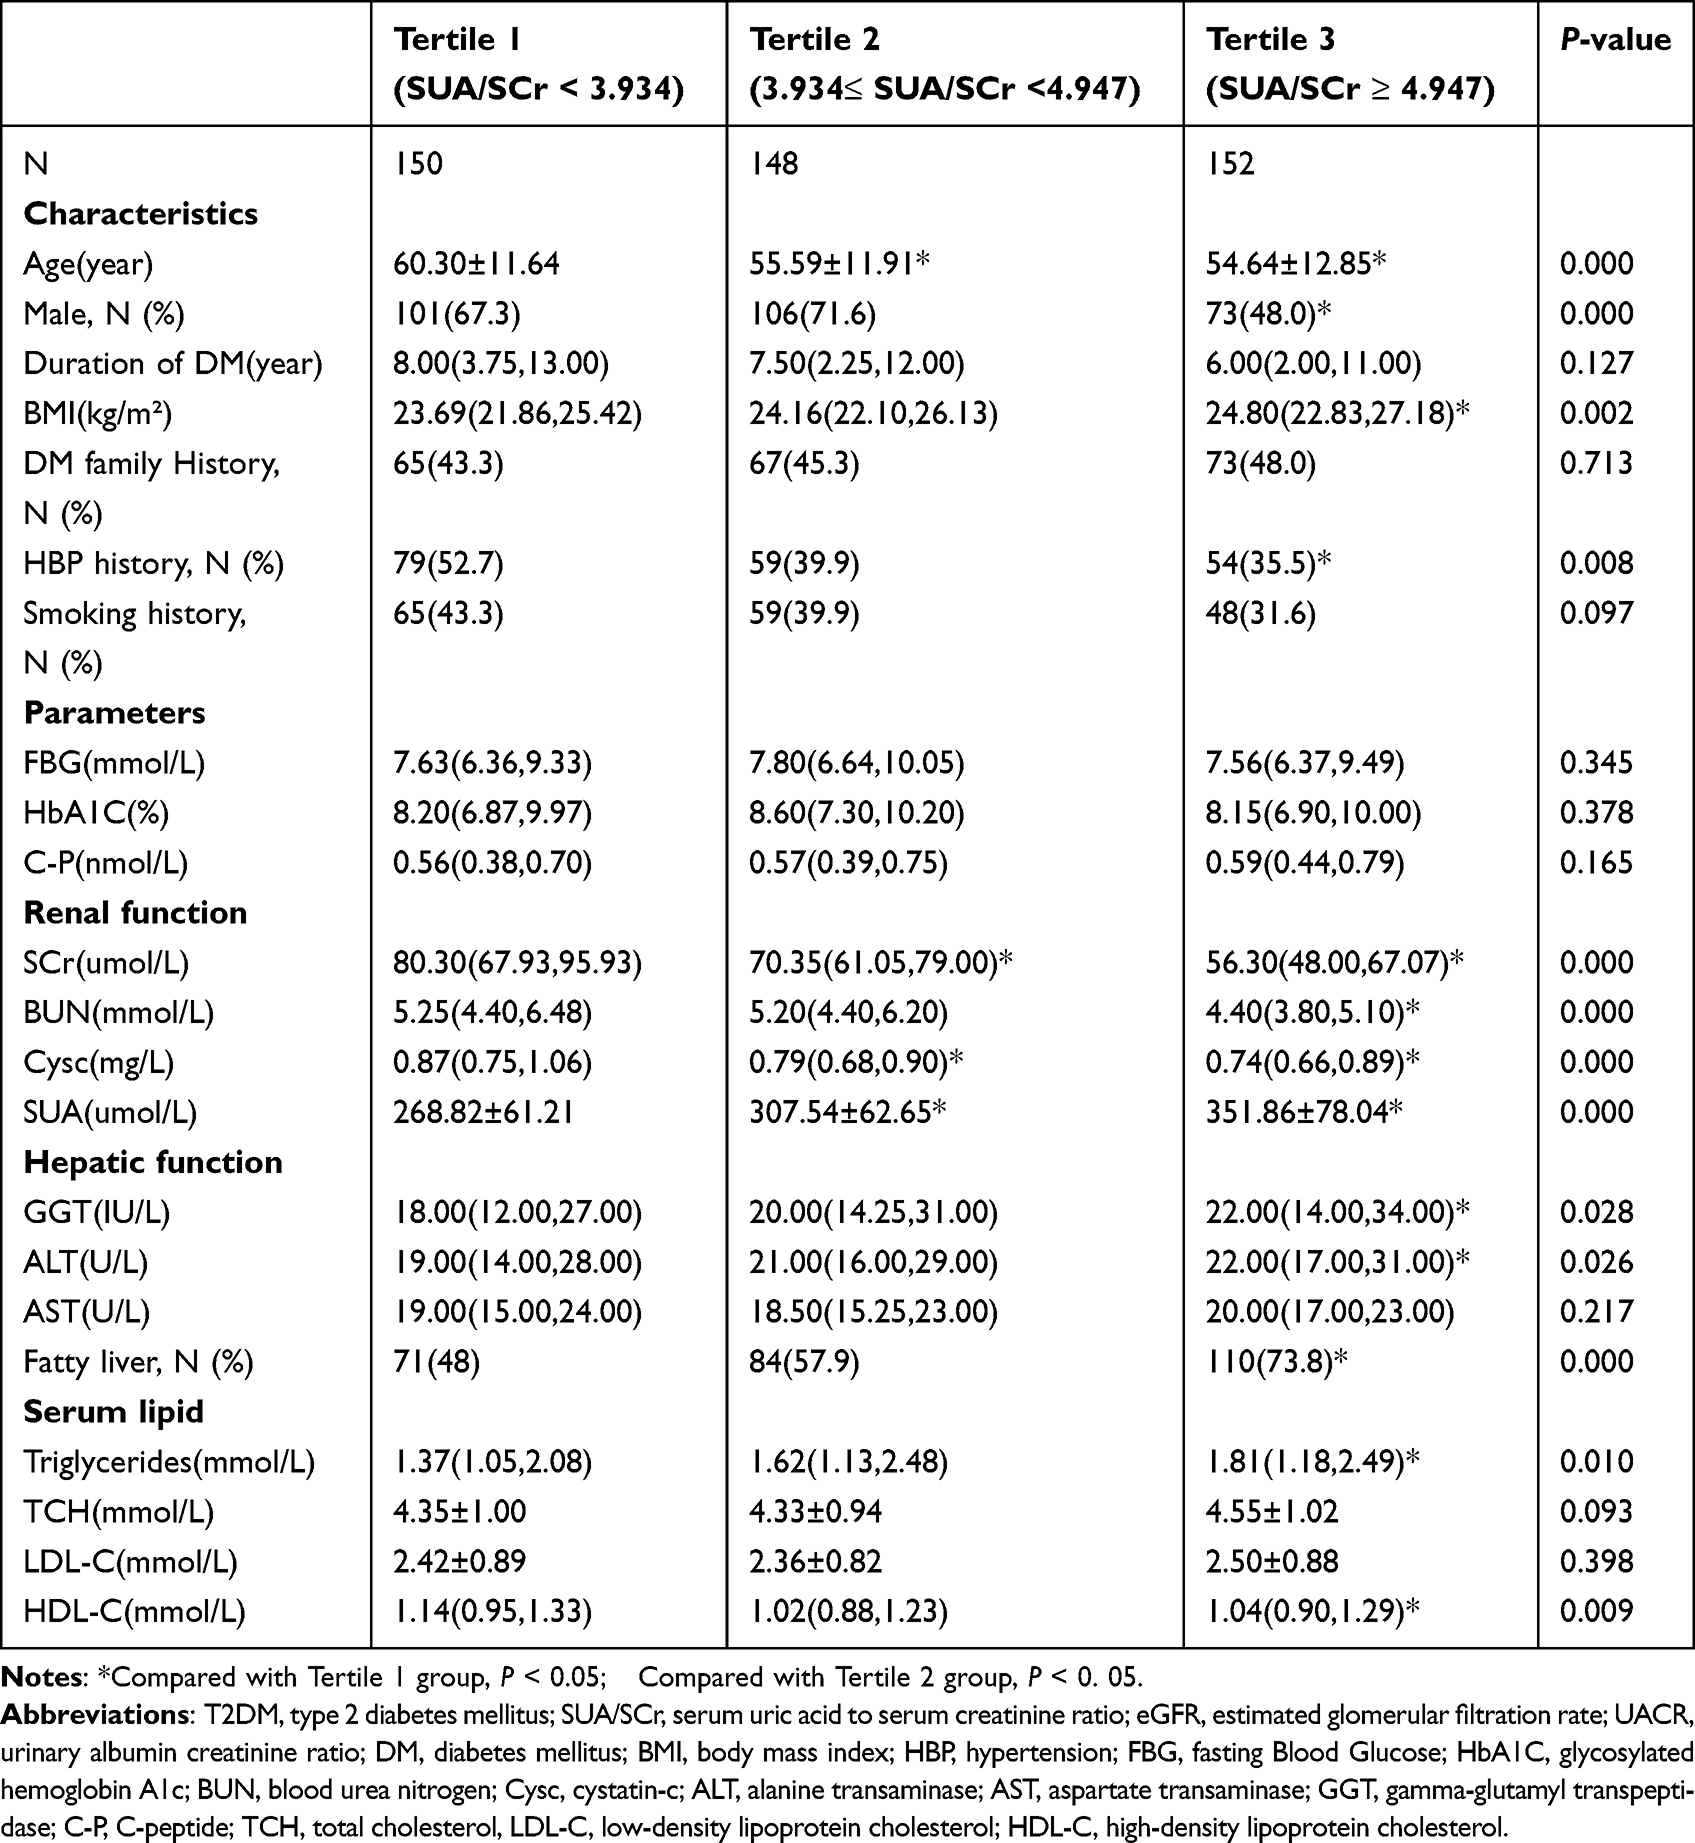 |
Table 1 Characteristics of T2DM Patients According to the SUA/SCr Tertiles |
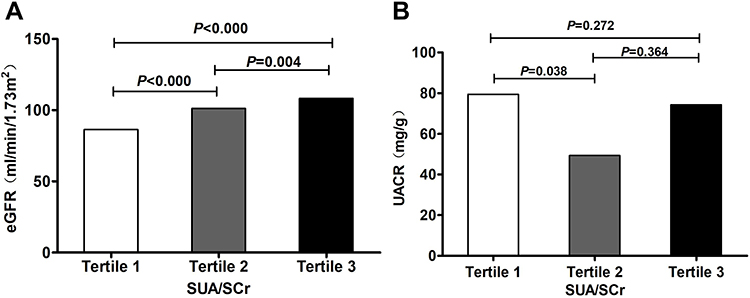 |
Figure 2 Prevalence of eGFR and UACR among three groups categorized by tertile of SUA/SCr. (A) Comparison of eGFR among the three groups; (B) Comparison of UACR among the three groups. Abbreviations: SUA/SCr, serum uric acid to serum creatinine ratio; eGFR, estimated glomerular filtration rate; UACR, urinary albumin creatinine ratio. |
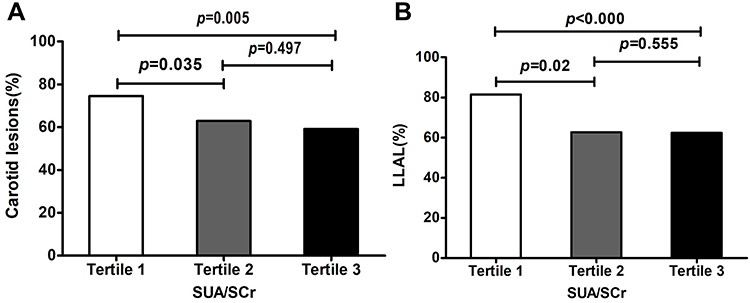 |
Figure 3 Prevalence of carotid lesions and LLAL among three groups categorized by tertile of SUA/SCr. (A) Comparison of the prevalence of carotid lesions among the three groups; (B) Comparison of the prevalence of LLAL among the three groups. Abbreviations: SUA/SCr, serum uric acid to serum creatinine ratio; LLAL, lower limb atherosclerotic lesion. |
The Correlations Between SUA/SCr and Other Parameters in T2DM Patients
Partial correlation analyses were performed to evaluate the relationship between SUA/SCr and other parameters in T2DM patients. As described in Table 2, eGFR was significantly and positively correlated with SUA/SCr. No significant relationship was detected between SUA/SCr and UACR.
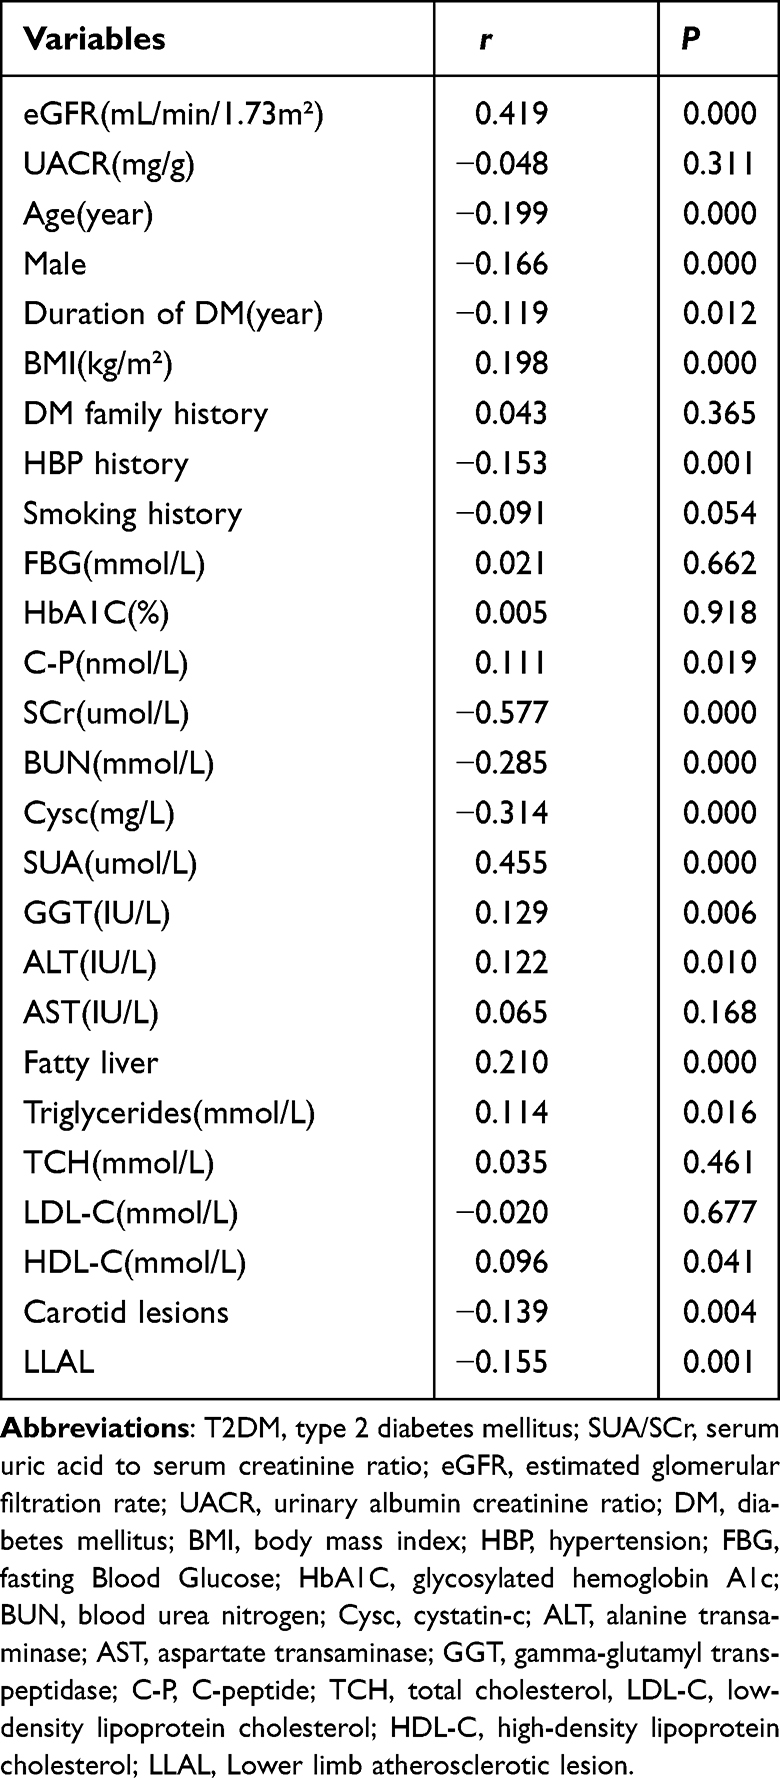 |
Table 2 Correlation Between SUA/SCr and Other Parameters in T2DM Patients |
SUA, BMI, GGT, ALT, triglycerides, C-P, HDL-C, and fatty liver were significantly and positively correlated with SUA/SCr. SCr, BUN, Cysc, age, male sex, DM duration and HBP history were significantly and negatively correlated with SUA/SCr (Table 2).
Partial correlation analyses revealed that the prevalence of carotid lesions and LLAL was significantly and negatively correlated with SUA/SCr (Table 2).
SUA/SCr Was Independently Associated with eGFR in T2DM Patients
As shown in Table 3, regression analysis showed that the SUA/SCr was an independent risk factors for eGFR < 60 mL/min/1.73 m² before and after adjustment for potential confounding factors.
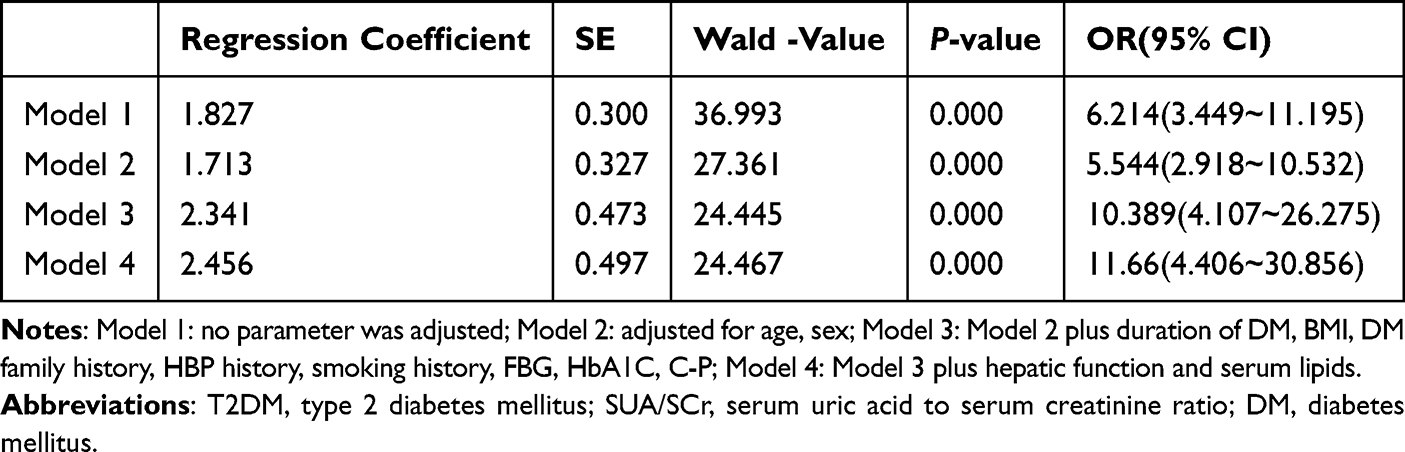 |
Table 3 Logistic Regression Analysis of SUA/SCr for DKD in T2DM Patients |
SUA/SCr Was Not Associated with Macroangiopathy in T2DM Patients
As shown in Table 4, the univariate binary regression model showed that SUA/SCr was a risk factor for carotid lesions and LLAL. After adjustment for potential confounding factors, the SUA/SCr was not associated with carotid lesions or LLAL.
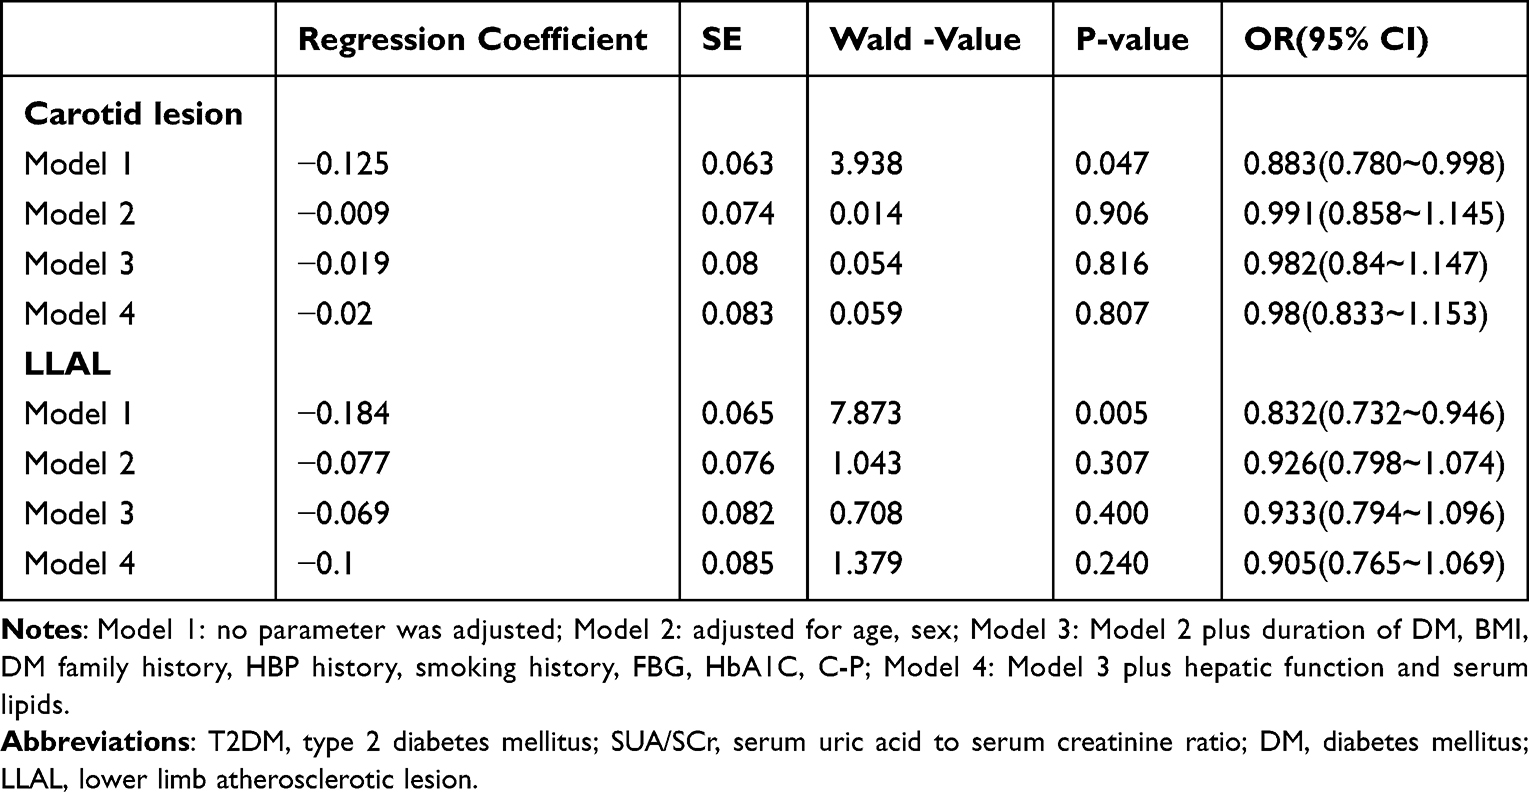 |
Table 4 Logistic Regression Analysis of SUA/SCr for Macroangiopathy in T2DM Patients |
The Accuracy of SUA/SCr for the Diagnosis of DKD in T2DM Patients
The ROC curve showed that the cutoff value of SUA/SCr for T2DM patients with eGFR<60 mL/min/1.73 m² was 3.434, and the corresponding area under the curve (AUC) was 0.849, with a sensitivity of 0.836 and specificity of 0.815 (Figure 4). The Youden index value of SUA/SCr for identifying DKD (evaluated by eGFR <60 mL/min/1.73 m²) in T2DM patients was 0.651.
 |
Figure 4 The ROC curves of SUA/SCr for DKD in T2DM. Abbreviations: SUA/SCr, serum uric acid to serum creatinine ratio; T2DM, type 2 diabetes mellitus; DKD, diabetic kidney disease. |
Comparison of SUA/SCr Between Patients with Normal UACR With or Without eGFR Decline
Patients with normal UACR were divided into a normal eGFR group (eGFR ≥ 60 mL/min/1.73 m²) and a low eGFR group (eGFR < 60 mL/min/1.73 m²). As shown in Figure 5, the SUA/SCr levels of patients in the low eGFR group were lower than those in the normal eGFR group (3.33 versus 4.50, P < 0.05).
 |
Figure 5 Comparison of SUA/SCr levels according to eGFR among patients with normal UACR. Abbreviations: SUA/SCr, serum uric acid to serum creatinine ratio; eGFR, estimated glomerular filtration rate; UACR, urinary albumin creatinine ratio. Notes: Normal eGFR group, eGFR ≥ mL/min/1.73 m²; Low eGFR group, eGFR < 60 mL/min/1.73 m². |
Discussion
In this retrospective study, the main findings were as follows: SUA/SCr is an independent risk factor for DKD in patients with T2DM and may be helpful in identifying normoalbuminuric DKD. To the best of our knowledge, the present study is the first in the literature to observe an elevated SUA/SCr level in normoalbuminuric DKD.
During the past decades, T2DM and HUA have been considered two growing epidemics with an increasingly earlier age of onset. Reduced physical activity, sedentary lifestyle, and obesity are common characteristics of these two diseases.32–34 The prevalence of HUA among patients with T2DM is reported to be as high as 20.68%~33.8%.35–37 SUA levels were positively correlated with T2DM,38 and the risk of T2DM was increased by 6% per 1 mg/dL increment in SUA level.39 The causal relationship between SUA and CKD has been studied in different populations and remains controversial. HUA was recognized as a risk factor for the development and progression of kidney disease, including DKD, in some research.11–13 Zhu P et aliareported that the relationship between SUA and CKD was different at various ages.14 Elevated SUA had a positive association with new-onset CKD.15 A positive association was observed between SUA and CKD among patients aged < 60 years but it vanished among those over 60 years. However, other researchers hold a different view that SUA is not associated with CKD, at least in patients with CKD stage 3~4.16,17
In our retrospective study, SUA/SCr, which reflects the net production of UA, was used to evaluate renal function in patients with T2DM. We found that the eGFR level was consistent with the SUA/SCr increase, according to the SUA/SCr tertiles, which was also reported in some previous studies.25,27 Further analysis revealed that eGFR was significantly and positively correlated with SUA/SCr levels and that SUA/SCr was an independent risk factor for eGFR < 60 mL/min/1.73 m² in T2DM patients. However, there was no difference in UACR in stratified SUA levels, and no correlation was found between SUA/SCr and UACR.
SUA/SCr was at a low level in patients with decreased eGFR, which reflects their lesions in the glomeruli. However, we observed that the reduced filtration of SUA did not show an entirely consistent manifestation with SCr. This phenomenon may be theoretically explained by impaired renal tubules. Zhou JJ et alia performed kidney biopsies in their study and found that when diffuse tubulointerstitial renal lesions occurred, the reabsorption of UA decreased, accompanied by an elevated SCr level, leading to changes in SUA/SCr.40 Therefore, we speculated that decreased SUA/SCr could also reflect damage of the tubular interstitium to some degree.
ROC curve analysis was then performed to determine the accuracy of using SUA/SCr as a diagnostic test for DKD. The results showed that the cutoff value of SUA/SCr for T2DM patients with eGFR<60 mL/min/1.73 m² was 3.434, and the AUC was 0.849 with high sensitivity and specificity. Therefore, SUA/SCr provides discrimination for eGFR < 60 mL/min/1.73 m², which could be used as a supplementary evaluation indicator of DKD in patients with T2DM.
In the last few decades, normoalbuminuric diabetic kidney disease (NADKD), which presents as decreased eGFR with normal UACR, was gradually recognized, and it currently accounts for 10~60% of DKD patients.29,41–43 The risks of ESRD, CVD and death in patients with NADKD are higher than those in DM patients without NADKD.29,44 To the best of our knowledge, no observation of SUA/SCr in patients with NADKD has been reported thus far. In our study, the levels of SUA/SCr in patients with NADKD were lower than those in the normal eGFR group, which indicates that a low SUA/SCr level might be a predictor of NADKD in T2DM patients.
We also discussed the relationship between SUA/SCr and macroangiopathy in T2DM. The prevalence of carotid lesions and LLAL was significantly different among the three groups of SUA/SCr tertiles. Although carotid lesions and LLAL were significantly and negatively correlated with SUA/SCr, further logistic regression analysis did not show any association between SUA/SCr and macrovascular disease after adjusting for confounding covariates. A previous study reported that higher SUA/SCr was associated with an elevated risk of CVD.45 However, we did not find that SUA/SCr was an independent risk factor for macroangiopathy in patients with T2DM.
The indicators related to metabolic syndrome, including BMI, HBP history, triglycerides, HDL-C, GGT, ALT, C-P and fatty liver, were positively correlated with SUA/SCr in this study. Some literature has already reported SUA/SCR as a risk factor for metabolic syndrome25,46,47 and metabolically associated fatty liver disease.47,48
There were several limitations to our study. First, our study is a single-center retrospective study that can only lead to associations but not causality, and the sample size was relatively small, which can merely represent the results of this center. Therefore, the results should be extended with caution. Second, eGFR is calculated using a formula that factors in serum creatinine. It is better to use renal biopsies or measure GFR with the golden standard technology (such as the inulin clearance rate or GFR evaluated by the nuclear medicine method). Therefore, it may make serum creatinine a potential confounder in the entire process of comparing SUA/SCr ratio and eGFR. Third, we have considered the possible effects of underlying diseases and medications influencing UA metabolism (including antihypertensive, antidyslipidemic and antidiabetic medication) in the present study, but we cannot exclude other possible effects on the present findings.
Conclusion
In summary, SUA/SCr is an independent risk factor for DKD in patients with T2DM and may be helpful in identifying NADKD. However, no association was observed between SUA/SCr and macroangiopathy in our study. Consequently, SUA/SCr may provide a practical and effective biomarker for DKD in T2DM patients, especially for primary hospitals and medical institutions in China with relatively inadequate equipment.
Acknowledgments
This work was supported by the Applied Medical Research Project of Hefei Municipal Health Commission (2019, No. 43) and the Fundamental Research Funds for the Central Universities (No. WK9110000194.)
Disclosure
The authors report no conflicts of interest in this work.
References
1. Gheith O, Farouk N, Nampoory N, Halim MA, Al-Otaibi T. Diabetic kidney disease: world wide difference of prevalence and risk factors. J Nephropharmacol. 2016;5(1):49–56.
2. Persson F, Rossing P. Diagnosis of diabetic kidney disease: state of the art and future perspective. Kidney Int Suppl. 2018;8(1):2–7. doi:10.1016/j.kisu.2017.10.003
3. Fioretto P, Pontremoli R. Expanding the therapy options for diabetic kidney disease. Nat Rev Nephrol. 2022;18(2):78–79. doi:10.1038/s41581-021-00522-3
4. Donate-Correa J, Ferri CM, Sánchez-Quintana F, et al. Inflammatory Cytokines in Diabetic Kidney Disease: pathophysiologic and Therapeutic Implications. Front Med. 2020;7:628289. doi:10.3389/fmed.2020.628289
5. Afkarian M, Zelnick LR, Hall YN, et al. Clinical Manifestations of Kidney Disease Among US Adults With Diabetes, 1988-2014. JAMA. 2016;316(6):602–610. doi:10.1001/jama.2016.10924
6. American Diabetes Association Professional Practice Committee. Addendum. 11. Chronic Kidney Disease and Risk Management: standards of Medical Care in Diabetes-2022. Diabetes Care. 2022;45(Suppl.1):S175–S184. doi:10.2337/dc22-ad08a
7. Kourtidou C, Stangou M, Marinaki S, Tziomalos K. Novel cardiovascular risk factors in patients with diabetic kidney disease. Int J Mol Sci. 2021;22:20. doi:10.3390/ijms222011196
8. Sugahara M, Pak W, Tanaka T, Tang S, Nangaku M. Update on diagnosis, pathophysiology, and management of diabetic kidney disease. Nephrology. 2021;26(6):491–500. doi:10.1111/nep.13860
9. Cheng HT, Xu X, Lim PS, Hung KY. Worldwide Epidemiology of Diabetes-Related End-Stage Renal Disease, 2000-2015. Diabetes Care. 2021;44(1):89–97. doi:10.2337/dc20-1913
10. Gregg EW, Li Y, Wang J, et al. Changes in diabetes-related complications in the United States, 1990-2010. N Engl J Med. 2014;370(16):1514–1523. doi:10.1056/NEJMoa1310799
11. De Cosmo S, Viazzi F, Pacilli A, et al. Serum Uric Acid and Risk of CKD in Type 2 Diabetes. Clin J Am Soc Nephrol. 2015;10(11):1921–1929. doi:10.2215/CJN.03140315
12. Klisic A, Kocic G, Kavaric N, Jovanovic M, Stanisic V, Ninic A. Xanthine oxidase and uric acid as independent predictors of albuminuria in patients with diabetes mellitus type 2. Clin Exp Med. 2018;18(2):283–290. doi:10.1007/s10238-017-0483-0
13. Guarda NS, Bollick YS, de Carvalho J, Premaor MO, Comim FV, Moresco RN. High Serum Uric Acid Is Associated with Tubular Damage and Kidney Inflammation in Patients with Type 2 Diabetes. Dis Markers. 2019;2019:6025804. doi:10.1155/2019/6025804
14. Zhu P, Liu Y, Han L, Xu G, Ran JM. Serum uric acid is associated with incident chronic kidney disease in middle-aged populations: a meta-analysis of 15 cohort studies. PLoS One. 2014;9(6):e100801. doi:10.1371/journal.pone.0100801
15. Li L, Yang C, Zhao Y, Zeng X, Liu F, Fu P. Is hyperuricemia an independent risk factor for new-onset chronic kidney disease?: a systematic review and meta-analysis based on observational cohort studies. BMC Nephrol. 2014;15:122. doi:10.1186/1471-2369-15-122
16. Chonchol M, Shlipak MG, Katz R, et al. Relationship of uric acid with progression of kidney disease. Am J Kidney Dis. 2007;50(2):239–247. doi:10.1053/j.ajkd.2007.05.013
17. Turgut F, Kasapoğlu B, Kanbay M. Uric acid, cardiovascular mortality, and long-term outcomes in CKD. Am J Kidney Dis. 2009;54(3):582. doi:10.1053/j.ajkd.2009.06.024
18. Li M, Hu X, Fan Y, et al. Hyperuricemia and the risk for coronary heart disease morbidity and mortality a systematic review and dose-response meta-analysis. Sci Rep. 2016;6:19520. doi:10.1038/srep19520
19. Storhaug HM, Norvik JV, Toft I, et al. Uric acid is a risk factor for ischemic stroke and all-cause mortality in the general population: a gender specific analysis from The Tromsø Study. BMC Cardiovasc Disord. 2013;13:115. doi:10.1186/1471-2261-13-115
20. Zalawadiya SK, Veeranna V, Mallikethi-Reddy S, et al. Uric acid and cardiovascular disease risk reclassification: findings from NHANES III. Eur J Prev Cardiol. 2015;22(4):513–518. doi:10.1177/2047487313519346
21. Bos MJ, Koudstaal PJ, Hofman A, Witteman JC, Breteler MM. Uric acid is a risk factor for myocardial infarction and stroke: the Rotterdam study. Stroke. 2006;37(6):1503–1507. doi:10.1161/01.STR.0000221716.55088.d4
22. Ong G, Davis WA, Davis TM. Serum uric acid does not predict cardiovascular or all-cause mortality in type 2 diabetes: the Fremantle Diabetes Study. Diabetologia. 2010;53(7):1288–1294. doi:10.1007/s00125-010-1735-7
23. Palmer TM, Nordestgaard BG, Benn M, et al. Association of plasma uric acid with ischaemic heart disease and blood pressure: Mendelian randomisation analysis of two large cohorts. BMJ. 2013;347:f4262. doi:10.1136/bmj.f4262
24. Li J, Muraki I, Imano H, et al. Serum uric acid and risk of stroke and its types: the Circulatory Risk in Communities Study (CIRCS). Hypertens Res. 2020;43(4):313–321. doi:10.1038/s41440-019-0385-5
25. Al-Daghri NM, Al-Attas OS, Wani K, Sabico S, Alokail MS. Serum Uric Acid to Creatinine Ratio and Risk of Metabolic Syndrome in Saudi Type 2 Diabetic Patients. Sci Rep. 2017;7(1):12104. doi:10.1038/s41598-017-12085-0
26. Gu L, Huang L, Wu H, Lou Q, Bian R. Serum uric acid to creatinine ratio: a predictor of incident chronic kidney disease in type 2 diabetes mellitus patients with preserved kidney function. Diab Vasc Dis Res. 2017;14(3):221–225. doi:10.1177/1479164116680318
27. Kawamoto R, Ninomiya D, Kikuchi A, et al. Serum uric acid to creatinine ratio is a useful predictor of renal dysfunction among diabetic persons. Diabetes Metab Syndr. 2019;13(3):1851–1856. doi:10.1016/j.dsx.2019.04.023
28. Chinese Diabetes Society. Guideline for the prevention and treatment of type 2 diabetes mellitus in China (2020 edition). Chin J Endocrinol Metabo. 2021;37(04):311–398.
29. Microvascular complications Group, Chinese Diabetes Society. Clinical guideline for the prevention and treatment of diabetic kidney disease in China (2021 edition). Chin J Diabetes Mellitus. 2021;13(8):762–784.
30. Inker LA, Schmid CH, Tighiouart H, et al. Estimating glomerular filtration rate from serum creatinine and cystatin C. N Engl J Med. 2012;367(1):20–29. doi:10.1056/NEJMoa1114248
31. Chi XH, Li GP, Wang QS, et al. CKD-EPI creatinine-cystatin C glomerular filtration rate estimation equation seems more suitable for Chinese patients with chronic kidney disease than other equations. BMC Nephrol. 2017;18(1):226. doi:10.1186/s12882-017-0637-z
32. Multi-Disciplinary Expert Task Force on Hyperuricemia and Its Related Diseases. 中国高尿酸血症相关疾病诊疗多学科专家共识 [Chinese multi-disciplinary consensus on the diagnosis and treatment of hyperuricemia and its related diseases]. Zhonghua Nei Ke Za Zhi. 2017;56(3):235–248. Chinese. doi:10.3760/cma.j.issn.0578-1426.2017.03.021
33. Wang L, Gao P, Zhang M, et al. Prevalence and Ethnic Pattern of Diabetes and Prediabetes in China in 2013. JAMA. 2017;317(24):2515–2523. doi:10.1001/jama.2017.7596
34. Pradeepa R, Mohan V. Prevalence of type 2 diabetes and its complications in India and economic costs to the nation. Eur J Clin Nutr. 2017;71:7. doi:10.1038/ejcn.2017.40
35. Woyesa SB, Hirigo AT, Wube TB. Hyperuricemia and metabolic syndrome in type 2 diabetes mellitus patients at Hawassa university comprehensive specialized hospital, South West Ethiopia. BMC Endocr Disord. 2017;17(1):76. doi:10.1186/s12902-017-0226-y
36. Gao Z, Han F, Yuan X, et al. Analysis of clinical characteristics and risk factors of different types of hyperuricemia in patients with type 2 diabetes. Int J Endocrinol Metab. 2018;38:2.
37. Wang J, Chen RP, Lei L, et al. Prevalence and determinants of hyperuricemia in type 2 diabetes mellitus patients with central obesity in Guangdong Province in China. Asia Pac J Clin Nutr. 2013;22(4):590–598. doi:10.6133/apjcn.2013.22.4.16
38. Mortada I. Hyperuricemia, Type 2 Diabetes Mellitus, and Hypertension: an Emerging Association. Curr Hypertens Rep. 2017;19(9):69. doi:10.1007/s11906-017-0770-x
39. Lv Q, Meng XF, He FF, et al. High serum uric acid and increased risk of type 2 diabetes: a systemic review and meta-analysis of prospective cohort studies. PLoS One. 2013;8(2):e56864. doi:10.1371/journal.pone.0056864
40. Zhou JJ, Chen YQ, Liu Y, et al. Clinical value of serum uric acid/serum creatinine ratio for the degree of tubulointerstitial damage. Beijing Med J. 2012;34(04):253–256.
41. Yokoyama H, Sone H, Oishi M, et al. Prevalence of albuminuria and renal insufficiency and associated clinical factors in type 2 diabetes: the Japan Diabetes Clinical Data Management study (JDDM15). Nephrol Dial Transplant. 2009;24(4):1212–1219. doi:10.1093/ndt/gfn603
42. Thomas MC, Macisaac RJ, Jerums G, et al. Nonalbuminuric renal impairment in type 2 diabetic patients and in the general population (national evaluation of the frequency of renal impairment cO-existing with NIDDM [NEFRON] 11). Diabetes Care. 2009;32(8):1497–1502. doi:10.2337/dc08-2186
43. Du RQ, Zhang Y, Li QM, et al. Clinical features of normoalbuminuric diabetic kidney disease in patients with type 2 diabetes. Chin J Diabetes Mellitus. 2017;9(08):494–498.
44. Buyadaa O, Magliano DJ, Salim A, Koye DN, Shaw JE. Risk of Rapid Kidney Function Decline, All-Cause Mortality, and Major Cardiovascular Events in Nonalbuminuric Chronic Kidney Disease in Type 2 Diabetes. Diabetes Care. 2020;43(1):122–129. doi:10.2337/dc19-1438
45. Wang A, Tian X, Wu S, et al. Metabolic Factors Mediate the Association Between Serum Uric Acid to Serum Creatinine Ratio and Cardiovascular Disease. J Am Heart Assoc. 2021;10(23):e023054. doi:10.1161/JAHA.121.023054
46. Tao J, Shen X, Li J, et al. Serum uric acid to creatinine ratio and metabolic syndrome in postmenopausal Chinese women. Medicine. 2020;99(17):e19959. doi:10.1097/MD.0000000000019959
47. Kawamoto R, Ninomiya D, Akase T, et al. Serum Uric Acid to Creatinine Ratio Independently Predicts Incident Metabolic Syndrome Among Community-Dwelling Persons. Metab Syndr Relat Disord. 2019;17(2):81–89. doi:10.1089/met.2018.0055
48. Seo YB, Han AL. Association of the Serum Uric Acid-to-Creatinine Ratio with Nonalcoholic Fatty Liver Disease Diagnosed by Computed Tomography. Metab Syndr Relat Disord. 2021;19(2):70–75. doi:10.1089/met.2020.0086
 © 2022 The Author(s). This work is published and licensed by Dove Medical Press Limited. The full terms of this license are available at https://www.dovepress.com/terms.php and incorporate the Creative Commons Attribution - Non Commercial (unported, v3.0) License.
By accessing the work you hereby accept the Terms. Non-commercial uses of the work are permitted without any further permission from Dove Medical Press Limited, provided the work is properly attributed. For permission for commercial use of this work, please see paragraphs 4.2 and 5 of our Terms.
© 2022 The Author(s). This work is published and licensed by Dove Medical Press Limited. The full terms of this license are available at https://www.dovepress.com/terms.php and incorporate the Creative Commons Attribution - Non Commercial (unported, v3.0) License.
By accessing the work you hereby accept the Terms. Non-commercial uses of the work are permitted without any further permission from Dove Medical Press Limited, provided the work is properly attributed. For permission for commercial use of this work, please see paragraphs 4.2 and 5 of our Terms.