
Back to Journals » Journal of Inflammation Research » Volume 19
Remodeling of Cardiac Macrophage Subsets Serves as a Critical Driver of Early Diabetic Myocardial Injury
Authors Xu K, Zhang YM, Yang L, Zhang L, Zhang YW, Guo JQ, Cai JP 
Received 30 January 2026
Accepted for publication 21 April 2026
Published 18 June 2026 Volume 2026:19 596413
DOI https://doi.org/10.2147/JIR.S596413
Checked for plagiarism Yes
Review by Single anonymous peer review
Peer reviewer comments 2
Editor who approved publication: Dr Quan Zhang
Kun Xu,1,2 Ying-Min Zhang,1 Lan Yang,1 Li Zhang,1,3 Yun-Wen Zhang,1,4 Jia-Qi Guo,1,4 Jian-Ping Cai1,2
1Beijing Hospital, National Center for Gerontology, National Clinical Research Center for Gerontology, The Key Laboratory of Geriatrics of NHC, Institute of Geriatric Medicine, Chinese Academy of Medical Sciences & Peking Union Medical College, Beijing, People’s Republic of China; 2Graduate School of Peking Union Medical College and Chinese Academy of Medical Sciences, Beijing, People’s Republic of China; 3Peking University Fifth School of Clinical Medicine, Beijing Hospital, Beijing, People’s Republic of China; 4Medical School, University of Chinese Academy of Sciences, Beijing, People’s Republic of China
Correspondence: Jian-Ping Cai, Beijing Hospital/National Center of Gerontology of National Health Commission, Graduate School of Peking Union Medical College and Chinese Academy of Medical Sciences, Beijing, People’s Republic of China, Tel +86 10 58115039, Fax +86 10 65237929, Email [email protected]
Background: Diabetic cardiomyopathy (DCM) is a major complication of diabetes; however, the mechanisms underlying cardiac immune microenvironment dysregulation in early DCM remain to be systematically elucidated.
Methods: An early-stage DCM mouse model was induced by a high-fat/high-fructose regimen combined with streptozotocin, characterized by molecular pathology (oxidative stress, apoptosis) without overt cardiac dysfunction. Using an integrated approach including single-cell RNA sequencing, flow cytometry, and immunofluorescence, we systematically analyzed and validated the pathological remodeling of the cardiac immune microenvironment at the transcriptional, protein expression, and tissue-in-situ levels.
Results: In early DCM, the cardiac immune microenvironment becomes already dysregulated, with significant increases in monocytes, dendritic cells, basophils, NK cells, and T cells. Macrophages, as the central regulators of cardiac immune homeostasis, undergo profound remodeling during this stage. On the one hand, apoptosis of a subset of resident macrophages leads to a deficiency in endogenous protective mechanisms. On the other hand, macrophage subsets derived from peripheral monocytes expand substantially and differentiate into functionally specialized subpopulations: pro-inflammatory (Ccr2⁺MHCIIhi), pro-fibrotic (Ccr2⁺Spp1⁺), and lipid-reprogrammed (Fabp4⁺) subsets. Further analysis revealed that the Ccr2⁺MHCIIhi macrophage subset may drive a self-amplifying cycle of inflammation by promoting monocyte recruitment. Collectively, these changes establish a self-sustaining pathological immune microenvironment that drives early cardiac injury.
Conclusion: Using an early DCM mouse model, this study revealed a profound shift in the cardiac immune microenvironment from homeostasis toward inflammation-fibrosis-lipid reprogramming, with macrophage subset remodeling serving as a central driver of early injury. Targeting the recruitment signals mediated by Ccr2⁺MHCIIhi macrophages or protecting the homeostasis of resident macrophages may offer novel therapeutic strategies for intervening in the progression of diabetic cardiomyopathy. The diagram illustrates two conditions within the heart: homeostasis and early-stage diabetic cardiomyopathy. On the left, under homeostasis, various macrophages are labeled, including TLF plus Cxcl13 minus Mac and Ccr2 minus MHCIIhi Mac. These cells are distributed throughout the heart. On the right, early-stage diabetic cardiomyopathy shows changes in cell types and functions. Monocytes are depicted entering the heart, differentiating into various macrophages such as Ccr2 plus MHCIIhi Mac, which are pro-inflammatory, Ccr2 plus Spp1 plus Mac, which are pro-fibrotic and Fabp4 plus Mac, involved in lipid metabolism. Apoptosis is indicated in some cells. Additional immune cells like dendritic cells, natural killer cells, T cells and basophils are shown outside the heart, suggesting their involvement in the condition. The diagram highlights the shift in cellular composition and function between the two states.Diagram comparing heart cell types in homeostasis and early-stage diabetic cardiomyopathy.
Keywords: diabetic cardiomyopathy, immune microenvironment, macrophage remodeling, inflammation, lipid metabolic reprogramming
Introduction
Diabetes is an escalating global health concern. Currently, an estimated 537 million adults aged 20–79 are living with diabetes, accounting for approximately 10.5% of the world’s population in this age group. This number is projected to rise to 643 million (11.3%) by 2030 and to 783 million (12.2%) by 2045.1 The increasing prevalence of diabetes over time poses substantial challenges to both society and healthcare systems. Diabetes is a chronic metabolic disorder that, if poorly managed, can lead to a range of complications, including cardiovascular disease, kidney disease, and vision problems.2,3
Diabetic cardiomyopathy (DCM), one of the common cardiovascular complications of diabetes, is a pathological condition induced by diabetes in the absence of hypertension and coronary artery disease.4,5 Diabetes mellitus can induce myocardial metabolic disturbances, cardiac fibrosis, and microvascular pathology, leading to left ventricular hypertrophy, diastolic and/or systolic dysfunction, and ultimately progressing to heart failure.4,6 Current research has largely focused on the pathological mechanisms of diabetic cardiomyopathy at middle and advanced stages, at which stage structural damage to the heart is often irreversible.7–9 Therefore, this study centers on the early stage of diabetic cardiomyopathy—characterized by the absence of overt cardiac dysfunction but the presence of molecular pathological alterations, including cellular oxidative stress, abnormal calcium homeostasis, metabolic disturbances, and apoptosis.10,11 Elucidating the key molecular events in the early phase of diabetic cardiomyopathy is of great significance for clarifying the pathogenesis of the disease and identifying targets for early intervention.
The dysregulation of the immune microenvironment is a critical driver in the pathogenesis and progression of DCM. Macrophages, the most abundant immune cell population in the heart, play an essential role in maintaining cardiac homeostasis.12 Current insights into macrophage classification in DCM are primarily derived from their developmental origins (embryonic/monocytic) and in vitro stimulation models (M1 pro-inflammatory/M2 anti-inflammatory).13–15 Studies show that hyperglycemia facilitates monocyte infiltration into cardiac tissue and their polarization toward the M1 phenotype, exacerbating myocardial injury through the secretion of inflammatory cytokines such as IL-1β and TNF-α.16 In contrast, CCR2 knockout has been shown to promote macrophage polarization toward the M2 phenotype and ameliorate STZ-induced cardiac dysfunction and fibrosis.17
However, current research on cardiac macrophages in DCM has certain limitations. First, studies have predominantly relied on traditional methods such as flow cytometry or bulk sequencing,18 which offer limited resolution. Second, the M1/M2 dichotomy is insufficient for deciphering the complex cardiac immune microenvironmental changes induced by hyperglycemia and hyperlipidemia in vivo.19 The advent of single-cell technologies has provided an opportunity to resolve cellular heterogeneity with high resolution. For instance, studies in myocardial infarction and atherosclerosis have revealed that macrophages exhibit heterogeneity far beyond traditional classification, with subset compositions being disease-specific.20,21 However, a systematic characterization of the precise macrophage subpopulations at single-cell resolution and their pathological features in DCM remains lacking, limiting our in-depth understanding of the immune microenvironment in this disease.
During DCM progression, immune microenvironment remodeling in the early stage may be fundamentally distinct from that in the mid-to-late stages.12,22 Early immune remodeling represents a “metabolic stress-driven initial inflammatory response,” a phase in which irreversible structural damage has not yet occurred. In contrast, immune remodeling during mid-to-late stages transitions into a “structural damage-driven chronic inflammation,” centered on macrophage-fibroblast crosstalk, which promotes widespread fibrosis and ventricular remodeling, ultimately leading to the decompensated phase. Currently, a high-resolution map of the cardiac immune microenvironment in early-stage DCM is still lacking. Under the metabolic stress of hyperlipidemia and hyperglycemia, how the cardiac immune microenvironment—particularly macrophages—undergoes specific reprogramming in the early stages of the disease, and how this process influences disease progression, remain questions that lack systematic investigation.
Based on this, our study employs single-cell RNA sequencing (scRNA-seq) combined with multidimensional experimental validation to uncover the critical cellular hubs and molecular switches in immune regulation during early diabetic cardiac injury, thereby providing novel theoretical insights and potential targets for the early intervention of diabetic cardiomyopathy.
Materials and Methods
Diabetic Mouse Modeling
C57BL/6J mice were purchased from Sipeifu Biotechnology Co., Ltd. (Beijing, China), and housed in a specific pathogen‑free (SPF)‑grade animal facility. All animal procedures were performed at the SPF facility of Shenrui Biotechnology Co., Ltd. (Beijing, China), an accredited research service provider, as the authors’ institution (Beijing Hospital) lacks an internal animal facility. Environmental conditions were strictly controlled: temperature 22–24 °C, relative humidity 55%–60%, 12/12 h light/dark cycle, with free access to standard chow and water. All animal procedures complied with the NIH Guide for the Care and Use of Laboratory Animals (2011) and were approved by the Animal Ethics Committee of Beijing Shenrui Biotechnology Co., Ltd. (Approval No. SR20250216). The study was designed and reported in compliance with the ARRIVE guidelines.
Six- to eight-week-old male C57BL/6J mice were used in this study. With the individual mouse as the experimental unit, animals were randomly allocated to either a normal control group or a diabetic model group using a random number table. To minimize potential confounding bias, the order of all routine procedures (including dietary administration, streptozotocin injections, and outcome measurements) was randomized to ensure that animals from different groups were processed in a mixed sequence. Furthermore, blinding was implemented during the experimental phase: blood glucose measurement and subsequent pathological analyses were performed independently by researchers who were blinded to the group allocation.
Control mice (ND group) were maintained on a normal diet throughout. Model mice (DCM group) first underwent a 6-week high-fat/high-fructose dietary intervention to induce insulin resistance and metabolic dysregulation. The high-fat diet (60 kcal% fat; Research Diets, USA) was supplemented with 10% w/v fructose (RHAWN, China) in drinking water. Streptozotocin (STZ, 40 mg/kg/day; MedChemExpress, USA) was then administered intraperitoneally for five consecutive days to further disrupt β-cell function and induce hyperglycemia. From the end of STZ injection, blood glucose was monitored. Mice with fasting glucose (8h daytime fast) consistently >16.7 mmol/L on two consecutive days were defined as diabetic. Mice that died during the modeling phase, failed to reach the diabetic glycemic threshold after STZ administration, or developed secondary conditions unrelated to diabetes (e.g., infection or tumors) were excluded from the study. A total of 43 mice were used to establish the cohort. After applying the exclusion criteria, 41 mice (n=20 for ND; n=21 for DCM) were included in the final analysis. All mice were sacrificed on day 7 after the model group met glycemic criteria. Following deep anesthesia (tribromoethanol, 350 mg/kg, i.p.) and cervical dislocation, mice underwent cardiac perfusion. Heart tissue was harvested and allocated for: single‑cell suspension preparation, paraffin embedding, frozen embedding, or snap‑freezing. Serum was also collected.
Preparation of Cardiac Single‑Cell Suspensions
The heart tissue was cut into small pieces (~1 mm3) and transferred to a 15 mL centrifuge tube. Enzymatic dissociation was carried out using a mixture containing 500 μL of collagenase II (10 mg/mL), 500 μL of collagenase IV (10 mg/mL), 2 mL of DNase I (200 μg/mL), and 2 mL of 1640 medium. Digestion proceeded for 40 min in a 37°C shaking incubator. The enzymatic reaction was subsequently halted by the addition of 8 mL of 1640 medium supplemented with 15% FBS. The digested tissue mixture was then applied onto a 70 μm cell strainer positioned atop a 50 mL centrifuge tube, with mechanical disruption using a syringe plunger. The filtrate was centrifuged at 500g for 5 min, and the supernatant was discarded. To eliminate erythrocytes, the pellet was incubated with 2 mL of red blood cell lysis buffer for 5 min, centrifuged at 500g for 5 min. Finally, the resulting cell pellet was resuspended in roughly 200 μL of DPBS containing 2% FBS, transferred to an EP tube, and the cells were counted.
To determine cell concentration and assess viability, clumping rate, as well as nucleated cell rate, 10 μL of the cell suspension was mixed with 10 μL of AO/PI staining solution and analyzed using a Countstar automated cell counter. For samples with a clumping rate below 20%, the concentration was adjusted to 1 × 10⁶ cells/100 μL for subsequent staining and flow cytometry. Prior to sorting or analysis, debris and large cell clumps were first excluded using SSC-A/FSC-A gating, followed by doublet discrimination using FSC-H/FSC-A gating. For samples with a clumping rate exceeding 20%, the suspension was subjected to an additional filtration through a 40 μm cell strainer, followed by concentration adjustment and subsequent flow cytometric sorting or analysis.
Immunophenotyping of Cardiac Immune Cells by Flow Cytometry
Each cardiac cell suspension was split equally for myeloid and lymphoid immunophenotyping. Single-cell suspensions were first stained with 1 μL of Zombie dye (BioLegend, USA) per 100 μL for 15 min in the dark to discriminate viable from dead cells. After washing with 1 mL of staining buffer (BioLegend, USA) and centrifugation at 1500 rpm for 5 min, the supernatant was removed. The cell pellet was then incubated with 1 μL of Fc Block antibody (BD Pharmingen, USA) in the dark for 5 min to block non-specific binding, followed by surface marker staining at 4 °C in the dark for 20 min with pre-mixed antibody panels: myeloid (CD45, CD11b, Ly-6C, Ly-6G, F4/80, TIMD4, CCR2, MHC II, CD11c) or lymphoid (CD45, CD11b, CD19, CD3, NK1.1). Following staining, cells were washed with 1 mL of staining buffer, pelleted by centrifugation at 1500 rpm for 5 min, and resuspended in an appropriate amount of staining buffer. Sample acquisition was performed on a BD Fortessa flow cytometer, and the resulting data were analyzed using FlowJo software. Antibody concentrations and other detailed information are provided in Supplementary Tables 1 and 2, and the detailed gating strategy is provided in Supplementary Figure 1.
Isolation of Cardiac Immune Cells
Cell suspensions from two hearts were combined to generate one sequencing sample. Following anti-CD45 staining (clone 30-F11, Thermo Fisher, USA), CD45+ immune cells were sorted on a SONY SH800S flow cytometer. Sorted cells were received in DPBS supplemented with 2% FBS, 1 mM EDTA, and 48 U/mL DNase I. Cell quality was re-assessed using a Countstar automated cell counter to ensure viability >85%, clumping rate <20%, and nucleated cell rate >70%. Cells were then adjusted to an appropriate concentration, kept on ice, and reserved for subsequent single-cell sequencing.
Single-Cell Library Preparation and Sequencing
Viable cells obtained by flow sorting were used to construct single-cell RNA-sequencing libraries on the 10x Genomics platform. For each sample, approximately 10,000 viable cells were co-loaded with gel beads onto a Chromium chip. Gel-bead-in-emulsion (GEM) droplets were then generated within the Chromium Controller instrument via microfluidics, enabling individual cell isolation and barcoding. Within the droplets, cell lysis, mRNA capture, and reverse transcription were performed to generate cDNA carrying cell-specific barcodes and unique molecular identifiers (UMIs). The cDNA was then purified, amplified, and processed into gene expression libraries following the standard protocol of the Chromium Single Cell 3′ Reagent Kits v3.1. All libraries passing quality control were sequenced using the Illumina NovaSeq X-25B platform with 2×150 bp paired-end reads.23 Sequencing services were provided by CapitalBio Technology (Beijing, China).
Bioinformatic Analysis of scRNA-Seq Data
The raw sequencing data were mapped to the GRCm39 genome via Cell Ranger (v9.0.1), yielding a gene-expression matrix. Downstream bioinformatic analysis was conducted in R (v4.3.1), largely utilizing the Seurat package (v4.4.0).24,25 Filtering was performed with the following cutoffs: 200 ≤ nFeature_RNA ≤ 5000 and percent.mt < 10% per cell. A two-step procedure was used to filter doublets: Scrublet-based automatic screening (threshold > 0.2), followed by manual curation to identify and exclude aberrant clusters located between distinct cell populations on UMAP plots that co-expressed multiple lineage marker genes.26–28 Data passing quality control were subjected to batch effect correction based on sample origin using the Harmony algorithm, with the first 50 principal components as input.
Differentially expressed genes were identified using the Wilcoxon rank-sum test. Gene expression differences were expressed as log2FC. Multiple hypothesis testing was corrected using the Benjamini-Hochberg method, and adjusted P values were reported. Genes with |log2FC| > 0.25 and adjusted P < 0.05 were considered significantly differentially expressed.
Intercellular communication networks were inferred with Cell Chat (ligand-receptor database-based) and compared between groups. Monocle 3 was employed for trajectory inference in monocyte-derived macrophage subsets. GSVA (with MSigDB WikiPathways and Hallmark gene sets) was applied for functional enrichment interpretation.
Dihydroethidium Staining
Following sucrose-gradient processing, tissue was embedded in OCT, rapidly frozen in liquid nitrogen vapor, and sectioned at 8 µm on a cryostat.
Reactive oxygen species (ROS) were detected using dihydroethidium (DHE) staining. Sections were treated with 10 μM DHE in PBS at 37 °C (30 min, dark), washed, and visualized microscopically.
Immunofluorescence
For double labeling, cryosections were blocked with BSA for 30 min, then incubated overnight at 4°C with a mixture of the corresponding primary antibodies. After washing, secondary antibodies were applied. Nuclei were counterstained with DAPI. Sections were mounted with antifade medium and imaged.
For triple labeling, cryosections were blocked with 3% H2O2-methanol for 25 min to quench endogenous peroxidase, followed by serum blocking for 30 min. A sequential staining cycle based on tyramide signal amplification (TSA) was then performed. In each round, sections were incubated with the primary antibody overnight at 4°C, followed by an HRP-conjugated secondary antibody and TSA incubation. After the first two rounds, antibodies were stripped using stripping buffer. After the final round, all stained sections were counterstained with DAPI, mounted with antifade medium, and imaged using a multichannel fluorescence microscope.
Measurement of Serum Biomarkers
Serum biochemical parameters were measured on an automated biochemistry analyzer (Chemray 240, Rayto Life Science, Shenzhen, China) in strict accordance with the instructions of the corresponding commercial kits (Rayto/Changchun Huili, China). All serum samples were thoroughly mixed before loading. Raw data exported from the instrument were used for subsequent statistical analysis.
Statistical Analysis
Data are presented as mean ± SEM. Comparisons between two groups were performed using unpaired two-tailed Student’s t-test. All routine statistical analyses and graphing were conducted using GraphPad Prism 8.0.1, while bioinformatics analyses were performed in R 4.3.1 environment. Significance is denoted as follows: *P < 0.05, ** P < 0.01, *** P < 0.001; ns, not significant.
Result
Establishment of an Early-Stage DCM Mouse Model
A 6‑week high‑fat/high‑fructose diet followed by low‑dose STZ injection was used to induce diabetes in mice. To assess early cardiac injury triggered by elevated blood glucose, samples were harvested 7 days after hyperglycemia surpassed the defined threshold (16.7 mmol/L) (Figure 1A). At this stage, diabetic mice exhibited significant weight loss and hyperglycemia (Figure 1B and C), accompanied by elevated serum lipids (T-CHO, TG, LDL; Figure 1D–F), indicating dyslipidemia. Increased creatine kinase (CK; Figure 1G) suggested acute cardiac injury, while elevated malondialdehyde (MDA) and decreased glutathione peroxidase (GSH-PX) in serum (Figure 1H and I) reflected systemic oxidative stress. Further analysis of cardiac tissue revealed enhanced reactive oxygen species (ROS; Figure 1J and L) and increased cardiomyocyte apoptosis (Figure 1K and M). Collectively, these results confirm that the model successfully recapitulates diabetic metabolic disturbances and presents early cardiac oxidative damage and apoptosis.
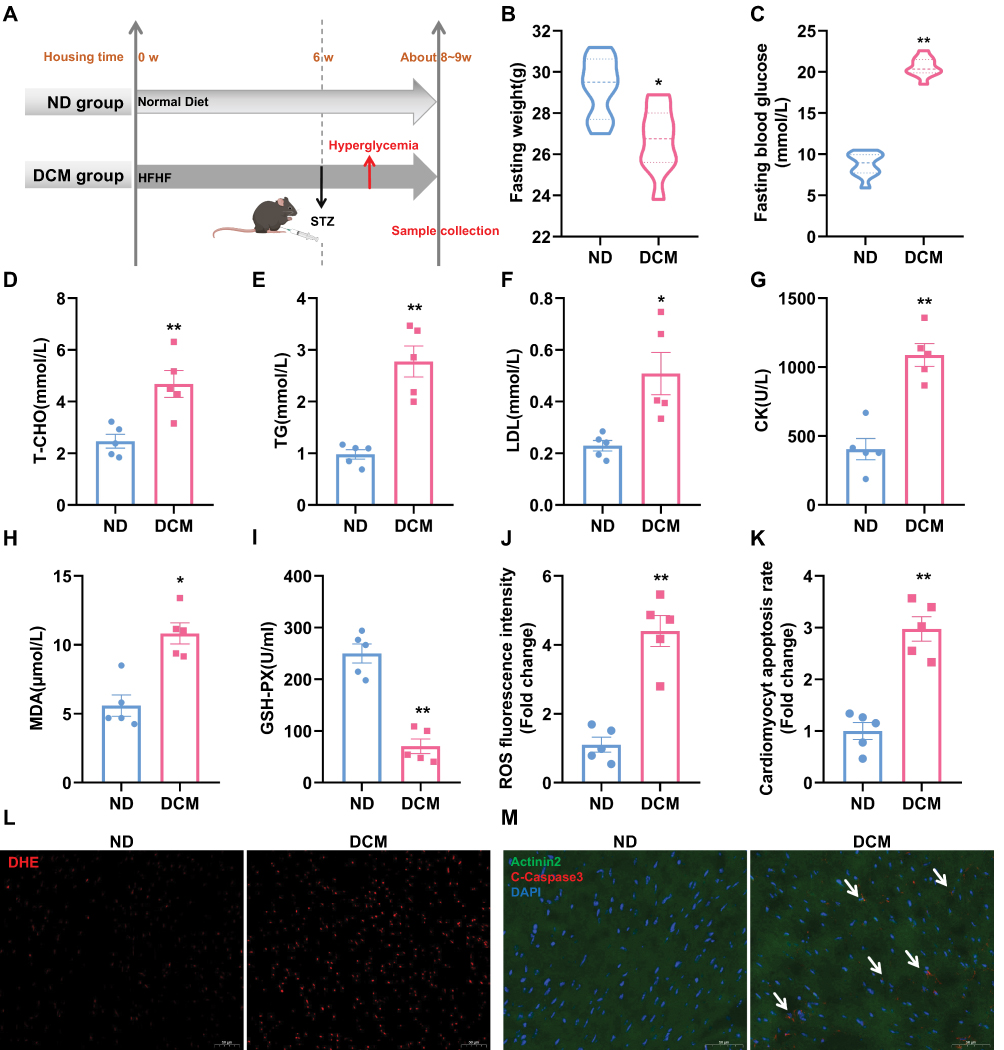 |
Figure 1 Establishment of an early-stage DCM mouse model. (A) Schematic of the diabetic mouse model establishment. (B and C) Body weight and blood glucose measured after an 8‑h daytime fast (n = 10). (D–I) Serum levels of total cholesterol (T‑CHO), triglycerides (TG), low‑density lipoprotein (LDL), creatine kinase (CK), malondialdehyde (MDA), and glutathione peroxidase (GSH‑PX) measured after a 16‑h overnight fast (n = 5). (J and L) Representative images of DHE staining in cardiac sections and semi‑quantitative analysis of reactive oxygen species (ROS) fluorescence intensity. Scale bar: 50 μm. (n = 5). (K and M) Representative images of cardiomyocyte apoptosis in cardiac sections and semi‑quantitative analysis of apoptosis rate. White arrows indicate apoptotic cardiomyocytes. Scale bar: 50 μm. (Green: Actinin2, Red: Cleaved Caspase‑3, Blue: DAPI; n = 5). * P < 0.05, ** P < 0.01 vs. ND group. |
At the same time point, echocardiographic examination showed that, compared to the control group, mice in the model group exhibited no significant alterations in left ventricular structural parameters (IVSd, LVPWd), diastolic function (assessed by E/e′ ratio), or systolic function (assessed by EF) (Supplementary Figure 2A and B). This result suggests that the model corresponds to the early phase of diabetic cardiomyopathy, characterized by the presence of metabolic disturbances and molecular damage, while cardiac function remains compensated.
Immune Landscape of the Mouse Heart
To systematically profile the cardiac immune microenvironment in early DCM, we sorted CD45⁺ immune cells from mouse hearts and performed 10x Genomics single-cell transcriptomic sequencing (Figure 2A). After quality control and batch effect correction, unsupervised clustering analysis was conducted to identify distinct immune cell populations. To visualize the clustering results, both UMAP and t-SNE nonlinear dimensionality reduction algorithms were employed to project the high-dimensional data onto a two-dimensional plane (Figure 2B and Supplementary Figure 3A). Both algorithms yielded consistent clustering, demonstrating the robustness of our cell population identification independent of the specific dimensionality reduction method. Specifically, t-SNE preferentially preserves local similarities in the data, while UMAP better reflects the relative distances and relationships between different cell subsets while retaining local structure.
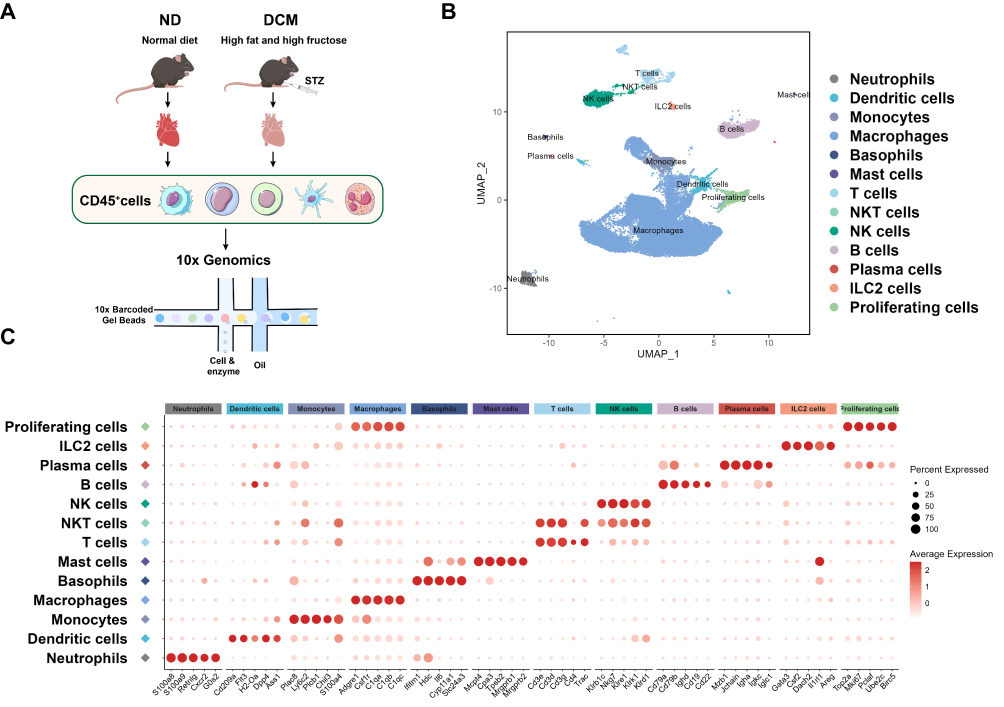 |
Figure 2 Immune landscape of the mouse heart. (A) Experimental flowchart of single‑cell RNA sequencing of cardiac immune cells in mice. The study included 6 samples (n = 6), with 3 biological replicates each for the control and model groups; each sample was pooled from cells of two hearts. (B) UMAP visualization of cardiac immune cells. Based on unsupervised clustering analysis, high-dimensional data were projected onto a two-dimensional plane using the UMAP nonlinear dimensionality reduction algorithm. Each dot represents a single cell, and different colors indicate distinct cell subsets. (C) Bubble plot showing expression of canonical marker genes across immune cell subsets. The horizontal axis denotes marker genes, and the vertical axis denotes the 13 identified immune cell subsets. Bubble color intensity represents the average expression level of the gene in the corresponding subset, while bubble size represents the percentage of cells expressing the gene within that subset. |
Cell populations were identified using a two-step approach. First, each immune subset was preliminarily annotated based on canonical marker genes reported in the literature20,29–32 (Figure 2C). Subsequently, cross-validation was performed using the differentially expressed genes of each subset in our sequencing dataset (Supplementary Figure 3B and Supplementary Table 3) to ensure annotation accuracy. Using this strategy, we successfully identified 13 distinct immune cell populations: neutrophils, dendritic cells, monocytes, macrophages, basophils, mast cells, T cells, NKT cells, NK cells, B cells, plasma cells, ILC2 cells, and proliferating immune cells.
Cardiac Immune Cell Subset Composition is Already Significantly Remodeled in Early DCM
To systematically evaluate alterations in the cardiac immune microenvironment during early DCM, we first analyzed the proportion of total immune cells in the heart by flow cytometry (see Supplementary Figure 1 for the gating strategy). The results showed that, compared to the control group, the percentage of CD45⁺ immune cells among non-cardiomyocytes in the early DCM group did not change significantly (Figure 3A). We therefore hypothesized that, at this early disease stage, remodeling of the immune microenvironment may primarily manifest as changes in the composition of immune cell subsets.
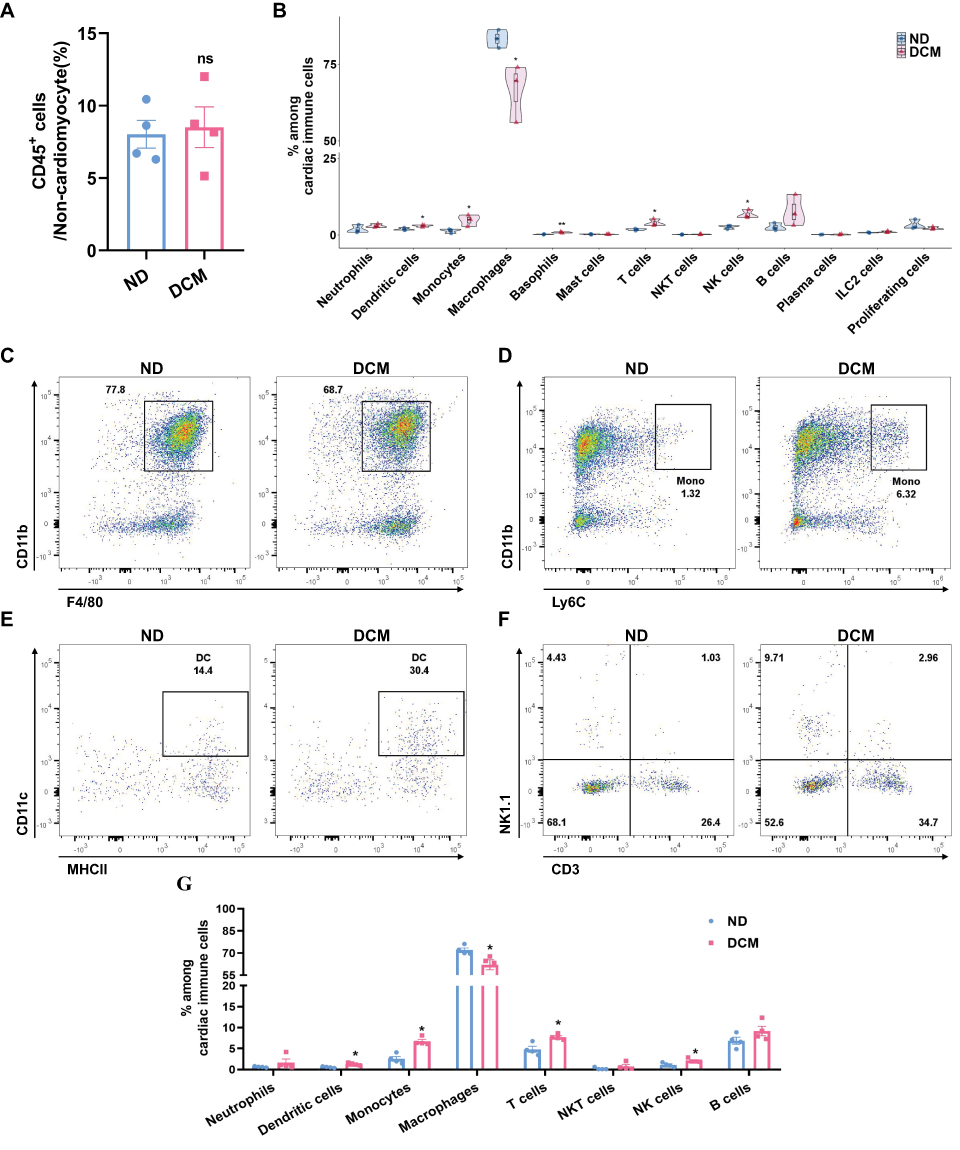 |
Figure 3 Cardiac immune cell subset composition is already significantly remodeled in early DCM. (A) Proportion of cardiac CD45⁺ immune cells among non-cardiomyocytes, assessed by flow cytometry (n = 4). (B) Violin plots (embedded with box plots and scatter points) were used to visualize the proportional distribution of each immune cell subset among total cardiac immune cells, as well as the statistical differences between the ND and DCM groups (n=3), derived from single-cell sequencing data. (C and D) Flow cytometric analysis of macrophages and monocytes in cardiac tissue. Analysis was performed on live (Zombie−) CD45⁺ cells; macrophages were identified as CD11b⁺F4/80⁺ and monocytes as CD11b⁺Ly6C⁺. Representative flow cytometry scatter plots for ND and DCM groups are shown (n = 4). (E) Flow cytometry analysis of dendritic cells in cardiac tissue. The analysis was performed on Zombie−CD45⁺CD11b⁺F4/80−Ly6C−Ly6G− cells, with dendritic cells identified as CD11c⁺MHCII+. Representative flow cytometry scatter plots for ND and DCM groups are shown (n = 4). (F) Flow cytometry analysis of T cells, NK cells, and NKT cells in cardiac tissue. Based on the Zombie−CD45⁺CD11b− population, cells were identified as: T cells (CD3⁺NK1.1−), NKT cells (CD3⁺NK1.1⁺), and NK cells (CD3−NK1.1⁺). Representative flow cytometry scatter plots for ND and DCM groups are shown (n = 4). (G) Quantitative summary of major cardiac immune subsets by flow cytometry. Within the Zombie−CD45⁺ population, proportions of neutrophils (CD11b⁺Ly6G⁺), dendritic cells, monocytes, macrophages, T cells, NKT cells, and B cells (CD11b−CD3−NK1.1−CD19⁺) were quantified in ND and DCM groups (n=4). * P < 0.05, ** P < 0.01 vs. ND group; ns, not significant. |
To further test this hypothesis, we quantitatively analyzed the composition of immune cell subsets using single-cell sequencing data. The results showed that, compared to the control group, the proportion of macrophages was decreased in the model group, while the proportions of monocytes, dendritic cells, basophils, NK cells, and T cells were significantly increased. No significant differences were observed in other cell types (Figure 3B). To validate the findings from single-cell sequencing, we performed flow cytometric analysis of cardiac immune cell composition. Based on analysis of live CD45⁺ cells, the model group exhibited a decreased proportion of macrophages (Figure 3C and G), along with significantly increased proportions of monocytes (Figure 3D and G), dendritic cells (Figure 3E and G), NK cells, and T cells (Figure 3F and G). These results were highly consistent with the trends observed in the single-cell data. In summary, through integrated analysis and validation using single-cell transcriptomic sequencing and flow cytometry, we confirmed that alterations in the cardiac immune microenvironment during early diabetes are primarily characterized by remodeling of immune cell subset composition.
Notably, the proportion of cardiac macrophages was reduced in this model. As the predominant immune cell population in the heart, the decrease in macrophage proportion suggests that metabolic stress from hyperglycemia and hyperlipidemia may severely disrupt their homeostasis. To further investigate the underlying causes and functional implications of the reduced cardiac macrophage proportion during early diabetes, we performed in-depth subpopulation analysis of the macrophage population.
Cardiac Macrophages Undergo Complex Sub‑population and Functional Shifts Under Metabolic Stress
Prior studies have indicated that under homeostatic conditions, cardiac macrophages primarily consist of three major subsets: the TLF+ (TIMD4+LYVE1+FOLR2+) subset, the CCR2−MHCIIhi subset, and the CCR2+MHCIIhi subset. Among them, the TLF+ and CCR2−MHCIIhi subsets predominantly originate from the embryonic period (yolk sac and fetal liver) and are maintained through local proliferation, playing crucial roles in preserving cardiac homeostasis. In contrast, the CCR2+ subset is primarily derived from monocytes of bone marrow and spleen, contributing to inflammation and fibrotic responses during cardiac injury and remodeling.13–15 To investigate whether hyperlipidemic and hyperglycemic-induced metabolic stress leads to more complex subpopulation differentiation and functional shifts in cardiac macrophages, we extracted monocyte-macrophage populations from total immune cells for deep clustering and annotation. Based on the canonical macrophage marker system, we identified and annotated eight discrete populations: one monocyte cluster, along with seven macrophage subsets termed TLF⁺Cxcl13−, TLF⁺Cxcl13⁺, Ccr2−MHCIIhi, Ccr2⁺MHCIIhi, Ccr2⁺Spp1⁺, Fabp4⁺ and Hypofunctional macrophages (Figure 4A and B). This refined subtyping reveals a higher degree of heterogeneity among cardiac macrophages under metabolic stress.
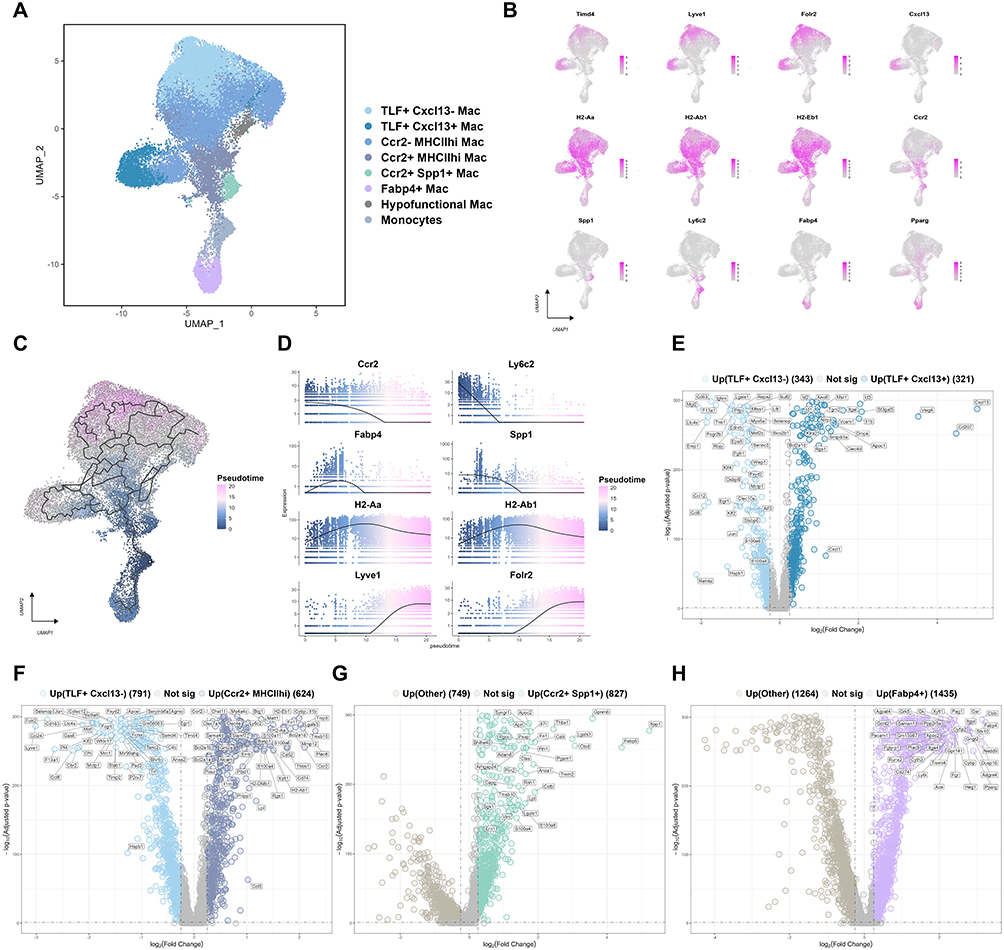 |
Figure 4 Cardiac macrophages undergo complex sub‑population and functional shifts under metabolic stress. (A) UMAP visualization of cardiac monocyte and macrophage subsets. Monocyte and macrophage lineages were extracted from total cardiac immune cells and subjected to independent dimensionality reduction and clustering analysis. (B) UMAP plots showing the distribution and expression levels of canonical marker genes used to identify and distinguish each monocyte/macrophage subset. (C) Pseudotemporal trajectory analysis of monocyte‑macrophage subsets. Using monocytes as the root node, the color gradient indicates inferred pseudotime values (blue: early state, pseudotime ≈ 0; pink: late state), revealing potential differentiation paths from monocytes toward distinct macrophage subsets. (D) Pseudotemporal dynamics of key marker gene expression. The x-axis depicts pseudotime (from 0 to the maximum value), while the y-axis shows relative expression levels. Each curve illustrates the expression dynamics of a gene along the differentiation trajectory, revealing dynamic expression patterns during the transition from monocytes to macrophages. (E–H) Volcano plots of differentially expressed genes for the following comparisons: (E) TLF⁺Cxcl13⁺ Mac vs. TLF⁺Cxcl13− Mac; (F) Ccr2⁺MHCIIhi Mac vs. TLF⁺Cxcl13− Mac; (G) Ccr2⁺Spp1⁺ Mac vs. other monocyte/macrophage subsets; (H) Fabp4⁺ Mac vs. other monocyte/macrophage subsets. Significantly upregulated genes were defined as log2FC > 0.25 and adjusted P < 0.05, while significantly downregulated genes were defined as log2FC < −0.25 and adjusted P < 0.05. The top-ranked differentially expressed genes based on |log2FC| are labeled in each plot. |
To delineate the potential origins of these subsets, we performed trajectory inference with monocytes set as the root (Figure 4C). The analysis revealed that three subsets—Ccr2⁺MHCIIhi, Ccr2⁺Spp1⁺, and Fabp4⁺ macrophages—had small pseudotime values, suggesting they likely originated from recently recruited and differentiated monocytes. In contrast, the TLF⁺Cxcl13−, TLF⁺Cxcl13⁺, and Ccr2−MHCIIhi subsets, particularly the TLF⁺Cxcl13− population, exhibited large pseudotime values, indicating they were predominantly tissue-resident macrophages maintained by local proliferation. The expression dynamics of key marker genes along the pseudotime trajectory further supported this differentiation path (Figure 4D). These findings align with the previously reported concept that ‘TLF⁺ subsets are not readily replaced by monocyte-derived cells’,33 thereby substantiating the biological plausibility of our classification.
We further conducted a systematic functional analysis of each subset:
The TLF⁺ subset, traditionally considered to exert overall anti-inflammatory and homeostatic functions, was clearly resolved into two functionally distinct subpopulations on UMAP. The TLF⁺Cxcl13− subpopulation highly expressed anti-inflammatory genes such as Retnla, Mgl2, and Klf4 (Figure 4E). Pathway enrichment analysis revealed that this subpopulation was actively involved in xenobiotic metabolism, mitotic processes, and acetylcholine synthesis (Supplementary Figure 4A and B). Collectively, these features identify the TLF⁺Cxcl13− subpopulation as a core guardian of cardiac homeostasis, responsible for tissue repair, toxin clearance, and maintenance of neuro-immune crosstalk. In contrast, the TLF⁺Cxcl13⁺ subpopulation exhibited specific Cxcl13 upregulation—a key factor in B cell homing—and was enriched for IL-1 signaling and inflammatory cytokine responses (Figure 4E and Supplementary Figure 4A, indicating a previously overlooked pro-inflammatory role involving B cell recruitment and local inflammation initiation.
The Ccr2−MHCIIhi subset lacked Ccr2 but highly expressed key MHC class II genes (H2-Eb1, H2-Ab1, H2-Aa; Figure 4B). This clearly indicates that the CCR2−MHCIIhi subset represents a population of cardiac-resident antigen-presenting macrophages, likely playing a key immunomodulatory role through interactions with CD4⁺ T cells.
The Ccr2⁺MHCIIhi subset expressed both Ccr2 and MHC class II molecules (Figure 4B) and displayed a transcriptional profile enriched in pro-inflammatory mediators (Il1b, Malt1, Ccl5) and tissue-degrading factors (Mmp12, Plaur) (Figure 4F). Pathway enrichment further supported its pro-inflammatory identity, with significant representation in inflammatory response and interferon-α/γ signaling (Supplementary Figure 4B). These data collectively identify this subset as an M1-type, monocyte-derived pro-inflammatory macrophage.
The Ccr2⁺Spp1⁺ subset was characterized by high expression of a series of known pro-fibrotic factors, including Spp1, Lgals3, Thbs1, and Fn1 (Figure 4G). Pathway enrichment analysis revealed significant upregulation of the TGF-β signaling pathway and focal adhesion pathway (Supplementary Figure 4C). Collectively, these characteristics implicate Ccr2⁺Spp1⁺ macrophages as critical cellular mediators bridging inflammation and cardiac fibrosis, likely through activation of cardiac fibroblasts, leading to collagen accumulation and adverse remodeling. Notably, this subset also showed elevated expression of lipid metabolism-related genes (e.g., Fabp5, Lpl) and enrichment in PPAR signaling and fatty acid β-oxidation pathways, suggesting that significant metabolic reprogramming occurs concurrently under high-fat and high-sugar conditions.
The Fabp4⁺ subset exhibited a marked lipid metabolic reprogramming signature (Figure 4H and Supplementary Figure 4D), characterized by comprehensive activation of gene networks involved in lipid uptake, storage, and metabolism, including Fabp4, Pparg, Gk, and Apoc2. It was also significantly enriched in signaling pathways related to triglyceride synthesis, adipogenesis, lipid metabolism and the like. Moreover, this subset highly expressed endothelial adhesion molecules (e.g., Pecam1, Itgal, Itga4), suggesting its potential localization near cardiac vessels. Notably, the Fabp4⁺ subset also showed high expression of the immune checkpoint molecule PD-L1 (Cd274). We hypothesize that the Fabp4⁺ subset plays a dual role in the hyperglycemic and hyperlipidemic environment: on the one hand, it adapts to and buffers local metabolic disturbances by enhancing lipid storage capacity; on the other hand, it may suppress excessive inflammatory responses through upregulation of PD-L1, thereby striving to maintain cardiac immune-metabolic homeostasis under metabolic stress.
In addition, we identified a population of hypofunctional macrophages that showed an increasing trend in the model group (Figure 5A). Compared to other monocyte/macrophage subsets, this population exhibited lower transcriptional activity (low nFeature_RNA), lower ribosomal content (low percent.ribo), and did not express lineage or activation markers (Figure 4B and Supplementary Figure 4E and F). Based on these features, we inferred that they are in a hypofunctional state and tentatively designated them as “Hypofunctional Mac.” The characteristics of this subset may resemble the “hypophagia” macrophages described by Pinney et al,34 which represent a “reduced appetite” state following intense antibody-dependent phagocytosis. The precise biological role of this subset warrants further experimental investigation.
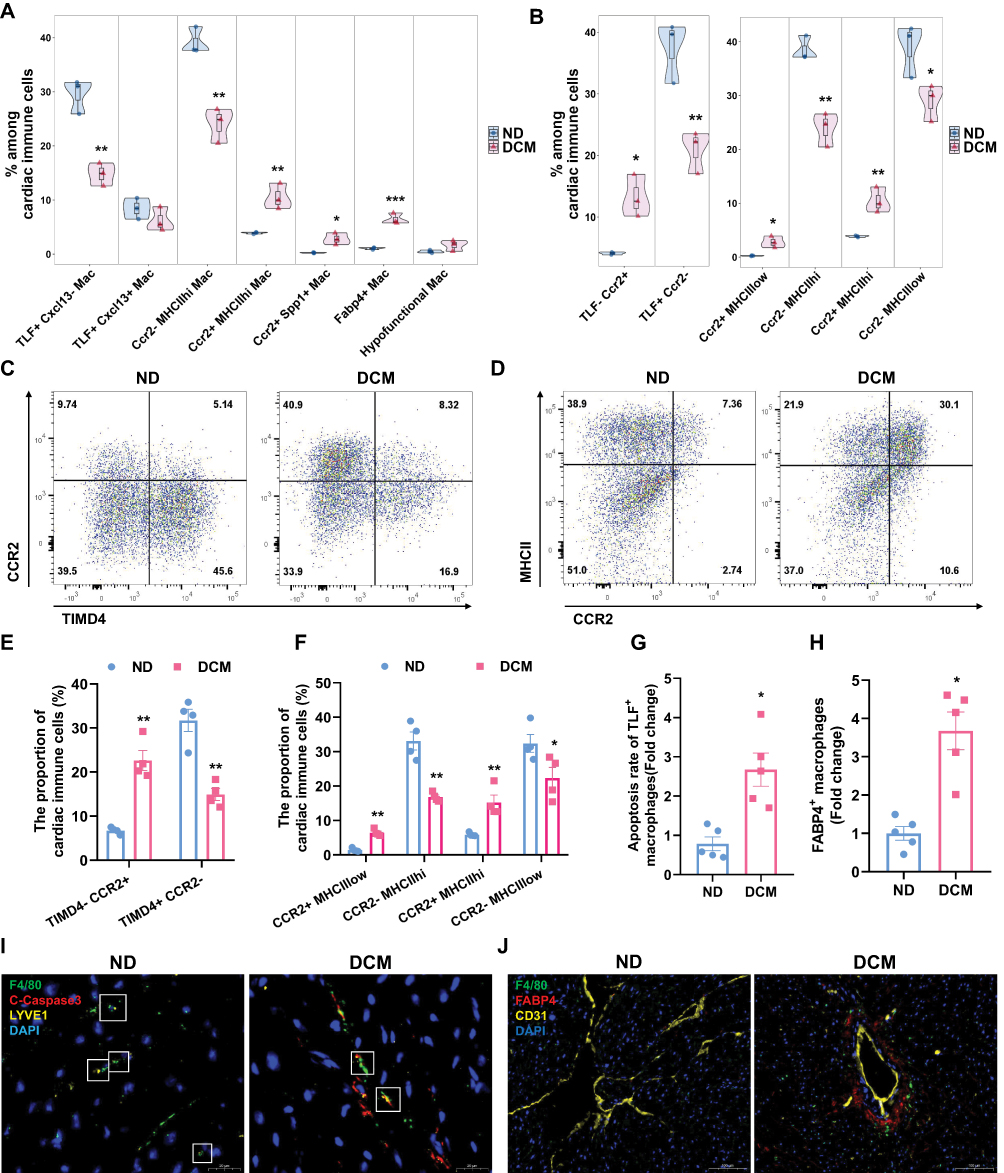 |
Figure 5 Metabolic stress drives macrophage transition from homeostasis maintenance toward a pathological state characterized by inflammation, fibrosis, and lipid metabolic reprogramming. (A) Violin plots (embedded with box plots and scatter points) were used to visualize the proportional distribution of macrophage subsets among total cardiac immune cells, as well as the statistical differences between the ND and DCM groups (n=3), derived from single-cell sequencing data. (B) Classification of macrophage subsets based on marker gene expression and comparison between the two groups. Left panel: Subset stratification by TLF and Ccr2 expression; Right panel: Subset stratification by MHCII and Ccr2 expression. n=3. Data are derived from single-cell sequencing. (C–F) Flow cytometry analysis of cardiac macrophage subsets. Based on Zombie−CD45⁺CD11b⁺F4/80⁺ cells, representative flow cytometry scatter plots and statistical summaries of their proportions among total cardiac immune cells for ND and DCM groups are shown (n = 4). (G and I) Representative images of TLF⁺ macrophage apoptosis in cardiac sections and semi‑quantitative analysis of apoptosis rate. Scale bar: 20 μm. (Green: F4/80, Red: Cleaved caspase‑3, Yellow: LYVE1, Blue: DAPI; n = 5). (H and J) Representative images of FABP4⁺ macrophages in cardiac sections and semi‑quantitative analysis of their abundance. Scale bar: 100 μm. (Green: F4/80, Red: FABP4, Yellow: CD31, Blue: DAPI; n = 5). * P < 0.05, ** P < 0.01, *** P < 0.001 vs. ND group. |
Metabolic Stress Drives Macrophage Transition from Homeostasis Maintenance Toward a Pathological State Characterized by Inflammation, Fibrosis, and Lipid Metabolic Reprogramming
Through quantitative comparison of cardiac macrophage subpopulations between the ND group and the early DCM group, we found that the proportions of resident macrophage subsets (including the TLF⁺Cxcl13− and Ccr2−MHCIIhi subsets) were significantly decreased in the model group. Conversely, the proportions of monocyte-derived recruited macrophage subsets (including the Ccr2⁺MHCIIhi, Ccr2⁺Spp1⁺, and Fabp4⁺ subsets) were markedly increased (Figure 5A), indicating that the cardiac immune microenvironment tilts from a homeostatic state toward a pathological condition characterized by inflammation, fibrosis, and lipid metabolic reprogramming.
To validate the above findings at the protein level, we analyzed key macrophage subsets by flow cytometry. First, using TIMD4 and CCR2 as markers for macrophage classification, we observed a decreased proportion of resident macrophages (TIMD4⁺CCR2−) and a significantly increased proportion of recruited macrophages (TIMD4−CCR2⁺) in the model group (Figure 5C and E). Furthermore, when macrophages were classified using MHCII and CCR2, both resident subsets (CCR2−MHCIIhi and CCR2−MHCIIlow) showed reduced proportions, whereas both recruited subsets (CCR2⁺MHCIIhi and CCR2⁺MHCIIlow) were significantly increased in the model group (Figure 5D and F). These flow cytometry results were highly consistent with the single-cell sequencing data (Figure 5B).
To investigate the reduction in resident macrophage proportions, we noted from Supplementary Figure 4B that the TLF⁺Cxcl13− subset was significantly enriched in apoptosis-related signaling pathways, leading us to hypothesize that metabolic toxicity may induce apoptosis in this population. To directly test this hypothesis, we performed immunofluorescence co-localization experiments. The results clearly demonstrated co-localization of TLF⁺ macrophages with the apoptosis marker cleaved Caspase-3 in cardiac tissue (Figure 5G and I). These findings confirm that under metabolic stress, a portion of cardiac resident macrophages indeed undergo apoptosis, which likely represents a key mechanism contributing to the decline in cardiac homeostasis.
Furthermore, Figure 4H and Supplementary Figure 4D suggested that the Fabp4⁺ macrophage subset may localize to perivascular regions. To confirm the expansion and spatial distribution of this subset, we performed immunofluorescence staining for Fabp4⁺ macrophages. The results showed a significant increase in the number of Fabp4⁺ macrophages in perivascular areas of cardiac tissue in the model group (Figure 5H and J). This spatial evidence suggests that the Fabp4⁺ macrophage subset—characterized by lipid metabolic adaptation and immunomodulatory potential—expands during early DCM, further enriching our understanding of macrophage functional heterogeneity in metabolic cardiac injury.
Ccr2+MHCIIhi Macrophages May Facilitate Monocyte Recruitment and Induce Lipid Metabolic Remodeling in Fabp4+ Subpopulations
To systematically dissect the cell-cell interactions within the cardiac immune microenvironment in early diabetes, we performed communication analysis on scRNA-seq data using the CellChat package. The results indicated that metabolic stress profoundly altered the intercellular communication landscape in the heart, with notable intensification of macrophage-monocyte and macrophage-NK cell crosstalk (Figure 6A). To investigate the molecular mechanisms driving cell recruitment and interactions, we first profiled the expression of chemokines and their receptors in cardiac immune cells. The results showed that macrophages, monocytes, dendritic cells, and NK cells, whose proportions were significantly altered in early DCM, predominantly expressed chemokine receptors of the CCR family (Figure 6B). Notably, the Fabp4⁺ macrophage subset exhibited minimal CCR receptor expression, suggesting its unresponsiveness to classical CCL chemokine signals. Based on these findings, we focused our subsequent analysis on the CCL signaling axis. Network centrality scoring indicated diminished CCL signal output from resident CCR2− macrophage subsets (TLF⁺Cxcl13−, TLF⁺Cxcl13⁺, Ccr2−MHCIIhi) in the model group, alongside enhanced output from Ccr2⁺MHCIIhi macrophages and NK cells. Moreover, CCL signal reception was strengthened in multiple subsets: Ccr2⁺MHCIIhi and Ccr2⁺Spp1⁺ macrophages, monocytes, dendritic cells, basophils, NK cells and T cells (Figure 6C and Supplementary Figure 5). To identify the primary cellular sources that recruit peripheral monocytes, we further analyzed the communication probabilities between cell subsets. As shown in Figure 6D and Supplementary Figure 5, among potential CCL signaling sources, the Ccr2⁺MHCIIhi macrophage subset exhibited the highest communication probability with monocytes. Considering its significantly enhanced signaling output capacity in early diabetes (Figure 6C), we propose that Ccr2⁺MHCIIhi macrophages are key responders to glucolipid metabolic stress, actively driving monocyte infiltration into the heart, and the CCL2-CCR2 and CCL6-CCR2 axes represent the primary signaling pathways mediating this recruitment (Figure 6E).
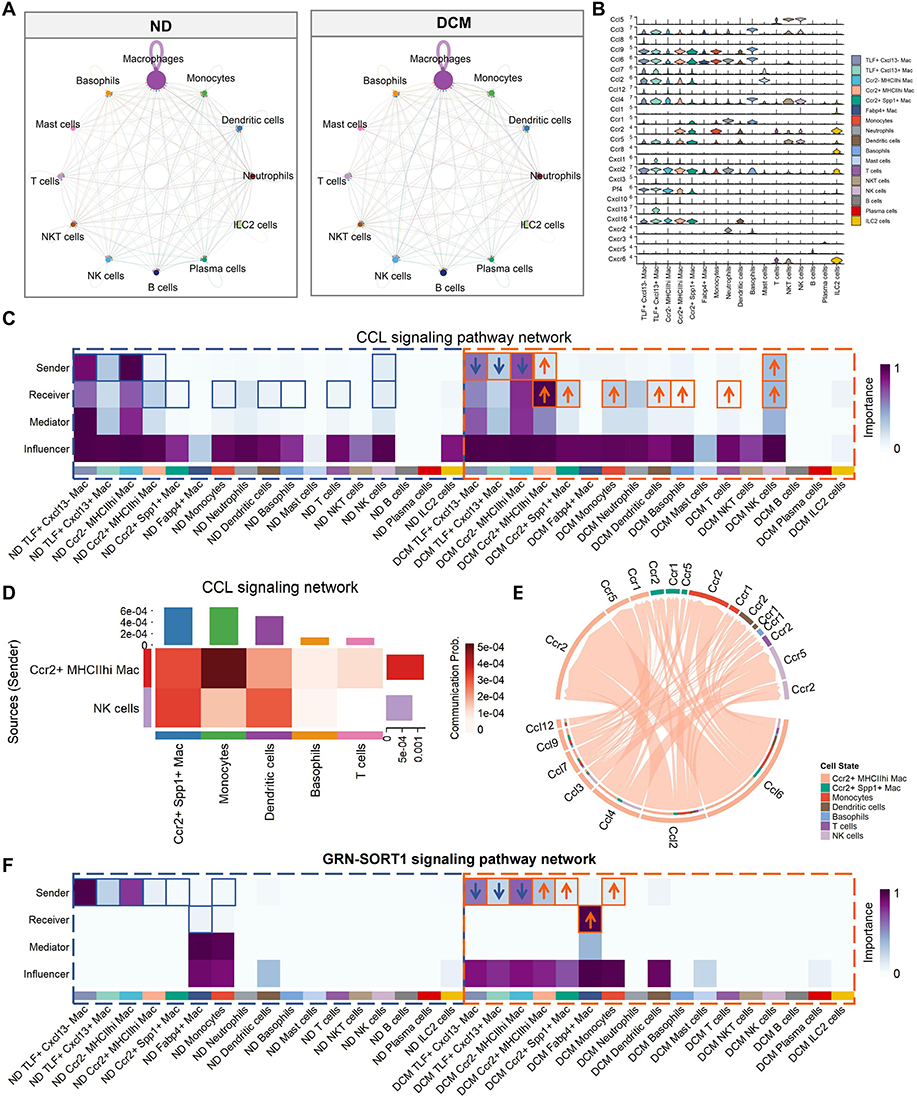 |
Figure 6 Ccr2+MHCIIhi macrophages may facilitate monocyte recruitment and induce lipid metabolic remodeling in Fabp4+ subpopulations. (A) Comparison of interaction strengths in cardiac immune cell communication networks between ND and DCM groups (CellChat analysis). Node size represents cell abundance, with larger nodes indicating a higher proportion of that subset among cardiac immune cells. Chord width represents communication strength, with wider chords indicating stronger intercellular interactions between two subgroups. (B) Violin plot displaying expression levels of chemokine and chemokine receptor genes across different cardiac immune cell types. (C and F) Centrality analysis of CCL (C) and GRN-SORT1 (F) signaling networks among cardiac immune cells in ND and DCM groups. Heatmaps depict four role scores for each immune cell subset within the communication network: Sender (signal output capacity; higher scores indicate stronger signal emission to other cells), Receiver (signal input capacity; higher scores indicate stronger reception of incoming signals), Mediator (signaling hub role; higher scores reflect a key hub function in signal cascades), and Influencer (global impact; higher scores suggest that signaling changes in this subset exert greater effects on the overall network). Color scale from blue to purple represents low to high scores. (D) Communication heatmap of the CCL signaling pathway. Ccr2⁺MHCIIhi macrophages and NK cells were designated as CCL signal senders, while Ccr2⁺Spp1⁺ macrophages, monocytes, dendritic cells, basophils, and T cells were designated as CCL signal receivers. Darker red colors indicate higher communication probabilities. (E) Chord diagram illustrating the CCL signaling network. Ccr2⁺MHCIIhi macrophages were designated as signal senders (emitting CCL chemokines), while the following cell types were designated as signal receivers: Ccr2⁺MHCIIhi macrophages, Ccr2⁺Spp1⁺ macrophages, monocytes, dendritic cells, basophils, NK cells, and T cells. Colored segments along the circle perimeter represent different cell types, and the chords connecting senders and receivers denote communication relationships, with chord width proportional to communication probability intensity. The specific signaling axis involves senders acting through CCL chemokines on corresponding CCR receptors expressed by receivers. |
Notably, although unresponsive to CCL signaling, the Fabp4⁺ macrophage subset exhibited a specialized communication signature in the metabolically stressed microenvironment. Under steady state, Fabp4⁺ cells showed limited engagement with the GRN–SORT1 pathway, whereas under metabolic stress, they robustly received GRN signals through SORT1 receptor (Figure 6F). In parallel, GRN secretion was elevated in Ccr2⁺MHCIIhi and Ccr2⁺Spp1⁺ macrophages and monocytes. We speculate that this unique “GRN–SORT1” signaling axis may “instruct” newly recruited monocytes to avidly take up lipids in the diabetic milieu, thereby converting them into Fabp4⁺ macrophages, ultimately shaping the distinctive metabolic phenotype of this subset.
Discussion
While the pathogenesis of diabetic cardiomyopathy has been extensively studied in terms of cardiomyocyte metabolism and fibrosis,8,35 systematic changes in the cardiac immune microenvironment at disease onset remain poorly understood. Here, in this study, using scRNA‑seq coupled with multi‑dimensional experimental approaches, we systematically delineated the remodeling of the cardiac immune landscape during early diabetes, with a particular focus on the profound differentiation and functional shifts of macrophage subpopulations.
From a global immune landscape perspective, in the early stage of DCM, multiple immune cells infiltrate coordinately to generate a pro-inflammatory, damage-promoting microenvironment. The substantial infiltration of monocytes, as macrophage precursors, provides the cellular source for pathological macrophage expansion and directly propagates the subsequent inflammatory cascades.36,37 Dendritic cells, as professional antigen-presenting cells, may bridge innate and adaptive immunity through their infiltration and activation. Infiltrating T cells can, on one the hand, may activate macrophages by secreting cytokines such as IFN-γ and TNF-α, thereby amplifying local inflammatory responses. On the other hand, their potential interaction with dendritic cells may drive T cell differentiation toward effector or memory phenotypes, providing an immunological memory basis for the persistence of chronic inflammation and the progression of long-term myocardial injury.38 NK cells may enhance local inflammation via cytokine secretion (e.g., IFN-γ, TNF-α) and possible cytotoxic activity against stressed cells.39,40 Basophils, though scarce, may rapidly release histamine, IL-4, and IL-13 to influence vascular permeability and immune polarization.41 Together, these immune cells synergistically establish a pro-inflammatory and pro-fibrotic microenvironment, laying an early groundwork for the progression of diabetic cardiomyopathy.
Leveraging the high-resolution capacity of scRNA-seq, we identified functional heterogeneity beyond the reach of traditional methods. Within the conventionally homeostatic TLF⁺ macrophage pool, we delineated distinct subsets: TLF⁺Cxcl13− macrophages perform tissue repair and detoxification, while TLF⁺Cxcl13⁺ macrophages express high levels of Cxcl13 and are enriched in inflammatory pathways, indicating a potential role in B cell recruitment and local inflammation initiation.42,43 This finding suggests that embryonically derived resident macrophages also possess substantial functional reprogramming capacity, and their role as guardians of homeostasis should be precisely defined according to the specific environmental context.
In early DCM, metabolic stress induces apoptosis in the homeostatic TLF⁺Cxcl13− macrophage subset, thereby compromising cardiac tissue repair and clearance of toxic substances. In parallel, monocyte-derived macrophages exhibited marked expansion and functional specialization. The Ccr2+MHCIIhi subset serves as an early driver of the inflammatory response, secreting chemokines such as CCL2 and CCL6 to recruit monocytes and thereby amplify the inflammatory cascade. Ccr2⁺Spp1⁺ macrophages express high levels of Spp1 and other fibrotic factors, positioning them as a pivotal link between inflammation and fibrosis. The specific perivascular accumulation of the Fabp4⁺ subset and its lipid-metabolic reprogramming features suggest that this population represents an adaptive response of the heart to metabolic overload, buffering the local lipotoxic microenvironment by enhancing lipid uptake and storage capacity. Although this metabolic adaptation may temporarily alleviate lipid overload stress, it may contribute to chronic disturbances in the perivascular niche in the long term.
Our results indicate that immune microenvironmental remodeling in DCM heart follows a tightly orchestrated, system-level program. Communication network analysis uncovered a key driver: Ccr2⁺MHCIIhi macrophages not only act as a core signaling source for monocyte infiltration but may also participate in shaping the lipid metabolic phenotype of the Fabp4⁺ subset via the GRN–SORT1 signaling axis. This observation is consistent with the work of Bajpai et al, who showed that heart CCR2⁺ macrophages facilitate monocyte recruitment after myocardial injury,44 thereby reinforcing the central role of this population in initiating the immune-cell cascade.
It should be noted that the functional biases of macrophage subsets and the intercellular communication mechanisms proposed in this study, based on single-cell transcriptomic data, are currently exploratory findings. Although we have validated cell proportions and localization through flow cytometry and immunofluorescence, the causal roles of signaling axes such as CCL2/6–CCR2 and GRN–SORT1 in early diabetic cardiac injury require further confirmation through macrophage-specific gene knockout experiments or pharmacological interventions. Future studies should integrate functional assays to thoroughly elucidate the precise roles of these signaling pathways in immune remodeling and evaluate their translational potential as early intervention targets.
In recent years, novel glucose-lowering agents represented by glucagon-like peptide-1 receptor agonists (GLP-1RAs) and sodium-glucose cotransporter 2 inhibitors (SGLT2is) have achieved breakthrough advances in cardiovascular protection. Clinical studies have confirmed that GLP-1RAs significantly reduce the risk of major adverse cardiovascular events and the incidence of new-onset atrial fibrillation.45,46 SGLT2 inhibitors decrease the risk of heart failure hospitalization, cardiovascular death, and atrial fibrillation. Their benefits in patients suffering from heart failure with reduced ejection fraction have led to their inclusion as a core component of heart failure treatment regimens.47 The beneficial effects of these two classes of drugs on diabetic cardiovascular complications suggest that simply controlling blood glucose may not be the sole mechanism underlying cardiac protection. Their pleiotropic effects, including anti-inflammation, metabolic improvement, and direct myocardial protection, are also critical.47 Previous studies have shown that SGLT2 inhibitors promote macrophage polarization toward the M2 anti-inflammatory phenotype, thereby alleviating insulin resistance and inflammatory responses.48 GLP-1 receptor agonists have also been demonstrated to reduce macrophage infiltration and suppress NF-κB-mediated inflammatory pathways.49 In line with our findings, GLP-1RAs and SGLT2is may protect the heart by modulating macrophage homeostasis—e.g., protecting resident macrophages from apoptosis or inhibiting the Ccr2⁺MHCIIhi macrophage-driven inflammatory cascade. Future studies could employ interventional experiments in animal models to explore the regulatory effects of these drugs on specific macrophage subsets. Additionally, clinical cohort studies could validate the correlation between changes in circulating immune cell subsets and drug efficacy, thereby providing new targets and strategies for early precision intervention in diabetic cardiomyopathy.
Conclusion
In summary, this study provides the first high-resolution map of cardiac immune microenvironment remodeling during early diabetic cardiomyopathy at single-cell resolution. We found that prior to the onset of overt cardiac dysfunction, the immune microenvironment had already undergone a profound transition from homeostatic maintenance toward inflammation-fibrosis-lipid metabolism remodeling. Specifically, apoptosis of a subset of resident macrophages (TLF⁺Cxcl13−) led to a loss of endogenous protective mechanisms, while macrophage subsets derived from peripheral monocytes expanded substantially and differentiated into functionally specialized subpopulations: pro-inflammatory (Ccr2⁺MHCIIhi), pro-fibrotic (Ccr2⁺Spp1⁺), and lipid-reprogrammed (Fabp4⁺) subsets. Further investigation revealed that Ccr2⁺MHCIIhi macrophages may drive a pro-inflammatory circuit by recruiting monocytes and may also promote lipid metabolic reprogramming in the Fabp4⁺ subset, thereby establishing a self-perpetuating pathological process. These findings uncover an actionable “immune time window” in early DCM. Targeting Ccr2⁺MHCIIhi mediated monocyte recruitment to interrupt the inflammatory cascade, or preserving resident macrophage homeostasis to maintain immune balance, may represent promising strategies for intervening in early DCM progression.
Data Sharing Statement
The data that support the findings of this study are available from the corresponding author, Jian-Ping Cai, upon reasonable request.
Author Contributions
Kun Xu: Conceptualization, Data curation, Methodology, Formal Analysis, Visualization, Writing - original draft. Ying-min Zhang, Lan Yang, Li Zhang, Yun-wen Zhang, Jia-qi Guo: Data curation, Methodology, Formal Analysis, Visualization. Jian-ping Cai: Conceptualization, Supervision, Writing - review and editing, Funding Acquisition.
All authors made a significant contribution to the work reported, whether that is in the conception, study design, execution, acquisition of data, analysis and interpretation, or in all these areas; took part in drafting, revising or critically reviewing the article; gave final approval of the version to be published; have agreed on the journal to which the article has been submitted; and agree to be accountable for all aspects of the work.
Funding
This article was supported by the National High Level Hospital Clinical Research Funding (grant number: BJ-2024-138), the Chinese Academy of Medical Sciences Innovation Fund for Medical Sciences (grant number: 2021-1-I2M-050), and the National Key R&D Program of China (2024YFA1109102).
Disclosure
The authors declare no competing interests.
References
1. International Diabetes Federation. IDF Diabetes Atlas. In: Brussels.
2. Yu MG, Gordin D, Fu J, Park K, Li Q, King GL. Protective Factors and the Pathogenesis of Complications in Diabetes. Endocrine Rev. 2024;45(2):227–19. doi:10.1210/endrev/bnad030
3. Cole JB, Florez JC. Genetics of diabetes mellitus and diabetes complications. Nat Rev Nephrol. 2020;16(7):377–390. doi:10.1038/s41581-020-0278-5
4. Tan Y, Zhang Z, Zheng C, Wintergerst KA, Keller BB, Cai L. Mechanisms of diabetic cardiomyopathy and potential therapeutic strategies: preclinical and clinical evidence. Nat Rev Cardiol. 2020;17(9):585–607. doi:10.1038/s41569-020-0339-2
5. Avagimyan A, Popov S, Shalnova S. The Pathophysiological Basis of Diabetic Cardiomyopathy Development. Curr Prob Cardiol. 2022;47(9):101156. doi:10.1016/j.cpcardiol.2022.101156
6. Ritchie RH, Abel ED. Basic Mechanisms of Diabetic Heart Disease. Circ Res. 2020;126(11):1501–1525. doi:10.1161/CIRCRESAHA.120.315913
7. Karwi QG, Ho KL, Pherwani S, Ketema EB, Sun Q, Lopaschuk GD. Concurrent diabetes and heart failure: interplay and novel therapeutic approaches. Cardiovasc Res. 2022;118(3):686–715. doi:10.1093/cvr/cvab120
8. Jankauskas SS, Kansakar U, Varzideh F, et al. Heart failure in diabetes. Metabolism. 2021;125:154910. doi:10.1016/j.metabol.2021.154910
9. Kenny HC, Abel ED. Heart Failure in Type 2 Diabetes Mellitus. Circ Res. 2019;124(1):121–141. doi:10.1161/CIRCRESAHA.118.311371
10. Huo JL, Feng Q, Pan S, Fu WJ, Liu Z, Liu Z. Diabetic cardiomyopathy: early diagnostic biomarkers, pathogenetic mechanisms, and therapeutic interventions. Cell Death Discov. 2023;9(1):256. doi:10.1038/s41420-023-01553-4
11. Chavali V, Tyagi SC, Mishra PK. Predictors and prevention of diabetic cardiomyopathy. Diabetes Metab Syndr Obes. 2013;6:151–160. doi:10.2147/DMSO.S30968
12. Chen R, Zhang H, Tang B, et al. Macrophages in cardiovascular diseases: molecular mechanisms and therapeutic targets. Signal Transduc Target Ther. 2024;9(1):130. doi:10.1038/s41392-024-01840-1
13. Jin J, Wang Y, Liu Y, Chakrabarti S, Su Z. Cardiac resident macrophages: spatiotemporal distribution, development, physiological functions, and their translational potential on cardiac diseases. Acta Pharm Sin B. 2024;14(4):1483–1493. doi:10.1016/j.apsb.2023.12.018
14. Holt M, Lin J, Cicka M, Wong A, Epelman S, Lavine KJ. Dissecting and Visualizing the Functional Diversity of Cardiac Macrophages. Circ Res. 2024;134(12):1791–1807. doi:10.1161/CIRCRESAHA.124.323817
15. Zaman R, Epelman S. Resident cardiac macrophages: heterogeneity and function in health and disease. Immunity. 2022;55(9):1549–1563. doi:10.1016/j.immuni.2022.08.009
16. Shanmugam N, Reddy MA, Guha M, Natarajan R. High glucose-induced expression of proinflammatory cytokine and chemokine genes in monocytic cells. Diabetes. 2003;52(5):1256–1264. doi:10.2337/diabetes.52.5.1256
17. Tan X, Hu L, Shu Z, et al. Role of CCR2 in the Development of Streptozotocin-Treated Diabetic Cardiomyopathy. Diabetes. 2019;68(11):2063–2073. doi:10.2337/db18-1231
18. Zhang C, Shi Y, Liu C, et al. Therapeutic strategies targeting mechanisms of macrophages in diabetic heart disease. Cardiovas Diabetol. 2024;23(1):169. doi:10.1186/s12933-024-02273-4
19. Nahrendorf M, Swirski FK. Abandoning M1/M2 for a Network Model of Macrophage Function. Circ Res. 2016;119(3):414–417. doi:10.1161/CIRCRESAHA.116.309194
20. Rizzo G, Gropper J, Piollet M, et al. Dynamics of monocyte-derived macrophage diversity in experimental myocardial infarction. Cardiovasc Res. 2023;119(3):772–785. doi:10.1093/cvr/cvac113
21. Li Y, Wang S, Zhang R, et al. Single-cell and spatial analysis reveals the interaction between ITLN1(+) foam cells and SPP1(+) macrophages in atherosclerosis. Front Cardiovasc Med. 2025;12:1510082. doi:10.3389/fcvm.2025.1510082
22. Sun K, Li YY, Jin J. A double-edged sword of immuno-microenvironment in cardiac homeostasis and injury repair. Signal Transduc Target Ther. 2021;6(1):79. doi:10.1038/s41392-020-00455-6
23. Li F, Xing X, Jin Q, et al. Sex differences orchestrated by androgens at single-cell resolution. Nature. 2024;629(8010):193–200. doi:10.1038/s41586-024-07291-6
24. Chen HL, Wang QY, Qi RM, Cai JP. Identification of the changes in the platelet proteomic profile of elderly individuals. Front Cardiovasc Med. 2024;11:1384679. doi:10.3389/fcvm.2024.1384679
25. Wang QY, Zhang W, Zhao Y, et al. Colonic L-cell impairment in aged subjects with type 2 diabetes leads to diminished GLP-1 production. Diabetes Metab Syndr. 2023;17(12):102907. doi:10.1016/j.dsx.2023.102907
26. Koenig AL, Shchukina I, Amrute J, et al. Single-cell transcriptomics reveals cell-type-specific diversification in human heart failure. Nat Cardiovasc Res. 2022;1(3):263–280. doi:10.1038/s44161-022-00028-6
27. Litviňuková M, Talavera-López C, Maatz H, et al. Cells of the adult human heart. Nature. 2020;588(7838):466–472. doi:10.1038/s41586-020-2797-4
28. Reichart D, Lindberg EL, Maatz H, et al. Pathogenic variants damage cell composition and single cell transcription in cardiomyopathies. Science. 2022;377(6606):eabo1984. doi:10.1126/science.abo1984
29. Li H, Zhu X, Cao X, Lu Y, Zhou J, Zhang X. Single-cell analysis reveals lysyl oxidase (Lox)(+) fibroblast subset involved in cardiac fibrosis of diabetic mice. J Adv Res. 2023;54:223–237. doi:10.1016/j.jare.2023.01.018
30. Jin K, Gao S, Yang P, et al. Single-Cell RNA Sequencing Reveals the Temporal Diversity and Dynamics of Cardiac Immunity after Myocardial Infarction. Small Methods. 2022;6(3):e2100752. doi:10.1002/smtd.202100752
31. Fortin BM, Pfeiffer SM, Insua-Rodríguez J, et al. Circadian control of tumor immunosuppression affects efficacy of immune checkpoint blockade. Nat Immunol. 2024;25(7):1257–1269. doi:10.1038/s41590-024-01859-0
32. Tucker NR, Chaffin M, Fleming SJ, et al. Transcriptional and Cellular Diversity of the Human Heart. Circulation. 2020;142(5):466–482. doi:10.1161/CIRCULATIONAHA.119.045401
33. Dick SA, Wong A, Hamidzada H, et al. Three tissue resident macrophage subsets coexist across organs with conserved origins and life cycles. Sci Immunol. 2022;7(67):eabf7777. doi:10.1126/sciimmunol.abf7777
34. Pinney JJ, Rivera-Escalera F, Chu CC, et al. Macrophage hypophagia as a mechanism of innate immune exhaustion in mAb-induced cell clearance. Blood. 2020;136(18):2065–2079. doi:10.1182/blood.2020005571
35. Chang X, Li Y, Cai C, et al. Mitochondrial quality control mechanisms as molecular targets in diabetic heart. Metabolism. 2022;137:155313. doi:10.1016/j.metabol.2022.155313
36. Dick SA, Macklin JA, Nejat S, et al. Self-renewing resident cardiac macrophages limit adverse remodeling following myocardial infarction. Nat Immunol. 2019;20(1):29–39. doi:10.1038/s41590-018-0272-2
37. Revelo XS, Parthiban P, Chen C, et al. Cardiac Resident Macrophages Prevent Fibrosis and Stimulate Angiogenesis. Circ Res. 2021;129(12):1086–1101. doi:10.1161/CIRCRESAHA.121.319737
38. Martín P, Sánchez-Madrid F. T cells in cardiac health and disease. J Clin Invest. 2025;135(2). doi:10.1172/JCI185218
39. De Barra C, D O, Hogan AE. NK cells vs. obesity: a tale of dysfunction & redemption. Clin Immunol. 2023;255:109744. doi:10.1016/j.clim.2023.109744
40. Mace EM. Human natural killer cells: form, function, and development. J Allergy Clin Immunol. 2023;151(2):371–385. doi:10.1016/j.jaci.2022.09.022
41. Chen Y, Tang H, Yao B, Pan S, Ying S, Zhang C. Basophil differentiation, heterogeneity, and functional implications. Trends Immunol. 2024;45(7):523–534. doi:10.1016/j.it.2024.05.009
42. Hao D, Han G, Sinjab A, et al. The Single-Cell Immunogenomic Landscape of B and Plasma Cells in Early-Stage Lung Adenocarcinoma. Cancer Discov. 2022;12(11):2626–2645. doi:10.1158/2159-8290.CD-21-1658
43. Wang B, Wang M, Ao D, Wei X. CXCL13-CXCR5 axis: regulation in inflammatory diseases and cancer. Biochim Biophys Acta Rev Cancer. 2022;1877(5):188799. doi:10.1016/j.bbcan.2022.188799
44. Bajpai G, Bredemeyer A, Li W, et al. Tissue Resident CCR2- and CCR2+ Cardiac Macrophages Differentially Orchestrate Monocyte Recruitment and Fate Specification Following Myocardial Injury. Circ Res. 2019;124(2):263–278. doi:10.1161/CIRCRESAHA.118.314028
45. Cesaro A, Pastori D, Acerbo V, et al. Reduction of New Onset of Atrial Fibrillation in Patients Treated with Semaglutide: an updated systematic review and meta regression analysis of randomized controlled trials. Eur J Prev Cardiol. 2025;2025:zwaf257. doi:10.1093/eurjpc/zwaf257
46. Galli M, Benenati S, Laudani C, et al. Cardiovascular Effects and Tolerability of GLP-1 Receptor Agonists: a Systematic Review and Meta-Analysis of 99,599 Patients. J Am College Cardiol. 2025;86(20):1805–1819. doi:10.1016/j.jacc.2025.08.027
47. Palmiero G, Cesaro A, Vetrano E, et al. Impact of SGLT2 Inhibitors on Heart Failure: from Pathophysiology to Clinical Effects. Int J Mol Sci. 2021;22(11):5863. doi:10.3390/ijms22115863
48. Xu L, Nagata N, Nagashimada M, et al. SGLT2 Inhibition by Empagliflozin Promotes Fat Utilization and Browning and Attenuates Inflammation and Insulin Resistance by Polarizing M2 Macrophages in Diet-induced Obese Mice. EBioMedicine. 2017;20:137–149. doi:10.1016/j.ebiom.2017.05.028
49. Lee Y-S, Park M-S, Choung J-S, et al. Glucagon-like peptide-1 inhibits adipose tissue macrophage infiltration and inflammation in an obese mouse model of diabetes. Diabetologia. 2012;55(9):2456–2468. doi:10.1007/s00125-012-2592-3
 © 2026 The Author(s). This work is published and licensed by Dove Medical Press Limited. The
full terms of this license are available at https://www.dovepress.com/terms
and incorporate the Creative Commons Attribution
- Non Commercial (unported, 4.0) License.
By accessing the work you hereby accept the Terms. Non-commercial uses of the work are permitted
without any further permission from Dove Medical Press Limited, provided the work is properly
attributed. For permission for commercial use of this work, please see paragraphs 4.2 and 5 of our Terms.
© 2026 The Author(s). This work is published and licensed by Dove Medical Press Limited. The
full terms of this license are available at https://www.dovepress.com/terms
and incorporate the Creative Commons Attribution
- Non Commercial (unported, 4.0) License.
By accessing the work you hereby accept the Terms. Non-commercial uses of the work are permitted
without any further permission from Dove Medical Press Limited, provided the work is properly
attributed. For permission for commercial use of this work, please see paragraphs 4.2 and 5 of our Terms.
Recommended articles

The Role of Podoplanin in the Immune System and Inflammation
Zhang Z, Zhang N, Yu J, Xu W, Gao J, Lv X, Wen Z
Journal of Inflammation Research 2022, 15:3561-3572
Published Date: 17 June 2022
P2X7R-NEK7-NLRP3 Inflammasome Activation: A Novel Therapeutic Pathway of Qishen Granule in the Treatment of Acute Myocardial Ischemia
Li Y, Sun X, Liu X, Li J, Li X, Wang G, Liu Y, Lu X, Cui L, Shao M, Wang Y, Wang W, Li C
Journal of Inflammation Research 2022, 15:5309-5326
Published Date: 13 September 2022
miR-17-5p Promotes Glucose Uptake of HTR8/SVneo Trophoblast Cells by Inhibiting TXNIP/NLRP3 Inflammasome Pathway
Jiang Y, Wei L, Zhang H, Chen Y, Gao P, Zhang J, Zhou X, Zhu S, Du Y, Fang C, Li J, Feng L, He M, Wang S, Yu J
Diabetes, Metabolic Syndrome and Obesity 2022, 15:3361-3374
Published Date: 31 October 2022
CCL20/CCR6 Mediated Macrophage Activation and Polarization Can Promote Adenoid Epithelial Inflammation in Adenoid Hypertrophy
Ye C, Guo X, Wu J, Wang M, Ding H, Ren X
Journal of Inflammation Research 2022, 15:6843-6855
Published Date: 23 December 2022
Accelerated Wound Healing in Diabetic Rat by miRNA-185-5p and Its Anti-Inflammatory Activity
Wang KX, Zhao LL, Zheng LT, Meng LB, Jin L, Zhang LJ, Kong FL, Liang F
Diabetes, Metabolic Syndrome and Obesity 2023, 16:1657-1667
Published Date: 7 June 2023