Back to Journals » Diabetes, Metabolic Syndrome and Obesity » Volume 18
Relationship Between the TyGH Index (Based on Triglycerides and HbA1c) and Diabetic Kidney Disease in Patients with Type 2 Diabetes: A Real-World Study
Authors Ma J ![]() , Jin K
, Jin K ![]() , Wang Y, Wang X, Lou X, Liu X
, Wang Y, Wang X, Lou X, Liu X ![]() , Cao L
, Cao L
Received 7 June 2025
Accepted for publication 2 October 2025
Published 26 October 2025 Volume 2025:18 Pages 3955—3965
DOI https://doi.org/10.2147/DMSO.S542653
Checked for plagiarism Yes
Review by Single anonymous peer review
Peer reviewer comments 2
Editor who approved publication: Dr Rebecca Baqiyyah Conway
Jiayu Ma,* Kangtao Jin,* Yuankai Wang, Xiaohong Wang, Xiaojia Lou, Xiyu Liu, Lulu Cao
Department of Endocrinology, Affiliated Dongyang Hospital of Wenzhou Medical University, Dongyang, People’s Republic of China
*These authors contributed equally to this work
Correspondence: Jiayu Ma, Email [email protected]
Background: The triglyceride-glucose index (TyG index) is significantly associated with diabetic kidney disease (DKD) in patients with type 2 diabetes (T2D). Glycated hemoglobin A1c (HbA1c) is more stable and repeatable than fasting plasma glucose. Limited studies have combined HbA1c and triglyceride (TG) to investigate their relationship with DKD in patients with T2D. We aimed to investigate the association of the triglyceride-glycated hemoglobin (TyGH) index with DKD risk in Chinese adults with T2D compared with the TyG index.
Methods: This was a cross-sectional observational study that included 2721 patients with T2D. Demographic, anthropometric, and laboratory measurements were collected. An endocrinologist diagnosed DKD based on the data from the estimated glomerular filtration rate (eGFR) and urinary albumin to creatinine ratio (UACR). The TyGH index was determined as ln(TG [mg/dL] × HbA1c [%] * 18/2), and the TyG index was calculated as ln(TG [mg/dL] × FPG [mg/dL]/2).
Results: The prevalence values of DKD from the lowest to the highest tertile of the TyGH index were 29.7%, 35.2%, and 38.9%, respectively. The TyGH index was significantly higher in participants with macro- and microalbuminuria than in those with normoalbuminuria. In the multivariable logistic analyses, each unit of the TyGH index was associated with a 1.59-fold (1.33– 1.90, P < 0.001) higher prevalence rate of DKD; however, there was no significant association between TyG index and DKD prevalence. This association remained consistent in the subgroup analysis. Receiver operating characteristic analysis indicated that the TyGH index has superior diagnostic value for DKD compared to the TyG index, TG, or HbA1c alone.
Conclusion: Compared with the TyG index, the TyGH index demonstrates a stronger and more independent association with DKD in patients with T2D, suggesting its potential as a superior clinical biomarker.
Keywords: triglyceride-glycated hemoglobin A1c index, triglyceride-glucose index, diabetic kidney disease, type 2 diabetes
Background
The global prevalence of diabetes is currently a significant public health concern, and it is continuing to rise. Recently, in “Diabetes Atlas”, the International Diabetes Federation reported that up to 40% of people living with diabetes develop diabetic kidney disease (DKD).1 DKD affects millions of people worldwide and is the leading cause of end-stage renal disease.1,2 Consequently, it is crucial and imperative to research novel biomarkers of DKD to expedite the early diagnosis of the condition and the development of effective therapeutic strategies.
Despite the strict regulation of risk factors, including blood glucose and blood pressure (BP), DKD develops and progresses. This suggests that other factors are also involved in DKD prevalence. Insulin resistance (IR) is considered a significant contributor to microvascular complications, including DKD. The hyperinsulinemic euglycemic glucose clamp, which is the “gold standard” for evaluating IR, is rarely used in clinical practice because it is expensive, complex, laborious, and time-consuming. In clinical settings, the homeostasis model assessment for insulin resistance (HOMA-IR) index is the most frequently used to evaluate IR using fasting state measurements.3,4 However, plasma insulin and C-peptide assays are not easily available, especially in primary hospitals, and exhibit poor reproducibility across different laboratories. The triglyceride-glucose index (TyG index), calculated using only the fasting plasma glucose (FPG) and fasting triglyceride (TG) concentrations, has been proposed as a simple and reliable alternative index of IR.5,6 Multiple clinical studies have confirmed that the TyG index is closely associated with the development and poor prognosis of vascular diseases, including peripheral arteriosclerosis,7,8 coronary heart disease, and heart failure.9–11 Recently, a study in the Chinese population revealed that the TyG index is independently and more significantly associated with DKD in patients with type 2 diabetes (T2D) compared with HOMA-IR.12 However, FPG is easily susceptible to short-term diet and exercise, particularly in patients with diabetes. Compared with FPG, glycated hemoglobin A1c (HbA1c) has several advantages, including greater stability, reproducibility, and measurability in random versus fasting or postprandial blood samples.13,14 HbA1c measurement has long been a central component in managing and treating diabetes.15,16 Additionally, HbA1c and TG have been confirmed to be correlated with DKD.17–19 Accumulation of lipids in the kidney can stimulate the production of reactive oxygen species and lipid peroxidation, promoting tissue inflammation and mitochondrial damage, which results in glomerular and tubular lesions.20,21 Another study demonstrated that HbA1c and TG determination, which are correlated with body mass index (BMI), can be widely available tools for screening IR in obese patients.22 As a newly proposed biomarker combining TG and HbA1c, the TyGH index has not been previously investigated in metabolic or renal studies across any populations. This contrasts with the well-established TyG index, which has been globally validated in various metabolic diseases, including DKD.12 Given that HbA1c reflects long-term glycemic control more stable than fasting glucose, we innovatively developed the TyGH index and specifically investigated its association with DKD in this first-ever investigation. While our findings require external validation, this study establishes a foundation for future research to investigate the TyGH index’s potential associations with other metabolic disorders across diverse ethnicities.
Accordingly, our study proposed the triglyceride-glycated hemoglobin A1c index (TyGH index), which can be easily calculated using HbA1c and TG, for the first time. This study aimed to characterize the association between the TyGH index and the risk of DKD in patients with T2D and compare the data with those from the TyG index in Chinese adults.
Methods
Participants
This was a retrospective collection of a consecutive case series including 2,721 patients with T2D hospitalized at the Affiliated Dongyang Hospital of Wenzhou Medical University from January 2017 to December 2022. The inclusion criteria were as follows: (i) Age ≥ 18 years; (ii) diagnosis of T2D by an experienced endocrinologist according to the World Health Organization (WHO) standards; (iii) duration of diabetes ≥ 1 year. The exclusion criteria included (i) patients with severe respiratory disease, malignant disease, renal failure, infectious, anemia and other blood system diseases, and previous history of stroke and heart failure; (ii) pregnant woman; (iii) lack of HbA1c, TG, total cholesterol (TC), high-density lipoprotein cholesterol (HDL-C), low-density lipoprotein cholesterol (LDL-C), urinary albumin, urinary creatinine, and serum creatinine data.
The study was conducted in accordance with the Declaration of Helsinki and was approved by the Ethics Committee of Affiliated Dongyang Hospital of Wenzhou Medical University (Approval No.: 2025-YX-068).
Clinical Data Collection and Definitions
The clinical data of patients were collected by reviewing their electronic medical records. Data included demographic information (age and sex), lifestyle factors (smoking and drinking history), diabetes duration, family history of T2D, medication situation, anthropometric measurements (body weight, height, and blood pressure), and the levels of indicators (FPG, fasting insulin, fasting c-peptide, HbA1c, TG, HDL-C, LDL-C, urinary albumin/creatinine ratio (UACR), and serum creatinine).
Diabetes was defined by FPG ≥ 7.0 mmol/L and/or postprandial blood glucose ≥11.1 mmol/L following the 1999 WHO criteria.23 Experienced endocrinologists classified T2D based on the characteristics of medical history.
According to “Standards of Care in Diabetes-2024”,24 DKD is clinically defined by the presence of impaired renal function (estimated glomerular filtration rate (eGFR) < 60 mL/min/1.73 m2 or elevated urinary albumin excretion (urinary ACR) ≥30 mg/g, persistent for >3 months and validated by repeat testing). In our study, DKD was diagnosed by an experienced endocrinologist by the above criteria after excluding other causes of renal damage. Normo-, micro, and macroalbuminuria were defined as UACR < 30, 30–300, and > 300 mg/g, respectively.24 The eGFR was calculated using the CKD-EPI formula. The TyG index was calculated as ln(TG [mg/dL] × FPG [mg/dL]/2).25 There is a certain correspondence between the HbA1c and the average blood glucose.26,27 We determined the TyGH index as ln(TG [mg/dL] × HbA1c [%] * 18/2).
Laboratory Assays
Fasting venous blood samples were collected from the participants in the early morning after refraining from eating and drinking for at least 8 h. HbA1c was measured by high-performance liquid chromatography using the D-100 Hemoglobin Testing System (Bio-Rad Laboratories, USA). FPG, TG, TC, HDL-C, LDL-C, urinary albumin, and creatinine were measured using glucose oxidase, glycerophosphate oxidase–peroxidase, cholesterol oxidase, polyanion polymer/detergent, solubilization, Pyrogallol red molybdenum colorimetric, and sarcosine oxidase methods, respectively, using the auto-analyzer (008AS, Hitachi LAbOSPECT, China). Additionally, UACR (mg/g) was calculated by dividing urinary albumin concentration by urinary creatinine concentration. Serum insulin and c-peptide were measured by electrochemiluminescence immunoassay using the immunoassay analyzers (cobas8000, Roche Diagnostics Corp, Indianapolis, IN, USA).
Statistical Analysis
The characteristics of the subjects were described and compared according to the tertiles of TyGH index values. Continuous variables are expressed as mean ± standard deviation (normal distribution) or medians with interquartile ranges (skewed distribution). The categorical variables are expressed as frequencies or percentages. Intergroup comparisons were performed using analysis of variance (ANOVA) (a normal distribution with an equal variance between the groups) or the Wilcoxon rank sum test (skewed distribution or normal distribution with an uneven variance between the groups) for continuous variables and the chi-square test for categorical variables. The chi-square test was used to compare frequencies. The participants were divided into three groups based on UACR (normo-, micro-, and macroalbuminuria), and the TyGH index was compared among the three groups using ANOVA. Multivariate logistic regression analyses were performed to estimate the odds ratios (ORs) with 95% confidence intervals (CIs) for DKD, adjusting for other clinical and biochemical variables. Covariates were selected a priori based on established DKD risk factors.10,28–31 We employed hierarchical adjustment to address confounding: Model 1: Adjusted for age, sex (minimal adjustment for demographic factors), Model 2: Added BMI, diabetes duration, systolic blood pressure (SBP), LDL-C, and HDL-C (clinical risk factors), and Model 3: Further included smoking and drinking history, and relevant medication (including Angiotensin-Converting Enzyme Inhibitor or Angiotensin II Receptor Blocker, lipid lowering agents, insulin, and dapagliflozin) using status (pathophysiology-based factors). Stratified analysis was performed to further explore the correlation between TyGH index and DKD. We performed receiver operating characteristic (ROC) curve analysis to evaluate the diagnostic performance of TyGH/TyG indices for detecting DKD. The optimal cutoff values were determined by maximizing Youden’s index (J = sensitivity + specificity – 1). We calculated the area under the ROC curve (AUC) with 95% CI to determine overall discriminative ability, along with corresponding sensitivity and specificity for each identified cutoff point. A post hoc power analysis was performed using G*Power 3.1 software (α = 0.05) based on the observed effect sizes to assess the adequacy of the collected sample size for the primary and subgroup analyses. All other statistical analyses were performed using the Statistical Package for Social Sciences software (SPSS; version 26.0 for Windows), and P values < 0.05 (two-sided) were considered statistically significant.
Results
Characteristics of Participants by TyGH Index Tertiles
The demographic and clinical characteristics of the 2,721 participants grouped by TyGH index tertiles are presented in Table 1. The mean age of the study participants was 58.7 years; 1688 were men (62%), and 34.6% (941/2721) of patients with T2D were diagnosed with DKD. The P-value for the trend was calculated with each tertile of the TyGH index taken as a unit. Compared to the patients in the lowest tertile of the TyGH index, patients in the higher tertile were younger and had a larger proportion of men, smokers, and insulin users. They used dapagliflozin less frequently, had shorter duration of diabetes, higher BMI, higher levels of fasting glucose, HbA1c, fasting insulin, fasting c-peptide, HOMA-IR, TG, LDL-C, UACR, and eGFR. Additionally, they had lower levels of HDL-C (all P for trend < 0.05). The UACR values for the three groups were 12.99 (6.63, 34.39), 15.03 (7.14, 51.35), and 17.50 (8.31, 62.85) mg/g, respectively. The prevalence values of DKD from the lowest to the highest tertile of the TyGH index were 29.7%, 35.2%, and 38.9%, respectively.
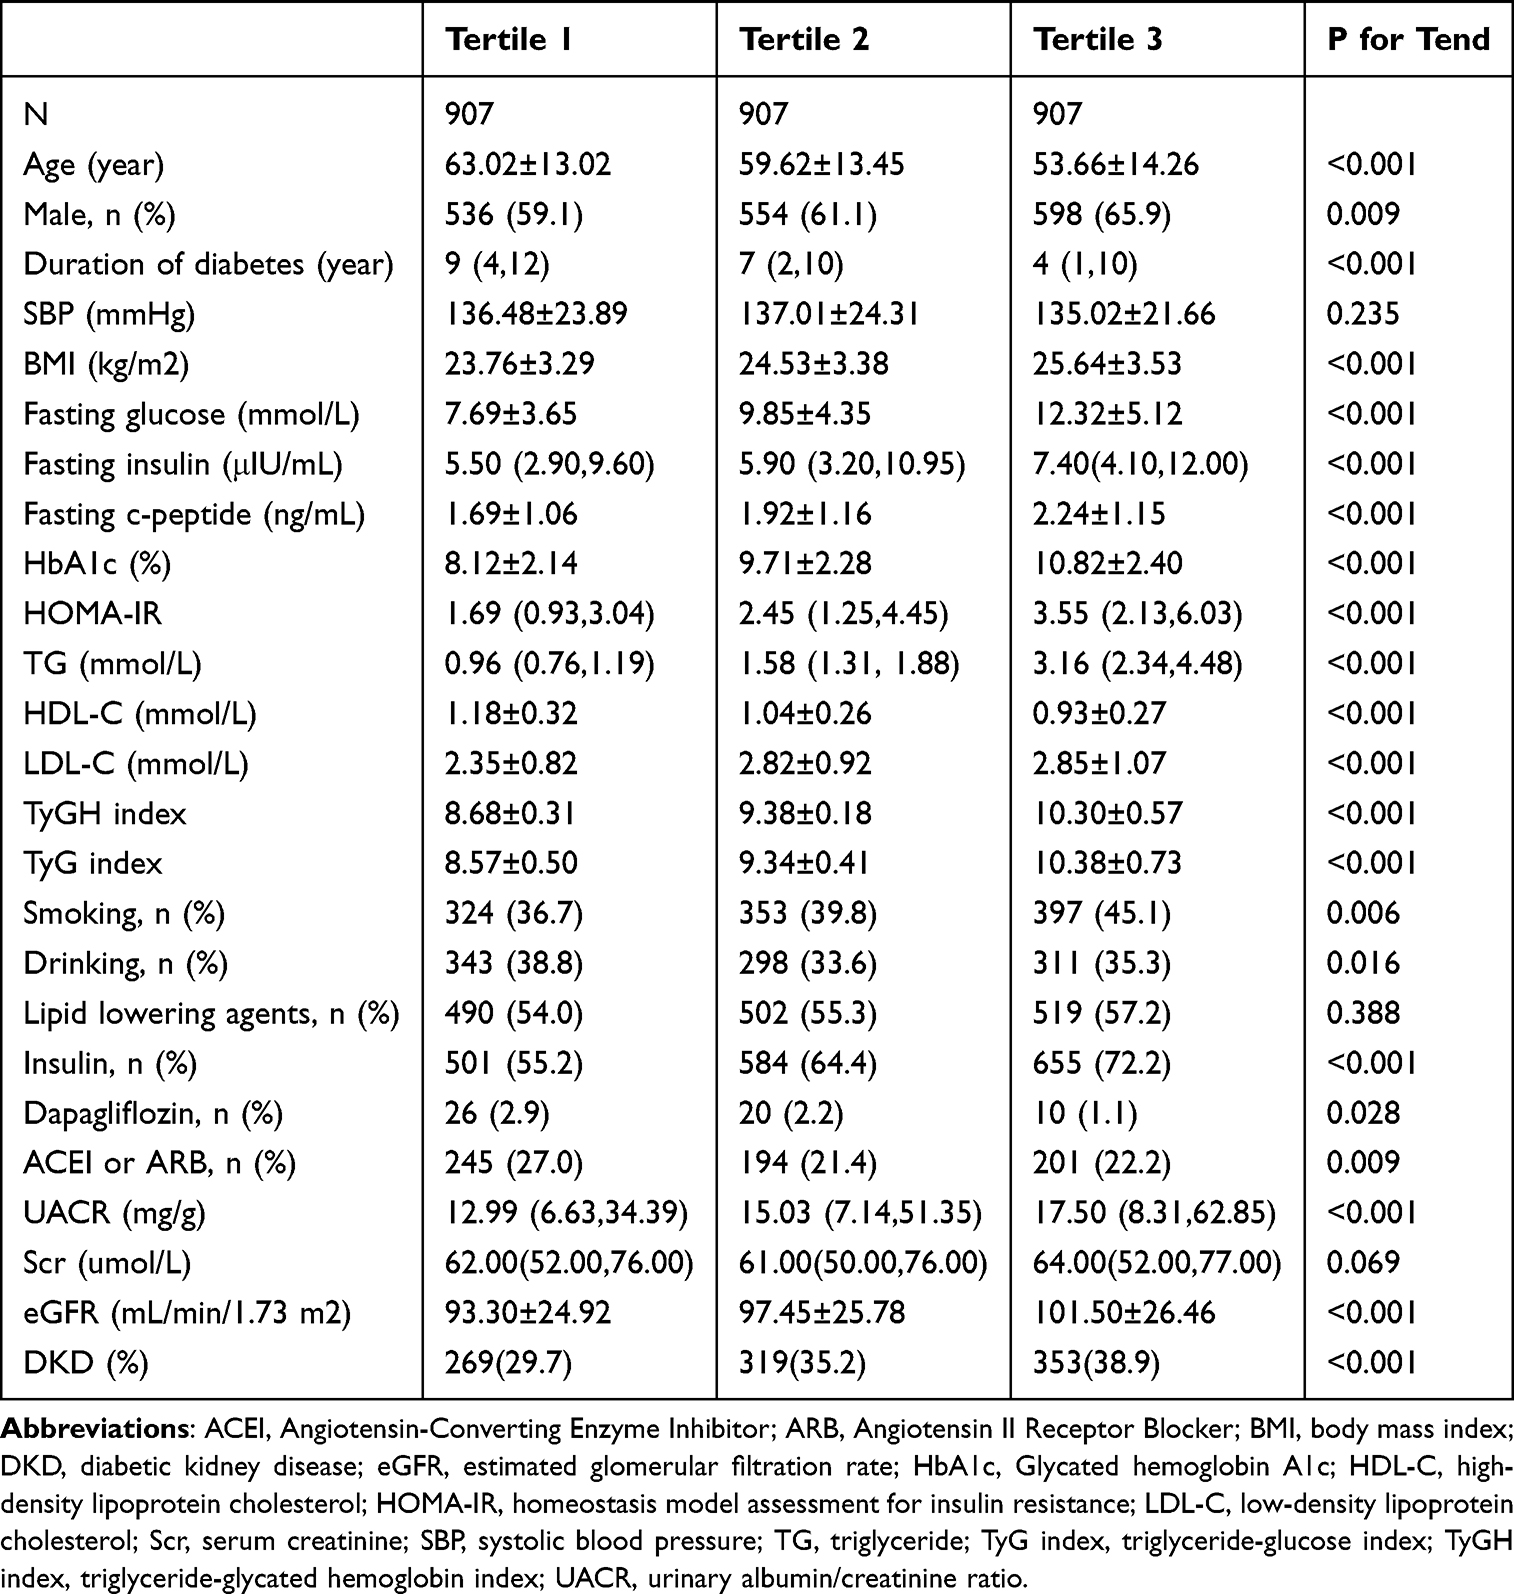 |
Table 1 Clinical Characteristics of the Study Population According to the Tertiles of the TyGH Index |
Associations of TyGH and TyG Indices with DKD Prevalence
We compared the levels of the TyGH index between subgroups separated by level of UACR (Figure 1). The TyGH index was significantly higher in participants with macro- and microalbuminuria than in those with normoalbuminuria, even after adjusting for the confounding factors, including age, sex, BMI, duration of diabetes, SBP, smoking and drinking history, HDL-C, LDL-C, and relevant medication use status (P < 0.05).
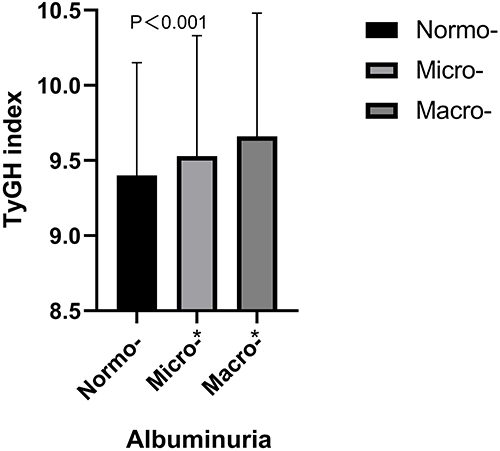 |
Figure 1 Levels of the TyGH index in T2D patients stratified by normoalbuminuria, microalbuminuria and macroalbuminuria. The difference remained significant even after adjusting for age, sex, BMI, duration of diabetes, SBP, smoking history, drinking history, HDL-C, LDL-C and relevant medication using status (P < 0.001). *P < 0.05 compared with normoalbuminuria. Abbreviations: BMI, body mass index; SBP, systolic blood pressure; HDL-C, high-density lipoprotein cholesterol; LDL-C, low-density lipoprotein cholesterol; T2D, type 2 diabetes; TyGH index, triglyceride-glycated hemoglobin index. |
Furthermore, after adjustment for age, sex, BMI, duration of diabetes, SBP, smoking history, drinking history, HDL-C, LDL-C, and relevant medication using status in model 3, each unit of the TyGH index was associated with a 1.59-fold (1.33–1.90, P < 0.001) higher prevalence rate of DKD (Table 2). Compared to the first tertile of TyGH index, the middle tertile of TyGH index had a higher prevalence of DKD (OR: 1.49; 95% CI: 1.09–2.03; P = 0.013), which was more significant in the highest tertile (OR: 1.87; 95% CI: 1.31–2.65; P = 0.001), P for trend < 0.001. Regarding the TyG index, in models 1 and 2, the highest tertile of TyG index had a higher prevalence of DKD compared with the first tertile of TyG index, and there was no significant difference in the prevalence of DKD between the first and middle tertiles of TyG index. After full adjustment in model 3, each unit of the TyG index was associated with a 1.33-fold (1.15,1.53, P < 0.001) higher prevalence rate of DKD; however, there was no significant difference in prevalence of DKD between groups separated by the TyG index. Compared to the groupings based on the TyG index, the groupings based on the TyGH index exhibit a more significant gradient in the incidence of DKD.
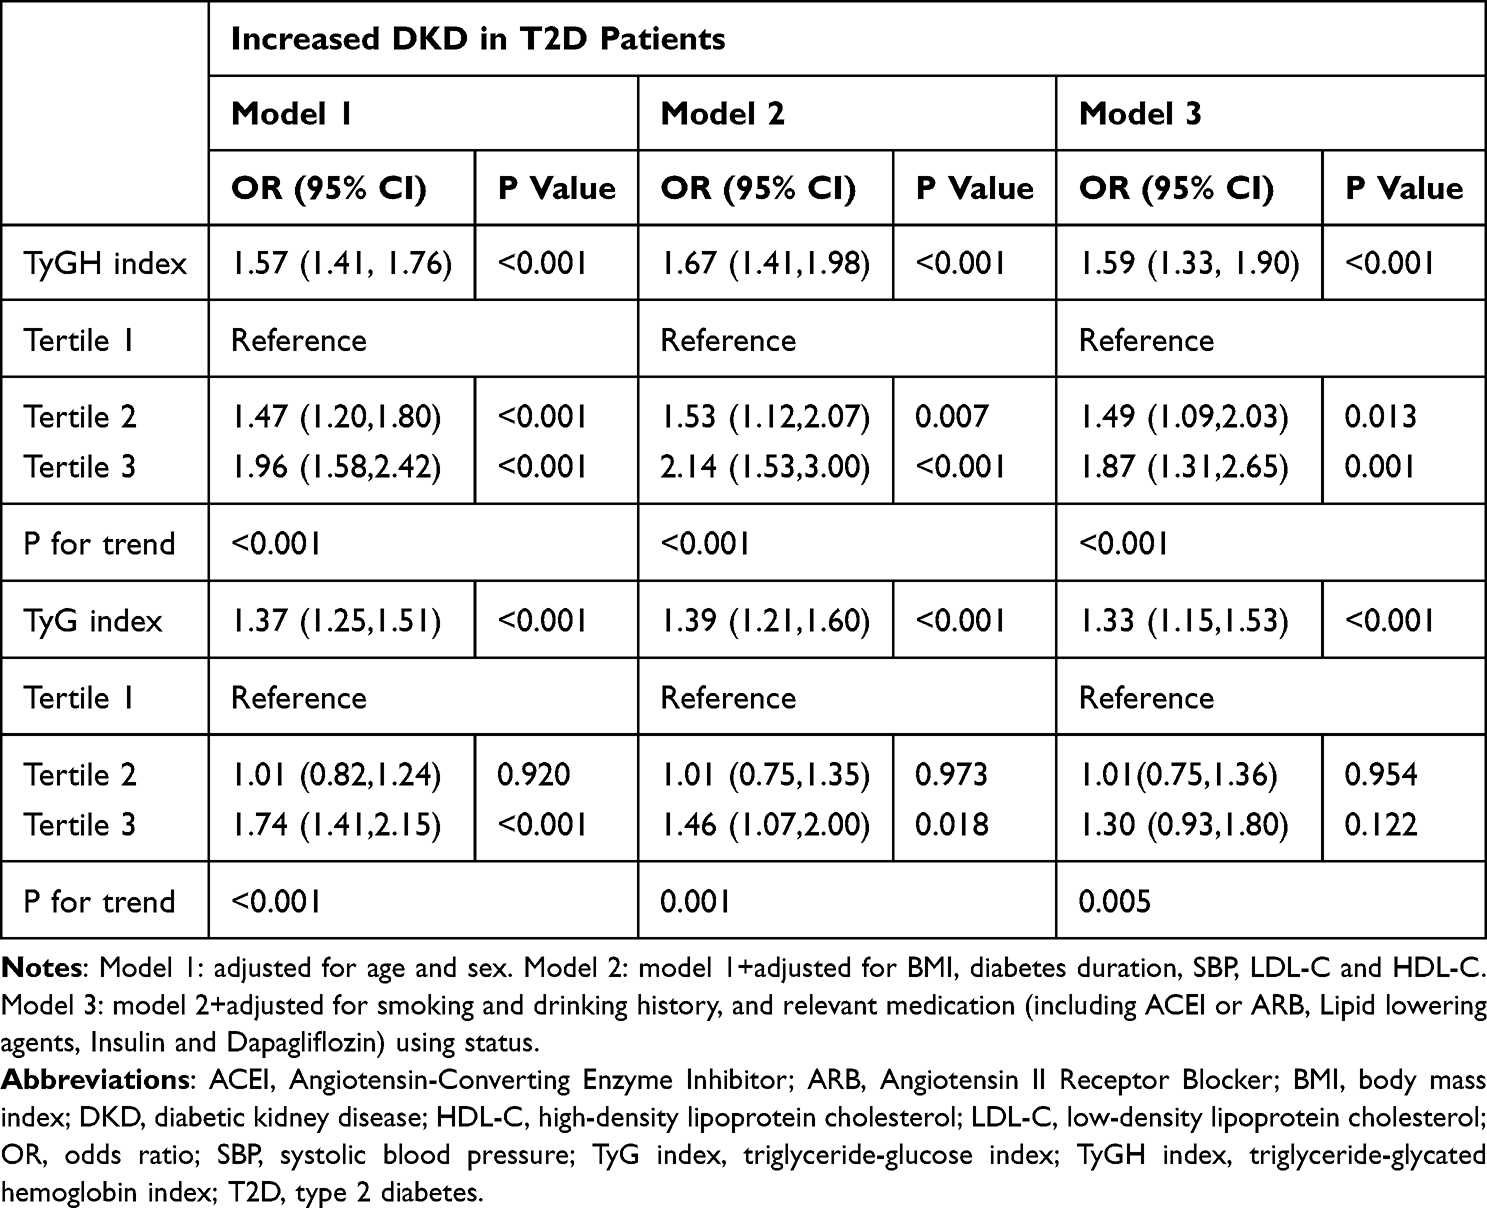 |
Table 2 Odds Ratios and 95% Confidence Intervals for the TyGH Index and TyG Index Associated with Increased Prevalence of DKD in T2D Patients |
Stratified Analysis for the Association of TyGH Index and DKD Prevalence
To further explore the relationship between TyGH index and DKD prevalence, we performed a stratified analysis according to the potential influencing factors, including sex, age, duration of diabetes, BMI, and SBP (Figure 2). After full adjustment for confounding factors including age, sex, BMI, duration of diabetes, SBP, smoking and drinking history, HDL-C, LDL-C, and relevant medication using status, if not stratified—the TyGH index remained significantly associated with the prevalence rate of DKD. This association was observed in a subgroup of males (OR: 1.85; 95% CI: 1.47–2.31; P < 0.001), those aged <65 years (OR: 1.62; 95% CI: 1.31–2.00; P < 0.001), or ≥65 years (OR: 1.53; 95% CI: 1.08–2.16; P = 0.017), those with duration of diabetes <5 years (OR: 1.86; 95% CI: 1.38–2.50; P < 0.001) or ≥5 years (OR: 1.39; 95% CI: 1.10–1.77; P = 0.006), those with BMI < 28 kg/m2 (OR: 1.63; 95% CI: 1.33–2.00; P < 0.001), and those with SBP < 140 mmHg (OR: 1.53; 95% CI: 1.21–1.92; P < 0.001) or ≥140 mmHg (OR: 1.66; 95% CI: 1.23–2.23; P = 0.001). After adequacy adjustment, no significant associations were observed between TyGH index and DKD prevalence in a subgroup of females (OR: 1.20; 95% CI: 0.87–1.65; P = 0.279), those with BMI ≥ 28 kg/m2 (OR: 1.50; 95% CI: 0.97–2.31; P = 0.065).
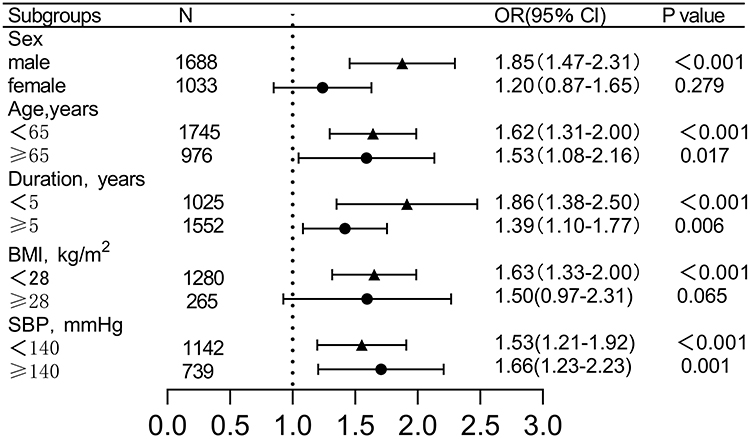 |
Figure 2 Subgroup analyses of the association between the TyGH index and the prevalence of DKD in T2D participants. Adjusted for the confounding factors including age, sex, BMI, duration of diabetes, SBP, smoking history, drinking history, HDL-C, LDL-C, relevant medication using status, if not be stratified. Abbreviations: BMI, body mass index; CI, confidence interval; DKD, diabetic kidney disease; HDL-C, high-density lipoprotein cholesterol; LDL-C, low-density lipoprotein cholesterol; OR, odds ratio; SBP, systolic blood pressure; T2D, type 2 diabetes; TyGH index, triglyceride-glycated hemoglobin index. |
ROC Analysis for Identification of Patients at Risk of DKD
We further analyzed the diagnostic value of the TyGH index for DKD through ROC curve analysis and compared it with that of TyG index, HbA1c, and TG. The AUC value of the TyGH index was 0.555 (0.532–0.577, P < 0.001), higher than that of TyG index (AUC: 0.539, 95% CI: 0.516–0.562, P < 0.001), HbA1c (AUC: 0.544, 95% CI: 0.522–0.567, P < 0.001), and TG (AUC: 0.543, 95% CI: 0.521–0.566, P < 0.001) (Figure 3). When the Youden Index reached the maximum, the optimal cutoff point of the TyGH index was defined as ≥9.236. The corresponding sensitivity and specificity were 64.1% and 45.1%, respectively.
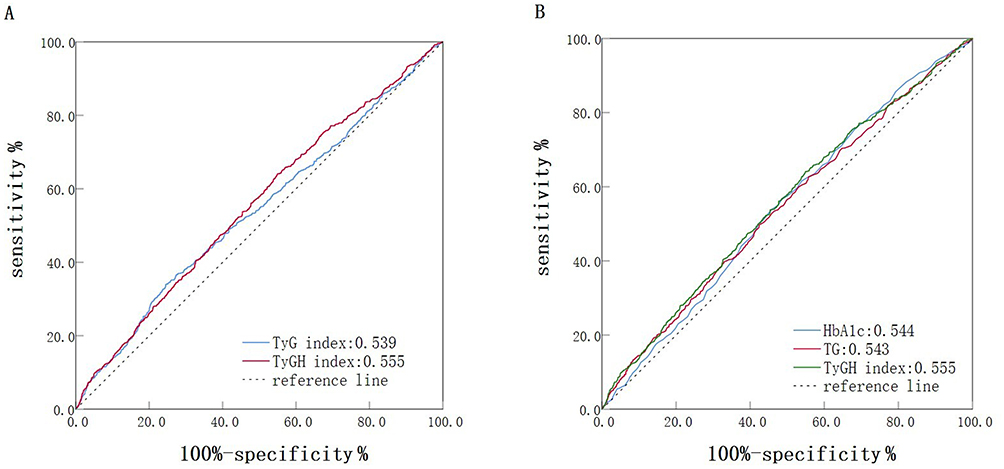 |
Figure 3 (A) ROC curve of TyG index and TyGH index in predicting DKD; (B) ROC curve of TG, HbA1c and TyGH index in predicting DKD. Abbreviations: DKD, diabetic kidney disease; HbA1c, Glycated hemoglobin A1c; ROC, receiver operating characteristic; TG, triglyceride; TyG index, triglyceride-glucose index; TyGH index, triglyceride-glycated hemoglobin index. |
Discussion
The TyGH index based on HbA1c and TG was proposed for the first time in our study. Additionally, after adjusting for confounding factors, this cross-sectional study revealed a significant positive association and a dose-response relation between TyGH index and DKD in patients with T2D. The association remained consistent even when subjects were stratified by age, T2D duration, and SBP. Our study demonstrates that the novel TyGH index exhibited significantly better discriminative performance for DKD than the individual conventional markers, including isolated TG and HbA1c alone. Furthermore, the TyGH index exhibits a significantly stronger association with incident DKD risk among T2D patients than the TyG index, which is widely recognized as a reliable marker for IR.
Globally, DKD prevalence in patients with T2D is rapidly increasing.1 Accordingly, accessible and inexpensive indices for early identification and intervention of DKD are required to combat this challenge. The TyG index, based on fasting glucose and TG, has been confirmed to be an important target for treating and preventing DKD.12,32,33 Several studies have reported that IR is associated with DKD development; however, the underlying mechanism remains unclear. Tiwari S et al34 demonstrated that IR and impaired insulin signaling would increase glomerular filtration pressure, possibly through nitrogen oxide production. Previous studies confirmed that the TyG index closely mirrors the glucose clamp technique5 and HOMA-IR35 in identifying IR. Consequently, it is easy to explain the association between TyG index and DKD. TyG index and DKD have a well-established relationship; however, the FPG of patients with diabetes experiences significant fluctuations as a result of the influence of recent drugs and diet. Since its introduction, HbA1c, has been considered a relatively stable indicator, that reflects average blood glucose levels over the past three months. Guilaine Boursier et al22 reported that HbA1c is a reliable indicator for screening IR in obese patients. They demonstrated that hypertriglyceridemia is significantly associated with IR. Furthermore, multiple studies indicated that the TG elevation is significantly associated with increased IR.36–38 In agreement with previous studies, our study found that participants with a higher TyGH index (calculated from HbA1c and TG) exhibited higher levels of HOMA-IR. This suggests that insulin resistance may play a potential role in the relationship between the TyGH index and DKD in patients with T2D, although further studies are needed to clarify the underlying mechanisms.
Furthermore, consistent with previous studies,32,33,39 our study demonstrated a dose-response association between the TyG index and the risk of DKD in patients with T2D. When we divided the subjects into T1, T2, and T3 groups based on TyG index tertiles, DKD prevalence did not differ significantly in T2 or T3 groups compared with the T1 group. This can be because the included population differs from the previous study, as the subjects we included were hospitalized patients, and different grouping methods can result in different conclusions. Our study used tertiles for grouping, whereas some studies used medians33 and quartiles.39 While this study provides preliminary cutoff values for the TyGH index (9.236), their clinical utility for DKD risk stratification requires further validation in prospective studies with diverse populations. In the ROC curve analysis, the TyGH index exhibited significantly greater discriminatory power than the TyG index. Despite being statistically significant, the TyGH index’s AUC value was modest (0.555). This shows that its ability to predict DKD on its own is limited. To avoid overestimating its usefulness, it is important to remember that it indicates risk rather than being a stand-alone diagnostic tool. This reflects the complex nature of DKD. Therefore, the TyGH index should be used with caution and is best combined with other factors in a broader risk model. Future research should combine TyGH with other markers to build better predictive models. Additionally, the ROC analysis demonstrated that the TyGH index has superior discriminative power for DKD compared to TG or HbA1c alone, highlighting the clinical value of this integrated indicator. The combination of TG and HbA1c may better reflect the complex interplay between dysregulated lipid metabolism and chronic glucose toxicity in the pathogenesis of DKD, whereas isolated markers can only partially represent these pathological pathways. This concept is well exemplified by the TyG index,7–12 which integrates FPG and TG and has been established as a better metabolic marker than its individual components for assessing metabolic disorders. Our development of the TyGH index extends this approach by demonstrating that HbA1c, reflecting long-term glycemic control, can be effectively combined with triglycerides, showing promise as a clinically useful indicator for DKD risk assessment. The patients with higher TyGH index exhibited higher levels of eGFR, and there was no significant association between TyGH index and serum creatinine levels. This could be because eGFR was calculated using serum creatinine and age, and the higher TyGH index tertile was associated with a younger age compared to the lower TyGH index tertile.
According to subgroup analysis, the TyGH index exhibited a significant association with increased risk of DKD in men; however, we did not find the same result in women. However, Yanjuan Jiang et al40 found that the effect of the TyG index on DKD prevalence was higher in women than in men. One possible explanation for the conflicting results is the difference in participant selection and sample size. Subsequently, we conducted a power analysis and found that the sample size of the female subgroup was insufficient, with a power of 0.8. The insufficient sample size could have resulted in unreliable results for this subgroup. Besides, a review41 in 2022 reported that sex and gender differences influence the risk of DKD in patients with diabetes. This can be attributed to biological differences at the cellular and tissue levels, as well as societal differences in how individuals self-manage and interact with healthcare systems. The gender difference in the appearance and development of DKD in patients with diabetes can contribute to the different conclusions between subgroups stratified by gender in our study. Moreover, we found that TyGH index exhibited a stronger association with increased risk of DKD in patients with higher SBP and shorter duration than in patients with relatively normal SBP and long duration. This indicates the importance of lowering TyGH index, particularly in patients in the early stages of diabetes and with a high risk of DKD. However, the association is primarily significant only in nonobese individuals and not in obese individuals. Another study42 confirmed that the association between TyG index and subclinical atherosclerosis could only be observed in nonobese individuals but not in obese individuals. We hypothesized that the following reasons can explain the conclusion above. First, the TyGH index, as a predictor of metabolic dysregulation, can better reflect the risk of metabolic diseases in nonobese individuals. This is because obese individuals, with typically multiple metabolic risk factors,43 have a greater burden than nonobese participants. Consequently, the predictive role of the TyGH index in increasing the risk of DKD in T2D can be compromised. Moreover, the sample size of obese subjects in this study is significantly smaller than that of nonobese subjects. The limited sample size in the obesity subgroup was insufficient to achieve adequate statistical power, potentially compromising the reliability of these results. In future studies, we can increase the sample size of the obese population to explore the association between the TyGH index and DKD in T2D.
The paramount strength of this study lies in the development and validation of the novel TyGH index, which demonstrates superior clinical utility over the established TyG index. By integrating the stability of HbA1c, our modified index not only proves to be a more robust and convenient biomarker but also reveals a stronger, independent association with DKD risk in a large, real-world cohort of type 2 diabetic patients. However, this study has several limitations. First, the analytical cross-sectional design limits the ability to detect causality. Second, we did not adjust for dietary patterns, physical activity, medication adherence, or markers of inflammation, as these factors can also influence the incidence of DKD. Furthermore, the subgroup analyses for females and obese individuals were limited by insufficient sample sizes, constraining our ability to draw robust conclusions in these populations. Finally, our single-center study involving hospitalized Chinese patients can introduce bias and limit the generalizability of our findings to other ethnic populations. Consequently, dynamic monitoring of HbA1c and lipid levels is required in further prospective follow-up cohorts with adequate adjustment for multiple factors to verify the causal association between TyGH index and DKD occurrence in patients with T2D. Further multi-center studies with larger sample sizes and different ethnic groups are required to confirm the generalizability of the results.
Conclusion
In this study, we proposed the TyGH index for the first time. We demonstrated that the TyGH index is more independent and significantly associated with DKD in patients with T2D than the TyG index. The observed association between elevated TyGH index and DKD prevalence in our study suggests that careful monitoring and potential management of this index in patients with T2D could assist in identifying high-risk individuals for early intervention. To further establish its clinical utility and generalizability, the conclusions from this initial investigation warrant subsequent validation in large-scale, multicenter prospective studies.
Consent to Participate
Informed consent was obtained from each participant after detailed explanation of the purpose.
Acknowledgments
The authors appreciate the help and efforts of all research staff for participating in this trial.
Funding
This study was funded by Science and Technology Plan Projects of Jinhua City (No. 2024-4-245).
Disclosure
The authors report no conflicts of interest in this work.
References
1. International Diabetes Federation. Diabetes and Kidney Disease [Internet]. Brussels, Belgium: International Diabetes Federation; 2023 [cited 2025 Oct 22]. Available from: https://www.diabetesatlas.org/atlas/diabetes-and-kidney-disease/.
2. Collins AJ, Foley RN, Herzog C, et al. US Renal Data System 2010 Annual Data Report. Am J Kidney Dis. 2011;57(Suppl 1):A8. doi:10.1053/j.ajkd.2010.10.007
3. Matthews DR, Hosker JP, Rudenski AS, Naylor BA, Treacher DF, Turner RC. Homeostasis model assessment: insulin resistance and beta-cell function from fasting plasma glucose and insulin concentrations in man. Diabetologia. 1985;28(7):412–419. doi:10.1007/BF00280883
4. Boyko EJ. Utility of homeostasis model assessment of beta-cell function in predicting diabetes in 12,924 healthy Koreans: response to Sung, Reaven, and Kim. Diabetes Care. 2010;33(5):e71. doi:10.2337/dc10-0196
5. Guerrero-Romero F, Simental-Mendía LE, González-Ortiz M, et al. The Product of Triglycerides and Glucose, a Simple Measure of Insulin Sensitivity. Comparison with the Euglycemic-Hyperinsulinemic Clamp. J Clin Endocrinol Metab. 2010;95(7):3347–3351. doi:10.1210/jc.2010-0288
6. Abbasi F, Reaven GM. Comparison of two methods using plasma triglyceride concentration as a surrogate estimate of insulin action in nondiabetic subjects: triglycerides x glucose versus triglyceride/high-density lipoprotein cholesterol. Metabolism. 2011;60(12):1673–1676. doi:10.1016/j.metabol.2011.04.006
7. Lee SB, Ahn CW, Lee BK, et al. Association between triglyceride glucose index and arterial stiffness in Korean adults. Cardiovasc Diabetol. 2018;17(1). doi:10.1186/s12933-018-0692-1
8. Su Y, Wang S, Sun J, et al. Triglyceride Glucose Index Associated With Arterial Stiffness in Chinese Community-Dwelling Elderly. Front Cardiovasc Med. 2021;8. doi:10.3389/fcvm.2021.737899
9. Wang T, Xu J, Zhang H, Tao L, Huang X. Triglyceride-glucose index for the detection of subclinical heart failure with preserved ejection fraction in patients with type 2 diabetes. Front Cardiovasc Med. 2023;10:1. doi:10.3389/fcvm.2023.1086978
10. Zheng H, Chen G, Wu K, et al. Relationship between cumulative exposure to triglyceride-glucose index and heart failure: a prospective cohort study. Cardiovasc Diabetol. 2023;22(1):2. doi:10.1186/s12933-023-01967-5
11. Zhou Y, Wang C, Che H, et al. Association between the triglyceride–glucose index and the risk of mortality among patients with chronic heart failure: results from a retrospective cohort study in China. Cardiovasc Diabetol. 2023;22(1):3. doi:10.1186/s12933-023-01895-4
12. Liu L, Xia R, Song X, et al. Association between the triglyceride–glucose index and diabetic nephropathy in patients with type 2 diabetes: a cross‐sectional study. J Diabetes Investig. 2020;12(4):557–565. doi:10.1111/jdi.13371
13. International Expert C. International Expert Committee report on the role of the A1C assay in the diagnosis of diabetes. Diabetes Care. 2009;32(7):1327–1334. doi:10.2337/dc09-9033.
14. Monnier L, Lapinski H, Colette C. Contributions of fasting and postprandial plasma glucose increments to the overall diurnal hyperglycemia of type 2 diabetic patients: variations with increasing levels of HbA(1c). Diabetes Care. 2003;26(3):881–885. doi:10.2337/diacare.26.3.881
15. American Diabetes A. Standards of medical care in diabetes--2010. Diabetes Care. 2010;33(Suppl 1):S11–61. doi:10.2337/dc10-S011
16. UK Prospective Diabetes Study (UKPDS) Group. Intensive blood-glucose control with sulphonylureas or insulin compared with conventional treatment and risk of complications in patients with type 2 diabetes (UKPDS 33). Lancet. 1998;352(9131):837–853. doi:10.1016/S0140-6736(98)07019-6
17. Nakanishi S, Hirukawa H, Shimoda M, et al. Comparison of HbA1c levels and body mass index for prevention of diabetic kidney disease: a retrospective longitudinal study using outpatient clinical data in Japanese patients with type 2 diabetes mellitus. Diabet Res Clin Pract. 2019;155. doi:10.1016/j.diabres.2019.107807
18. Gong L, Wang C, Ning G, et al. High concentrations of triglycerides are associated with diabetic kidney disease in new‐onset type 2 diabetes in China: findings from the China Cardiometabolic Disease and Cancer Cohort (4C) Study. Diabetes Obes Metab. 2021;23(11):2551–2560. doi:10.1111/dom.14502
19. Wang C, Wang L, Liang K, et al. Poor Control of Plasma Triglycerides Is Associated with Early Decline of Estimated Glomerular Filtration Rates in New-Onset Type 2 Diabetes in China: results from a 3-Year Follow-Up Study. J Diabetes Res. 2020;2020:1–8. doi:10.1155/2020/3613041
20. Abrass CK. Cellular lipid metabolism and the role of lipids in progressive renal disease. Am J Nephrol. 2004;24(1):46–53. doi:10.1159/000075925
21. Abrass CK. Lipid metabolism and renal disease. Contrib Nephrol. 2006;151:106–121. doi:10.1159/000095323
22. Boursier G, Sultan A, Molinari N, et al. Triglycerides and glycated hemoglobin for screening insulin resistance in obese patients. Clin Biochem. 2018;53:8–12. doi:10.1016/j.clinbiochem.2017.12.002
23. Gabir MM, Hanson RL, Dabelea D, et al. The 1997 American Diabetes Association and 1999 World Health Organization criteria for hyperglycemia in the diagnosis and prediction of diabetes. Diabetes Care. 2000;23(8):1108–1112. doi:10.2337/diacare.23.8.1108
24. Practice C, Aleppo G, Bannuru RR, American Diabetes Association Professional. Chronic Kidney Disease and Risk Management: standards of Care in Diabetes—2024. Diabetes Care. 2024;47(Suppl 1):S219–S230. doi:10.2337/dc24-S011
25. Ramdas Nayak VK, Satheesh P, Shenoy MT, Kalra S. Triglyceride Glucose (TyG) Index: a surrogate biomarker of insulin resistance. J Pak Med Assoc. 2022;72(5):986–988. doi:10.47391/JPMA.22-63
26. Ramachandran A, Riddle MC, Kabali C, Gerstein HC. Investigators O. Relationship between A1C and fasting plasma glucose in dysglycemia or type 2 diabetes: an analysis of baseline data from the ORIGIN trial. Diabetes Care. 2012;35(4):749–753. doi:10.2337/dc11-1918
27. Moller JB, Overgaard RV, Kjellsson MC, et al. Longitudinal Modeling of the Relationship Between Mean Plasma Glucose and HbA1c Following Antidiabetic Treatments. CPT Pharmacometrics Syst Pharmacol. 2013;2(10):e82. doi:10.1038/psp.2013.58
28. Zhu H, Li L, Liu S, Li J. Smoking and diabetic nephropathy: an updated systematic review and meta-analysis. J Diabetes Investig. 2025;16(3):442–450. doi:10.1111/jdi.14385
29. Nakamura T, Kawagoe Y, Koide H. Effect of cigarette smoking on urinary podocyte excretion in early diabetic nephropathy. Diabetes Care. 2003;26(4):1324–1325. doi:10.2337/diacare.26.4.1324
30. Hu Y, Du X. Blood Lipid Indicators and Different Clinical Classifications of Dyslipidemia and Diabetic Kidney Disease: correlation and Predictive Value. Sichuan Da Xue Xue Bao Yi Xue Ban. 2023;54(5):1013–1018. doi:10.12182/20230960103
31. Roy S, Schweiker-Kahn O, Jafry B, et al. Risk Factors and Comorbidities Associated with Diabetic Kidney Disease. J Prim Care Community Health. 2021;12:21501327211048556. doi:10.1177/21501327211048556
32. Li HF, Miao X, Li Y. The Triglyceride Glucose (TyG) Index as a Sensible Marker for Identifying Insulin Resistance and Predicting Diabetic Kidney Disease. Med Sci Monit. 2023;29:e939482. doi:10.12659/MSM.939482
33. Lv L, Zhou Y, Chen X, et al. Relationship Between the TyG Index and Diabetic Kidney Disease in Patients with Type-2 Diabetes Mellitus. Diabetes Metab Syndr Obes. 2021;14:3299–3306. doi:10.2147/DMSO.S318255
34. Tiwari S, Sharma N, Gill PS, et al. Impaired sodium excretion and increased blood pressure in mice with targeted deletion of renal epithelial insulin receptor. Proc Natl Acad Sci U S A. 2008;105(17):6469–6474. doi:10.1073/pnas.0711283105
35. Simental-Mendia LE, Rodriguez-Moran M, Guerrero-Romero F. The product of fasting glucose and triglycerides as surrogate for identifying insulin resistance in apparently healthy subjects. Metab Syndr Relat Disord. 2008;6(4):299–304. doi:10.1089/met.2008.0034
36. Pan DA, Lillioja S, Kriketos AD, et al. Skeletal muscle triglyceride levels are inversely related to insulin action. Diabetes. 1997;46(6):983–988. doi:10.2337/diab.46.6.983
37. Song K, Park G, Lee HS, et al. Prediction of Insulin Resistance by Modified Triglyceride Glucose Indices in Youth. Life. 2021;11(4):286. doi:10.3390/life11040286
38. Banks WA, Farr SA, Salameh TS, et al. Triglycerides cross the blood-brain barrier and induce central leptin and insulin receptor resistance. Int J Obes Lond. 2018;42(3):391–397. doi:10.1038/ijo.2017.231
39. Tu Z, Du J, Ge X, et al. Triglyceride Glucose Index for the Detection of Diabetic Kidney Disease and Diabetic Peripheral Neuropathy in Hospitalized Patients with Type 2 Diabetes. Diabetes Ther. 2024;15(8):1799–1810. doi:10.1007/s13300-024-01609-3
40. Jiang Y, Lai X. Association between the triglyceride glucose index, triglyceride-glucose body mass index and diabetic kidney disease in adults with newly diagnosed type 2 diabetes. Front Med Lausanne. 2024;11:1328601. doi:10.3389/fmed.2024.1328601
41. Sridhar VS, Yau K, Benham JL, Campbell DJT, Cherney DZI. Sex and Gender Related Differences in Diabetic Kidney Disease. Semin Nephrol. 2022;42(2):170–184. doi:10.1016/j.semnephrol.2022.04.007
42. Jia X, Zhu Y, Qi Y, et al. Association between triglyceride glucose index and carotid intima-media thickness in obese and nonobese adults. J Diabetes. 2022;14(9):596–605. doi:10.1111/1753-0407.13312
43. Despres JP. Is visceral obesity the cause of the metabolic syndrome? Ann Med. 2006;38(1):52–63. doi:10.1080/07853890500383895
 © 2025 The Author(s). This work is published and licensed by Dove Medical Press Limited. The
full terms of this license are available at https://www.dovepress.com/terms
and incorporate the Creative Commons Attribution
- Non Commercial (unported, 4.0) License.
By accessing the work you hereby accept the Terms. Non-commercial uses of the work are permitted
without any further permission from Dove Medical Press Limited, provided the work is properly
attributed. For permission for commercial use of this work, please see paragraphs 4.2 and 5 of our Terms.
© 2025 The Author(s). This work is published and licensed by Dove Medical Press Limited. The
full terms of this license are available at https://www.dovepress.com/terms
and incorporate the Creative Commons Attribution
- Non Commercial (unported, 4.0) License.
By accessing the work you hereby accept the Terms. Non-commercial uses of the work are permitted
without any further permission from Dove Medical Press Limited, provided the work is properly
attributed. For permission for commercial use of this work, please see paragraphs 4.2 and 5 of our Terms.
Recommended articles
Association of Serum Total Bilirubin and Uric Acid with Low Glomerular Filtration Rate Diabetic Kidney Disease in Type 2 Diabetic Patients
Tafese R, Genet S, Addisu S
Diabetes, Metabolic Syndrome and Obesity 2022, 15:3993-3999
Published Date: 21 December 2022
Metformin Ameliorates Epithelial–Mesenchymal Transition of Renal Tubular Epithelial Cells in Diabetes by Increasing Vitamin D Receptor Expression
Wen W, Huang B, Ye S
Diabetes, Metabolic Syndrome and Obesity 2022, 15:4001-4010
Published Date: 22 December 2022
A Multifactorial Risk Score System for the Prediction of Diabetic Kidney Disease in Patients with Type 2 Diabetes Mellitus
Hui D, Zhang F, Lu Y, Hao H, Tian S, Fan X, Liu Y, Zhou X, Li R
Diabetes, Metabolic Syndrome and Obesity 2023, 16:385-395
Published Date: 10 February 2023
Construction of a Nomogram-Based Prediction Model for the Risk of Diabetic Kidney Disease in T2DM
Wang X, Liu X, Zhao J, Chen M, Wang L
Diabetes, Metabolic Syndrome and Obesity 2024, 17:215-225
Published Date: 12 January 2024
The Predictive Value of TyG Index and NLR for Risk of CHD and the Severity of Coronary Artery Lesions in Patients with Type 2 Diabetes Mellitus

Li H, Chen M, Wang Y, Cui W, Lou Y, Chen D, Deng H, Shen Z
Journal of Inflammation Research 2024, 17:11813-11828
Published Date: 28 December 2024