Back to Journals » Diabetes, Metabolic Syndrome and Obesity » Volume 16
A Multifactorial Risk Score System for the Prediction of Diabetic Kidney Disease in Patients with Type 2 Diabetes Mellitus
Authors Hui D ![]() , Zhang F, Lu Y
, Zhang F, Lu Y ![]() , Hao H, Tian S, Fan X, Liu Y, Zhou X
, Hao H, Tian S, Fan X, Liu Y, Zhou X ![]() , Li R
, Li R
Received 30 September 2022
Accepted for publication 4 January 2023
Published 10 February 2023 Volume 2023:16 Pages 385—395
DOI https://doi.org/10.2147/DMSO.S391781
Checked for plagiarism Yes
Review by Single anonymous peer review
Peer reviewer comments 2
Editor who approved publication: Prof. Dr. Antonio Brunetti
Dongna Hui,1,2 Fang Zhang,3 Yuanyue Lu,4 Huiqiang Hao,3 Shuangshuang Tian,3 Xiuzhao Fan,3 Yanqin Liu,3 Xiaoshuang Zhou,2 Rongshan Li1,2
1Institute of Biomedical Sciences, Shanxi University, Taiyuan, People’s Republic of China; 2Department of Nephrology, Shanxi Provincial People’s Hospital, Taiyuan, People’s Republic of China; 3Kidney Disease Data Center, Shanxi Provincial People’s Hospital, Taiyuan, People’s Republic of China; 4Department of Nephrology, The Fifth Clinical Medical College of Shanxi Medical University, Taiyuan, People’s Republic of China
Correspondence: Xiaoshuang Zhou, Department of Nephrology, Shanxi Provincial People’s Hospital, No. 29 Shuangta Street, Yingze District, Taiyuan, Shanxi, 030012, People’s Republic of China, Tel +86 13485318729, Email [email protected] Rongshan Li, Institute of Biomedical Sciences, Shanxi University, No. 92 Wucheng Road, Xiaodian District, Taiyuan, Shanxi, 030006, People’s Republic of China, Tel +86-0351-4960486, Email [email protected]
Purpose: In-depth investigations of risk factors for the identification of diabetic kidney disease (DKD) in type 2 diabetes mellitus (T2DM) are rare. We aimed to investigate the risk factors for developing DKD from multiple types of clinical data and conduct a comprehensive risk assessment for individuals with diabetes.
Methods: We carried out a case-control study, enrolling 958 patients to identify the risk factors for developing DKD in T2DM patients from a database established from inpatient electronic medical records. Multivariable logistic regression was applied to develop a prediction model and the performance of the model was evaluated using the area under the curve (AUC) and calibration curve. A multifactorial risk score system was established according to the Framingham Study risk score.
Results: DKD accounted for 34.03% of eligible patients in total. Twelve risk factors were selected in the final prediction model, including age, duration of diabetes, duration of hypertension, fasting blood glucose, fasting C-peptide, insulin use, systolic blood pressure, low-density lipoprotein, γ-glutamyl transpeptidase, platelet, uric acid, and thyroid stimulating hormone; and one protective factor, serum albumin. The prediction model showed an AUC of 0.862 (95% Confidence Interval (CI) 0.834– 0.890) with an accuracy of 81.5% in the derivation dataset and an AUC of 0.876 (95% CI 0.825– 0.928) in the validation dataset. The calibration curves were excellent and the estimated probability of DKD was more than 80% when the cumulative score for risk factors reached 17 points.
Conclusion: Newly recognized risk factors were applied to assess the development of DKD in T2DM patients and the established risk score system was a reliable and feasible tool for assisting clinicians to identify patients at high risk of DKD.
Keywords: diabetic kidney disease, multifactorial, prediction model, risk factors, type 2 diabetes
Introduction
Diabetic kidney disease (DKD) increases as the prevalence of diabetes mellitus (DM) rises dramatically.1 Publications based on epidemiology have indicated that DKD in developed countries is 20%~40%, and the overall frequency in China is 21.8% and showed geographical and gender variation.2,3 Moreover, nearly 50% of DKD patients would progress to end-stage renal disease, bringing an enormous cost burden to public healthcare systems.4 Early identification and intervention of DKD may offer the best opportunity for halting the disease progression. Consequently, efforts should be made to better understand routine risk factors in the development of DKD in patients with type 2 DM (T2DM).
Current studies have proposed two categories of risk factor associated with DKD, one for non-modifiable risk factors and the other for modifiable risk factors.5,6 However, most of the studies only focus on finding and identification of risk factors for DKD, failing to give more in-depth insight into their role in the development of DKD.7,8 For example, little is known about the desired target values of risk factors in predicting or intervening in the development of DKD. Previous studies have indicated that strict management of one modifiable factor, such as hyperglycemia, still inevitably promotes DKD progress.9 Recently, from the Steno-2 and J-DOIT3 studies, it was found that reduced macroalbuminuria and beneficial kidney function in DKD was achieved by the interaction of multiple factors.10–12 This indicates that the complex and multifactorial characteristics of DKD cannot be accurately explained by a single factor or a limited number of factors. The data from our study is based on patient electronic medical records, and is an example of a real-world study, may be able to compensate for the diversity of patients selected that randomized controlled studies cannot achieve, offering new perspectives for the recognition and management of the disease.
In the present study, we aimed to explore increased information concerning the risk factors for associated with the prediction of DKD in the T2DM population by using a dataset extracted from inpatient medical electronic records. In addition, we comprehensively assessed risk factors to establish a prediction model and then converted it into a risk score system as a simple and easy tool for clinical application.
Materials and Methods
Study Population
This was a retrospective case-control study, enrolling 958 patients who were hospitalized in the Department of Endocrinology or Nephrology at Shanxi provincial people’s hospital, Taiyuan, China between January 2017 and December 2021. The inclusion criteria were patients diagnosed with T2DM or first diagnosis of DKD at ages 18–75 years. Exclusion criteria were as follows: (1) patients with type 1 diabetes or secondary diabetes; (2) patients with acute complications of diabetes (hyperosmolar hyperglycemia syndrome, diabetic ketoacidosis, lactic acidosis), or the presence of diabetic retinopathy (DR); (3) presence of severe infection or autoimmune diseases, or malignant tumors; (4) patients with mental disease or genetic diseases; (5) patients complicated by urinary tract infection, acute/chronic nephritis and taking nephrotoxic drugs or drugs having an effect on the urinary protein excretion rate; or (6) patients with chronic kidney disease (CKD) stage 4 or stage 5 or having renal replacement therapy. The flowchart depicting our study design is shown in Supplementary Figure 1, and the study was reviewed and approved by the Institutional Review Board of the Shanxi provincial people’s hospital, Taiyuan, China ([2021] Provincial Medical Opinions No.354). As this study was conducted using medical records obtained from patient’s prior clinical procedures, their informed consent was waived. We ensured patient data confidentiality and patient privacy was protected, and the study was also in compliance with the Declaration of Helsinki and it followed the Transparent Reporting of a multivariable prediction model for Individual Prognosis or Diagnosis (TRIPOD) statement.13
Data Collection and Pre-Processing
The data were extracted from the clinical research platform at the Kidney Disease Data Center in Shanxi provincial people’s hospital, which included patient hospitalization medical records, outpatient medical records and others. We searched for the main diagnosis of T2DM and/or DKD (diagnosed according to the International Classification of Disease (ICD) −10 codes) from inpatient electronic medical records in the platform. Based on the purpose and inclusion and exclusion criteria, 958 patients were eligible to take part, of which 632 patients had T2DM and 326 patients had DKD. Initially, 70 variables were extracted, including demographic characteristics, previous medical history, previous drug use, glucose-related parameters, and laboratory examinations (blood routine items, liver function, thyroid function, renal function). After data cleaning, 22 variables with missing values of more than 40% were eliminated. Since the missing rate of the else variables were less than 15%, it was imputed using the median. Considering the recent research progress and clinical practice, 48 parameters were finally used for analysis in this study. The details of these variables are shown in Supplementary Table 1. The overall quality of the input data was assessed by two experienced physicians.
Definitions
The diagnosis of T2DM was according to the 1999 World Health Organization diagnostic criteria:14 a fasting plasma glucose ≥126 mg/dL (7.0 mmol/L), or a random plasma glucose ≥ 200 mg/dL (11.1 mmol/L), or HbA1c ≥ 6.5% with typical symptoms of diabetes, or the use of glucose-lowering agents. The diagnosis of DKD was based on urinary albumin-to-creatinine (UACR) ≥30 mg/g, and/or an estimated glomerular filtration rate (eGFR) of less than 60 mL/min per 1.73 m2 within 3 months or more with absence of other primary causes of kidney damage in patients with T2DM.15 Hypertension was considered as systolic pressure ≥ 140 mmHg and/or a diastolic pressure ≥ 90 mmHg or taking medication for hypertension.16 Macrovascular complications were defined as the middle and upper artery atherosclerosis caused by diabetes, including cerebral arteries, aorta, coronary arteries, and peripheral arteries. Peripheral vascular disease refers to stenosis or occlusion of the lower limb arteries caused by diabetes, resulting in intermittent claudication, and a more severe stage of limb amputation and death. Diabetic peripheral neuropathy was defined as damage to the nervous system caused by chronic hyperglycemia and various pathophysiological changes. Smoking was defined as those who had smoked for at least 6 months or had at least 100 cigarettes in their lifetime. Family history referred to first-degree relatives who had suffered from diabetes, hypertension, or both in their medical records.
Statistical Analysis
Analyses were performed using SPSS 26.0 (SPSS Inc., USA). The continuous variables were expressed as median and interquartile interval [M (QL, QU)] due to the non-normal distribution, using Mann–Whitney U-test. Categorical variables were expressed as frequencies (%) and compared by using Chi-square test. P-values < 0.05 with two-tailed were considered as a statistically significant level. Significant parameters (P < 0.05) were used for univariate and multivariate regression analysis to considerate the candidate variables (Shown in Supplementary Table 2). The multicollinearity test indicates the absence of multicollinearity among the covariates that the maximum variance inflation factor (VIF) was less than 2. Candidate variables were determinate by using a stepwise forward selection procedure and multivariable logistic regression equation modelling was used to develop the model for predicting DKD.
Prediction Model and Risk Score Development
The data were randomly allocated into training data sets (80%) for developing the model and validation data sets (20%) for validating the model’s performance. We used cut-off value determined by the receiver operating characteristic (ROC) curve to transform the continuous candidate variables into dichotomous variables and the results of variable conversions are shown in Supplementary Table 3. All candidate variables were initially included in a multivariable logistic regression model and screened by forward stepwise regression to get the best performance for the model. Next, we rechecked other excluded parameters at this stage and estimated them where necessary. Finally, twelve risk factors and one protective factor were identified after adjusting many times. Then, a forward stepwise logistic regression was used to develop a prediction model and its validation in the internal database. The performance of the model was evaluated using the area under the ROC curve and calibration curve. An area under the curve (AUC) > 0.8 was considered as excellent discrimination. Calibration was determined by a visual calibration plot comparing the predicted probability and the observed proportion of the occurrence of DKD. The calibration ability of the prediction model was evaluated by Hosmer-Lemeshow goodness-of-fit test. The established equation for predicting DKD was converted into a risk score system by using the estimated regression coefficients with reference to the Framingham Study risk score.17 After that, we also obtained an estimated probability at different risk scores.
Results
General Characteristics of the Patients
There were 958 patients included in the analysis, and the proportion of DKD patients was 34.03% (326/958) in total. The study population was randomly divided into a derivation set (n = 780) and a validation set (n = 178) by 8:2, and patient characteristics of both cohorts are shown in Tables 1 and Table 2. All quantitative variables were tested and confirmed to a non-normal distribution (P<0.05). In the derivation dataset, the mean ages for patients with T2DM was 51.36 (45.00, 59.00) years, and in DKD patients it was 53.98 (46.75, 64.00) years. Males were the main gender, and the ratio of males to females was 1.78:1 in total. The mean Scr was 66.03 (56.22, 74.64) μmol/L in T2DM patients and 76.28 (58.41, 83.97) μmol/L in DKD patients. After non parametric tests and Chi-square tests, factors with significant differences (P < 0.05) were determined, including age, body mass index (BMI), smoking, duration of diabetes, hypertension, systolic blood pressure (SBP), diastolic blood pressure (DBP), duration of hypertension, peripheral vascular disease, antidiabetic agents, antihypertension agents, lipid-lowering agents, aspirin, fasting plasma glucose (FPG), glycated hemoglobin (HbA1c), white blood cells (WBC), hematocrit (HCT), platelet (PLT), aspartate aminotransferase (AST), serum albumin (ALB), γ-glutamyl transpeptidase (γ-GGT), triglycerides (TG), total cholesterol (TC), low-density lipoprotein cholesterol (LDL-C), uric acid (UA), serum creatinine (Scr), total serum bilirubin (TBIL), direct bilirubin (DBIL), indirect bilirubin (IBIL), fasting C-peptide (FCP), fasting insulin (FINS), and thyroid stimulating hormone (TSH). In the validation dataset, the mean age in T2DM patients was 51.47 (43.75, 60.25) years and 55.57 (51.00, 65.00) years in the DKD patients. Males again represented most populous gender, and the ratio of men to women was 2.30:1 overall. Significantly different factors (P < 0.05) were age, duration of diabetes, hypertension, duration of hypertension, SBP, DBP, antihypertension agents, HCT, ALB, TG, Scr, and TSH.
 |
Table 1 Clinical Characteristics of the Patients |
 |
Table 2 Laboratory Characteristics of the Patients |
Candidate Variables Selection
To attain the potentially valuable predictors, we first screened out 29 variables by using univariate logistic regression analysis, and then imputed 28 variables into the multivariate logistic regression model to further ascertain 12 significant variables after adjustment. Due to the collinearity between hemoglobin (Hb) and HCT, we did not include HCT for analysis, and the result details are shown in Supplementary Table 2. We then reconfirmed the excluded predictors and whether they could be involved in a multivariable logistic analysis. At this stage, we converted the continuous variables into binary terms to obtain valuable predictors without omitting a single circumstance, as shown in Supplementary Table 3. Finally, we selected age, duration of diabetes, duration of hypertension, FPG, FCP, insulin use, SBP, TSH, UA, PLT, γ-GGT, LDL-C, and peripheral vascular disease as the 13 risk factors, and ALB as a protective factor for DKD.
Development of the Risk Score
The final prediction model was developed by using a stepwise multivariable logistic regression, including two continuous variables of age and duration of hypertension, others being dichotomy variables. The model showed an accuracy of 81.5%, sensitivity of 77.1%, and specificity of 82.5%. The detailed DKD risk prediction model was established as follows: age (1.026, 95% confidence interval (CI) [1.006, 1.047]); duration of diabetes (1.694, [1.040, 2.761]); FPG (4.215, [2.775, 6.402]); FCP (2.972, [1.878, 4.703]); Insulin use (3.171, [2.086, 4.821]); duration of hypertension (1.074, [1.040, 1.109]); SBP (2.628, [1.751, 3.945]); LDL -C (2.756, [1.718, 4.419]); UA (3.833, [2.444, 6.013]); TSH (2.433, [1.641, 3.607]); γ-GGT (1.829, [1.231, 2.751]); PLT (1.916, [1.285, 2.856]); and ALB (0.941, [0.901, 0.984]) (Shown in Table 3). The cumulative total score was 51 points in the transformed risk score chart, of which the probability of predicting DKD was more than 80% when the cumulative score reached 17 points (Shown in Table 4).
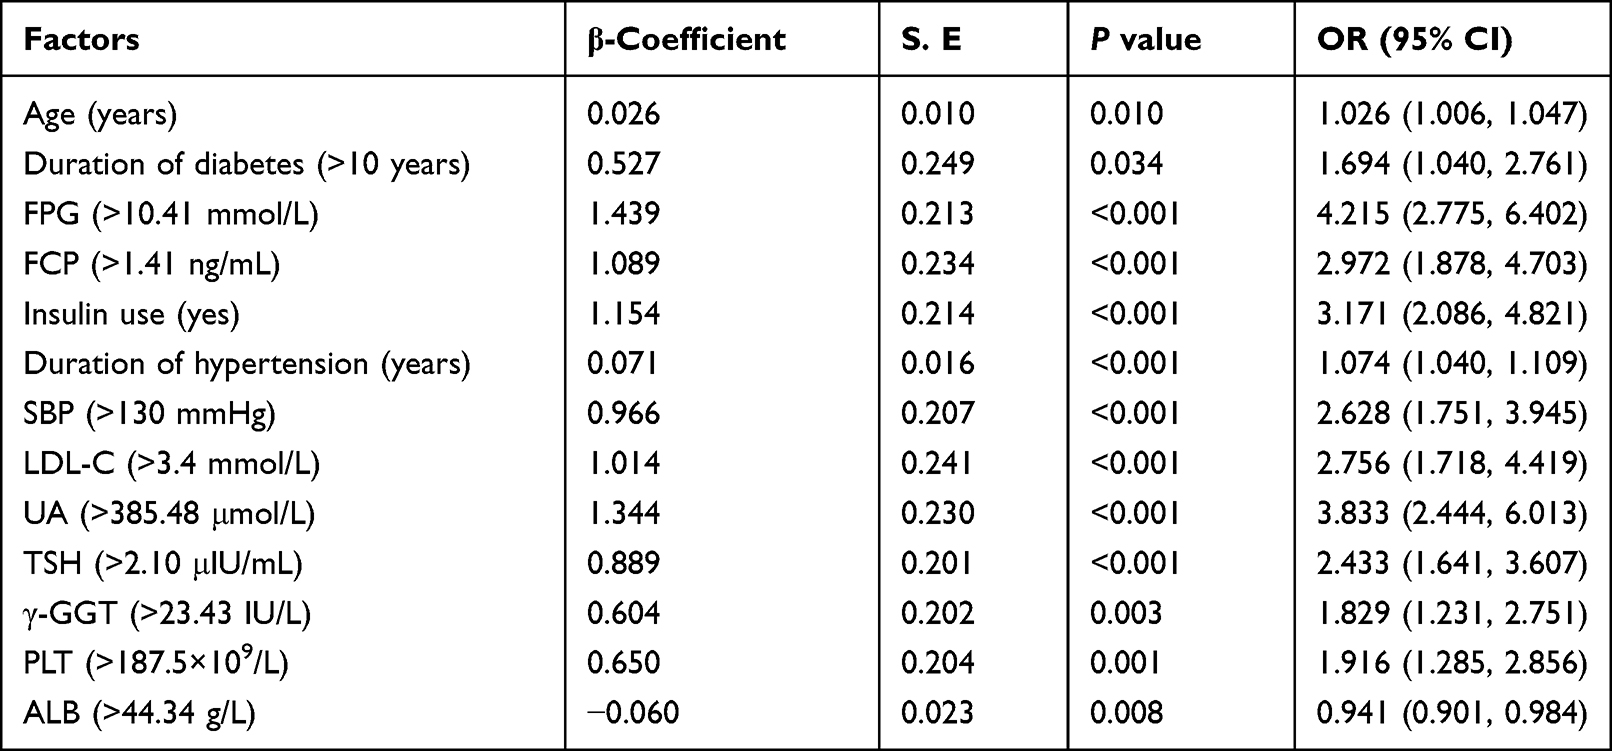 |
Table 3 Variables in the DKD Prediction Model |
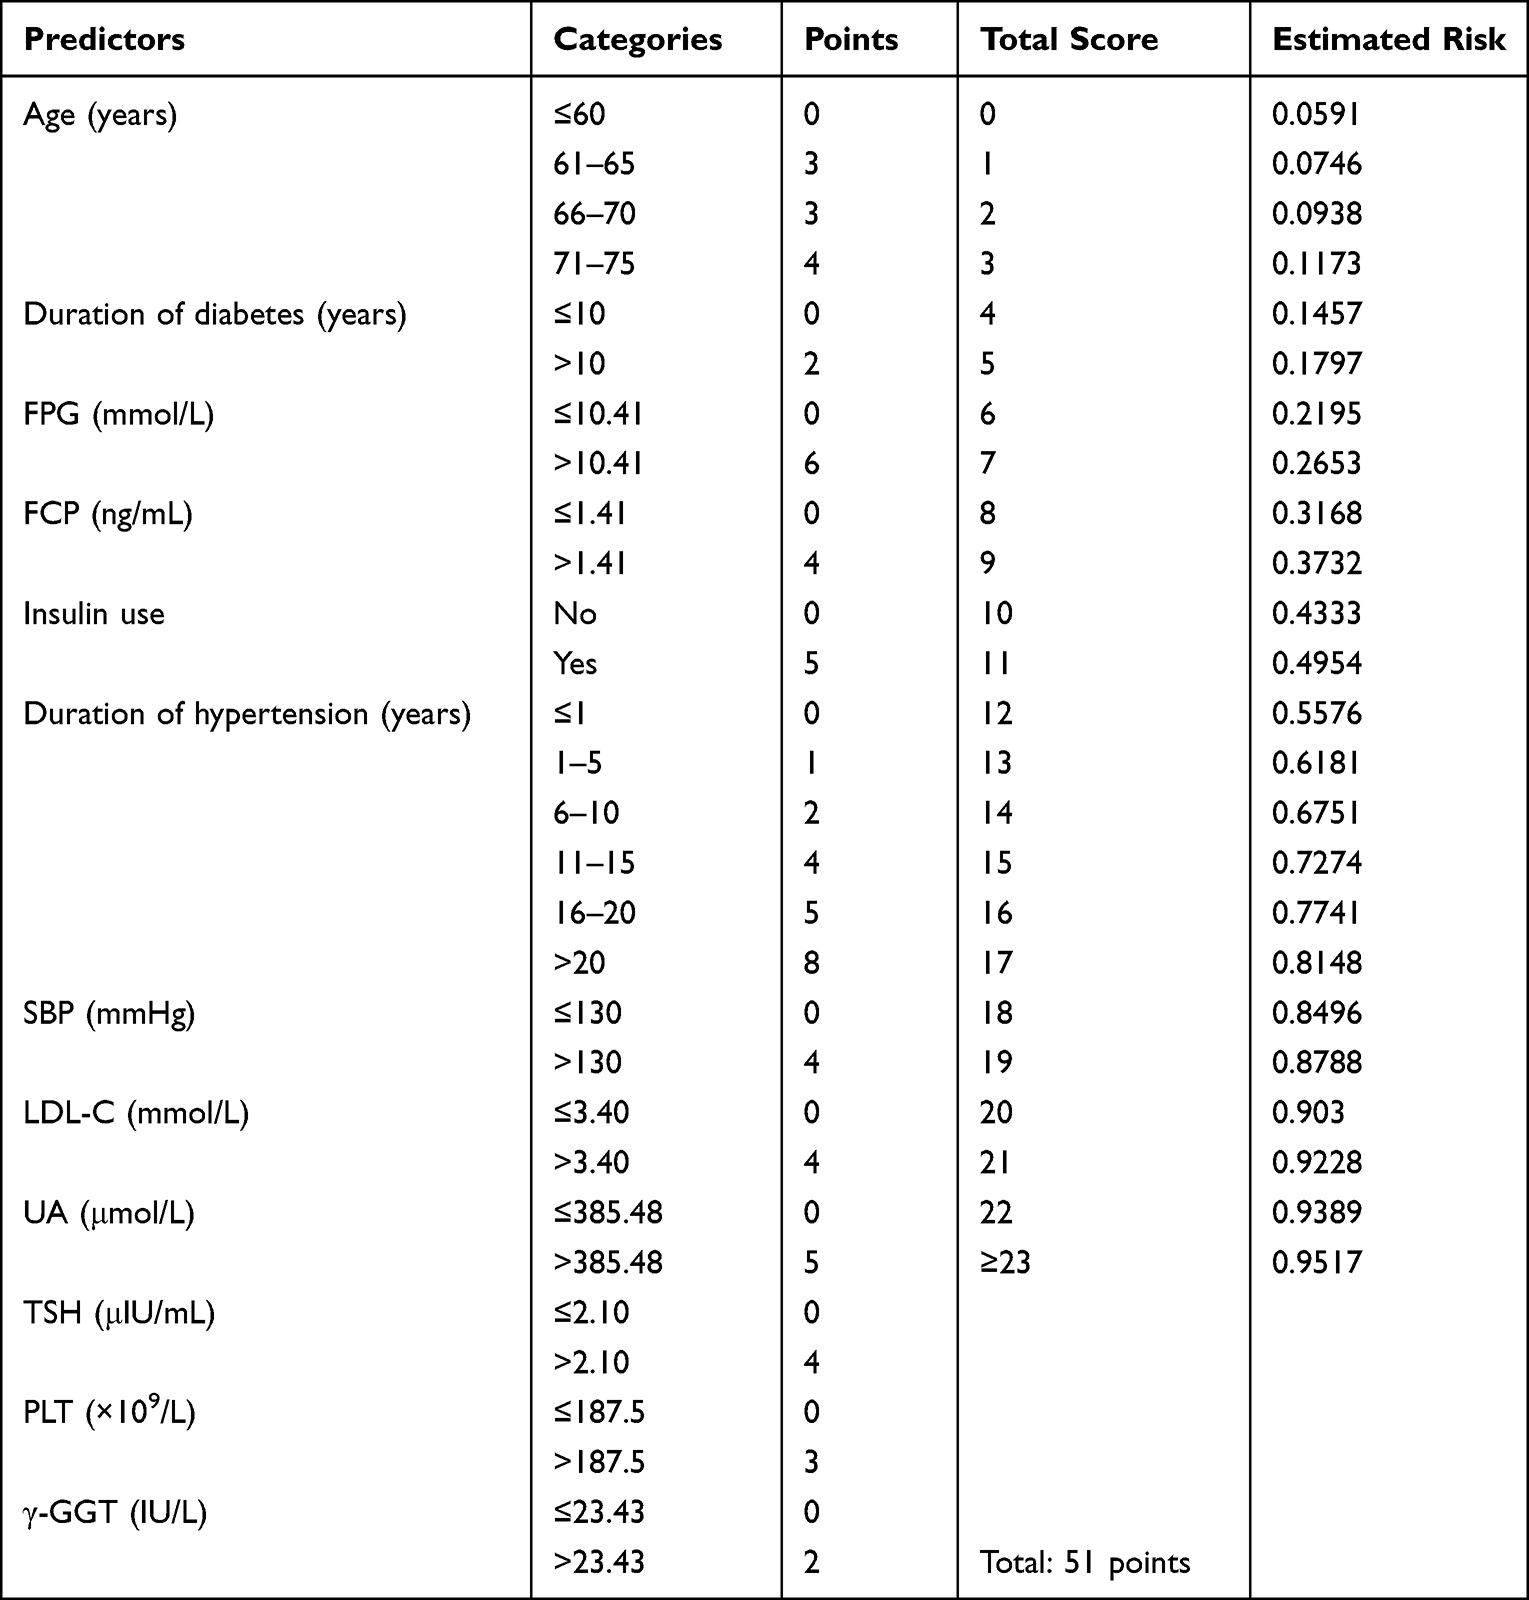 |
Table 4 Risk Score System for DKD and Prediction Probability |
Performance and Validation of the Risk Score
In the derivation cohort, the AUC for the risk prediction model was 0.862 (95% CI: 0.834–0.890); and the AUC was 0.876 (95% CI: 0.825–0.928) in the validation cohort. The ROC curve is shown in Figure 1. The Hosmer-Lemeshow goodness-of-fit test showed that Hosmer-Lemeshow (derivation cohort: χ2 = 9.285, P = 0.319; validation cohort: χ2 = 5.357, P = 0.719) revealed no significance between the predicted probability and the observed proportion (Figure 2A and Figure 2B). We also calculated the probability of predicting the occurrence of DKD at different scores, ranging from the least at 5% to more than 90%.
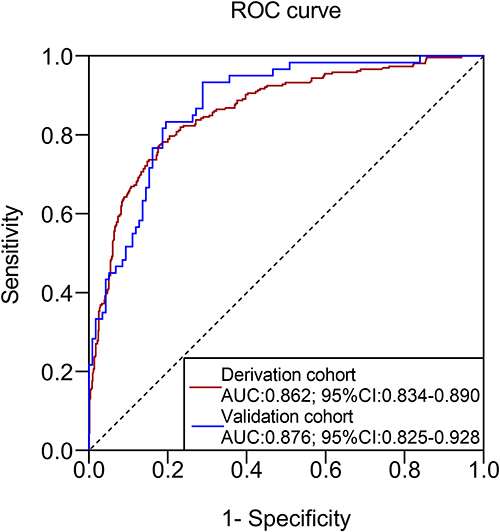 |
Figure 1 Receiver operating characteristic (ROC) curve of the derivation and validation cohort. The solid red line represented the derivation cohort, which the AUC and its 95% confidence interval (CI) were 0.862 (0.834–0.890); the solid blue line represented the validation cohort, which the AUC and its 95% CI were 0.876 (0.825–0.928). |
 |
Figure 2 The calibration curves for the risk score system in the derivation and validation cohort. The calibration plot showed the agreement between the predicted probability (x-axis) and the observed proportion (y-axis) of the risk of the study outcomes. (A) The calibration curve of the derivation cohort; (B) the calibration curve of the validation cohort. |
Discussion
Seeking risk factors for DKD in patients with T2DM is a basic and crucial issue, which will promote better understanding of the disease pathophysiology and improve the ability to identify high-risk populations. In this study, we demonstrated that risk factors not only referred to the well-known modifiable indicators of hyperglycemia, hypertension, dyslipidemia, but also involved some newly recognized factors, such as FCP, insulin use, UA, TSH, PLT, and γ-GGT. These findings provided multiple levels of information related to DKD development, which might pave the way for new ideas to further elucidate the disease mechanism. Unlike previous studies, the continuous variables of risk factors in the prediction model were converted into dichotomous variables with cut-off values determined by ROC curves, to increase the clinical interpretability. The established multifactorial risk score system showed excellent predictive performance both in the derivation and the internal validation datasets. Moreover, the system strengthens its contribution for predicting DKD compared to single variables, making it dependable for clinicians to apply in clinical practice.
Patients with a diagnosis of DKD accounted for 34.03% (326/958) in our study, which indicated a high frequency of DKD requiring the implementation of effective interventions to prevent or delay the progression. Our findings demonstrated that two nonmodifiable factors of old age (>60 years) and duration of diabetes (>10 years) were closely related to the development of DKD, and this is consistent with previous studies.8,18 However, their efficacy at predicting DKD was not so clear when considering the simultaneous effect of multiple factors or their interactions. As is known, hypertension plays an important role in DKD development and progression.19,20 However, our study adopted hypertension duration instead of the presence of hypertension as a predictor after adjustment of covariates. Through stratification analysis of the hypertension duration, we found that the risk score for predicting DKD increased approximately two-fold with a duration of hypertension increment of 5 years. This provided a quantifiable indicator to better assess the role of hypertension.
Hyperglycemia is a widely accepted modifiable risk factor for the initiation and promotion of DKD, especially in people with poor glycemic control. Our study showed that the cut-off value of FPG was 10.41 mmol/L for predicting DKD, which might provide new ideas for treating patients with poor glycemic control. However, how to set appropriate targets for patients with different physiological conditions need further study. In addition, the results underline the importance of controlling FPG for the reduction of DKD risk. Though HbA1c was a key indicator in clinical diagnosis, and its importance was eliminated after several adjustments using multivariate regression analysis. This might be the reason for its role in the progression of DKD to ESRD,21 not for the development of DKD. Fasting C-peptide is a stable indicator for the assessment of endogenous secretion of insulin and contributes to the occurrence of diabetic microvascular complications.22 A cross-sectional real-world study demonstrated that C-peptide might promote the incidence of DKD, and this relationship followed a U-style curve when C-peptide ≥ 1.71 ng/mL.23 Similarly, the threshold for the C-peptide was 1.41 ng/mL for the prediction of DKD in our study with an increased risk of 3.0 times. Moreover, our study showed that insulin use was more frequent in the DKD patients than in the T2DM patients. This demonstrated that unsatisfactory glycemic control was more common in the DKD population. Therefore, a comprehensive analysis of fasting blood glucose, pancreatic function and timing of insulin use would be beneficial to reduce the development of DKD.
Elevated blood pressure and dyslipidemia were identified as other major modifiable risk factors associated with the development and progression of DKD in individuals with T2DM.24 We found that SBP > 130 mmHg positively increased the risk of DKD, indicating that it was an attractive target for patients to reduce complications. A previous study from the UK Prospective Diabetes Study showed that triglycerides and LDL cholesterol were independent risk factors for DKD progression.25 However, studies on the relationship between lipoprotein and DKD were inconsistent and heterogeneous. Moreover, it remains to be determined which type of lipoprotein affects the occurrence of DKD and to what extent. In the present study, we suggest that LDL-C was an independent risk factor for predicting DKD at a level higher than 3.4 mmol/L, which might provide management targets in T2DM patients.
Concerning uric acid (UA), an observational analysis from the Treatment Options for Type 2 Diabetes in Adolescents and Youth (TODAY) study showed that increased UA strongly predicted higher risk of hypertension and DKD.26 In our study, we found that the risk of DKD can be recognized when the value of UA is greater than 385.48 μmol/L in the prediction model, without gender distinction. TSH is the earliest and most sensitive indicator of thyroid function. Several studies confirmed that high TSH levels were related to increased incidence of DKD, particularly in cases of macroalbuminuria.27 Our results found that the increased risk of DKD was identified when the TSH level was higher than 2.10 U/mL. However, a recent study indicated that TSH negatively correlated with UA, and the mechanism might involve the regulation of UA metabolism in early-stage DKD patients.28 The relationship between UA, TSH and hypertension warrants further study to elucidate the mechanism of their role in the occurrence of DKD.
Studies looking at the relationship PLT, γ-GGT and ALB and the onset of DKD are scarce. Our study showed that PLT with a borderline value of 187.5 × 10⁹/L was associated with an increased risk of DKD. This mechanism may be related to spontaneous platelet aggregation, and blood in a high coagulated state, resulting in renal micro-thrombosis and ultimately glomerulosclerosis.29,30 γ-GGT is a metabolic biomarker for liver dysfunction and excessive alcohol intake and can promote the development of T2DM in a nonlinear dose-response pattern.31 Recent evidence has suggested that γ-GGT has extra-hepatic implications for the application of in risk stratification related to cardiovascular disease and cognitive impairment.32,33 Our results demonstrated that γ-GGT levels higher than 23.43 IU/L would increase the risk of DKD by 1.8-times. The two identified variables suggested that we can understand the pathophysiological changes in DKD from the aspects of hemodynamic and metabolic transformation. Albumins participate in maintaining homeostasis, supply nutrients to the body and regulate important physiological processes. Recently, a retrospective study showed that decreased ALB levels below 39.3 g/L was an independent risk indicator of DKD in T2DM patients.34 This result was consistent with our study showing that high levels of ALB was a protective factor in DKD patients. From the above, we recommended that screening for ALB might contribute to protect the kidney from hyperglycemia.
Based on previous studies, we analyzed and obtained multiple risk factors associated with the development of DKD from the available medical data from hospitalized patients. Those predictors not only included three well-known modified factors (hyperglycemia, hypertension, and dyslipidemia), but also pointed out the linkage between DKD and liver function, thyroid function, or hemostasis. Thus, this represents a comprehensive understanding of the risk factors for DKD in T2DM patients. We also determined the cut-off value of the continuous variables in the risk factors, which might strengthen knowledge of the disease and promote the management of T2DM patients. Finally, the established risk score was more reliable and feasible for clinicians to utilize and enhances the ability to identify high-risk populations. There were several limitations of our present study. Since we carried out a retrospective study, the causality between risk factors and DKD could not be elucidated. Furthermore, there was a bias in patient selection, which needs to be confirmed in different populations. We also excluded patients complicated with diabetic retinopathy as this represented an additional microvascular complication. Finally, the lack of any external validation reduces the applicability of the DKD risk score.
Conclusion
We found that the identified risk factors associated with the development of DKD in T2DM patients covered blood glucose, blood pressure, blood lipids, thyroid function, liver function and hemostasis. For patients with T2DM, strict control of the above factors would be beneficial for the delay or prevention of DKD. The established multifactorial risk score system can be applied to detect and predict T2DM patients with a high risk of DKD, and to better understand the disease pathophysiology and help promote diabetes management. In addition, it is easy for clinicians to implement during their clinical practice.
Data Sharing Statement
The data in favor of the findings of this study cannot be disclosed due to the protection of patient privacy, but are available from the corresponding author Dr. Zhou [zhouxiaoshuang@ sxmu.edu.cn].
Acknowledgments
The authors would like to thank the Kidney Disease Data Center for their cooperation.
Author Contributions
All authors made a significant contribution to the work reported, whether that is in the conception, study design, execution, acquisition of data, analysis and interpretation, or in all these areas; took part in drafting, revising or critically reviewing the article; gave final approval of the version to be published; have agreed on the journal to which the article has been submitted; and agree to be accountable for all aspects of the work.
Funding
This work was supported by the Key Projects of Shanxi Provincial Health Commission [grant number 2021XM27].
Disclosure
The authors declare that they have no competing interests.
References
1. Saeedi P, Petersohn I, Salpea P, et al. Global and regional diabetes prevalence estimates for 2019 and projections for 2030 and 2045: results from the international diabetes federation diabetes atlas, 9 (th) editions. Diabetes Res Clin Pract. 2019;157:107843. doi:10.1016/j.diabres.2019.107843
2. Afkarian M, Zelnick LR, Hall YN, et al. Clinical manifestations of kidney disease among US adults with diabetes, 1988–2014. JAMA. 2016;316(6):602–610. doi:10.1001/jama.2016.10924
3. Zhang XX, Kong J, Yun K. Prevalence of diabetic nephropathy among patients with type 2 diabetes mellitus in China: a meta-analysis of observational studies. J Diabetes Res. 2020;3:2315607.
4. Cheng HT, Xu X, Lim PS, et al. Worldwide epidemiology of diabetes-related end-stage renal disease, 2000–2015. Diabetes Care. 2021;44(1):89–97. doi:10.2337/dc20-1913
5. Alicic RZ, Rooney MT, Tuttle KR. Diabetic kidney disease: challenges, progress, and possibilities. Clin J Am Soc Nephrol. 2017;12(12):2032–2045. doi:10.2215/CJN.11491116
6. Harjutsalo V, Groop PH. Epidemiology and risk factors for diabetic kidney disease. Adv Chronic Kidney Dis. 2014;21(3):260–266. doi:10.1053/j.ackd.2014.03.009
7. Radcliffe NJ, Seah JM, Clarke M, et al. Clinical predictive factors in diabetic kidney disease progression. J Diabetes Investig. 2017;8(1):6–18. doi:10.1111/jdi.12533
8. Maclsaac RJ, Ekinci EI, Jerums G. Markers of and risk factors for the development and progression of diabetic kidney disease. AM J Kidney Dis. 2014;63(Suppl 2):S39–62. doi:10.1053/j.ajkd.2013.10.048
9. Coca SG, Ismail-Beigi F, Haq N, et al. Role of intensive glucose control in development of renal end points in type 2 diabetes mellitus: systematic review and meta-analysis intensive glucose control in type 2 diabetes. Arch Intern Med. 2012;172(10):761–769. doi:10.1001/archinternmed.2011.2230
10. Oellgaard J, Gæde P, Rossing P, et al. Intensified multifactorial intervention in type 2 diabetics with microalbuminuria leads to long-term renal benefits. Kidney Int. 2017;91(4):982–988. doi:10.1016/j.kint.2016.11.023
11. Ueki K, Sasako T, Okazaki Y, et al. Effect of an intensified multifactorial intervention on cardiovascular outcomes and mortality in type 2 diabetes (J-DOIT3): an open-label, randomized controlled trial. Lancet Diabetes Endocrinol. 2017;5(12):951–964. doi:10.1016/S2213-8587(17)30327-3
12. Ueki K, Sasako T, Okazaki Y, et al. Multifactorial intervention has a significant effect on diabetic kidney disease in patients with type 2 diabetes. Kidney Int. 2021;99(1):256–266. doi:10.1016/j.kint.2020.08.012
13. Moons KG, Altman DG, Reitsma JB, et al. Transparent Reporting of a multivariable prediction model for Individual Prognosis or Diagnosis (TRIPOD): explanation and elaboration. Ann Intern Med. 2015;162:W1–73. doi:10.7326/M14-0698
14. Alberti KG, Zimmet PZ. Definition, diagnosis and classification of diabetes mellitus and its complications: report of a who consultation. part 1: diagnosis and classification of diabetes mellitus provisional report of a WHO consultation. Diabet Med. 1998;15(7):539–553. doi:10.1002/(SICI)1096-9136(199807)15:7<539::AID-DIA668>3.0.CO;2-S
15. KDOQI; KDOQI Clinical practice Guidelines and clinical practice recommendations for diabetes and chronic kidney disease. Am J Kidney Dis. 2007;49(2 Suppl 2):S12–154. doi:10.1053/j.ajkd.2006.12.005
16. Liu LS. Writing group of Chinese guidelines for the management of hypertension: [2010 Chinese guidelines for the management of hypertension]. Zhonghua Xin Xue Guan Bing Za Zhi. 2011;39(7):579–615.
17. Sullivan LM, Massaro JM, D’Agostino RB. Presentation of multivariate data for clinical use: the Framingham study risk score functions. Stat Med. 2004;23(10):1631–1660. doi:10.1002/sim.1742
18. Jiang WH, Wang JY, Shen XF, et al. Establishment and validation of a risk prediction model for early diabetic kidney disease based on a systematic review and meta-analysis of 20 cohorts. Diabetes Care. 2020;43(4):925–933. doi:10.2337/dc19-1897
19. Fagerudd JA, Tarnow L, Jacobsen P, et al. Predisposition to essential hypertension and development of diabetic nephropathy in IDDM patients. Diabetes. 1998;47(3):439–444. doi:10.2337/diabetes.47.3.439
20. Van Buren PN, Toto R. Hypertension in diabetic nephropathy: epidemiology, mechanisms, and management. Adv Chronic Kidney Dis. 2011;18(1):28–41. doi:10.1053/j.ackd.2010.10.003
21. Ruospo M, Saglimbene VM, Palmer SC, et al. Glucose targets for preventing diabetic kidney disease and its progression. Cochrane Database Syst Rev. 2017;6(6):CD010137. doi:10.1002/14651858.CD010137.pub2
22. Brunskill NJ. C-peptide and diabetic kidney disease. J Intern Med. 2017;281(1):41–51. doi:10.1111/joim.12548
23. Huang YJ, Wang YH, Liu CF, et al. C‐peptide, glycaemic control, and diabetic complications in type 2 diabetes mellitus: a real‐world study. Diabetes Metab Res Rev. 2022;38(4):e3514. doi:10.1002/dmrr.3514
24. Yamout H, Lazich I, Bakris GL. Blood pressure, hypertension, RAAS blockade, and drug therapy in diabetic kidney disease. Adv Chronic Kidney Dis. 2014;21(3):281–286. doi:10.1053/j.ackd.2014.03.005
25. Eid S, Sas KM, Abcouwer SF, et al. New insights into the Mechanisms of diabetic complications: role of lipids and lipid metabolism. Diabetologia. 2019;62(9):1539–1549. doi:10.1007/s00125-019-4959-1
26. Bjornstad P, Laffe L, Lynch J, et al. Elevated serum uric acid is associated with greater risk for hypertension and diabetic kidney diseases in obese adolescents with type 2 diabetes: an observational analysis from the treatment options for type 2 diabetes in adolescents and youth (TODAY) study. Diabetes Care. 2019;42(6):1120–1128. doi:10.2337/dc18-2147
27. Wang J, Li H, Tan M, et al. Association between thyroid function and diabetic nephropathy in euthyroid subjects with type 2 diabetes mellitus: a cross-sectional study in China. Oncotarget. 2019;10(2):88–97. doi:10.18632/oncotarget.26265
28. Feng X, Huang J, Peng Y, et al. Association between decreased thyroid stimulating hormone and hyperuricemia in type 2 diabetic patients with early-stage diabetic kidney disease. BMC Endocr Disord. 2021;21(1):108–116. doi:10.1186/s12902-020-00672-8
29. Pan LL, Ye YL, Wo MY, et al. Clinical significance of hemostatic parameters in the prediction for type 2 diabetes mellitus and diabetic nephropathy. Dis Markers. 2018;2018:5214376. doi:10.1155/2018/5214376
30. Hess K. The vulnerable blood. Coagulation and clot structure in diabetes mellitus. Hamostaseplogie. 2015;35(1):25–3329. doi:10.5482/HAMO-14-09-0039
31. Kunutsor SK, Abbasi A, Adler AI. Gamma-glutamyl transferase and risk of type II diabetes: an updated systematic review and dose-response meta-analysis. Ann Epidemiol. 2014;24(4):809–816. doi:10.1016/j.annepidem.2014.09.001
32. Brennan PN, Dillon JF, Tapper LB. Gamma--glutamyl-transferase-(γ-GGT) ——an old dog with new tricks? Liver Int. 2022;42(1):9–15. doi:10.1111/liv.15099
33. Li SQ, Liao XL, Pan YS, et al. Gamma-glutamyl transferase levels are associated with the occurrence of post-stroke cognitive impairment: a multicenter cohort study. BMC Neurol. 2022;22(1):65. doi:10.1186/s12883-022-02587-4
34. Zhang J, Deng YY, Wan Y, et al. Association between serum albumin level and microvascular complications of type 2 diabetes mellitus. Diabetes Metab Syndr Obe. 2022;15:2173–2182. doi:10.2147/DMSO.S373160
 © 2023 The Author(s). This work is published and licensed by Dove Medical Press Limited. The
full terms of this license are available at https://www.dovepress.com/terms
and incorporate the Creative Commons Attribution
- Non Commercial (unported, 3.0) License.
By accessing the work you hereby accept the Terms. Non-commercial uses of the work are permitted
without any further permission from Dove Medical Press Limited, provided the work is properly
attributed. For permission for commercial use of this work, please see paragraphs 4.2 and 5 of our Terms.
© 2023 The Author(s). This work is published and licensed by Dove Medical Press Limited. The
full terms of this license are available at https://www.dovepress.com/terms
and incorporate the Creative Commons Attribution
- Non Commercial (unported, 3.0) License.
By accessing the work you hereby accept the Terms. Non-commercial uses of the work are permitted
without any further permission from Dove Medical Press Limited, provided the work is properly
attributed. For permission for commercial use of this work, please see paragraphs 4.2 and 5 of our Terms.
Recommended articles
Association of Serum Total Bilirubin and Uric Acid with Low Glomerular Filtration Rate Diabetic Kidney Disease in Type 2 Diabetic Patients
Tafese R, Genet S, Addisu S
Diabetes, Metabolic Syndrome and Obesity 2022, 15:3993-3999
Published Date: 21 December 2022
Using Machine Learning Algorithms to Predict High-Risk Factors for Postoperative Delirium in Elderly Patients
Liu Y, Shen W, Tian Z
Clinical Interventions in Aging 2023, 18:157-168
Published Date: 8 February 2023
Risk Factors for Granulomatous Mastitis and Establishment and Validation of a Clinical Prediction Model (Nomogram)
Zeng Y, Zhang D, Fu N, Zhao W, Huang Q, Cui J, Chen Y, Liu Z, Zhang X, Zhang S, Mansoor KM
Risk Management and Healthcare Policy 2023, 16:2209-2222
Published Date: 20 October 2023
Construction of a Nomogram-Based Prediction Model for the Risk of Diabetic Kidney Disease in T2DM
Wang X, Liu X, Zhao J, Chen M, Wang L
Diabetes, Metabolic Syndrome and Obesity 2024, 17:215-225
Published Date: 12 January 2024
Development of Serum Lactate Level-Based Nomograms for Predicting Diabetic Kidney Disease in Type 2 Diabetes Mellitus Patients
Jiang C, Ma X, Chen J, Zeng Y, Guo M, Tan X, Wang Y, Wang P, Yan P, Lei Y, Long Y, Law BYK, Xu Y
Diabetes, Metabolic Syndrome and Obesity 2024, 17:1051-1068
Published Date: 1 March 2024