Back to Journals » International Journal of General Medicine » Volume 18
Relationship Between Fasting Blood Glucose to High-Density Lipoprotein Cholesterol Ratio (GHR) and Coronary Artery Vascular Lesions: A Retrospective Cross-Sectional Study
Authors Yan HB, Liu ZX, Yang YJ, Liu C, Yang ZC, Wang Y, Xu X, Liu WT, Wang XH, Zhang YN, He H ![]()
Received 8 August 2025
Accepted for publication 16 October 2025
Published 21 October 2025 Volume 2025:18 Pages 6387—6398
DOI https://doi.org/10.2147/IJGM.S555785
Checked for plagiarism Yes
Review by Single anonymous peer review
Peer reviewer comments 2
Editor who approved publication: Dr Redoy Ranjan
Han-Bing Yan,1 Zi-Xuan Liu,1 Yuan-Jiao Yang,1 Chen Liu,1 Zhi-Chao Yang,1 Yuan Wang,1 Xin Xu,1 Wen-Tao Liu,1 Xiao-Hui Wang,1 Ya-Nan Zhang,1 Hui He1– 4
1Clinical Research Center, Liaoning Province Benxi Central Hospital, Benxi, Liaoning, 117000, People’s Republic of China; 2Department of Research and Development, Liaoning Province Benxi Clinical Bio-Bank, Benxi, Liaoning, 117000, People’s Republic of China; 3Training Department, China Medical University Benxi Central Hospital Postgraduate Training Workstation, Benxi, Liaoning, 117000, People’s Republic of China; 4Department of Research and Development, Shenyang Kati Health Consulting Co. LTD, Shenyang, Liaoning, 110101, People’s Republic of China
Correspondence: Hui He, Clinical Research Center, Liaoning Province Benxi Central Hospital, Benxi, Liaoning, 117000, People’s Republic of China, Tel +86-18941435621, Email [email protected]
Purpose: To investigate the relationship between the ratio (GHR) of fasting blood glucose (FBG) to high-density lipoprotein cholesterol (HDL-C) and the degree of coronary artery stenosis.
Patients and Methods: This retrospective cross-sectional study enrolled 1313 eligible participants who underwent coronary arteriography (CAG) or coronary computed tomography angiography (CCTA) between January 1, 2022, and May 31, 2023, from the electronic medical record system of Liaoning Province Benxi Central Hospital. Participants were divided into two groups: a Coronary Artery Disease (CAD) group (n = 1071) and a non-CAD group (n = 242). Patients in the CAD group were further categorized into three groups based on their GS: a low GS group (GS ≤ 32, n = 404), a medium GS group (32 < GS ≤ 66, n = 313), and a high GS group (GS > 66, n = 354). Logistic regression analysis was used to determine the association between GHR and CAD, as well as severe CAD. Receiver operating characteristic (ROC) curves were constructed to analyze the predictive value of GHR for CAD and severe CAD.
Results: The median GHR in the CAD group was significantly higher than that in the non-CAD group (5.980 vs 4.871, P = 0.000). GHR was positively correlated with GS and the number of coronary artery lesions. Logistic regression analysis indicated that GHR was an independent predictor of CAD and severe CAD. ROC analysis showed that GHR had predictive value for CAD and severe CAD. The areas under the curve (AUC) were 0.672 and 0.591, respectively, both of which were statistically significant (P = 0.000). Combining GHD with other risk factors to construct a new diagnostic model significantly improved the AUC.
Conclusion: GHR is associated with the degree of coronary artery stenosis and can predict CAD and its severity.
Keywords: coronary artery disease, atherosclerosis, high-density lipoprotein cholesterol, fasting blood glucose, coronary stenosis
Introduction
Cardiovascular diseases are the leading cause of morbidity and mortality worldwide and a major obstacle to sustained human development.1,2 According to surveys, in 2022, cardiovascular diseases caused a total of 2,275.9 years of healthy life lost per 100,000 population globally.3 Among various cardiovascular diseases, Coronary Artery Disease (CAD) has the most severe adverse impact on human health, imposing a significant disease burden on global healthcare systems, which undoubtedly places immense pressure on healthcare systems.3 Early detection, diagnosis, and treatment of CAD and severe CAD at primary healthcare facilities are crucial for disease prevention and control.
The current diagnostic methods for CAD primarily rely on coronary arteriography (CAG) or coronary computed tomography angiography (CCTA).4,5 Through coronary imaging examinations, physicians can assess the severity of vascular lesions and the number of affected vessels. The most commonly used assessment tool is the Gensini Score (GS) system, which assigns different weight scores to the location of each affected vessel and the degree of lumen stenosis. Doctors calculate the total score by summing the weighted scores of the affected vessels using the GS system, thereby making a diagnosis of CAD and determining its severity.6,7
However, in clinical practice, both CAG and CCTA examinations involve radiation exposure and are therefore not suitable for patients who are allergic to iodine contrast agents, have hyperthyroidism, or suffer from severe heart or kidney failure and are unable to tolerate such examinations.8,9 Additionally, CAG is an invasive examination with relatively high costs and has not yet been widely adopted in primary care facilities, further limiting its applicability for early disease screening. Therefore, identifying new, relatively convenient, and cost-effective clinical biomarkers has become particularly important for improving the early diagnosis of CAD and identifying high-risk patients with severe conditions.
CAD is a complex, multifactorial disease. Metabolic syndrome (MetS) is the leading cause of the prevalence of CAD.10,11 MetS includes abdominal obesity, high triglycerides (TG), low high-density lipoprotein cholesterol (HDL-C), hypertension, and elevated fasting blood glucose (FBG).12 Previous studies have demonstrated the relationship between insulin resistance and subclinical atherosclerosis (a precursor to coronary heart disease), thereby proving that abnormal glucose metabolism (such as abnormal FBG) may promote early atherosclerotic changes13.13 Dyslipidemia is another important risk factor in the development and progression of coronary artery atherosclerosis. Epidemiological studies strongly suggest that HDL-C levels are negatively associated with CAD risk.14
As mentioned above, both FBG and HDL-C are associated with the occurrence and development of atherosclerosis. Currently, there are no studies investigating whether the ratio of FBG to HDL-C (GHR) is associated with coronary artery lesions. GHR can provide information about glucose and lipid metabolism in the body and may serve as a more comprehensive biomarker associated with atherosclerosis. We hypothesize that GHR has a positive correlation with the severity of CAD, as measured by GS, and may serve as an independent predictor of CAD. In this study, we investigated the relationship between GHR and the severity of coronary artery stenosis. We evaluated the predictive value of GHR for the severity of coronary artery lesions in patients.
Materials and Methods
Study Design and Subjects
This study is a retrospective cross-sectional study. Patient information from 3017 patients who underwent CAG or CCTA between January 1, 2022, and May 31, 2023, was obtained from the electronic medical record system of Liaoning Province Benxi Central Hospital. After screening based on inclusion and exclusion criteria, a total of 1313 study subjects were ultimately included.
Inclusion criteria: Patients who undergo CAG or CCTA due to health checkups or CAD-related symptoms (such as chest tightness or pain) or because their doctors strongly suspect coronary artery stenosis.15,16
Exclusion criteria: (1) Clinical decompensated heart failure;6 (2) History of previous revascularization procedures (venous thrombolysis, percutaneous coronary intervention, or coronary artery bypass grafting);6,17 (3) Severe hematological disorders;6 (4) Active infection or systemic inflammation;17,18 (5) Thyroid dysfunction;18 (6) Severe hepatic or renal insufficiency;6 (7) Malignant tumors;6 (8) Incomplete records of CAG surgery or CCTA results.
Definition of CAD: CAD was the presence of at least 50% stenosis of the vessel diameter in any major coronary artery (left main, left anterior descending, left circumflex, and right coronary artery) (n=1071).6 The remaining eligible study subjects who did not meet the CAD diagnostic criteria were non-CAD patients (n=242) (Figure 1).
 |
Figure 1 Flow chart of the research process. Abbreviations: CAG, coronary arteriography; CCTA, coronary computed tomography angiography; GS, Gensini score. |
Definition of severe CAD: The severity of CAD is calculated based on GS scores (Supplemental Table 1).6,7 Participants were grouped into tertiles based on their GS scores: Tertile 1 (GS ≤ 32, Low GS Group, n = 404), Tertile 2 (32 < GS ≤ 66, Middle GS Group, n = 313), and Tertile 3 (GS > 66, High GS Group, n = 354).6 Patients in Tertile 1 and Tertile 2 were combined and defined as non-severe CAD (n=717), while patients in Tertile 3 were defined as severe CAD.15
Definition of the number of coronary artery lesions: Coronary artery stenosis lesions were classified into single-vessel (308 cases), two-vessel (324 cases), and three-vessel (439 cases) based on the number of affected coronary artery branches. Noticeable lesions of the left main coronary artery were considered equivalent to three-vessel disease.15 Clinicians used the Visual Estimation method to assess the severity of vascular lesions, while the diagnostic and treatment team calculated the GS score.
The Ethics Committee of Liaoning Province Benxi Central Hospital approved this study. The study protocol complies with the principles of the Declaration of Helsinki. As this is a retrospective study, the Ethics Committee approved the study to be exempt from informed consent. The principal investigator had submitted a statement regarding patient data confidentiality for this study to the Ethics Committee and had obtained approval. Throughout the research process, we anonymized all patient data collected.
Data Collection
We retrospectively collected data on gender, age, serum FGB, HDL-C, and LDL-C levels for all study participants through the electronic medical record system. We restricted the collection of peripheral venous blood to the period before patients underwent CAG or CCTA examinations, and patients had fasted for 12 hours prior to the procedure. The laboratory technician performed the tests using the LABOSPECT 008AS Fully Automated Biochemical Analyzer with the corresponding reagent kits. GHR was calculated by the formula [FBG (mmol/L)/HDL-C (mmol/L)].19
We also collected multiple CAD risk factors, including hypertension, type 2 diabetes, smoking, family history of coronary heart disease, and serum creatinine.20,21 The diagnostic criteria for hypertension were systolic blood pressure ≥140 mmHg and/or diastolic blood pressure ≥90 mmHg.22 The diagnostic criteria for type 2 diabetes (T2DM) follow the 2021 T2DM definition by the American Diabetes Association: FBG ≥7.0 mM, 2-hour postprandial blood glucose ≥11.1 mM, and/or haemoglobin A1c ≥6.5%, or patients currently using FBG-lowering medications.23 Smoking is current smoking.17 A family history of coronary heart disease is having a first-degree relative with coronary heart disease or sudden cardiac death before the age of 55 in men or 65 in women.17
Quality Control
Two or more cardiovascular medicine or interventional medicine physicians evaluate all CAG or CCTA reports to determine the location of vascular lesions and the percentage of vascular lumen stenosis. The reporting physicians hold the title of attending physician or above, and the reviewing physicians hold a higher title than the reporting physicians. During data collection, trained data collectors rigorously and objectively collect data. Professionals verify the collected data.
Sample Size Estimation
We queried the electronic medical record data of Liaoning province Benxi Central Hospital and obtained data on all patients who underwent CAG or CCTA in 2022. Among them, 84% were diagnosed with CAD. The test level (α) was at 0.05, and the allowable error (δ) was at 3%. We used PASS 15.0 software to calculate the results: n = 851.
Data Analysis
This study utilized SPSS software (version 25.0) and Prism 10 software for statistical analysis. Continuous variables were expressed as the median (interquartile range). Comparisons between two groups were performed using the Mann–Whitney U-test. Comparisons among the three groups were conducted using the Kruskal–Wallis test. Categorical variables were expressed as numbers (percentages), and differences between groups were assessed using the chi-square (X²) test. Spearman correlation analysis was used to assess the strength and statistical significance of the correlation between GHR, FBG, and HDL with GS. Multivariate logistic regression was used to study the relationship between GHR and CAD, as well as severe CAD. The value of GHR in predicting CAD and severe CAD was assessed using the area under the curve (AUC) of the receiver operating characteristic (ROC) curve. At the same time, sensitivity and specificity could also be calculated. All results were considered statistically significant when the two-sided P value was <0.05.
Result
Baseline Patient Characteristics
Table 1 showed the baseline data for 1313 patients. Compared with the non-CAD group, the CAD patient group had significantly higher proportions of hypertension, type 2 diabetes, and smoking (P < 0.01), and a lower proportion of females. Additionally, patients in the CAD group were older, had elevated serum creatinine levels, poorer FBG control, and lower HDL-C levels (P < 0.01). The median GHR level was also higher in the CAD group (4.871 vs 5.980, P = 0.000). There were no differences in LDL-C levels or CAD family history between the two groups.
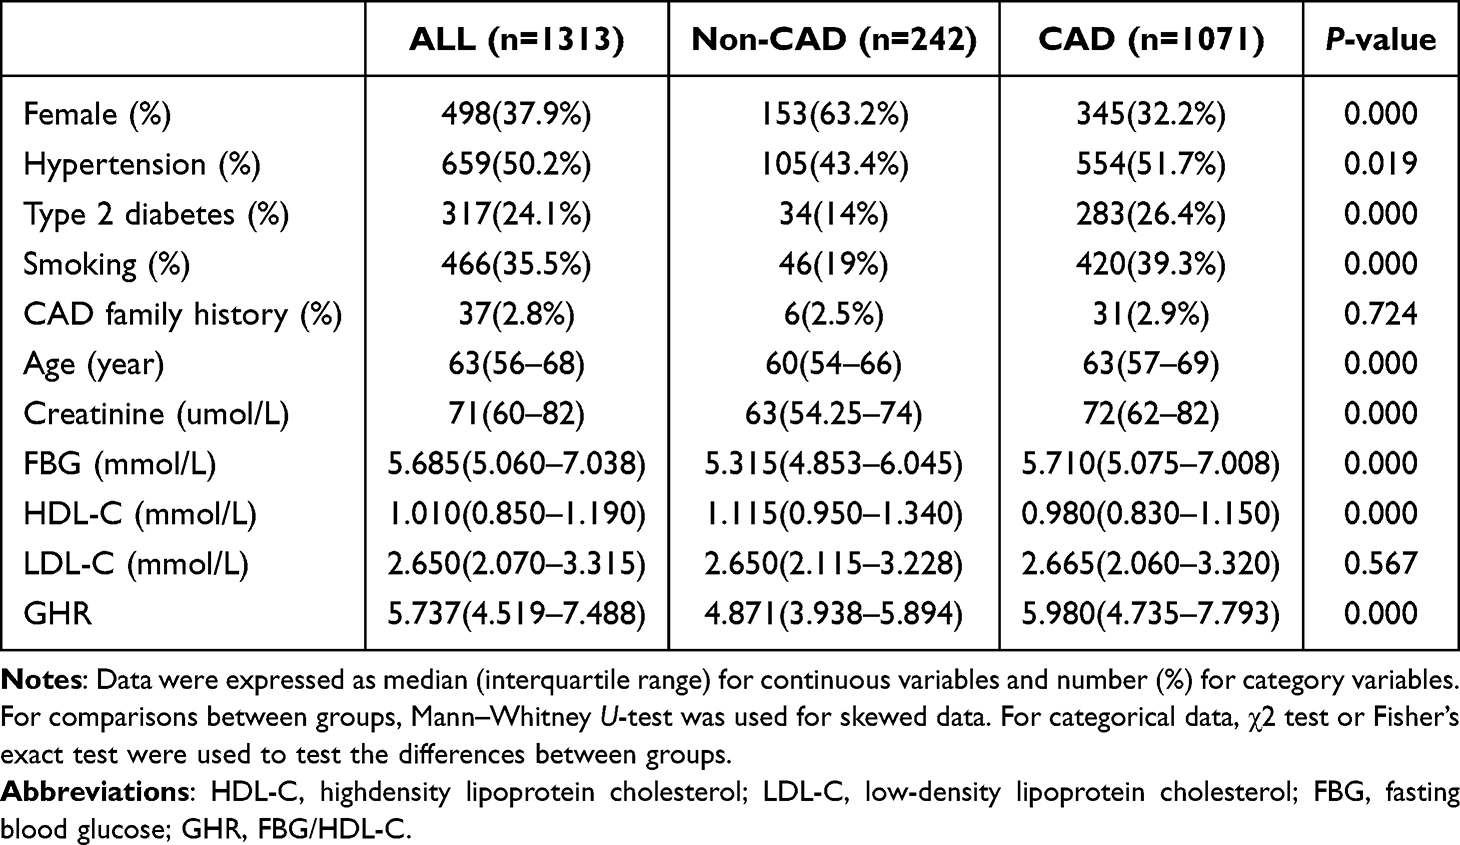 |
Table 1 Baseline Characteristics of the Study Population |
Table 2 summarized the baseline characteristics of the population stratified by GS tertiles. Trend P values were calculated for each GS tertile. Participants with the highest GS scores (tertile 3) had higher FBG, creatinine, and GHR levels but lower HDL-C levels compared to those with the lowest GS scores (tertile 1). In comparisons of categorical variables, participants with the highest GS scores (tertile 3) had a lower proportion of females but a higher prevalence of type 2 diabetes (all trend P < 0.05).
 |
Table 2 Baseline Characteristics of the Participants Stratified by Tertiles of GS |
GHR is Associated with CAD and Severe CAD
Table 3 showed that in the unadjusted model (Model 1), GHR was positively associated with CAD (odds ratios [OR] = 1.260, 95% CI [Confidence Interval] 1.169–1.357) and severe CAD (OR = 1.097, 95% CI 1.051–1.145). After adjusting for gender, hypertension, type 2 diabetes, smoking, and age characteristics (Model 2), and considering LDL-C and creatinine levels (Model 3), these significant associations remained (P = 0.000).
 |
Table 3 Association of GHR Levels with CAD and Severe CAD |
After analyzing the standard deviation (SD), Model 1 showed that for every 1 SD increase in GHR levels, the risk of CAD increased by 2.135 times (95% CI 1.671–2.728), and the risk of severe CAD increased by 1.357 times (95% CI 1.179–1.562), both of which were significantly associated (P = 0.000). In Model 2, the adjusted OR for CAD and severe CAD were 1.612 (95% CI 1.238–2.100) and 1.207 (95% CI 1.03–1.416), respectively, and in Model 3, they were 1.595 (1.227–2.075) and 1.199 (1.022–1.408), respectively (P < 0.05 for both).
Relationship Between GHR and the Severity of Coronary Artery Disease
As shown in Figure 2A, GHR increases with the number of coronary artery lesions. The median GHR values for the single-vessel, two-vessel, and multivessel lesion groups were 5.595 (4.418–6.975), 5.990 (4.880–7.980), and 6.430 (4.950–8.280), respectively. There was a significant difference in GHR between single-vessel and three-vessel lesions (P < 0.0001), and the GHR for single-vessel lesions was also lower than that for two-vessel lesions (P = 0.007).
 |
Figure 2 Relationship between GHR and the severity of coronary vascular lesions. (A) Relationship between GHR and the number of coronary artery lesions. (B–D) Correction between GHR, FBG, HDL-C, and GS. Abbreviations: HDL-C, highdensity lipoprotein cholesterol; FBG, fasting blood glucose; GHR, FBG/HDL-C; GS, Gensini score. |
Spearman correlation analysis showed a weak linear correlation between GHR and GS (r = 0.166, P = 0.000). The scatter plot is shown in Figure 2B. FBG (r = 0.156, P = 0.000) and HDL-C (r = −0.119, P = 0.000) also showed weak correlations with the GS, but the correlation coefficients were lower (Figure 2C and D).
Predictive Value of GHR for the CAD and Severity of CAD
Figure 3 and Table 4 showed the area under the ROC curve for each model’s prediction of CAD occurrence. Model 1 was the curve for GHR alone predicting CAD. The optimal cutoff value for GHR predicting CAD was 5.392, with a sensitivity of 62.9% and specificity of 66.4% (AUC: 0.672, 95% CI 0.634–0.711, P = 0.000). After adjusting for gender, hypertension, type 2 diabetes, smoking, and age characteristics (Model 2), and considering LDL-C and creatinine levels (Model 3), the AUC values improved. The sensitivity of Model 2 was 73.4%, and the specificity was 65.1% (AUC: 0.740, 95% CI 0.704–0.777, P = 0.000). Model 3 had a sensitivity of 72.7% and specificity of 65.5% (AUC: 0.744, 95% CI 0.707–0.780, P = 0.000).
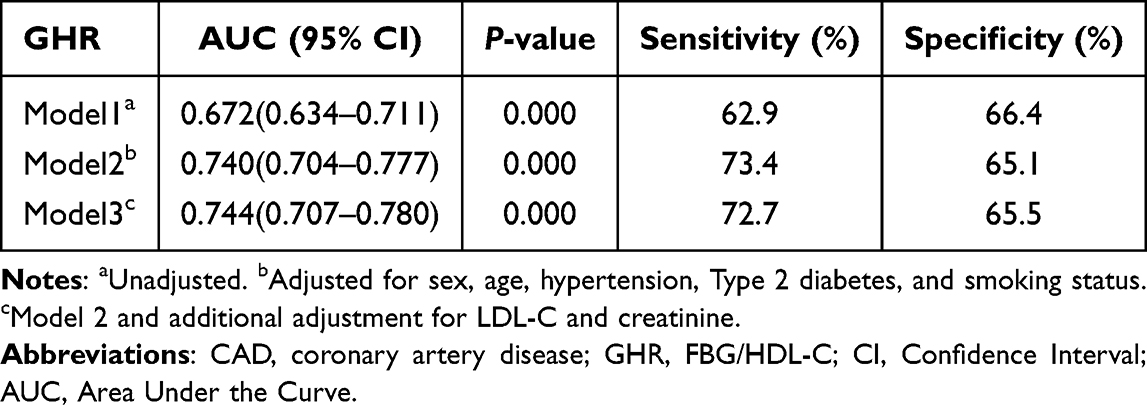 |
Table 4 Diagnostic Value of GHR Levels for CAD |
 |
Figure 3 Receiver operating characteristic curves for GHR predicting CAD. Model 1, Unadjusted. Model 2, Adjusted for sex, age, hypertension, Type 2 diabetes, and smoking status. Model 3, Model 2 and additional adjustment for LDL-C and creatinine. Abbreviations: CAD, coronary artery disease; GHR, FBG/HDL-C. |
Figure 4 and Table 5 showed the AUC for severe CAD (GS > 66) predicted by GHR alone (model 1), model 2, and model 3. The optimal cutoff value for GHR in predicting severe CAD is 5.988, with a sensitivity of 62.3% and specificity of 55.3% (AUC: 0.591, 95% CI 0.549–0.633, P = 0.000). After adjusting for gender, hypertension, diabetes, smoking, and age characteristics (Model 2), and considering LDL-C and creatinine levels (Model 3), Model 2 had a sensitivity of 60.7% and specificity of 60.8% (AUC: 0.627, 95% CI 0.585–0.668, P = 0.000). Model 3 had a sensitivity of 69.8% and specificity of 50.7% (AUC: 0.630, 95% CI 0.589–0.671, P = 0.000).
 |
Table 5 Diagnostic Value of GHR Levels for Severe CAD |
 |
Figure 4 Receiver operating characteristic curves for GHR predicting severe CAD. Model 1, Unadjusted. Model 2, Adjusted for sex, age, hypertension, Type 2 diabetes, and smoking status. Model 3, Model 2 and additional adjustment for LDL-C and creatinine. Abbreviations: CAD, coronary artery disease; GHR, FBG/HDL-C. |
Discussion
This study indicates that the level of the composite biomarker GHR is correlated with the severity of coronary artery lesions, thereby demonstrating significant practical value in predicting the occurrence and severity of CAD. After adjusting for potential confounding factors, GHR is an independent risk factor for CAD and severe CAD. Additionally, GHR combined with other indicators has better diagnostic value for CAD and severe CAD.
The pathological basis of CAD is coronary artery atherosclerosis, and the development of atherosclerosis is the primary pathophysiological characteristic of CAD. Existing research has shown that disorders in glucose metabolism and lipid metabolism are closely associated with atherosclerosis.24,25
Glucose itself may contribute to atherosclerosis by increasing oxidative stress, vascular inflammation, non-enzymatic glycation of low-density lipoproteins, other apolipoproteins, and coagulation factors, as well as promoting the formation of advanced glycation end products in the vascular wall and matrix.19,25 A metabolomics study on atherosclerosis found that glucose metabolism pathways are associated with vascular inflammation, thereby promoting the pathological process of atherosclerosis.26 Another study, however, indicated that stable control of fasting blood glucose (FBG) is not only beneficial for the long-term stability of the cardiovascular system, but also a potential strategy for managing CAD through glucose control.27
In this study, we found that the median FBG level in the CAD group was 5.710, which was higher than that in the non-CAD group (5.315) (P = 0.000) (Table 1). Additionally, the FBG level in the high GS group was higher than that in the low GS group (5.890 vs 5.570, P = 0.000) (Table 2), and FBG was linearly positively correlated with GS (Figure 2C).
Dyslipidemia is another key pathogenic mechanism of atherosclerosis. Recent studies have also focused extensively on the relationship between lipid markers and CAD.28,29 LDL-C is the primary factor contributing to atherosclerosis, and its accumulation in the arterial intima is prone to various modifications, including oxidation. Macrophages or smooth muscle cells in the arterial media phagocytose LDL-C particles with altered structure, forming foam cells, which serve as the necrotic core of atherosclerotic plaques.24
HDL-C is a protective factor against atherosclerosis, and its reduced levels are considered a risk factor for atherosclerosis.30 HDL-C exerts its vascular protective effects through multiple mechanisms. First, high-density lipoprotein reduces lipid deposition in blood vessels by transporting cholesterol in the reverse direction.31 Second, HDL-C can also inhibit the expression of endothelial cell adhesion molecules, preventing monocytes from accumulating in the arterial wall and exerting anti-inflammatory effects.32 Third, HDL-C exerts its vascular protective function by inhibiting oxidative stress.31
In this study, we also found a negative correlation between HDL-C and GS (Figure 2D). The median HDL-C level in the CAD group was 0.980 (0.950–1.340), while that in the non-CAD group was 1.115 (0.830–1.150), with a statistically significant difference (P = 0.000) (Table 1). In the low, moderate, and high GS groups, the median (interquartile range) levels were 1.000 (0.850–1.200), 0.980 (0.830–1.135), and 0.940 (0.800–1.090), respectively, with statistically significant differences (P = 0.001) (Table 2).
FBG and HDL-C are both associated with coronary artery atherosclerosis. More importantly, the synergistic effects of lipid levels and FBG in the development of coronary artery atherosclerosis are increasingly attracting widespread attention. In a study of diabetic populations, researchers found that lipid abnormalities in diabetic patients are associated with carotid intima-media thickness, meaning that high FBG and lipid disorders synergistically promote the atherosclerotic process.33 Another interventional study found that restricting carbohydrate intake led to an increase in HDL-C. Notably, this diet did not alter LDL-C, suggesting that restricting sugar intake has a specific beneficial effect on HDL-C and that glucose can regulate lipid metabolism.34 Based on the above analysis, since the two factors that compose GHR are closely associated with the development of coronary atherosclerosis and exhibit an additive effect, this suggests that GHR is associated with coronary vascular lesions.
GHR has been demonstrated in previous studies to be a valuable clinical biomarker. Research has shown that GHD is a biomarker associated with short-term prognosis in patients with acute coronary syndrome (ACS). Elevated GHD levels are associated with an increased risk of major adverse cardiovascular events and cardiovascular death in ACS patients.35 A study investigating the factors influencing prognosis in patients with coronary artery disease found that GHR is an independent predictor of all-cause mortality following percutaneous coronary intervention in non-diabetic CAD patients.19 Another study exploring predictive biomarkers for abdominal aortic calcification (AAC) in hemodialysis patients found that GHR is an independent risk factor for AAC in dialysis patients.36
In addition to using GHR as a new biomarker for evaluating the prognosis of vascular diseases, numerous studies have also explored the potential relationship between GHR and other diseases. In distinguishing non-alcoholic fatty liver disease (NAFLD), GHR significantly outperforms fasting FBG or HDL-C alone.37 In another study examining the severity of NAFLD, researchers found that elevated GHR levels were independently associated with the severity of NAFLD.38 Additionally, GHR may be valuable in predicting outcomes for patients with infectious diseases. A study examining the relationship between lipid levels and mortality in COVID-19 patients found that GHR levels in these patients are a reliable predictor of mortality.39
In this study, we found that GHR was not only associated with GS (Figure 2B) but also correlated with the number of diseased vessels (Figure 2A). After adjusting for potential confounding factors, we found that GHR was an independent risk factor for CAD and severe CAD (Table 3). In predicting the occurrence of CAD and severe CAD, GHR not only had diagnostic value on its own but also further improved the AUC level when combined with other indicators (Figures 3 and 4, Tables 4 and 5).
This study also observed that, in addition to GHR, male gender, advanced age, hypertension, type 2 diabetes, smoking, and elevated blood creatinine levels were also closely associated with the onset of CAD (Table 1). These results are consistent with previous studies.20,21,40
This study still has some limitations. First, this study did not consider the differences between CAG and CCTA in the diagnosis of CAD. To ensure sufficient sample size, we did not perform subgroup analysis. Second, when conducting Spearman correlation analysis, we found that although the correlation between GHR and Gensini score (r = 0.166, P < 0.001) was higher than that between FBG (r = 0.156, P < 0.001) and high-density lipoprotein (r = −0.119, P < 0.001), it only showed a mild correlation. Additionally, during the analysis of CAD risk factors included in this study, we found that patients with a positive family history of coronary heart disease accounted for less than 5% in each subgroup, showing no statistically significant differences across different groups. This study also did not observe any correlation between LDL-C and vascular lesions. Furthermore, due to missing data, we were unable to analyze other lipid parameters. These limitations suggest that future studies should increase sample size and conduct subgroup analyses to validate the findings of this research.
Conclusion
GHR levels are associated with coronary artery disease. In clinical practice, GHR is an economical, convenient, and easily accessible biomarker that can assist clinicians in screening patients prior to CAG and CCTA examinations.
Data Sharing Statement
The dataset generated and analyzed during the current study is not publicly available due to patient privacy restrictions but are available from the corresponding author (Hui He, [email protected]) on reasonable request.
Acknowledgments
This work was supported by the Benxi City 2023 Key Research & Development Plan Guidance Plan Project of China (No. 2023ZDJH006), the Benxi City 2023 Science &Technology Innovation Project of China (No. BKYW2303) and the Benxi City 2023 Science &Technology Innovation Project of China (No. BKYW2301).
Disclosure
The authors declare that they have no conflicts of interest in this work.
References
1. Sun H, Liu H, Li J, Kou J, Yang C. Analysis of the clinical predictive value of the novel inflammatory indices SII, SIRI, MHR and NHR in patients with acute myocardial infarction and their extent of coronary artery disease. J Inflamm Res. 2024;17:7325–7338. doi:10.2147/jir.S479253
2. Pan X, Zhang X, Ban J, Yue L, Ren L, Chen S. Association of neutrophil to high-density lipoprotein cholesterol ratio with cardiac ultrasound parameters and cardiovascular risk: a cross-sectional study based on healthy populations. J Inflamm Res. 2023;16:1853–1865. doi:10.2147/jir.S406102
3. Mensah GA, Fuster V, Murray CJL, Roth GA. Global Burden of Cardiovascular Diseases and Risks, 1990-2022. J Am Coll Cardiol. 2023;82(25):2350–2473. doi:10.1016/j.jacc.2023.11.007
4. Thiene G, Frescura C, Padalino M, Basso C, Rizzo S. Coronary arteries: normal anatomy with historical notes and embryology of main stems. Front Cardiovasc Med. 2021;8:649855. doi:10.3389/fcvm.2021.649855
5. Nebelung H, Brauer T, Seppelt D, Hoffmann RT, Platzek I. Coronary computed tomography angiography (CCTA): effect of bolus-tracking ROI positioning on image quality. Eur Radiol. 2021;31(2):1110–1118. doi:10.1007/s00330-020-07131-x
6. Gao J, Lu J, Sha W, et al. Relationship between the neutrophil to high-density lipoprotein cholesterol ratio and severity of coronary artery disease in patients with stable coronary artery disease. Front Cardiovasc Med. 2022;9:1015398. doi:10.3389/fcvm.2022.1015398
7. Gensini GG. A more meaningful scoring system for determining the severity of coronary heart disease. Am J Cardiol. 1983;51(3):606. doi:10.1016/s0002-9149(83)80105-2
8. Saleh L, Juneman E, Movahed MR. The use of gadolinium in patients with contrast allergy or renal failure requiring coronary angiography, coronary intervention, or vascular procedure. Catheter Cardiovasc Interv. 2011;78(5):747–754. doi:10.1002/ccd.22907
9. Schmid AA, Bohm IB. Cross-reactivity and polyvalent reactivity in patients with iodinated contrast medium allergy: how to use the terms correctly. Int Arch Allergy Immunol. 2021;182(8):725–727. doi:10.1159/000514974
10. Cai G, Shi G, Xue S, Lu W. The atherogenic index of plasma is a strong and independent predictor for coronary artery disease in the Chinese Han population. Medicine. 2017;96(37):e8058. doi:10.1097/MD.0000000000008058
11. Rabiee Rad M, Ghasempour Dabaghi G, Darouei B, Amani-Beni R. The association of atherogenic index of plasma with cardiovascular outcomes in patients with coronary artery disease: a systematic review and meta-analysis. Cardiovasc Diabetol. 2024;23(1):119. doi:10.1186/s12933-024-02198-y
12. Su Y, Zhang X. Association of metabolic syndrome with adverse outcomes in patients with stable coronary artery disease: a meta-analysis. Horm Metab Res. 2023;55(2):96–102. doi:10.1055/a-1946-4823
13. Baydar O, Kilic A, Okcuoglu J, Apaydin Z, Can MM. The triglyceride-glucose index, a predictor of insulin resistance, is associated with subclinical atherosclerosis. Angiology. 2021;72(10):994–1000. doi:10.1177/00033197211007719
14. Stein R, Ferrari F, Scolari F. Genetics, dyslipidemia, and cardiovascular disease: new insights. Curr Cardiol Rep. 2019;21(8):68. doi:10.1007/s11886-019-1161-5
15. Li XT, Fang H, Li D, et al. Association of platelet to lymphocyte ratio with in-hospital major adverse cardiovascular events and the severity of coronary artery disease assessed by the Gensini score in patients with acute myocardial infarction. Chin Med J. 2020;133(4):415–423. doi:10.1097/cm9.0000000000000650
16. Celeng C, Takx RAP. Moving towards a uniform diagnosis of coronary artery disease on coronary CTA: coronary artery disease-reporting and data system 2.0. Neth Heart J. 2024;32(11):378–385. doi:10.1007/s12471-024-01903-6
17. Akboga MK, Canpolat U, Yayla C, et al. Association of platelet to lymphocyte ratio with inflammation and severity of coronary atherosclerosis in patients with stable coronary artery disease. Angiology. 2016;67(1):89–95. doi:10.1177/0003319715583186
18. Chen S, Zhang S, Luan H, Zeng X, Li Y, Yuan H. Correlation between extended leukocyte differential count and coronary artery disease. J Cardiovasc Pharmacol. 2018;71(6):359–366. doi:10.1097/fjc.0000000000000582
19. Guo QQ, Zheng YY, Tang JN, et al. Fasting blood glucose to HDL-C ratio as a novel predictor of clinical outcomes in non-diabetic patients after PCI. Biosci Rep. 2020;40(12). doi:10.1042/BSR20202797
20. Salim A, Tai ES, Tan VY, et al. C-reactive protein and serum creatinine, but not haemoglobin A1c, are independent predictors of coronary heart disease risk in non-diabetic Chinese. Eur J Prev Cardiol. 2016;23(12):1339–1349. doi:10.1177/2047487315626547
21. Lima Dos Santos CC, Matharoo AS, Pinzon Cueva E, et al. The influence of sex, age, and race on coronary artery disease: a narrative review. Cureus. 2023;15(10):e47799. doi:10.7759/cureus.47799
22. Williams B, Mancia G, Spiering W, et al. 2018 ESC/ESH guidelines for the management of arterial hypertension. Eur Heart J. 2018;39(33):3021–3104. doi:10.1093/eurheartj/ehy339
23. American Diabetes A. 2. classification and diagnosis of diabetes: standards of medical care in diabetes-2021. Diabetes Care. 2021;44(Suppl 1):S15–S33. doi:10.2337/dc21-S002
24. Porsch F, Mallat Z, Binder CJ. Humoral immunity in atherosclerosis and myocardial infarction: from B cells to antibodies. Cardiovasc Res. 2021;117(13):2544–2562. doi:10.1093/cvr/cvab285
25. Ford ES. Body mass index, diabetes, and C-reactive protein among U.S. adults. Diabetes Care. 1999;22(12):1971–1977. doi:10.2337/diacare.22.12.1971
26. Chen R, Chen T, Zhou Z, et al. Integrated pyroptosis measurement and metabolomics to elucidate the effect and mechanism of tangzhiqing on atherosclerosis. Front Physiol. 2022;13:937737. doi:10.3389/fphys.2022.937737
27. Cardoso CRL, Leite NC, Moram CBM, Salles GF. Long-term visit-to-visit glycemic variability as predictor of micro- and macrovascular complications in patients with type 2 diabetes: the Rio de Janeiro type 2 diabetes cohort study. Cardiovasc Diabetol. 2018;17(1):33. doi:10.1186/s12933-018-0677-0
28. Caselli C, De Caterina R, Smit JM, et al. Triglycerides and low HDL cholesterol predict coronary heart disease risk in patients with stable angina. Sci Rep. 2021;11(1):20714. doi:10.1038/s41598-021-00020-3
29. Arnold N, Blaum C, Goßling A, et al. Impact of Lipoprotein(a) level on low-density lipoprotein cholesterol- or apolipoprotein B-related risk of coronary heart disease. J Am Coll Cardiol. 2024;84(2):165–177. doi:10.1016/j.jacc.2024.04.050
30. Ginsberg HN, Packard CJ, Chapman MJ, et al. Triglyceride-rich lipoproteins and their remnants: metabolic insights, role in atherosclerotic cardiovascular disease, and emerging therapeutic strategies-a consensus statement from the European Atherosclerosis Society. Eur Heart J. 2021;42(47):4791–4806. doi:10.1093/eurheartj/ehab551
31. Soria-Florido MT, Schröder H, Grau M, Fitó M, Lassale C. High density lipoprotein functionality and cardiovascular events and mortality: a systematic review and meta-analysis. Atherosclerosis. 2020;302:36–42. doi:10.1016/j.atherosclerosis.2020.04.015
32. Kou T, Luo H, Yin L. Relationship between neutrophils to HDL-C ratio and severity of coronary stenosis. BMC Cardiovasc Disord. 2021;21(1):127. doi:10.1186/s12872-020-01771-z
33. Guo HJ, Li CC, Bian XY, Hao Q. Correlation study on the relationship between dyslipidemia and carotid intima-media thickness in patients with diabetes mellitus. Pak J Med Sci. 2023;39(3):875–879. doi:10.12669/pjms.39.3.6866
34. Waldman HS, Smith JW, Lamberth J, et al. A 28-day carbohydrate-restricted diet improves markers of cardiovascular disease in professional firefighters. J Strength Cond Res. 2020;34(10):2785–2792. doi:10.1519/JSC.0000000000003749
35. Deng S, Wang Z, Zhang Y, Xin Y, Zeng C, Hu X. Association of fasting blood glucose to high-density lipoprotein cholesterol ratio with short-term outcomes in patients with acute coronary syndrome. Lipids Health Dis. 2022;21(1):17. doi:10.1186/s12944-021-01618-2
36. Chen S, Cao Q, Bu S, et al. The value of triglyceride glucose-body mass index, fasting blood glucose to HDL-C ratio, and platelet to HDL-C ratio in predicting abdominal aortic calcification in maintenance hemodialysis patients. Ren Fail. 2025;47(1):2505699. doi:10.1080/0886022X.2025.2505699
37. Yu C, He S, Peng N, et al. The fasting plasma glucose to high-density lipoprotein cholesterol ratio: a novel index for identifying NAFLD. BMC Gastroenterol. 2025;25(1):236. doi:10.1186/s12876-025-03831-0
38. Jin X, Xu J, Weng X. Correlation between ratio of fasting blood glucose to high density lipoprotein cholesterol in serum and non-alcoholic fatty liver disease in American adults: a population based analysis. Front Med. 2024;11:1428593. doi:10.3389/fmed.2024.1428593
39. Mohammadshahi J, Ghobadi H, Matinfar G, Boskabady MH, Aslani MR. Role of lipid profile and its relative ratios (Cholesterol/HDL-C, triglyceride/HDL-C, LDL-C/HDL-C, WBC/HDL-C, and FBG/HDL-C) on admission predicts in-hospital mortality COVID-19. J Lipids. 2023;2023:6329873. doi:10.1155/2023/6329873
40. Zhang R, Shi S, Chen W, et al. Independent effects of the triglyceride-glucose index on all-cause mortality in critically ill patients with coronary heart disease: analysis of the MIMIC-III database. Cardiovasc Diabetol. 2023;22(1):10. doi:10.1186/s12933-023-01737-3
 © 2025 The Author(s). This work is published and licensed by Dove Medical Press Limited. The
full terms of this license are available at https://www.dovepress.com/terms
and incorporate the Creative Commons Attribution
- Non Commercial (unported, 4.0) License.
By accessing the work you hereby accept the Terms. Non-commercial uses of the work are permitted
without any further permission from Dove Medical Press Limited, provided the work is properly
attributed. For permission for commercial use of this work, please see paragraphs 4.2 and 5 of our Terms.
© 2025 The Author(s). This work is published and licensed by Dove Medical Press Limited. The
full terms of this license are available at https://www.dovepress.com/terms
and incorporate the Creative Commons Attribution
- Non Commercial (unported, 4.0) License.
By accessing the work you hereby accept the Terms. Non-commercial uses of the work are permitted
without any further permission from Dove Medical Press Limited, provided the work is properly
attributed. For permission for commercial use of this work, please see paragraphs 4.2 and 5 of our Terms.
Recommended articles
Managing Cardiovascular Risk in Systemic Lupus Erythematosus: Considerations for the Clinician
Semalulu T, Tago A, Zhao K, Tselios K
ImmunoTargets and Therapy 2023, 12:175-186
Published Date: 8 December 2023
Correlations Between Acute Coronary Syndrome and Novel Inflammatory Markers (Systemic Immune-Inflammation Index, Systemic Inflammation Response Index, and Aggregate Index of Systemic Inflammation) in Patients with and without Diabetes or Prediabetes
Tuzimek A, Dziedzic EA, Beck J, Kochman W
Journal of Inflammation Research 2024, 17:2623-2632
Published Date: 29 April 2024
Prevalence and Clinically Related Factors of Hypertriglyceridemia in Patients with Bipolar Disorder in Anhui Province, China
Li J, Lei W, Wang Y, Wu Q
Diabetes, Metabolic Syndrome and Obesity 2025, 18:2695-2705
Published Date: 7 August 2025
Combined Prognostic Value of Nutritional and Inflammatory Indices for Predicting Functionally Significant Coronary Stenosis Verified by FFR: The PNI–SII–GINI Study
Aydın MZ, Arin CB, Teber MK, Kuzu Z, Gök M, Abdi IA
Journal of Inflammation Research 2026, 19:585010
Published Date: 1 May 2026