Back to Journals » Journal of Inflammation Research » Volume 18
Prognostic Value of Inflammatory and Nutritional Markers in Advanced Esophageal Squamous Cell Carcinoma Treated with Immunotherapy: A Retrospective Cohort Study
Authors Liu X, Ren S, Li X, Cheng X, Fang Y, Zhang S, Zhao Y, Ma W, Zhang T
Received 17 June 2025
Accepted for publication 14 October 2025
Published 4 November 2025 Volume 2025:18 Pages 15393—15408
DOI https://doi.org/10.2147/JIR.S547500
Checked for plagiarism Yes
Review by Single anonymous peer review
Peer reviewer comments 2
Editor who approved publication: Dr Felix Marsh-Wakefield
Xiaodan Liu,1,* Shengju Ren,1,* Xinyang Li,1 Xiang Cheng,1 Yujing Fang,1 Shuo Zhang,2 Yidi Zhao,2 Wang Ma,1 Tengfei Zhang1,3,4
1Department of Oncology, The First Affiliated Hospital of Zhengzhou University, Zhengzhou, Henan, People’s Republic of China; 2The First Clinical Medical School, Zhengzhou University, Zhengzhou, Henan, People’s Republic of China; 3Medical School, Huanghe Science and Technology University, Zhengzhou, Henan, People’s Republic of China; 4The First Affiliated Hospital of Henan University of Chinese Medicine, Zhengzhou, Henan, People’s Republic of China
*These authors contributed equally to this work
Correspondence: Tengfei Zhang, Department of Oncology, The First Affiliated Hospital of Zhengzhou University, Zhengzhou, Henan, 450052, People’s Republic of China, Email [email protected] Wang Ma, Department of Oncology, The First Affiliated Hospital of Zhengzhou University, Zhengzhou, Henan, 450052, People’s Republic of China, Email [email protected]
Purpose: This study aimed to evaluate the nutritional, immune, and inflammatory status of esophageal squamous cell carcinoma (ESCC) patients before immunotherapy using blood-based biomarkers, and to develop and validate competing-risk nomogram models to predict overall survival (OS) and progression-free survival (PFS).
Patients and Methods: This retrospective study enrolled 300 ESCC patients who received immunotherapy at the First Affiliated Hospital of Zhengzhou University between January 2021 and December 2023, and randomly assigned them to a primary cohort (210 cases) and a validation cohort (90 cases) at a 7:3 ratio. We screened prognostic factors using least absolute shrinkage and selection operator (LASSO) regression coupled with univariate and multivariate Cox regression analyses to construct a nomogram prediction model. Model validation was performed using the following approaches: (1) Calibration curves were employed to evaluate the agreement between predicted and observed outcomes; (2) Discrimination was assessed through the index of concordance (C-index), time-dependent receiver operating characteristic (ROC) curves, and time-dependent area under the curve (AUC); (3) Clinical utility and predictive accuracy were further assessed using net reclassification improvement (NRI), integrated discrimination improvement (IDI), and decision curve analysis (DCA). Furthermore, the performance of the proposed nomogram was systematically compared with the conventional tumor-node-metastasis (TNM) staging system and another published prediction model.
Results: Through comprehensive multivariate OS analysis conducted in the primary cohort, we established an innovative prognostic nomogram combining systemic immunoinflammatory index (SII) and prognostic nutritional index (PNI). Compared with TNM staging, our model demonstrated strong accuracy, discriminative ability, and clinical utility in the primary and validation cohorts.
Conclusion: This research confirms the prognostic value of SII and PNI in ESCC patients undergoing anti-PD-1 immunotherapy. Given their significant correlation with clinical outcomes, these biomarkers show potential for pretreatment risk assessment in immunotherapy candidates.
Keywords: systemic immunoinflammatory index, prognosis, nomogram, esophageal squamous cell carcinoma, immunotherapy
Introduction
Esophageal cancer (EC) is considered one of the malignant tumors characterized by high morbidity and aggressiveness worldwide, seriously threatening human health,1 of which approximately 90% of the pathological types are ESCC.2 China accounts for more than half of global EC cases. Given the insidious onset and lack of early specific symptoms, ESCC is frequently diagnosed at advanced or metastatic stages, leading to missed curative surgical resection in the majority of cases.3 Unfortunately, conventional systemic therapies, including chemotherapy, provide limited survival benefit, with 5-year overall survival rates remaining below 15%.4 Consequently, these limitations have prompted the emergence of immune checkpoint inhibitors (ICIs) targeting programmed cell death protein 1 (PD-1) and its ligand PD-L1, which have become promising treatment approaches.
Currently, a major variable impacting the prognosis of ESCC is the tumor‐node‐metastasis (TNM) stage, which is generally applied to evaluate patient survival.5 However, the TNM staging might not always be sufficient to capture the heterogeneity of patient outcomes, highlighting the need for additional prognostic indicators. Although biomarker detection has shown promise in refining prognosis, its widespread clinical use is often limited by cost and logistical challenges.6–8 Therefore, identifying simple, economical, and validated pre-treatment parameters to accurately estimate ESCC prognosis remains an important focus of ongoing research, with the ultimate goal of improving patient management and guiding therapeutic decisions.
Inflammation, as a crucial cancer feature driving tumorigenesis and development, is not only implicated in the initiation of tumorigenesis but also fosters its ongoing development.9 Since 1863, Rudolf Virchow et al first spotted the connection between inflammation and cancer, extensive research has confirmed that local immune responses and systemic inflammation are instrumental in tumorigenesis and progression. Epidemiological data indicate that infections contribute to approximately 2.2 million new cancer cases annually, representing 13% of the global cancer burden (excluding non-melanoma skin cancers), a finding that further corroborates the centrality of the inflammatory microenvironment in tumorigenesis.10 The systemic immunoinflammatory index (SII), which was initially proposed by Hu et al in 2014,11 has significant clinical value in the field of inflammation-related biomarker research. By integrating peripheral blood neutrophil, platelet, and lymphocyte counts, the SII provides a comprehensive assessment of systemic inflammatory burden and host immune status. This index has been proven to be a predictor of prognosis in patients with hepatocellular carcinoma, gastric cancer, and lung cancer.11–13 Remarkably, patients with terminal tumors are often experience a progressive deterioration of their nutritional status, with significant interactions between nutritional parameters and inflammatory indicators.14 In this context, Buzby et al15 proposed the prognostic nutritional index (PNI) in 1980 as a straightforward dietary measure based on serum albumin and lymphocyte levels. Several clinical studies have confirmed its significant correlation with survival outcomes in patients with diverse malignant tumors.16,17
Numerous recent studies have explored and established the correlation between tumor prognosis, immune response, inflammatory processes, and nutritional factors.18,19 For instance, SII,20,21 platelet-to-lymphocyte ratio (PLR), lymphocyte-to-monocyte ratio (LMR), neutrophil-to-lymphocyte ratio (NLR),22,23 and PNI24 are correlated with the prognosis of patients with EC. However, a singular blood biomarker fails to capture a patient’s overall nutritional, immune, and inflammatory status. Therefore, this study undertakes a thorough analysis of the prognostic role of SII and PNI levels in ESCC patients before receiving immunotherapy. Additionally, a nomogram model was established and validated to predict post-treatment individual survival, thus helping clinicians provide better individualized treatment regimens and follow-up strategies for patients with advanced ESCC.
Materials and Methods
Study Design and Participant Selection Criteria
This retrospective study included 300 patients with advanced or metastatic ESCC treated at the First Affiliated Hospital of Zhengzhou University between January 2021 and December 2023. The inclusion requirements were as follows: (1) age ≥ 18 years; (2) availability of comprehensive clinicopathological and pretreatment laboratory data; (3) Eastern Cooperative Oncology Group performance status (ECOG-PS) of 2 or less, with at least one measurable lesion at baseline as defined by Response Evaluation Criteria in Solid Tumors (RECIST) version 1.1; (4) completion of a minimum of two immunotherapy cycles; (5) receipt of anti-PD-1 therapy with or without other therapy, anti-PD-1 therapies included Sintilimab, Nivolumab, Penpulimab, Camrelizumab, Tislelizumab, Toripalimab, or Pembrolizumab, while chemotherapy regimens encompassed albumin-bound paclitaxel, cisplatin, paclitaxel, and carboplatin. The exclusion criteria included patients with second malignancies, systemic immune system diseases, severe comorbidities, connective tissue diseases, or psychiatric disorders that could impede treatment compliance.
Based on the specified inclusion and exclusion criteria, 300 patients were ultimately registered and randomly assigned to the primary cohort (210 cases) and the validation cohort (90 cases), including 220 males and 80 females. This study was approved by the Ethics Committee for Research and Clinical Trials of the First Affiliated Hospital of Zhengzhou University and conducted in accordance with the Declaration of Helsinki (Approval No. 2025-KY-0777-002). Informed consent was obtained in writing from the individual participants or their guardians.
Clinicopathologic Variables Collection and Follow-Up
The demographic and clinical characteristics data of all patients, including gender, age, smoking and drinking history, TNM stage, number of metastases, ECOG PS, and peripheral blood markers, were collected from hospital records. Within one week before immunotherapy, the levels of neutrophil count (NEUT), platelet count (PLT), lymphocyte count (LYC), monocyte count (MONO), hemoglobin (Hb), and albumin (ALB) were assessed. Additionally, we defined the inflammatory and nutritional markers, including SII, PNI, NLR, PLR, SIRI, LMR, and NMR, based on peripheral blood cell counts and albumin, as detailed in Figure 1B and C. Treatment response was assessed according to RECIST version 1.1 and iRECIST, with progressive disease (PD) confirmed by iRECIST to exclude pseudoprogression. Chemotherapy and immunotherapy were administered following standard clinical guidelines and drug labels. Minor dose modifications due to toxicity were allowed at the discretion of treating physicians; however, detailed individual adjustments were not consistently available owing to the retrospective nature of the study.
 |
Figure 1 Study overview and hematological indices characterization. (A) Flowchart of patient selection and study design. (B) Summary of the calculation methods for SII, PNI, and other hematological indices. (C) Definitions of the integrated hematological indices used in the analysis. |
OS, defined as the time from patient randomization into groups until the end of the study or death from any cause, represented the primary predictive outcome of this investigation. The definition of PFS was the time from patient randomization to disease progression or death from any cause. Patients were monitored after discharge from the hospital via telephone or outpatient clinic visits. During immunotherapy, assessments were performed before each cycle, with comprehensive evaluations every 6–8 weeks using chest CT. After treatment completion, follow-up occurred every 3 months in the first year, every 4–6 months in the second year, and every 6 months from the third to fifth year, up to five years or until the cutoff date in April 2025.
Research Process
The patient cohort from the First Affiliated Hospital of Zhengzhou University was used to construct nomogram models that incorporated TNM stage, SII, and PNI, and internal validation was performed on this cohort. The optimal thresholds of NLR, PLR, SII, PNI, SIRI, NMR, and LMR assays in predicting OS were determined using receiver operating characteristic (ROC) curves and the maximum Youden index (Youden’s index = sensitivity + specificity - 1), and the patients were classified into high- and low-level groups based on each cutoff value. All patients were randomized into primary and validation cohorts at a ratio of 7:3. The distribution of variables between the two cohorts was compared using the chi-square (χ²) test.
We performed univariate Cox regression analysis of clinicopathologic variables in the primary cohort. Variables with p-values <0.05, along with features selected by Least absolute shrinkage and selection operator (LASSO) regression, were incorporated into multivariate Cox regression analyses, and independent prognostic indicators of OS were identified using the forward stepwise method. The identified indicators were subsequently utilized to construct the nomogram model.
Subsequently, internal validation of the model was performed. Time-dependent ROC curves and time-dependent AUC were used to evaluate discriminative ability. The predictive performance of the model was considered poor, fair, acceptable and good if the ROC and AUC values were 0.500–0.600, 0.600–0.700, 0.700–0.800, or >0.800, respectively. Calibration ability was assessed using calibration curves (500 bootstrap resamplings), and the predictive ability of the nomogram for 1-, 2-, and 3-year OS and PFS was compared with actual OS and PFS using the 45-degree line as the reference for the optimal model. Concurrently, decision curve analysis (DCA) was employed to assess its clinical utility at different time intervals, and the integrated discrimination improvement (IDI) and net reclassification improvement (NRI) paired nomogram were compared with TNM staging and another predictive model, which further demonstrated the superiority of our model in terms of clinical benefits. Furthermore, we also used restricted cubic spline (RCS) to flexibly model the nonlinear relationships between SII, PNI, and HRs of OS and PFS.
In completion, a risk plot was utilized to illustrate the variation in distribution of study indicators, survival durations, and population proportions between high-risk and low-risk groups based on ROC-derived cutoff values. Survival curves were generated using the Kaplan-Meier method, and the Log rank test was employed to evaluate OS and PFS in the different groups.
Statistical Analysis
Categorical variables were expressed using distributions of numbers and percentages, with intergroup comparisons performed using chi-square (χ²) tests. Optimal threshold values for hematologic indicators were identified using the pROC package of R (version 4.3.2), and the hematologic markers were stratified into high- and low-level groups based on these thresholds. Univariate and multivariate Cox regression analyses, as well as LASSO regression, baseline table, nomogram, calibration curve, DCA, time-dependent ROC, time-dependent AUC, RCS, KM plots, and risk plots, were conducted or constructed utilizing R packages including “glmnet”, “tableone”, “survival”, “rms”, “timeROC”, “dcurves”, “ggrisk”, and “survminer”. DCA was performed using the “dcurves” package without bootstrapping or confidence interval estimation, consistent with the standard implementation. The variance inflation factor (VIF) and tolerance were used to identify collinear independent variables. Hazard ratios (HRs) and 95% confidence intervals (CIs) were employed to quantify the correlation between predictors and survival, with P<0.05 indicating statistical significance at α = 0.05.
Results
Comparative Analysis of Cohort Characteristics and Determination of Optimal Biomarker Thresholds
The study design is shown in Figure 1A, and 300 patients with advanced ESCC were ultimately enrolled based on predefined inclusion criteria. The included dataset was randomly partitioned into a primary cohort (n=210) and a validation cohort (n=90) at a 7:3 ratio. Baseline clinical and pathological features of both cohorts are summarized in Table 1, with no statistically significant differences between groups (P > 0.05) and most standardized mean differences (SMDs) less than 0.2, indicating comparable distributions between the two groups. The majority of patients were male and under 65 years of age; had no history of smoking or drinking; exhibited pathological stage IV; ECOG PS <2; and had number of metastatic <2.
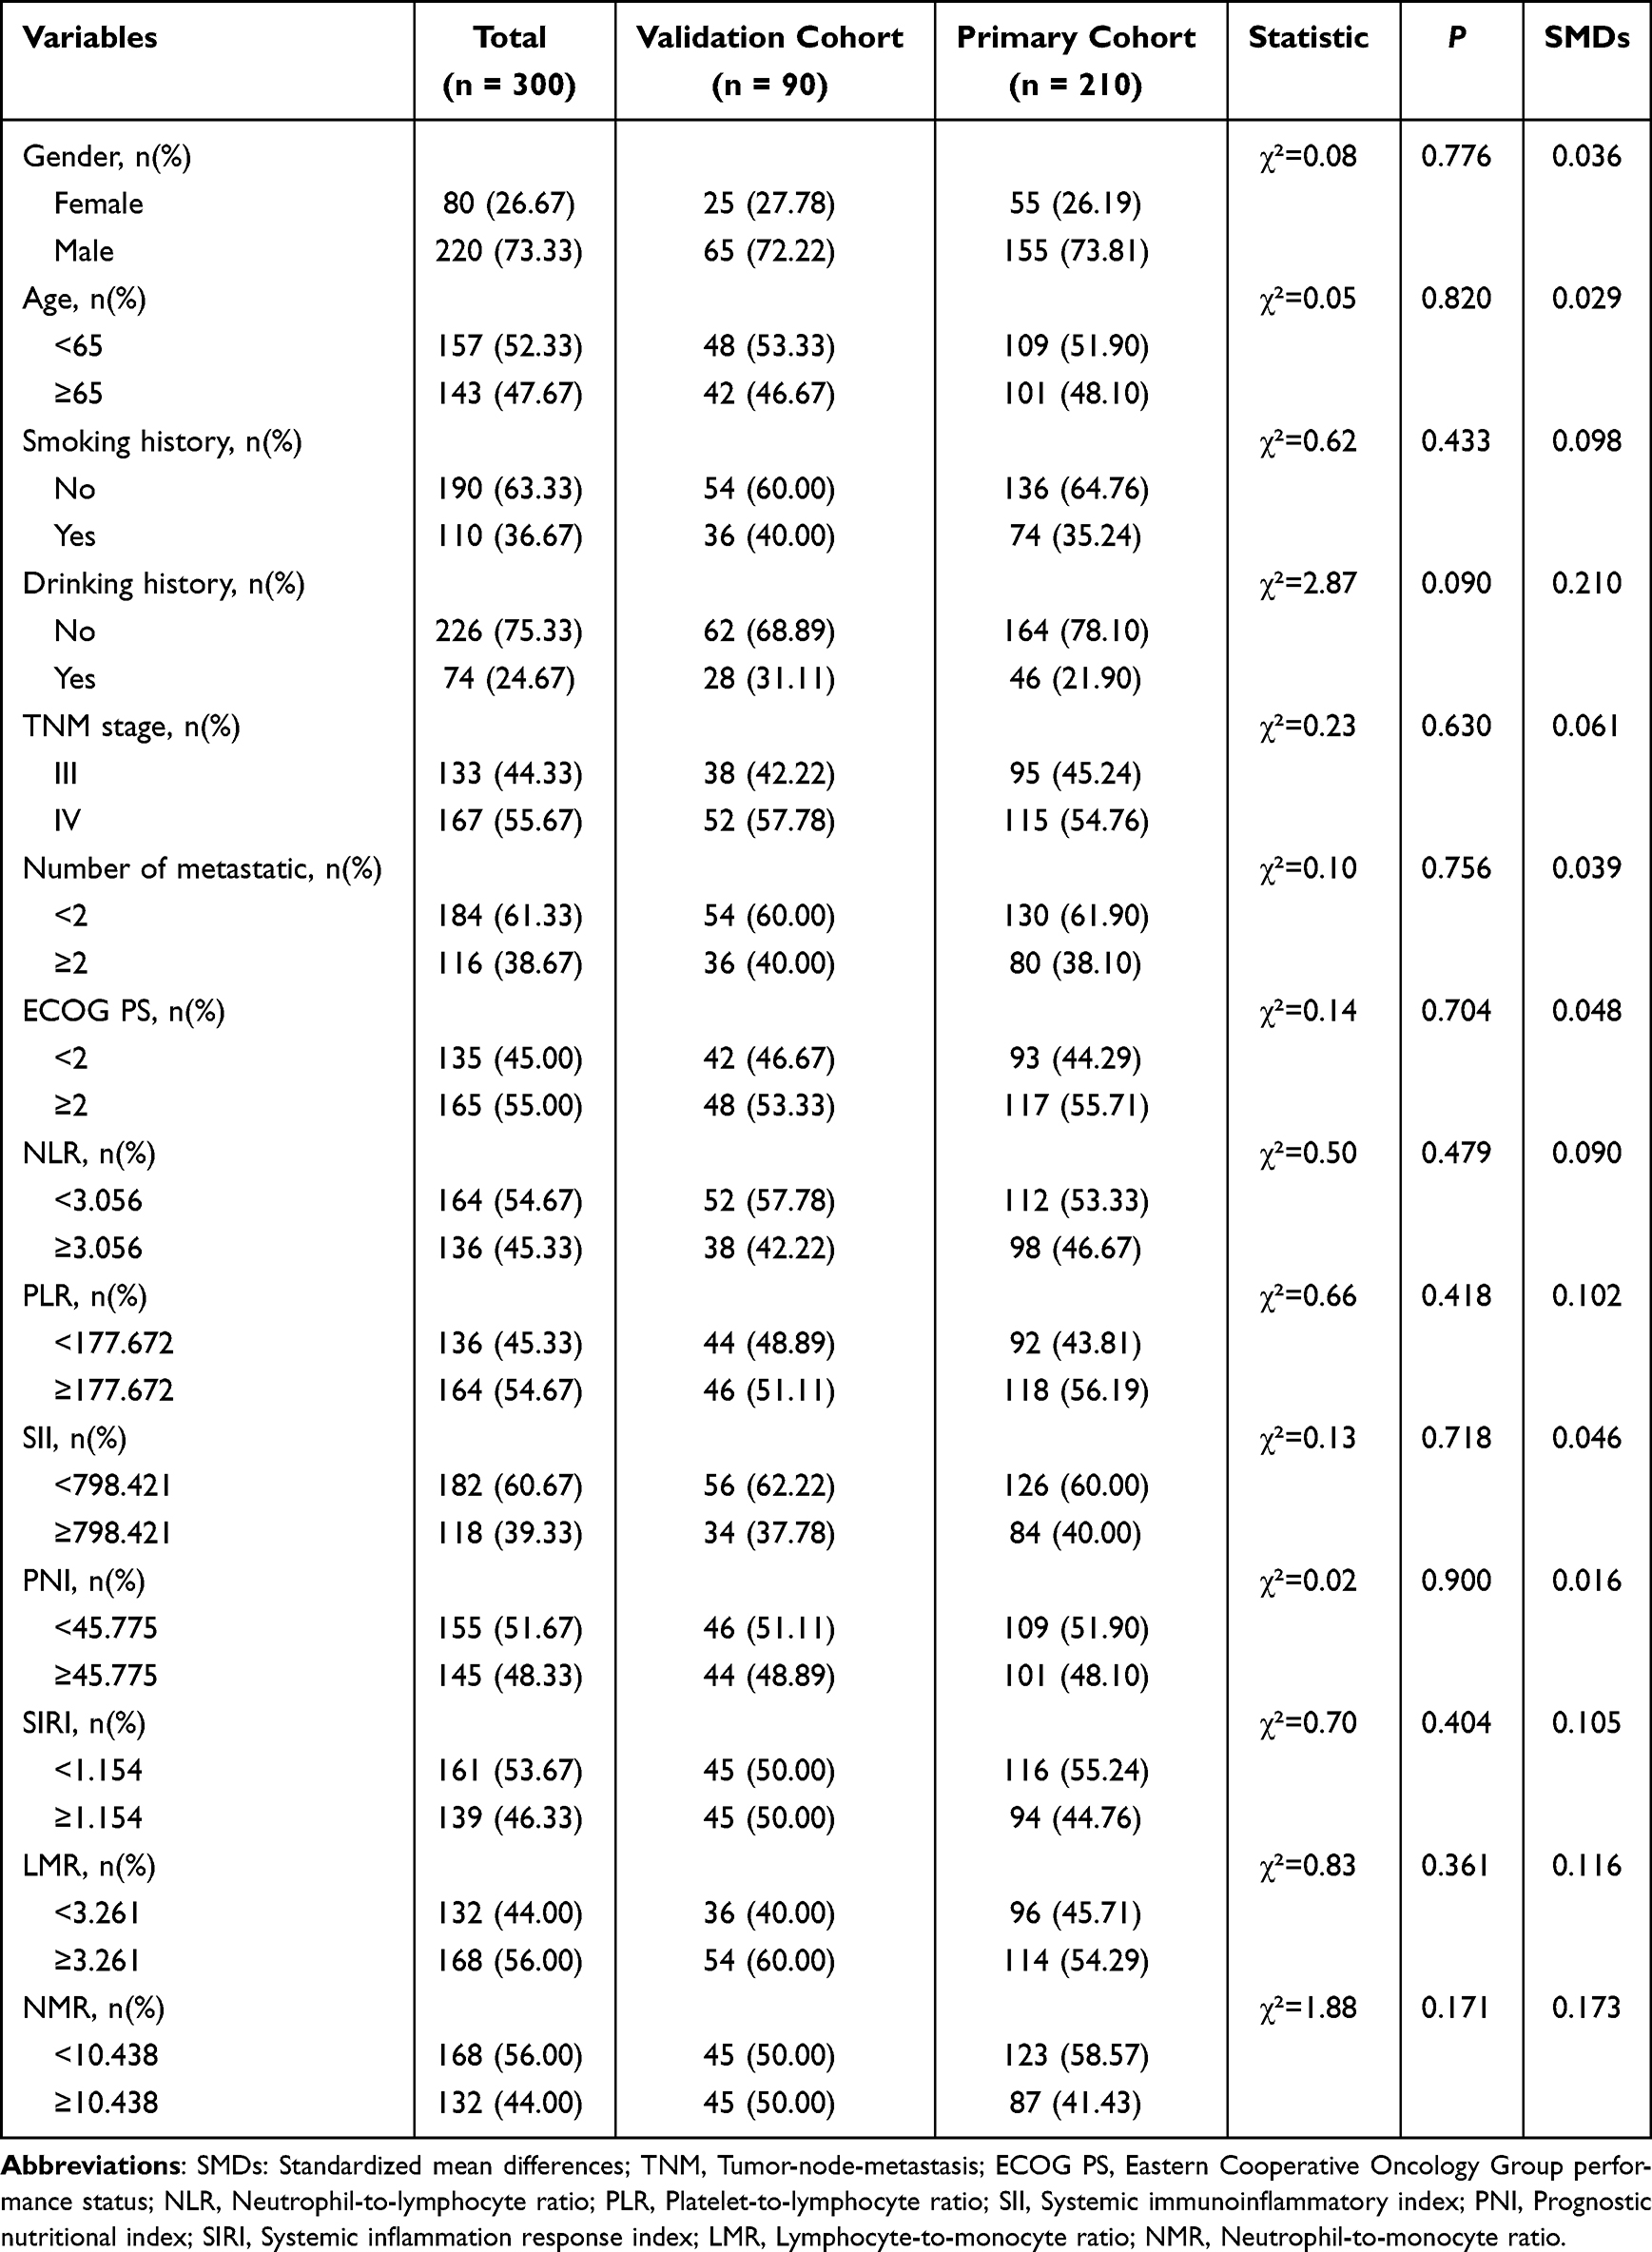 |
Table 1 The Clinicopathologic Characteristics of Advanced ESCC Patients in the Primary and Validation Cohorts (n=300) |
The optimal thresholds for predicting death with the highest sensitivity and specificity were analyzed using ROC curves. The optimal threshold values for NLR, PLR, SII, PNI, SIRI, LMR, and NMR were 3.056, 177.672, 798.421, 45.775, 1.154, 3.261, and 10.438, respectively. The corresponding sensitivity and specificity values for each biomarker are summarized in Table 2.
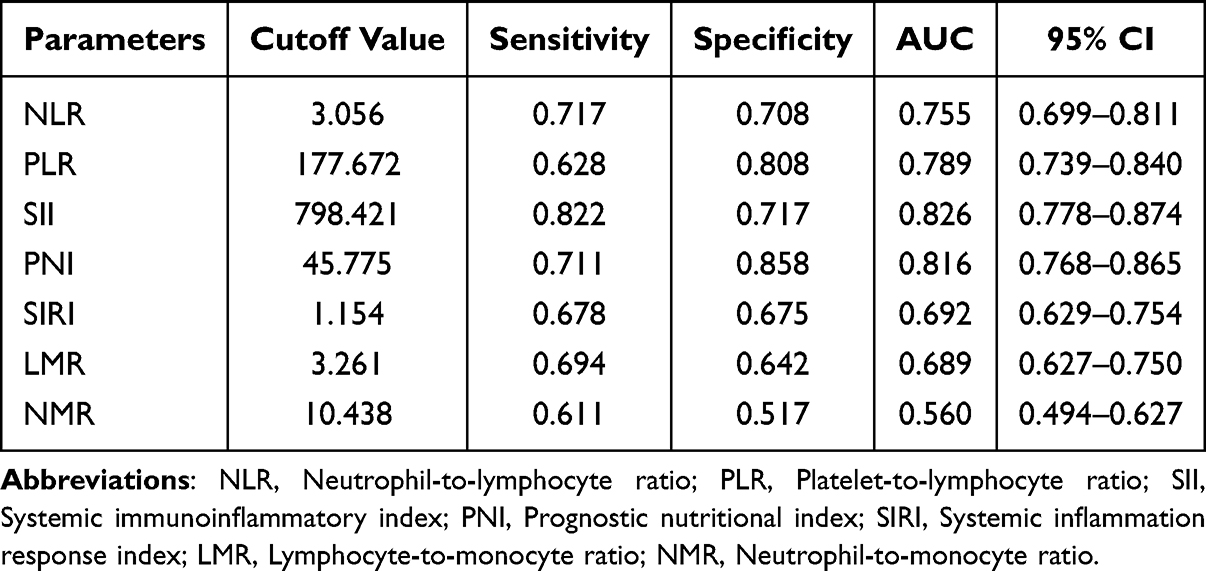 |
Table 2 Diagnostic Value of the Parameters |
Screening of Predictor Variables and Correlation Analysis
In a primary cohort of advanced ESCC patients, a Cox regression model was applied to evaluate factors correlated with OS. The univariate analysis, as demonstrated in Table 3, indicated that age, ECOG PS, TNM stage, NLR, PLR, SII, PNI, SIRI, and LMR were significant prognostic variables associated with OS. Figure 2A displays correlations among the seven immune, inflammatory, and nutritional biomarkers. The correlation heatmap indicated high correlations among NLR, SII, and SIRI (correlation coefficients >0.7). To evaluate whether multicollinearity could affect model stability, collinearity among all variables selected for LASSO regression was assessed (Supplementary Table S1). All VIFs were below 3, and tolerances were above 0.35, indicating negligible multicollinearity.
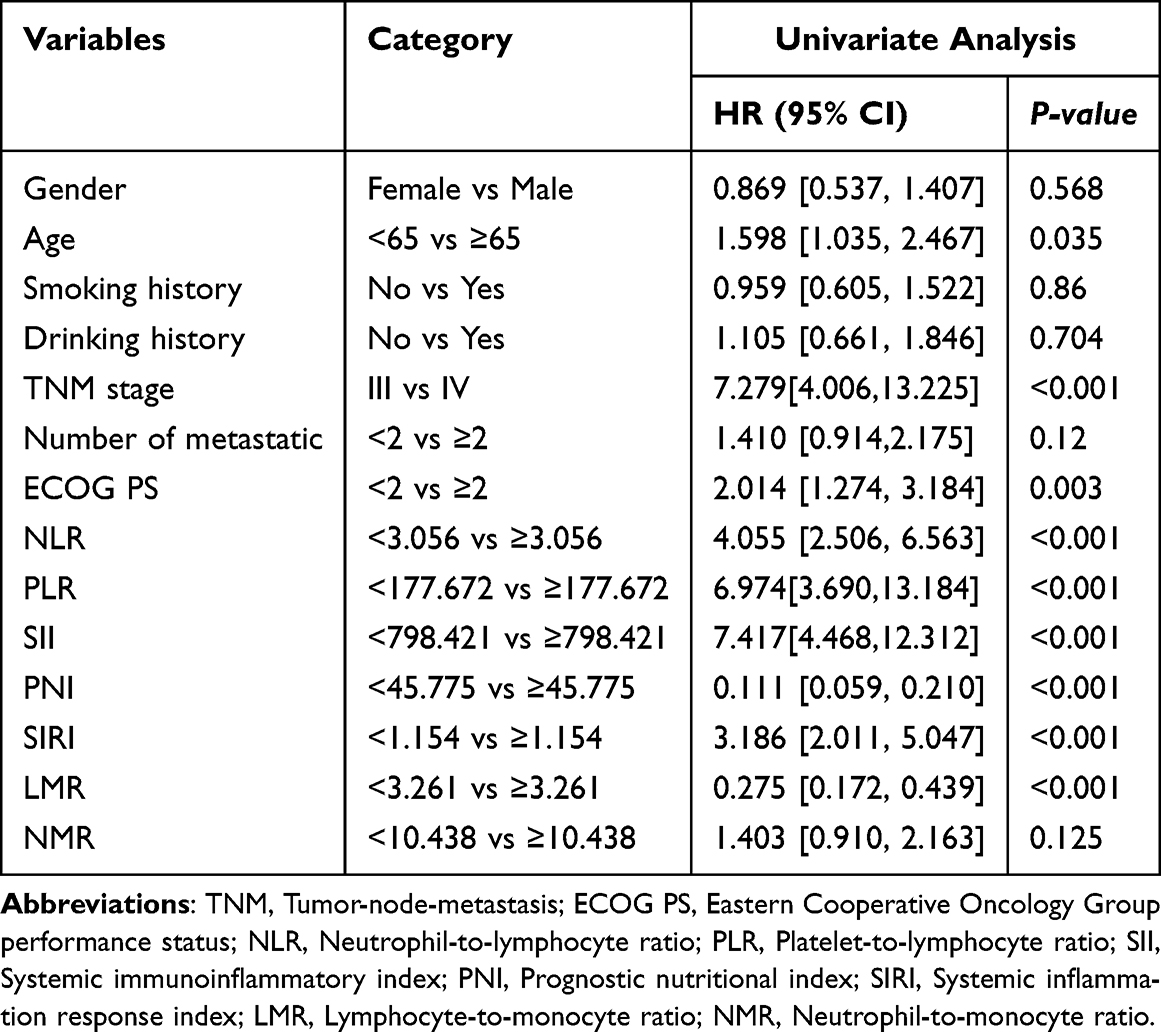 |
Table 3 Univariate Cox Regression Analyses on Variables for the Prediction of OS in ESCC Patients |
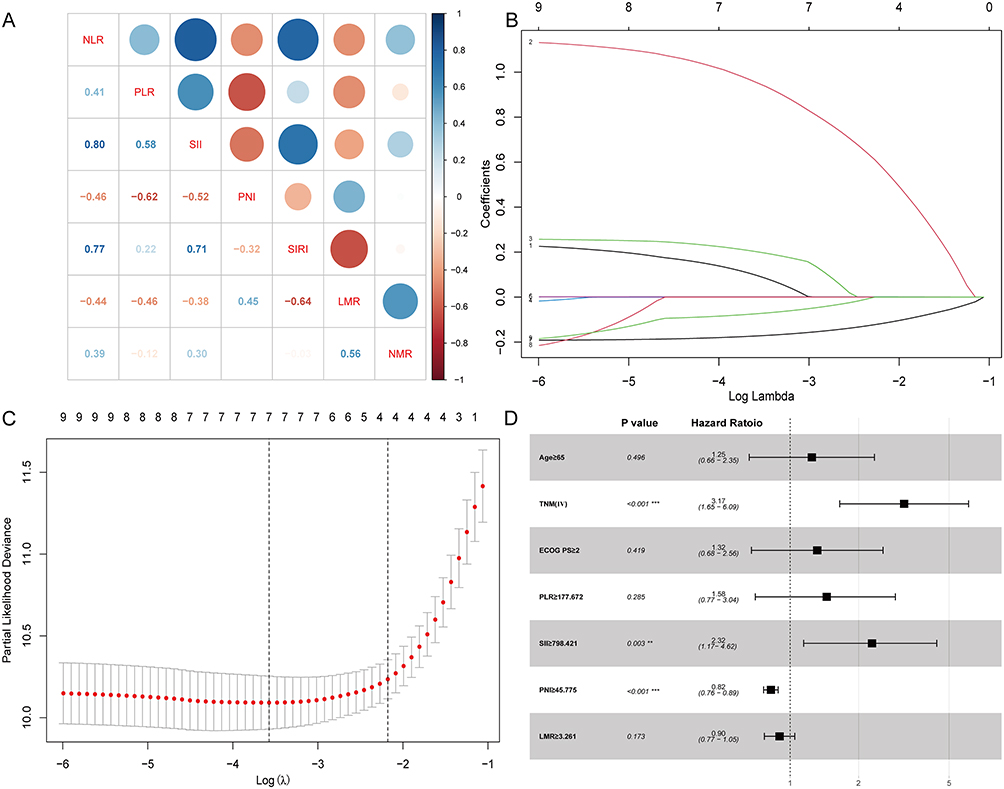 |
Figure 2 Factor selection using the LASSO Cox regression model. (A) The correlation heatmap of continuous variables. (B) Coefficient profiles of nine candidate variables generated by the LASSO regression model, showing variable selection through regularization. (C) Determination of the optimal lambda value via 10-fold cross-validation, based on the minimum partial likelihood deviance. Red dots indicate the deviance values; grey curves denote standard errors (SE); vertical dashed lines represent the optimal and 1-standard-error (1-SE) lambda thresholds. (D) Multivariate Cox regression analysis of OS in ESCC patients from the primary cohort, incorporating SII and PNI. **, ***indicate statistical significance with p < 0.01, and p < 0.001, respectively. |
Subsequently, variables with P < 0.05 in the univariate analysis were incorporated into the LASSO Cox regression model, from which seven OS-related indicators (Age, TNM stage, ECOG PS, PLR, SII, PNI, LMR) were selected and input into the multivariate Cox regression model (Figure 2B and C). Eventually, TNM stage, SII, and PNI were identified as risk factors associated with OS, and the results of the multivariate Cox analysis were visualized using a forest plot (Figure 2D).
Establishment of the Prognostic Nomogram
Based on independent risk factors filtered by multivariate Cox regression, nomograms were developed to predict 1-, 2-, and 3-year OS (Figure 3A) and PFS (Figure 3B) in patients with advanced ESCC treated with ICIs. For convenient risk assessment, the R package “nomogramFormula” outputted integer scores for each variable on the nomogram (Supplementary Tables S2 and S3). To apply this nomogram, the first step is to identify the point of each factor variable on its axis and project a perpendicular line to the point on the axis to assign its score. The scores of all predictors are then summed to yield the total points. Finally, with this total point, we can determine the predicted risk value by drawing a vertical line from the total point on the axis to the risk of esophageal malignancy.
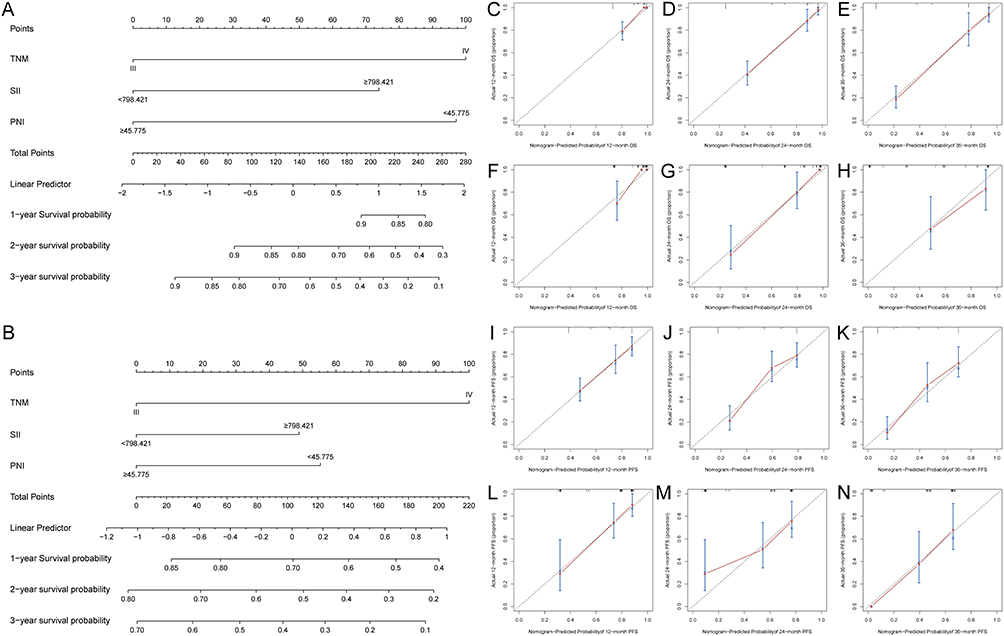 |
Figure 3 Development and validation of prognostic nomogram model for ESCC patients. (A) Nomogram predicting 1-, 2-, and 3-year OS in the primary cohort. (B) Nomogram model of ESCC patients for predicting 1-, 2-, and 3-year PFS in the primary cohort. (C-E) Calibration curves for 1-, 2-, and 3-year OS in the primary cohort. (F–H) Calibration curves for 1-, 2-, and 3-year OS in the validation cohort. (I–K) Calibration curves for 1-year, 2-year, and 3-year PFS in the primary cohort. (L–N) Calibration curves for 1-, 2-, and 3-year PFS in the validation cohort. |
Efficacy of the Prognostic Nomogram
The C-indices for OS and PFS were 0.842 (95% CI: 0.803–0.880) and 0.687 (95% CI: 0.635–0.739) in the primary cohort, and 0.873 (95% CI: 0.819–0.920) and 0.706 (95% CI: 0.633–0.779) in the validation cohort, respectively. Calibration curves further demonstrated concordance between predicted and observed survival results at 1-, 2-, and 3-year time points for OS (Figure 3C–H) and PFS (Figure 3I–N). The predicted AUCs of 1-, 2-, and 3-year OS and PFS for the primary cohort were 0.746 (95% CI: 0.677–0.816, P<0.001), 0.807 (95% CI: 0.734–0.880, P<0.001), 0.837 (95% CI: 0.762–0.912, P<0.001) (Figure 4A) and 0.741 (95% CI: 0.671–0.812, P<0.001), 0.800 (95% CI: 0.727–0.873, P<0.001), 0.825 (95% CI: 0.749–0.900, P<0.001) (Figure 4B), respectively; those for the validation cohort were 0.799 (95% CI: 0.694–0.904, P <0.001), 0.772 (0.650–0895, P<0.001), 0.819 (95% CI: 0.657–0.980, P<0.001) (Figure 4C) and 0.829 (95% CI: 0.729–0.929, P<0.001), 0.784 (95% CI: 0.670–898, P<0.001), 0.833 (95% CI: 0.697–0.968, P<0.001) (Figure 4D).
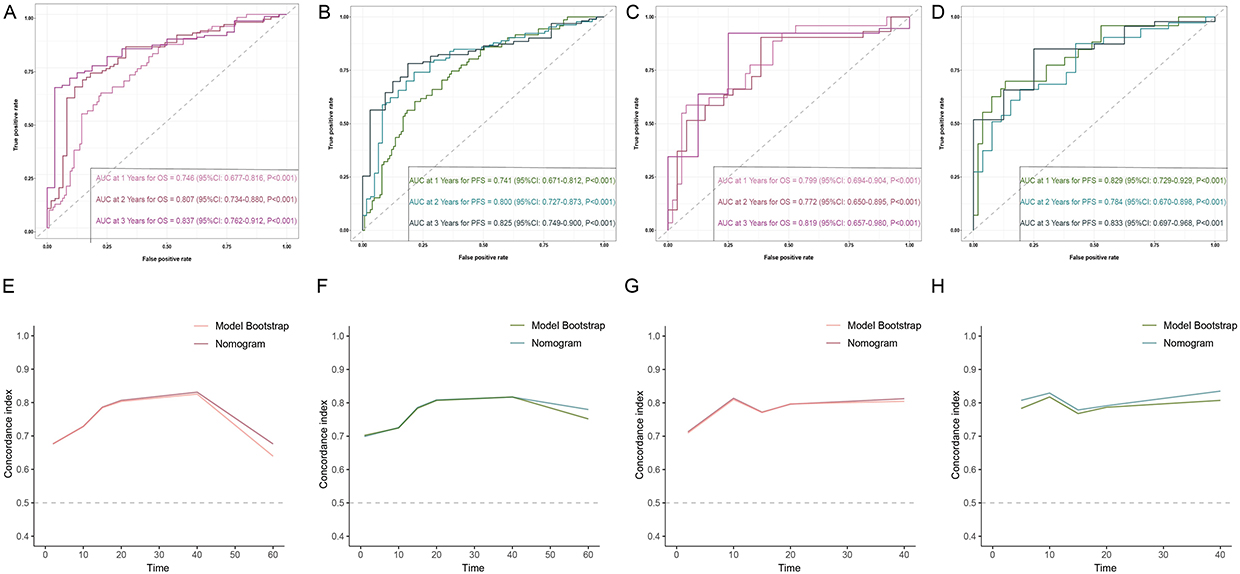 |
Figure 4 Comprehensive temporal validation of survival nomograms through ROC and AUC trajectory analyses. (A-D) Time-dependent ROC curves evaluating OS and PFS in the primary (A and C) and validation (B and D) cohorts. (E–H) Time-dependent AUC trajectories assessing OS and PFS prediction accuracy in the primary (E and G) and validation (F and H) cohorts. |
The TNM staging system is commonly applied in clinical practice to estimate the prognosis of advanced ESCC. Therefore, to evaluate the added value of our nomogram, we compared its predictive performance with that of the TNM staging system using time-dependent AUC and DCA. Both in the primary and validation cohorts, the time-dependent AUCs for predicting 3-year OS and PFS were both >0.6, indicating satisfactory discriminative ability of the nomogram (Figure 4E–H), and DCA showed that the new nomogram model outperformed the TNM staging system in predicting advanced ESCC prognosis (Figure 5). This finding indicates that the new nomogram model is more conducive to clinical application in predicting individual survival outcomes.
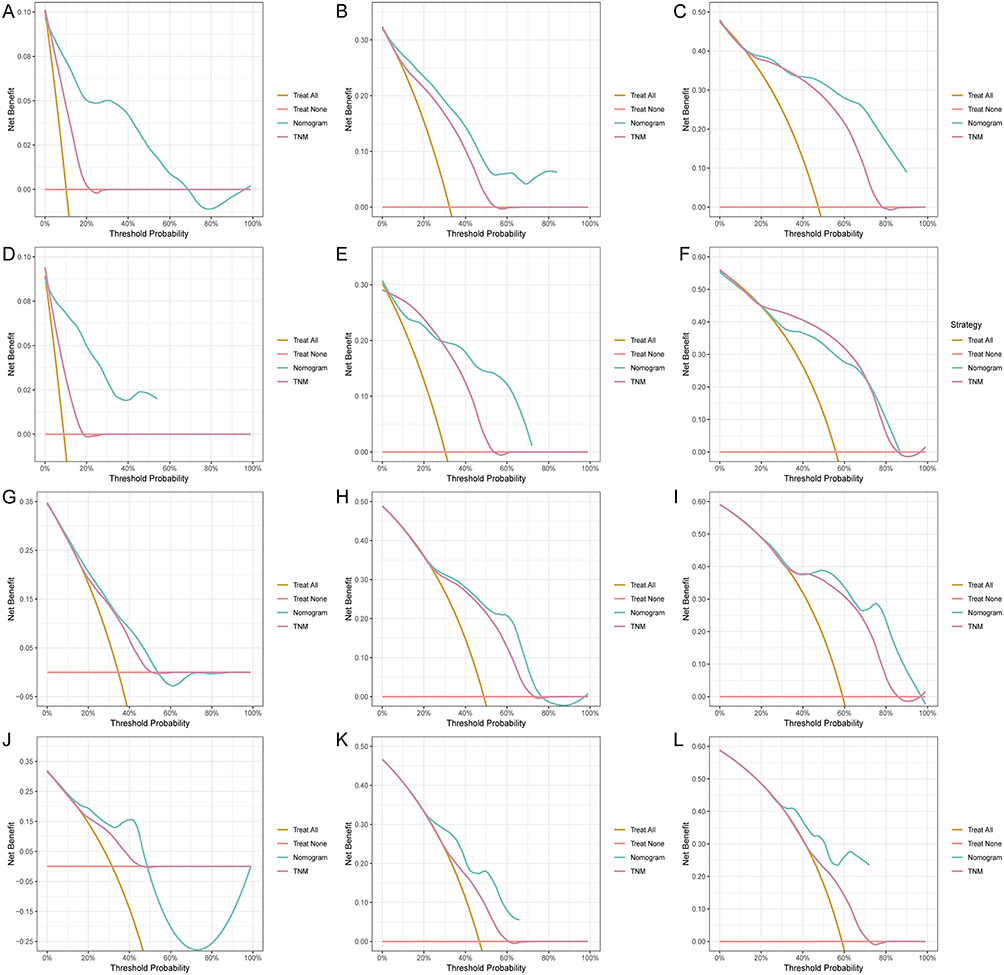 |
Figure 5 Decision curve analysis of clinical benefit for 1–3 year OS and PFS predictions in primary and validation cohorts. (A–C) DCA curves for predicting 1-, 2-, and 3-year OS in the primary cohort. (D–F) DCA curves for 1-, 2-, and 3-year OS in the validation cohort. (G–I) DCA curves for 1-, 2-, and 3-year PFS in the primary cohort. (J–L) DCA curves for 1-, 2-, and 3-year PFS in the validation cohort. |
Furthermore, we compared our model with the TNM staging system and another predictive model25 using IDI and NRI, and used the C-index to compare their discriminatory abilities (Supplementary Table S4). Most of the NRI and IDI values of the compared models were greater than 0, indicating positive improvement; several 95% CIs crossed zero, suggesting that the observed reclassification improvements were not statistically significant in all instances and should be interpreted with caution. In contrast, the C-index values of the compared model were lower than those of our model. In addition, pairwise comparison between the three AUCs in the primary and validation cohorts using the DeLong test is shown in Supplementary Tables S5 and S6. These findings demonstrate that our model exhibits superior predictive accuracy and clinical applicability compared to the TNM staging system and another predictive model.
Association of SII and PNI with OS and PFS in Patients with Advanced ESCC
The Kaplan-Meier method was employed to construct survival curves for survival analysis, and intergroup differences were evaluated using the Log rank test. Post-group survival curve analysis demonstrated that patients with low PNI and elevated SII values exhibited significantly poorer prognoses in both the primary and validation cohorts (Figure 6A–H). The relationship between SII, PNI, and patient HRs was determined using RCS curves, as shown in Figure 6I–L. Significant nonlinear associations were observed (P < 0.05), indicating that the effects of these variables on OS and PFS HRs were not linear.
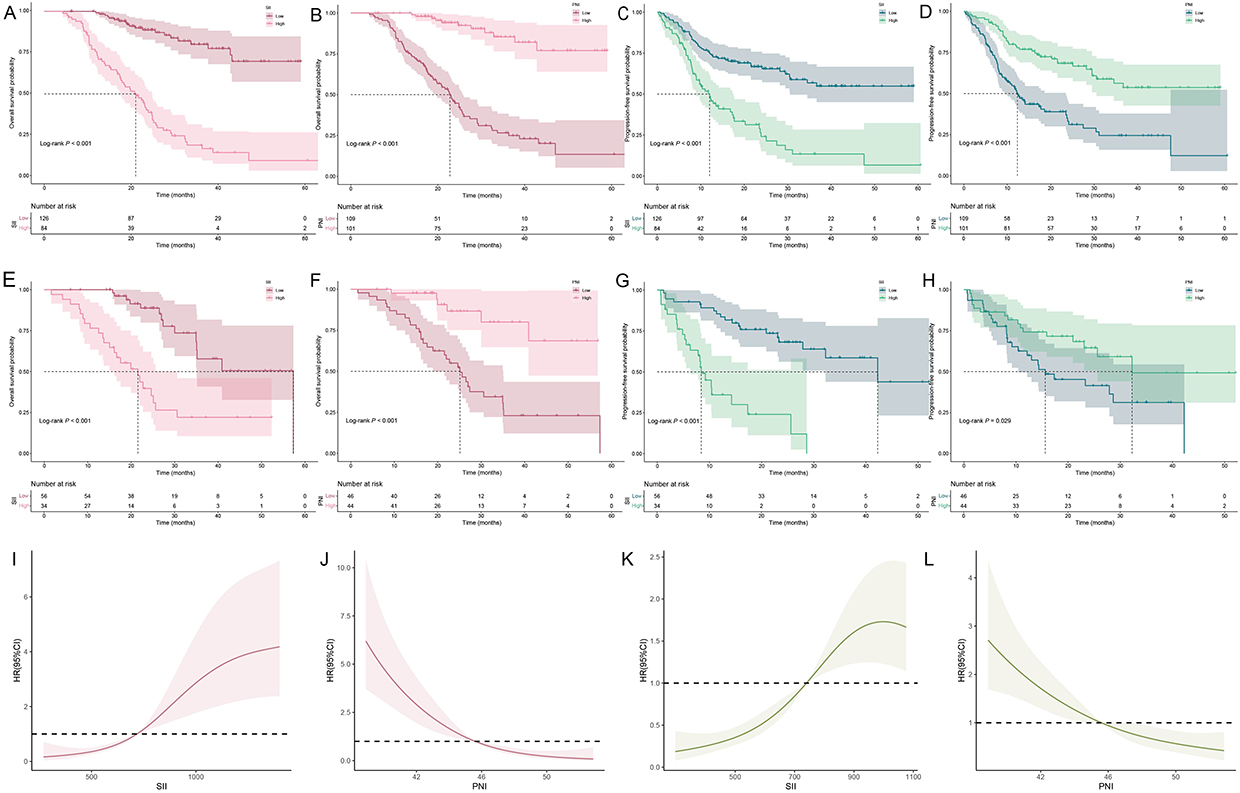 |
Figure 6 Clinically optimal SII/PNI cutoffs for survival prediction in ESCC: Kaplan-Meier and RCS analyses. (A-H) Kaplan-Meier survival analysis stratified by SII and PNI thresholds: (A and B) OS in the primary cohort (low vs high SII and PNI); (C and D) PFS in the primary cohort; (E and F) OS in the validation cohort; (G and H) PFS in the validation cohort. (I–L) Association between SII, PNI, and HR for OS and PFS using RCS regression models in patients with ESCC. (I) SII, (J) PNI, and OS in the primary cohort; (K) SII, (L) PNI, and PFS in the validation cohort. |
Influence of Systemic Inflammatory Indices on Clinical Outcomes
To evaluate the impact of different factors on the prognosis of ESCC, we established a nomogram-based risk stratification system, and scatter plots were created to compare the levels of sample metrics and the corresponding OS in both the primary and validation cohorts (Figure 7A and B), enabling classification of patients into distinct high-risk and low-risk subgroups. As illustrated in Figure 7C and D, significant differences in OS were observed between the two risk categories, with higher SII scores and reduced PNI being correlated with poorer prognosis, exhibiting a nonlinear association with survival risk.
 |
Figure 7 Risk stratification and survival analysis based on prognostic risk score. (A) (Primary cohort) and (B) (Validation cohort): Upper: Division into high/low-risk groups by ROC-derived cutoff values; Medium: Survival status distribution; Bottom: Heatmap of prognostic factor expression. (C and D) Comparison of overall survival (C) and Progression-free survival (D) times of patients with different risk scores. |
Discussion
In recent years, immunotherapy has achieved remarkable progress in the treatment of advanced ESCC, but the objective remission rate (ORR) of patients receiving immunotherapy is approximately 20%,26 with the median duration of remission around 7 months.27 KEYNOTE-590,28 ESCORT-1st,29 and ORIENT-1530 studies show that the combination of immunotherapy and chemotherapy significantly prolongs PFS and OS compared with chemotherapy alone in patients with advanced ESCC. However, a considerable proportion of patients fail to benefit from immunotherapy, underscoring the critical need to identify predictive biomarkers capable of selecting individuals most likely to respond to treatment.
Currently, TNM stage classification is the most widely utilized tool for stratifying, optimizing treatment, and predicting survival in ESCC.5 However, one weakness of the TNM staging described above is that it only considers the characteristics of the cancer and ignores the potential impact that host factors such as inflammation, nutrition, and immunity may have on the prognosis of the disease.31 Compared to single hematologic parameters, accumulating evidence in intrahepatic cholangiocarcinoma18 and hepatocellular carcinoma19 has demonstrated that integrating immune, inflammatory, and nutritional markers provides superior prognostic value. However, there are few studies examining the prognostic significance of these factors in ESCC patients before immunotherapy.
In this study, our analysis revealed significant alterations across all blood-derived indicators, with SII and PNI demonstrating superior prognostic relevance and being confirmed as independent predictors of survival. In addition, compared with patients in the low PNI and high SII groups, patients with high PNI and low SII had longer individual survival times. These results offer clinicians a biomarker-driven framework for pretreatment risk stratification in ESCC, facilitating precision therapy optimization and immunotherapeutic preparedness. In addition, we further constructed nomograms including SII, PNI, and TNM stage to predict the 1-, 2-, and 3-year OS and PFS. Higher scores on these nomograms are associated with an increased likelihood of tumor recurrence or reduced OS. For instance, a patient with stage IV esophageal malignant tumors, pre-immunotherapy SII ≥798.421, and pre-immunotherapy PNI < 45.775 would accumulate a total score of 272 points. This score is composed of 100 points for tumor stage, 74 points for pre-immunotherapy SII, and 98 points for pre-immunotherapy PNI. The projected OS rates for this individual are 73%, 25%, and 6% at 1, 2, and 3 years, respectively. Similarly, the predicted probability of recurrence for this patient is 12%, 21%, and 30% at 1, 2, and 3 years, respectively. Compared with conventional TNM staging and other previously published models,25 our nomograms exhibited higher C-indices and generally positive NRI and IDI values, suggesting improved discriminative ability and clinical utility. Although some metrics, particularly for PFS, did not reach statistical significance in the validation cohort, this may be attributed to the influence of subsequent treatments. Nevertheless, these results highlight the potential of integrating systemic immunoinflammatory and nutritional markers to refine prognostic accuracy and guide patient management more precisely than models relying solely on TNM or single blood-based indicators.
SII consists of three elements: neutrophils, platelets, and lymphocytes, which are all considered to function in the regulation of inflammation.32 The elevated SII is typically the result of increased neutrophil and platelet counts and/or decreased lymphocyte counts. Although the prognostic significance of SII in ESCC has been recognized, its underlying biological mechanisms remain insufficiently elucidated. Several potential interpretations may account for this association. Firstly, neutrophils secrete proteolytic enzymes such as matrix metalloproteinases (MMPs) and serine proteases,33 which facilitate tumor cell proliferation and extracellular matrix degradation. In addition, neutrophil-derived vascular endothelial growth factor (VEGF) and matrix metalloproteinase-9 (MMP9) are critically involved in promoting tumor angiogenesis,33 and they also release tissue inhibitor of metalloproteinases-1 (TIMP-1), which induces epithelial-to-mesenchymal transition (EMT), thereby enhancing tumor cell motility and invasive potential.34 Secondly, platelets drive tumor progression and metastasis through multiple interrelated mechanisms: (1) aggregation with tumor cells, (2) induction of tumor growth, (3) formation of protective barriers around circulating tumor cells (CTCs) to evade immune surveillance, (4) capturing of CTCs, and (5) furthering angiogenesis to promote metastasis.35 Najafi et al36 proposed that tumor cells could modify circulating platelets to develop pro-cancer “tumor-educated platelets (TEPs)”, which could accelerate tumor progression and dissemination. Thirdly, lymphocytes, as an essential component of the human immune system, can suppress tumor formation and recurrence by generating cytokines and exerting cytotoxic effects, as well as regulating immune functions.37 Meanwhile, lymphocytes also support adaptive immunity and mediate cancer immunosurveillance and immunoediting.38 Decreased lymphocyte numbers or functional deficits may allow tumor cells to escape immune surveillance, leading to worsened clinical outcomes in cancer patients. Consequently, the SII emerges as a clinically relevant prognostic marker for ESCC, given these mechanistic considerations.
Malnutrition is a prevalent complication among cancer patients, which correlates with adverse outcomes across multiple malignancies,39 including higher mortality, poorer survival, reduced treatment response, increased complications, extended hospitalization, and increased medical burden.40 As a cumulative value of albumin levels and lymphocyte counts, PNI serves as an indicator of the immune-nutritional status of the host. Our results demonstrate that patients with high PNI exhibited markedly superior OS and PFS compared to those with low PNI levels. Consistent with our results, a pembrolizumab trial41 in ESCC patients also demonstrated significantly improved PFS in the high-PNI subgroup versus the low-PNI subgroup.
Admittedly, this study is subject to several limitations. First, as a retrospective study with a restricted sample size, our research is inherently susceptible to multiple sources of bias, and propensity score matching or formal sensitivity analyses were not feasible. Second, although the present study employs strict inclusion and exclusion criteria, potential confounders, like concurrent infections, medications, or nutritional interventions, may affect systemic inflammation and nutritional status, warranting careful result interpretation. Third, the observed decline in AUC in the validation cohort, along with a >10% prediction error in elderly patients, likely reflects underlying prognostic heterogeneity. This may be attributable to differences in treatment regimens42 as well as age-related variations43,44 in immunological and nutritional status. Notably, metastatic patients comprised less than two-thirds of the cohort, and the nomogram’s performance across different metastatic sites was not evaluated, which was due to the retrospective design and the restricted sample size. Fourth, the cut-off values discussed in this article are based on data from our center, which inherently limits the generalizability of the results. Future prospective, large-scale, multicenter investigations involving diverse populations and broader outcome measures are essential to refine the model’s robustness and clinical relevance.
Conclusions
Collectively, our results establish SII and PNI as independent predictors of outcomes in immunotherapy-treated ESCC patients. Further validation through prospective, multicenter studies with larger cohorts is required.
Data Sharing Statement
All data supporting the findings of this study are available on request from the corresponding author upon reasonable request ([email protected]).
Acknowledgments
We thank all the patients and their families for participating in the study.
Author Contributions
All authors made a significant contribution to the work reported, whether that is in the conception, study design, execution, acquisition of data, analysis and interpretation, or in all these areas; took part in drafting, revising or critically reviewing the article; gave final approval of the version to be published; have agreed on the journal to which the article has been submitted; and agree to be accountable for all aspects of the work.
Funding
This work was partly supported by the Program for Young and Middle-aged Discipline Leaders of the Henan Provincial Health Commission (Grant No. HNSWJW-2022026) and the Outstanding Youth Talent Program of Henan Provincial Health Commission (Grant No. YXKC2022039).
Disclosure
The authors declare that they have no conflicts of interest.
References
1. Sung H, Ferlay J, Siegel RL, et al. Global cancer statistics 2020: GLOBOCAN estimates of incidence and mortality worldwide for 36 cancers in 185 countries. CA. 2021;71(3):209–249. doi:10.3322/caac.21660
2. Arnold M, Ferlay J, Henegouwen M, Soerjomataram I. Global burden of oesophageal and gastric cancer by histology and subsite in 2018. Gut. 2020;69:1564–1571. doi:10.1136/gutjnl-2020-321600
3. Le Bras GF, Farooq MH, Falk GW, Andl CD. Esophageal cancer: the latest on chemoprevention and state of the art therapies. Pharmacol Res. 2016;113:236–244. doi:10.1016/j.phrs.2016.08.021
4. Xu J, Li Y, Fan Q, et al. Clinical and biomarker analyses of sintilimab versus chemotherapy as second-line therapy for advanced or metastatic esophageal squamous cell carcinoma: a randomized, open-label Phase 2 study (ORIENT-2). Nat Commun. 2022;13. doi:10.1038/s41467-022-28408-3
5. Betancourt-Cuellar SL, Benveniste MFK, Palacio DP, Hofstetter WL. Esophageal cancer tumor-node-metastasis staging. Radiol Clin North Am. 2021;59:219–229. doi:10.1016/j.rcl.2020.11.008
6. Dinh HQ, Pan F, Wang G, et al. Integrated single-cell transcriptome analysis reveals heterogeneity of esophageal squamous cell carcinoma microenvironment. Nat Commun. 2021;12. doi:10.1038/s41467-021-27599-5
7. Negrao MV, Lam VK, Reuben A, et al. PD-L1 expression, tumor mutational burden, and cancer gene mutations are stronger predictors of benefit from immune checkpoint blockade than HLA class I genotype in non-small cell lung cancer. J Thorac Oncol. 2019;14:1021–1031. doi:10.1016/j.jtho.2019.02.008
8. Pusung M, Zeki S, Fitzgerald R. Genomics of esophageal cancer and biomarkers for early detection. In: Stem Cells, Pre-Neoplasia, and Early Cancer of the Upper Gastrointestinal Tract. Vol. 908. 2016;237–263. doi: 10.1007/978-3-319-41388-4_12
9. Hanahan D. Hallmarks of cancer: new dimensions. Cancer Discov. 2022;12:31–46. doi:10.1158/2159-8290.Cd-21-1059
10. de Martel C, Georges D, Bray F, Ferlay J, Clifford GM. Global burden of cancer attributable to infections in 2018: a worldwide incidence analysis. Lancet Global Health. 2020;8:E180–E190. doi:10.1016/s2214-109x(19)30488-7
11. Hu B, Yang X-R, Xu Y, et al. Systemic immune-inflammation index predicts prognosis of patients after curative resection for hepatocellular carcinoma. Clin Cancer Res. 2014;20:6212–6222. doi:10.1158/1078-0432.Ccr-14-0442
12. Cao X, Xue J, Yang H, Han X, Zu G. Association of clinical parameters and prognosis with the pretreatment systemic Immune-inflammation Index (SII) in patients with gastric cancer. J Coll Physicians Surg Pak. 2021;31:83–88. doi:10.29271/jcpsp.2021.01.83
13. Liu J, Li S, Zhang S, et al. Systemic immune-inflammation index, neutrophil-to-lymphocyte ratio, platelet-to-lymphocyte ratio can predict clinical outcomes in patients with metastatic non-small-cell lung cancer treated with nivolumab. J Clin Lab Analysis. 2019;33. doi:10.1002/jcla.22964
14. Muscaritoli M, Modena A, Valerio M, et al. The impact of nutritional status at first medical oncology visit on clinical outcomes: the NUTRIONCO study. Cancers. 2023;15(12):3206. doi:10.3390/cancers15123206
15. Buzby GP, Mullen JL, Matthews DC, Hobbs CL, Rosato EF. Prognostic nutritional index in gastrointestinal surgery. Am J Surg. 1980;139:160–167. doi:10.1016/0002-9610(80)90246-9
16. Jiang P, Li X, Wang S, Liu Y. Prognostic significance of PNI in patients with pancreatic head cancer undergoing laparoscopic pancreaticoduodenectomy. Front in Surg. 2022;9. doi:10.3389/fsurg.2022.897033
17. Nogueiro J, Santos-Sousa H, Pereira A, et al. The impact of the prognostic nutritional index (PNI) in gastric cancer. Langenbecks Archiv Surg. 2022;407:2703–2714. doi:10.1007/s00423-022-02627-0
18. Zhu J, Wang D, Liu C, et al. Development and validation of a new prognostic immune-inflammatory-nutritional score for predicting outcomes after curative resection for intrahepatic cholangiocarcinoma: a multicenter study. Front Immunol. 2023;14. doi:10.3389/fimmu.2023.1165510
19. Zhang B-L, Liu J, Diao G, et al. Construction and validation of a novel nomogram predicting recurrence in alpha-fetoprotein-negative hepatocellular carcinoma post-surgery using an innovative Liver Function-Nutrition-Inflammation-Immune (LFNII) score: a bicentric investigation. J Hepatocell Carcinoma. 2024;11:489–508. doi:10.2147/jhc.S451357
20. Wang Y, Lyu J, Jia H, et al. Clinical utility of the systemic immune-inflammation index for predicting survival in esophageal squamous cell carcinoma after radical radiotherapy. Future Oncol. 2021;17:2647–2657. doi:10.2217/fon-2021-0304
21. Gavriilidis P, Pawlik TM. Inflammatory indicators such as systemic immune inflammation index (SIII), systemic inflammatory response index (SIRI), neutrophil-to-lymphocyte ratio (NLR) and platelet-to-lymphocyte ratio (PLR) as prognostic factors of curative hepatic resections for hepatocellular carcinoma. Hepatobiliary Surg Nutr. 2024;13:509–511. doi:10.21037/hbsn-23-631
22. Yamamoto T, Kawada K, Obama K. Inflammation-related biomarkers for the prediction of prognosis in colorectal cancer patients. Int J Mol Sci. 2021;22(15):8002. doi:10.3390/ijms22158002
23. Nost TH, Alcala K, Urbarova I, et al. Systemic inflammation markers and cancer incidence in the UK Biobank. Eur J Epidemiol. 2021;36:841–848. doi:10.1007/s10654-021-00752-6
24. Zhang L, Ma W, Qiu Z, et al. Prognostic nutritional index as a prognostic biomarker for gastrointestinal cancer patients treated with immune checkpoint inhibitors. Front Immunol. 2023;14. doi:10.3389/fimmu.2023.1219929
25. Li Y, Wang H, Zhao X, et al. Prognostic value of immunotrophic inflammatory markers in ESCC undergoing chemoradiotherapy combined with immunotherapy. Sci Rep. 2025;15. doi:10.1038/s41598-025-02454-5
26. Petrillo A, Smyth EC. Immunotherapy for squamous esophageal cancer: a review. J Pers Med. 2022;12(6):862. doi:10.3390/jpm12060862
27. Shoji Y, Koyanagi K, Kanamori K, et al. Immunotherapy for esophageal cancer: where are we now and where can we go. World J Gastroenterol. 2024;30(19):2496–2501. doi:10.3748/wjg.v30.i19.2496
28. Sun J-M, Shen L, Shah MA, et al. Pembrolizumab plus chemotherapy versus chemotherapy alone for first-line treatment of advanced oesophageal cancer (KEYNOTE-590): a randomised, placebo-controlled, Phase 3 study. Lancet. 2021;398:759–771. doi:10.1016/s0140-6736(21)01234-4
29. Luo H, Lu J, Bai Y, et al. Effect of camrelizumab vs placebo added to chemotherapy on survival and progression-free survival in patients with advanced or metastatic esophageal squamous cell carcinoma: the ESCORT-1st randomized clinical trial. JAMA J Am Med Assoc. 2021;326:916–925. doi:10.1001/jama.2021.12836
30. Lu Z, Wang J, Shu Y, et al. Sintilimab versus placebo in combination with chemotherapy as first line treatment for locally advanced or metastatic oesophageal squamous cell carcinoma (ORIENT-15): multicentre, randomised, double blind, phase 3 trial. BMJ. 2022;377. doi:10.1136/bmj-2021-068714
31. Elinav E, Nowarski R, Thaiss CA, Hu B, Jin C, Flavell RA. Inflammation-induced cancer: crosstalk between tumours, immune cells and microorganisms. Nat Rev Cancer. 2013;13:759–771. doi:10.1038/nrc3611
32. Zinellu A, Paliogiannis P, Sotgiu E, et al. Blood cell count derived inflammation indexes in patients with idiopathic pulmonary fibrosis. Lung. 2020;198:821–827. doi:10.1007/s00408-020-00386-7
33. Liang W, Ferrara N. The complex role of neutrophils in tumor angiogenesis and metastasis. Cancer Immunol Res. 2016;4:83–91. doi:10.1158/2326-6066.Cir-15-0313
34. Mahmud Z, Rahman A, Mishu ID, Kabir Y. Mechanistic insights into the interplays between neutrophils and other immune cells in cancer development and progression. Cancer Metastasis Rev. 2022;41:405–432. doi:10.1007/s10555-022-10024-8
35. Meikle CKS, Kelly CA, Garg P, Wuescher LM, Ali RA, Worth RG. Cancer and Thrombosis: the Platelet Perspective. Front Cell Develop Biol. 2017;4. doi:10.3389/fcell.2016.00147
36. Najafi S, Asemani Y, Majidpoor J, Mahmoudi R, Aghaei-Zarch SM, Mortezaee K. Tumor-educated platelets. Clin Chim Acta. 2024;552:117690. doi:10.1016/j.cca.2023.117690
37. Chen Y-Y, Wang H-Y, Chen C-Y. From immunosurveillance to immunoediting: the role of immunobiology in early lung cancer detection. Respirology. 2018;23:19.
38. Marra P, Mathew S, Grigoriadis A, et al. IL15RA drives antagonistic mechanisms of cancer development and immune control in lymphocyte-enriched triple-negative breast cancers. Cancer Res. 2014;74:4908–4921. doi:10.1158/0008-5472.Can-14-0637
39. de Pinho NB, Martucci RB, Rodrigues VD, et al. High prevalence of malnutrition and nutrition impact symptoms in older patients with cancer: results of a Brazilian multicenter study. Cancer. 2020;126:156–164. doi:10.1002/cncr.32437
40. Campillo MDM, Fernández JM, Salas MA, Rituerto DC. A randomized controlled trial of preoperative oral immunonutrition in patients undergoing surgery for colorectal cancer: hospital stay and health care costs. Cirugia Y Cirujanos. 2017;85:393–400. doi:10.1016/j.circir.2016.10.029
41. Sugase T, Kanemura T, Takeoka T, et al. Survival impact of inflammation-based prognostic scores in metastatic or unresectable esophageal cancer treated with pembrolizumab plus chemotherapy. J Immunother. 2024;47:249–257. doi:10.1097/cji.0000000000000529
42. Belias M, Rovers MM, Reitsma JB, Debray TPA, IntHout J. Statistical approaches to identify subgroups in meta-analysis of individual participant data: a simulation study. BMC Med Res Method. 2019;19. doi:10.1186/s12874-019-0817-6
43. Qiu J, Yang J, Yu Y, et al. Prognostic value of pre-therapeutic nutritional risk factors in elderly patients with locally advanced esophageal squamous cell carcinoma receiving definitive chemoradiotherapy or radiotherapy. Bmc Cancer. 2023;23. doi:10.1186/s12885-023-11044-5
44. Ferreira AF, Fernandes T, Carvalho MDC, Loureiro HS. The prognostic role of prognostic nutritional index and controlling nutritional status in predicting survival in older adults with oncological disease: a systematic review. Onco. 2024;4:101–115. doi:10.3390/onco4020009
 © 2025 The Author(s). This work is published and licensed by Dove Medical Press Limited. The
full terms of this license are available at https://www.dovepress.com/terms
and incorporate the Creative Commons Attribution
- Non Commercial (unported, 4.0) License.
By accessing the work you hereby accept the Terms. Non-commercial uses of the work are permitted
without any further permission from Dove Medical Press Limited, provided the work is properly
attributed. For permission for commercial use of this work, please see paragraphs 4.2 and 5 of our Terms.
© 2025 The Author(s). This work is published and licensed by Dove Medical Press Limited. The
full terms of this license are available at https://www.dovepress.com/terms
and incorporate the Creative Commons Attribution
- Non Commercial (unported, 4.0) License.
By accessing the work you hereby accept the Terms. Non-commercial uses of the work are permitted
without any further permission from Dove Medical Press Limited, provided the work is properly
attributed. For permission for commercial use of this work, please see paragraphs 4.2 and 5 of our Terms.
Recommended articles
Platelet-Related Molecular Subtype to Predict Prognosis in Hepatocellular Carcinoma
Zhang G
Journal of Hepatocellular Carcinoma 2022, 9:423-436
Published Date: 19 May 2022
Molecular Characteristics and the Effect of KRAS Mutation on the Prognosis of Immunotherapy in Non-Small Cell Lung Cancer in Xinjiang, China
Gu G, Yu B, Wan H, Lu S, Zhu X, Zhao Y, Fuxi Y, Liu C
OncoTargets and Therapy 2022, 15:1021-1032
Published Date: 21 September 2022
Development and Validation of a Novel Nomogram Integrated with Hypoxic and Lactate Metabolic Characteristics for Prognosis Prediction in Hepatocellular Carcinoma
Qiu X, Dong L, Wang K, Zhong X, Xu H, Xu S, Guo H, Wei X, Chen W, Xu X
Journal of Hepatocellular Carcinoma 2024, 11:241-255
Published Date: 2 February 2024
Diagnosis, Prognosis, and Treatment of Triple-Negative Breast Cancer: A Review
Jie H, Ma W, Huang C
Breast Cancer: Targets and Therapy 2025, 17:265-274
Published Date: 17 March 2025
Multi‑cohort Validation Based on Disulfidptosis-Related lncRNAs for Predicting Prognosis and Immunotherapy Response of Esophageal Squamous Cell Carcinoma
Yi Z, Li X, Li Y, Ji Y, Zhao J, Xu H, Zhou L, Song J
OncoTargets and Therapy 2025, 18:763-778
Published Date: 25 June 2025