Back to Journals » Journal of Hepatocellular Carcinoma » Volume 11
Development and Validation of a Novel Nomogram Integrated with Hypoxic and Lactate Metabolic Characteristics for Prognosis Prediction in Hepatocellular Carcinoma
Authors Qiu X, Dong L ![]() , Wang K, Zhong X, Xu H, Xu S
, Wang K, Zhong X, Xu H, Xu S ![]() , Guo H, Wei X, Chen W, Xu X
, Guo H, Wei X, Chen W, Xu X
Received 6 November 2023
Accepted for publication 24 January 2024
Published 2 February 2024 Volume 2024:11 Pages 241—255
DOI https://doi.org/10.2147/JHC.S446313
Checked for plagiarism Yes
Review by Single anonymous peer review
Peer reviewer comments 2
Editor who approved publication: Prof. Dr. Jörg Trojan
Xun Qiu,1,2,* Libin Dong,1,2,* Kai Wang,1,2 Xinyang Zhong,1,2 Hanzhi Xu,1,2 Shengjun Xu,2 Haijun Guo,2 Xuyong Wei,1,2 Wei Chen,2,3 Xiao Xu1,2
1Department of Surgery, Zhejiang University School of Medicine, Hangzhou, 310058, People’s Republic of China; 2Key Laboratory of Integrated Oncology and Intelligent Medicine of Zhejiang Province, Hangzhou, 310006, People’s Republic of China; 3Department of Cell Biology, Zhejiang University School of Medicine, Hangzhou, 310058, People’s Republic of China
*These authors contributed equally to this work
Correspondence: Wei Chen; Xiao Xu, Email [email protected]; [email protected]
Background: Hepatocellular carcinoma (HCC) is the third leading cause of cancer-related death worldwide. Accumulating evidence indicates that hypoxia and lactate metabolism play critical roles in tumor progression and therapeutic efficacy. This study aimed to construct a hypoxia- and lactate metabolism-related prognostic model (HLPM) to evaluate survival and treatment responses for HCC patients and develop a nomogram integrated with HLPM and clinical characteristics for prognosis prediction in HCC.
Methods: Expression profile and clinical data of HCC were obtained from TCGA and ICGC databases. The univariate, LASSO and stepwise multivariate Cox analyses were used to identify the hypoxia- and lactate metabolism-related biomarkers, whose expression levels were then validated in 14 pairs tissue samples and single-cell RNA sequencing dataset. Kaplan–Meier survival curves were utilized to assess the prognostic values of biomarkers or models. Analyses of ImmuCellAI, TIDE and drug sensitivity were conducted to evaluate the therapeutic responses of patients. Furthermore, the nomogram integrated with hypoxic and lactate metabolic characteristics was established through univariate and multivariate Cox analyses. ROC curves, C-index, and calibration curves were depicted to evaluate the performance of the nomogram.
Results: Five hypoxia- and lactate metabolism-related biomarkers (KIF20A, IRAK1, ADM, PPARGC1A and EPO) were used to construct HLPM. The expression of five prognostic biomarkers was validated in 14 pairs tissue samples and single-cell RNA sequencing dataset. Analyses of ImmuCellAI, TIDE and drug sensitivity implied that patients with low-risk score were more sensitive to immunotherapy and major chemotherapeutic agents. The nomogram that contained age, histological grade and risk score of HLPM was developed and exhibited a better capacity in prognosis prediction than HLPM only.
Conclusion: A novel nomogram integrated with hypoxic and lactate metabolic characteristics was developed and validated for prognosis prediction in HCC, providing insight into personalized decision-making in clinical management.
Keywords: hepatocellular carcinoma, nomogram, prognosis, lactate metabolism, hypoxia, immunotherapy
Introduction
Primary liver cancer is still the sixth most common cancer and the third leading cause of cancer-related death worldwide, with more than 1 million new cases expected annually by 2025.1,2 Hepatocellular carcinoma (HCC) is the most prevalent pathological type of liver cancer, accounting for about 90% of cases. In the recent years, significant advancements have been made in the systematic treatment of HCC, including tyrosine kinase inhibitors (TKIs), immune-checkpoint inhibitors (ICIs) and monoclonal antibodies.3 Lenvatinib, a newly approved drug, was found to be non-inferior to the conventional TKI sorafenib in improving the overall survival (OS) of HCC patients. Additionally, the combined blockade of programmed cell death 1 ligand 1 (PD-L1) and vascular endothelial growth factor (VEGF) has shown remarkable efficacy in improving the prognosis of patients with unresectable HCC.4,5 However, chemotherapy and immunotherapy resistance still negatively impact the prognosis of many HCC patients.6–8 Therefore, it is imperative to identify a signature that can predict the survival, immune microenvironment, and treatment responses of HCC patients.
Hypoxia is a prominent hallmark in HCC, and plays a critical role in tumor progression and therapy resistance.9–11 Studies have revealed that hypoxia can endow HCC cells with sorafenib resistance by upregulating miR-210-5P, thus reducing the expression of ATPase family AAA domain containing 3A and promoting mitophagy.12 Moreover, hypoxia-activated pleomorphic adenoma gene-like-2/epidermal growth factor receptor (EGFR) signaling can impair the sensitivity of HCC cells to the anti-EGFR drug erlotinib.13 In hypoxia-high tumor regions, the interaction between regulatory T cells (Tregs) and type 2 conventional dendritic cells is enhanced, causing an immunosuppressive microenvironment and a more proliferative and invasive tumor phenotype.14 In addition, hypoxia can reprogram glucose metabolism from oxidation to glycolysis through promoting Yes-associated protein-mediated stabilization of hypoxia-inducible factor 1α (HIF-1α) protein, thus providing sufficient energy for the rapid growth of HCC.15
Lactate is the main product of anaerobic glycolysis. Increasing evidence suggests that intra-tumoral lactate is a critical regulator that induces the immunosuppressive microenvironment and promotes tumor growth rather than being just a mere metabolic waste.16–19 Lactate confers HCC cells with ferroptosis resistance by elevating the levels of anti-ferroptosis monounsaturated fatty acids and contributes to enhanced proliferation of tumor cells.20 Intracellular lactate facilitates the proliferation, self-renewal and migration of HCC stem cells by driving the lactylation of H3 histone at K9 and K56.21 Furthermore, the high level of MOESIN lactylation in Tregs correlates with a poor response to anti-programmed cell death-1 (PD-1) therapy in HCC. The underlying mechanism is that the lactylation of MOESIN at K92 activated transforming growth factor β (TGF-β)/SMAD3 signaling, promoting the proliferation and function of Tregs.22
Therefore, this study aims to identify a hypoxia- and lactate metabolism-related prognostic model (HLPM) to evaluate the survival, immune landscape and treatment responses for patients with HCC, and develop a novel nomogram integrated with HLPM and clinical characteristics to predict the prognosis in HCC.
Materials and Methods
Data Collection
RNA expression and clinical data of 350 HCC cases with OS longer than 30 days and 49 normal cases were downloaded from The Cancer Genome Atlas (TCGA) database (https://portal.gdc.cancer.gov/). The TCGA-LIHC cohort was regarded as a training set. In order to determine the stability of the prognostic model, ICGC-LIRI-JP cohort (n = 230) with OS longer than 30 days obtained from HCCDB (https://lifeome.net/database/hccdb/home.html) was served as a validation set. Genotype-tissue expression (GTEx) provided by the University of California Santa Cruz Xena (https://xenabrowser.net/datapages/) was used to obtain gene expression of normal liver tissues (n = 111). The hypoxia-related genes (HRGs) (n = 493) and lactate metabolism-related genes (LRGs) (n = 355) were downloaded from the Molecular Signatures Database (https://www.gsea-msigdb.org/gsea/msigdb/index.jsp).23
Single-cell RNA sequencing (scRNA-seq) dataset GSE149614 was collected from the GEO database, including 10 primary HCC tissues, 2 portal vein tumor thrombus tissues, 1 metastatic lymph node tissue and 8 normal liver tissues.24 To quality control, following low-quality cells were filtered out, including (1) unique molecular identifiers (UMIs) ≤500, (2) detected gene expression ≤500 or ≥8000, (3) mitochondrial gene expression ≥30%. Therefore, a total of 25,712 genes and 71,910 cells were generated and included in this study. The data were normalized by “LogNormalized” method and used to find 2000 highly variable genes by “FindVariableFeatures”. To reduce the dimensionality of the data, the “RunPCA” function was applied specifically to the set of 2000 highly variable genes. Cell clustering was performed using the “KNN” method with a resolution parameter set to 0.5. A two-dimensional representation of the clustered cells was obtained using the uniform manifold approximation and projection (UMAP) technique. To identify the categories of cells, a combination of information from previous studies and the “SingleR” package was employed.24,25 Differential expression analysis among the identified clusters was conducted using the Wilcoxon-Mann–Whitney test and the “FindAllMarkers” function from the “Seurat” package. Genes with |log2 fold change (FC)| >2 and an adjusted p-value <0.01 were considered as significant cellular marker genes.
Differentially Expressed HRGs and LRGs
The R package “limma” was used to identify differentially expressed genes (DEGs) with the threshold for |log2 FC| >1.0 and Benjamini–Hochberg adjusted p-value <0.05. Differentially expressed HRGs (DEHRGs) and LRGs (DELRGs) were defined as the intersection of DEGs and HRGs and LRGs. The protein–protein interaction (PPI) network between DEHRGs and DELRGs (HLRGs) in HCC was constructed using the STRING database (https://string-db.org/).
Construction and Validation of HLPM
First, the univariate Cox regression analysis was used for identifying DEHRGs and DELRGs with a significant prognostic value. To avoid overfitting, R package “glmnet” was used for least absolute shrinkage and selection operator (LASSO) regression. Finally, stepwise backward Cox regression analysis of five selected genes was performed to construct a signature of HRGs and LRGs in TCGA-LIHC cohort [ ]. HCC patients were divided into the high-risk and low-risk groups based on the median risk score. Kaplan–Meier (KM) survival analysis, receiver operating characteristic (ROC) curve, distribution of risk score, association between the survival time and survival status of patients, and the expression of the HLRGs were carried out in training set and validation set to assess the performance of the signature in predicting clinical outcomes.
In addition, Kaplan–Meier survival analysis was performed for subgroups of patients with different clinical characteristics to evaluate the applicability of the signature. Immunohistochemical images of prognostic DEGs and HRGs in HCC and normal liver tissues were downloaded from HPA (https://www.proteinatlas.org/).
Nomogram Development for Predicting Survival
A nomogram was constructed based on the risk score and other clinical indicators to calculate the 1-, 3-, and 5-year OS probabilities of HCC patients. ROC curves, C-index, and calibration curves were used to evaluate the performance of the nomogram. In addition, the net benefit of the nomogram and clinical features alone was evaluated by decision curve analysis (DCA).
Functional Enrichment and Somatic Mutations Analysis
To analyze the critical functional features, we analyzed the DEGs between the two groups with Gene Ontology (GO) and Kyoto Encyclopedia of Genes and Genomes (KEGG) using the R package “clusterProfiler”. Gene set enrichment analysis (GSEA) was also used to explore the important functional pathway between the high-risk and low-risk groups (http://www.gsea-msigdb.org/gsea/index.jsp) by R package “clusterProfiler”. (p-value <0.01 and false discovery rate (FDR) <0.20). In GSEA, p-value <0.01 and FDR <0.20 were considered statistically significant. Somatic mutation analysis was conducted by R package “maftools”.
Assessment of the TME, Immune Cell Infiltration, and Immunotherapy Response
The immune cell abundance identifier (ImmuCellAI) was utilized to assess the infiltrated fractions of immune cells.26 The correlation analysis between the five HLRGs and the filtration of immune cells was also performed. The levels of crucial immune checkpoint genes (ICGs) and chemokines and their receptors were compared between two risk groups. The relationship between the risk score and ICGs expression was determined by Spearman correlation analyses. The online tool named TIDE (http://tide.dfci.harvard.edu/) was used to evaluate the response of patients to immunotherapy.27 We further used the GSE78220 cohort to assess the capability of the HLPM in predicting the efficacy of immunotherapy.28 Patients with complete response (CR) or partial response (PR) were classified as responders and patients with progressive disease (PD) were regarded as non-responders.
Assessment of the Sensitivity to Chemotherapy
The R package “oncoPredict” and the Genomics of Drug Sensitivity in Cancer (GDSC) database (https://www.cancerrxgene.org/) were utilized to calculate the half-maximal inhibitory concentrations (IC50) of potential drugs between the high-risk and low-risk groups and the correlation between IC50 and the expression of the five HLRGs.29,30 Wilcoxon signed-rank tests were used to compare IC50 values between the two risk groups.
Tissue Samples and qRT-PCR
A total of 14 pairs HCC tissue samples and adjacent normal liver tissue samples were collected from the Shulan (Hangzhou) Hospital and Hangzhou First People’s Hospital with the approval by the Medical Ethics Committee of the hospitals. All patients included in the current study have provided written informed consent. Fresh tumor and non-tumor tissues were preserved in liquid nitrogen to maintain their integrity. The extraction of RNA was realized by using TRIzol (Invitrogen, California, USA). The cDNA was synthesized using the Hifair® V one-step RT-gDNA digestion SuperMix for qPCR (Yeasen, Shanghai, China). Real-time quantitative PCR analysis was performed on a CFX96 Touch real-time PCR system (Bio-Rad, CA, USA) with qPCR SYBR Green Master Mix (Yeasen, Shanghai, China). The amount of target cDNA was analysed through the conversion of the threshold cycle with reference to β-actin. Primers for the genes are displayed in Table S1.
Statistical Analysis
Statistical analyses were performed by the R software (Version 4.0.5). The unpaired Student’s t-test and F-test were used for comparing normal data, and Wilcoxon test was used for comparing nonnormal data. The Log rank test was used for Kaplan–Meier survival analysis. The clinical characteristics among groups were assessed by χ2 test or Fisher’s exact test. A p-value of less than 0.05 was considered as statistically significant.
Results
Identification and Functional Enrichment of DEHRGs and DELRGs
A total of 1759 upregulated genes and 2054 downregulated genes were identified and shown in the volcano plot (Figure 1A). The heat map displayed the expression of the top 50 genes with the most significant difference (Figure 1B). DEGs were intersected with HRGs and LRGs, respectively, resulting in the identification of 115 DEHRGs and 42 DELRGs (Figure 1C). The results of PPI analysis suggested the intrinsic association between DEHRGs and DELRGs (Figure 1D). According to GO analysis, the 115 DEHRGs and 42 DELRGs mainly performed a function in response to hypoxia and decreased oxygen levels (Figure 1E). Based on KEGG analysis, DEHRGs and DELRGs were enriched in HIF-1 and PI3K/Akt signaling pathways (Figure 1F). These findings revealed the potential molecular mechanisms of DEHRGs and DELRGs that involved in the progression of HCC.
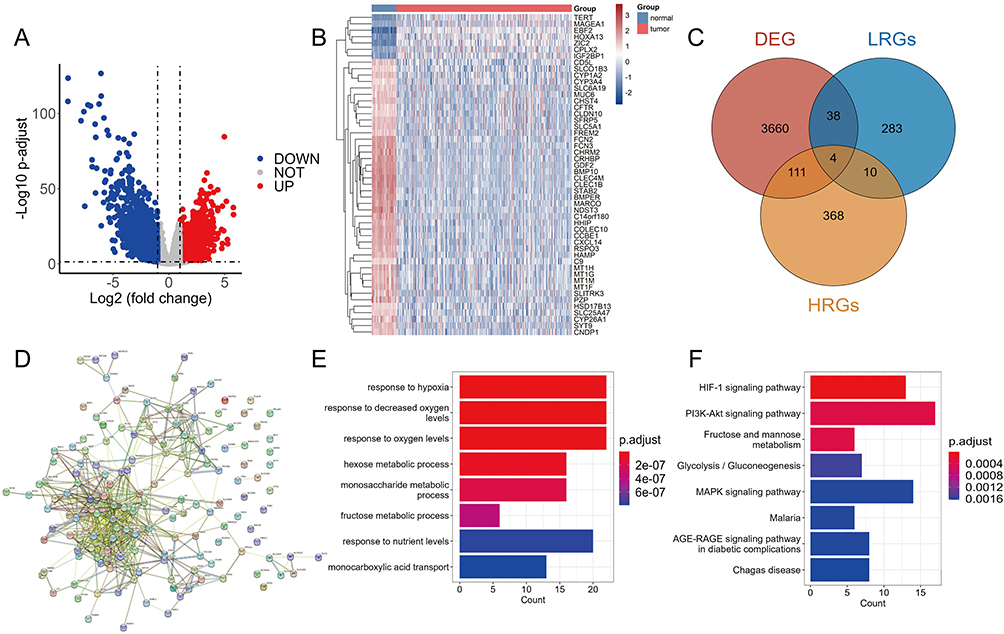 |
Figure 1 Identification and functional enrichment of differential expressed hypoxia-related genes (HRGs) and lactate metabolism-related genes (LRGs) in HCC. (A) The volcano plot of the differentially expressed genes (DEGs) between normal and tumor tissues. (B) The heat map showed the detailed expression of the top 50 DEGs. (C) The Veen diagram of the DEGs, HRGs and LRGs. (D) The protein–protein interaction (PPI) network of differential expressed HRGs and LRGs. GO enrichment analysis (E) and KEGG pathway analysis (F) of differential expressed HRGs and LRGs. |
Identification and Validation of the Five HLRGs
To identify DEHRGs and DELRGs correlated with prognosis, we performed univariate Cox regression analysis, identifying 38 DEHRGs and DELRGs with significance (Figure 2A). After performing LASSO regression analysis, only 14 DEHRGs and DELRGs were subjected to backward stepwise multivariate Cox regression analysis (Figure 2B and C). Finally, we selected five genes (KIF20A, IRAK1, ADM, PPARGC1A and EPO) to construct the HLPM [risk score = (0.1870 × KIF20A) + (0.3558 × IRAK1) + (0.2233 × ADM) + (−0.0720 × PPARGC1A) + (0.0639 × EPO)] (Figure 2D). In TCGA and GTEx databases, all five biomarkers were significantly differentially expressed between HCC and normal samples, implying the critical role in the tumor progression and patients’ prognosis. As shown in Figure 2E, levels of KIF20A and IRAK1 were upregulated in HCC tissues, while increased levels of ADM, PPARGC1A and EPO were noted in normal tissues. Consistent with the bulk RNA-seq results, qRT-PCR analysis of clinical tissue samples further corroborated the upregulation of KIF20A and IRAK1, along with a downregulation of ADM, PPARGC1A, and EPO in HCC tissues compared to adjacent normal liver tissues (Figure 2F). Furthermore, survival analysis in HCC patients revealed that high expression of EPO, KIF20A and IRAK1 significantly correlated with poor OS, while high expression of PPARGC1A was related to better OS (Figure 2G). HCC is a kind of heterogeneous tumor that has distinct gene expression profiles in different stages.31 As shown in Figure 2H, the mRNA levels of EPO, KIF20A, ADM and IRAK1 were significantly differentially expressed among patients at different stages, reflecting that these biomarkers exerted important effects in the tumor progression and could be regarded as the potential therapeutic targets for HCC. Immunohistochemical images from the HPA database further validated the increased levels of KIF20A and IRAK1 and decreased levels of ADM and EPO in tumor tissues compared with normal tissues (Figure 2I). Immunohistochemical staining for PPARGC1A in tumor and normal tissues was not provided in the HPA database. However, several studies have indicated that the protein level of PPARGC1A was downregulated in the human HCC tissues compared with the normal tissues.32,33 These results suggest the prognostic value of the five DEHRGs and DELRGs in HCC.
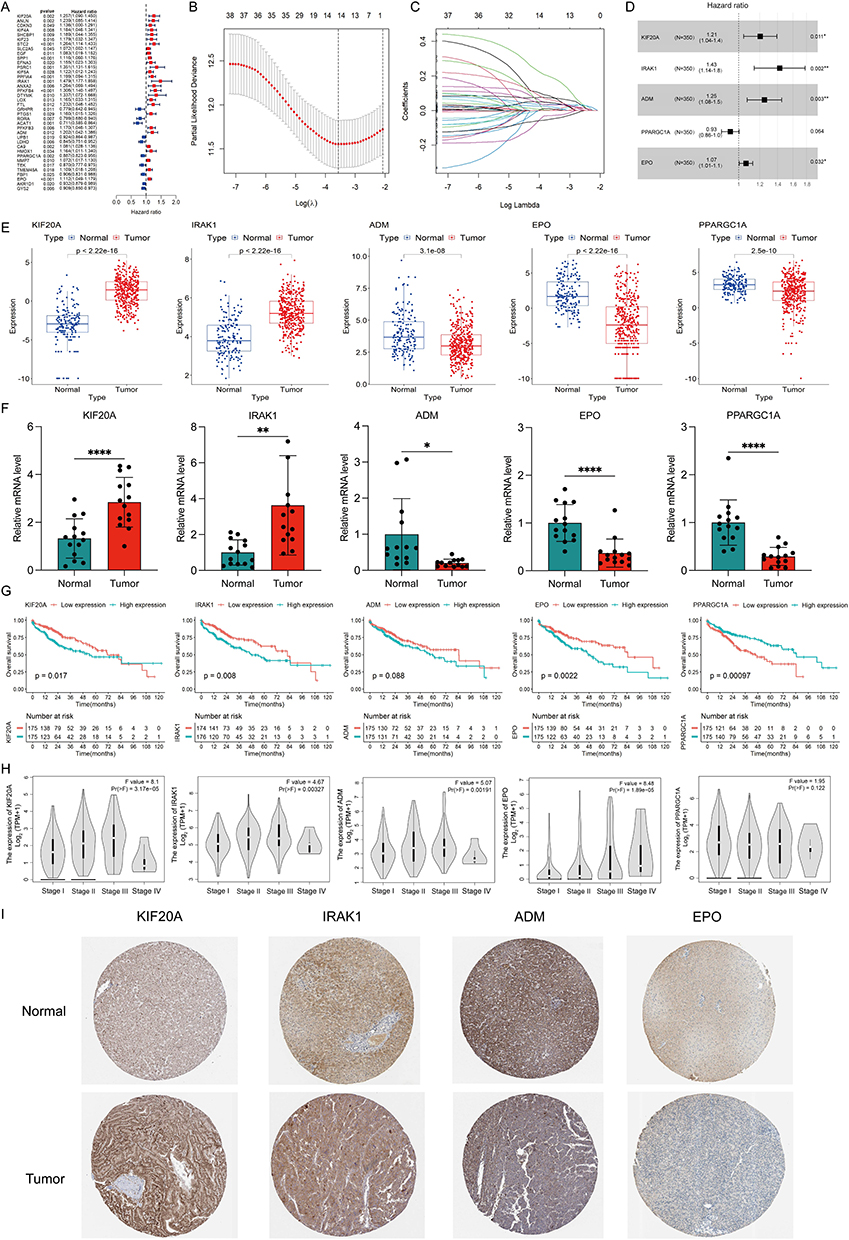 |
Figure 2 Identification and validation of the five differentially expressed hypoxia- and lactate metabolism-related genes (HLRGs). (A) Univariate Cox regression analysis of the differentially expressed hypoxia-related genes (DEHRGs) and differentially expressed lactate metabolism-related genes (DELRGs). (B) Tuning parameter (λ) selection in LASSO model. (C) The LASSO coefficient profile of 14 prognostic DEHRGs and DELRGs. (D) The results of stepwise multivariate Cox regression analysis of HLRGs were shown by forest graph. (E) Differential expression of the five HLRGs between the HCC and normal tissues in TCGA and GTEx databases. (F) The expression levels of the five HLRGs in 14 pairs HCC and matched adjacent normal tissues were examined by qRT-PCR. (G) Kaplan-Meier survival analysis of patients with different expression of five selected HLRGs. (H) The expression levels of five HLRGs in patients at different stages. (I) Immunohistochemical staining for four HLRGs in the normal liver and HCC tissues. *p < 0.05; **p < 0.01; ****p < 0.0001. |
To further explore and validate the action of the five prognostic genes, we performed analysis using the scRNA-seq data. We finally obtained 7 cell clusters and annotated the cell type of each cluster, including endothelial cells, fibroblasts, hepatocytes, myeloid cells, T/NK cells, B cells and tumor cells (Figure S1A and B). As shown in Figure S1C, most of fibroblasts and B cells came from the tumor samples, indicating their critical roles in the development of HCC. Consistent with the bulk RNA-seq and qRT-PCR analyses, KIF20A and IRAK1 were primarily expressed in cells from tumor tissues, implying that they exerted vital effects for tumor progression. However, the expression levels of ADM, EPO and PPARGC1A were increased in tumor tissues compared with normal tissues, which is inconsistent with the results from the bulk RNA-seq and qRT-PCR analyses. ADM was mainly expressed in myeloid and endothelial cells, while PPARGC1A was mainly expressed in hepatocytes. The expression of EPO was detected in only a small proportion of cells in both tumor and normal samples (Figure S1C).
Evaluation and Validation of the HLPM
In the training and validation cohorts, patients were divided into high- and low-risk groups based on the median value of risk scores. KM analysis revealed that high-risk patients with HCC had poor OS (Figure 3A and B). In the TCGA-LIHC cohort, HLPM had area under curve (AUC) values of 0.677, 0.726, and 0.716 for predicting 1-, 3-, and 5-year OS, respectively (Figure 3C). In the ICGC-LIRI-JP cohort, the 1-, 3-, and 5-year AUC values were 0.850, 0.747, and 0.606, respectively (Figure 3D). The risk score and survival status plots suggested the negative correlation between the risk score and survival time. Furthermore, the risk heat map revealed the differential expression of the five genes in two risk groups (Figure 3E and F). Overall, these results indicate the accuracy and stability of the HLPM.
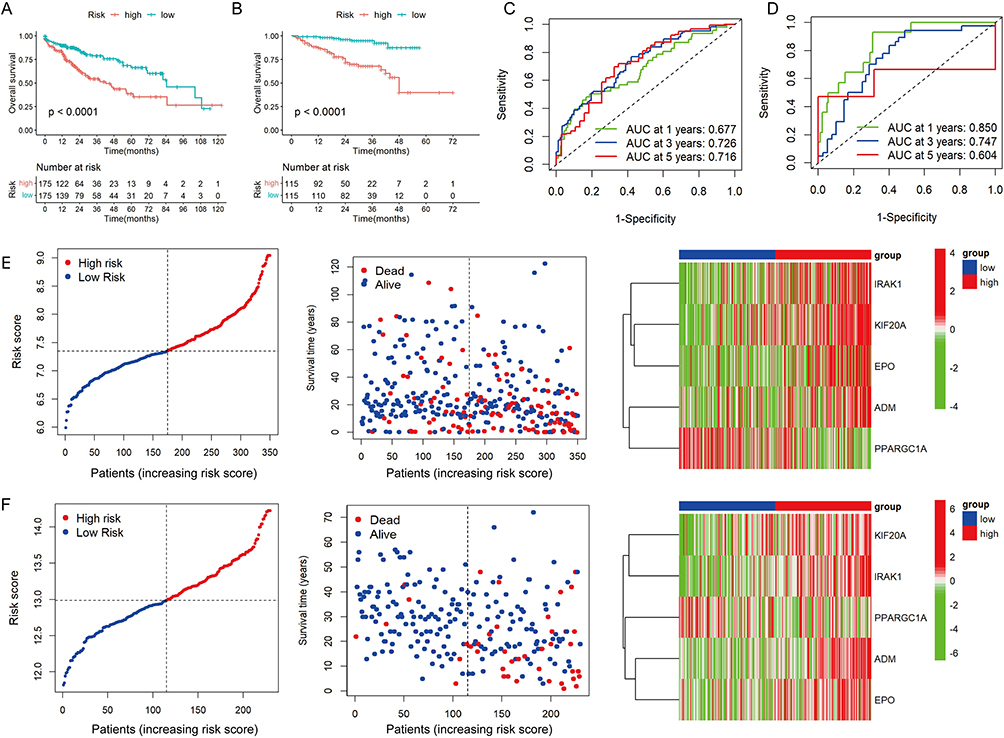 |
Figure 3 Evaluation and validation of the hypoxia- and lactate metabolism-related prognostic model (HLPM). (A and B) Kaplan-Meier survival analysis of two risk groups in the TCGA-LIHC cohort and ICGC-LIRI-JP cohort. (C and D) Receiver operating characteristic (ROC) curve verified the prognostic value of the HLPM in the TCGA-LIHC cohort and ICGC-LIRI-JP cohort. (E and F) Distribution of risk score, survival time and survival status of patients, and expression of the five HLRGs in the TCGA-LIHC cohort and ICGC-LIRI-JP cohort. |
To further verify the universal applicability of the HLPM, we performed a stratification analysis. Patients with HCC were divided to different subgroups based on gender (male vs female), age (≥60 vs <60 years), BMI (≥25 vs <25), AFP level (≥100 vs <100 ng/mL), histological grade (grade 1–2 vs grade 3–4), American Joint Committee on Cancer (AJCC) T stage (T1-2 vs T3-4), AJCC N stage (N0 vs Nx), and AJCC M stage (M0 vs Mx). The KM survival analysis showed that patients with high-risk scores were correlated with poor outcomes in many subgroups (Figure S2A–P).
Functional Enrichment and Mutation Analysis of the Two Risk Groups
A total of 255 upregulated genes and 321 downregulated genes were identified in the high-risk group compared with the low-risk group (Figure 4A). The heat map in Figure 4B shows the expression of the top 50 DEGs with the most significant difference. GSEA analysis based on the GO database indicated that cell cycle DNA replication, chromosome segregation and cytosolic ribosome were enriched in the high-risk group (Figure 4C). Conversely, the low-risk group showed enrichment in signatures related to amino acid catabolic process, fatty acid catabolic process and fatty acid oxidation (Figure 4D). KEGG-based GSEA analysis indicated the proliferation-related pathways were enriched in the high-risk group when compared with the low-risk group (Figure 4E and F). As shown in Figure 4G, no strong correlation between the risk score and tumor mutation burden (TMB). The waterfall plot in Figure 4H and I exhibited the top 10 genes with the highest frequency of mutation in both risk groups. TP53 stood out as the most commonly mutated gene in the high-risk group, while CTNNB1 emerged as the most predominant mutated gene in the low-risk group.
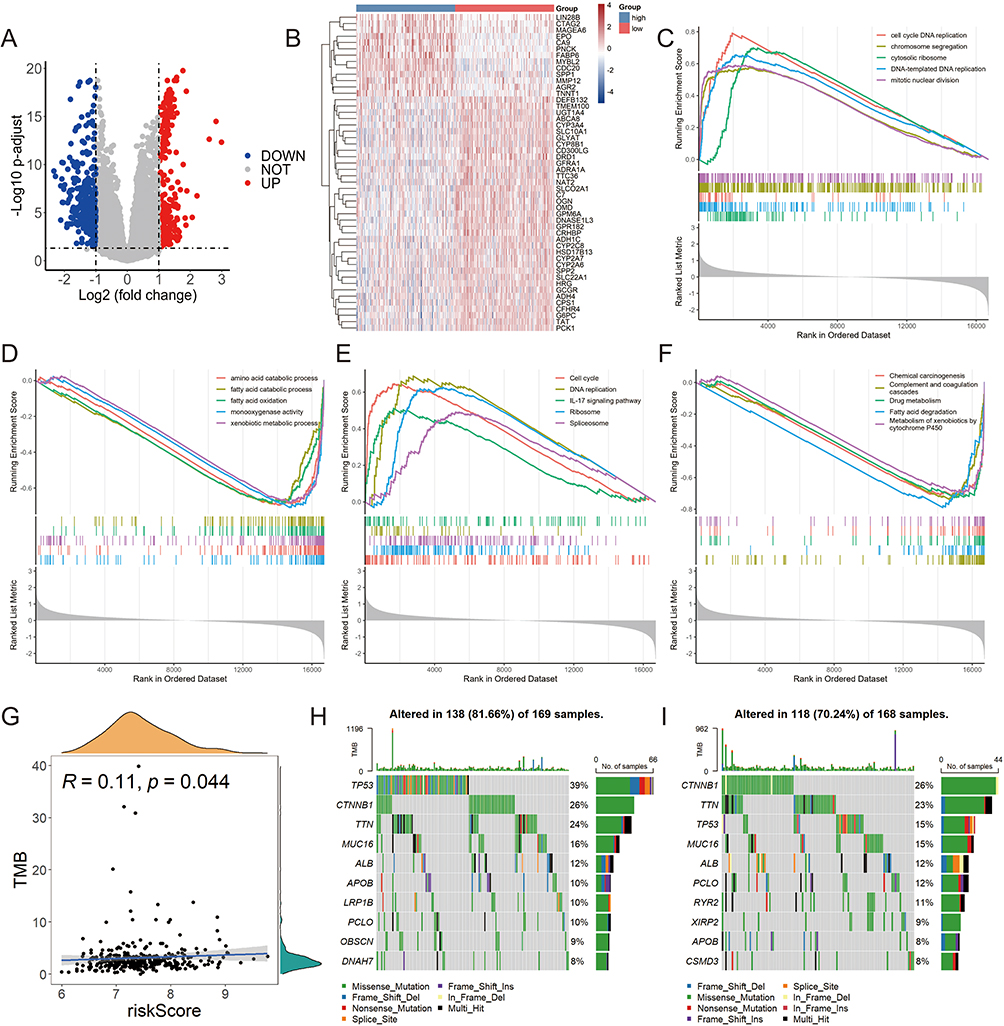 |
Figure 4 Functional enrichment and mutation analysis of two risk groups in TCGA-LIHC cohort. (A) The volcano plot of the differentially expressed genes (DEGs) between high- and low-risk groups. (B) The heat map showed the detailed expression of the top 50 DEGs. GO-based GSEA enrichment analysis in high-risk (C) and low-risk (D) groups. The pathways enriched in the high-risk (E) and low-risk (F) groups according to GSEA analysis in KEGG database. (G) The relationship between the risk score and tumor mutation burden (TMB). Mutation profile in high-risk (H) and low-risk (I) groups. |
Different Immune Landscapes of the Two Risk Groups
To investigate the relation between HLPM and tumor immune microenvironment, we analyzed the expression of immune checkpoint genes (ICGs), chemokines and receptors, as well as the infiltration fractions of immune cells in two risk groups. The results showed that the expression of ICGs, including HAVCR2, TIGIT, PDCD1, LAG3 and CTLA4 were upregulated in the high-risk group (Figure 5A), indicating the immunosuppressive tumor microenvironment in patients with high-risk scores. However, their expression levels only had a very weak positive correlation with the risk scores, which could be caused by the heterogeneity of samples. It is worth noting that HAVCR2 was the most significantly elevated in tumor tissues and had the strongest association with risk scores, while TIGIT was the least elevated and had the weakest correlation with risk scores among the five widely known ICGs (Figure 5B). Key chemokines [eg, C-C motif chemokine ligand 20 (CCL20), C-X-C motif chemokine ligand 8 (CXCL8) and CCL3], which are associated with immunosuppression and tumor progression, were also increased in high-risk group (Figure 5C). By performing ImmuCellAI analysis, we found that the infraction of exhausted immune cells and Tregs in the high-risk group was significantly higher than that in the low-risk group (Figure 5D). CCL20 has been reported to recruit the intratumoral infiltration of Tregs,14 suggesting the reliability of the HLPM and related analysis. Moreover, the results of correlation analysis showed that ADM, EPO, IRAK1, KIF20A and PPARGC1A significantly affected the infiltration of immune cells in HCC, indicating the predictive values of the five biomarkers in the tumor immune microenvironment (Figure 5E). Notably, KIF20A which was the most closely associated with the infiltration of immune cells, had the strongest negative and positive correlation with mucosal-associated invariant T (MAIT) cells infiltration and B cells infiltration respectively. Decreased MAIT cells infiltration has been reported to be associated with poor prognosis of HCC patients,34,35 which consistent with our results. Infiltrating B cells were reported to have dual roles in the progression of HCC,36,37 and our results indicated that ADM-associated B cells would primarily exert effects on promoting HCC. These results indicate the good performance of the HLPM in predicting the immune functions in tumor microenvironment.
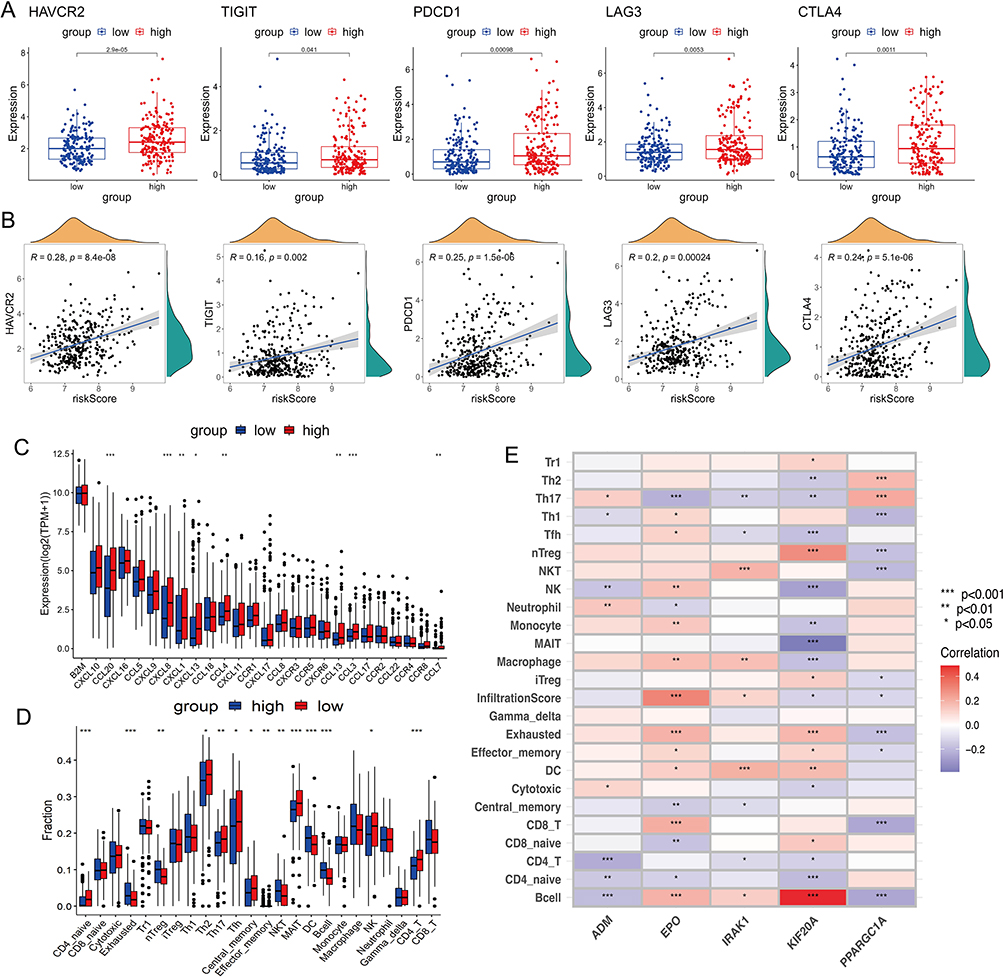 |
Figure 5 Different immune landscapes of the two risk groups in TCGA-LIHC cohort. (A) The expression of immune checkpoint genes (ICGs) (HAVCR2, TIGIT, PDCD1, LAG3 and CTLA4) in high- and low-risk groups. (B) The correlation between levels of ICGs and risk score. (C) The expression of chemokines and receptors in two risk groups. (D) The infiltration fractions of immune cells in two risk groups. (E) The correlation between the infiltration of immune cells and the five HLRGs. TPM, transcripts per million; *p < 0.05; **p < 0.01; ***p < 0.001. |
Prediction of Response to Immunotherapy Between the Two Risk Groups
Next, we evaluated the response of patients to immunotherapy. As shown in Figure 6A, patients in the high-risk group had higher TIDE scores, suggesting that their tumor have the stronger ability to escape immune surveillance. In addition, risk scores were noted to be higher in non-responders compared to responders (Figure 6B). Consistently, the proportion of patients with response to immunotherapy was higher in the low-risk group than that in the high-risk group (39% vs 30%) (Figure 6C). These results demonstrate that patients with high-risk scores are prone to the immunosuppressive tumor microenvironment and thus less sensitive to immunotherapy.
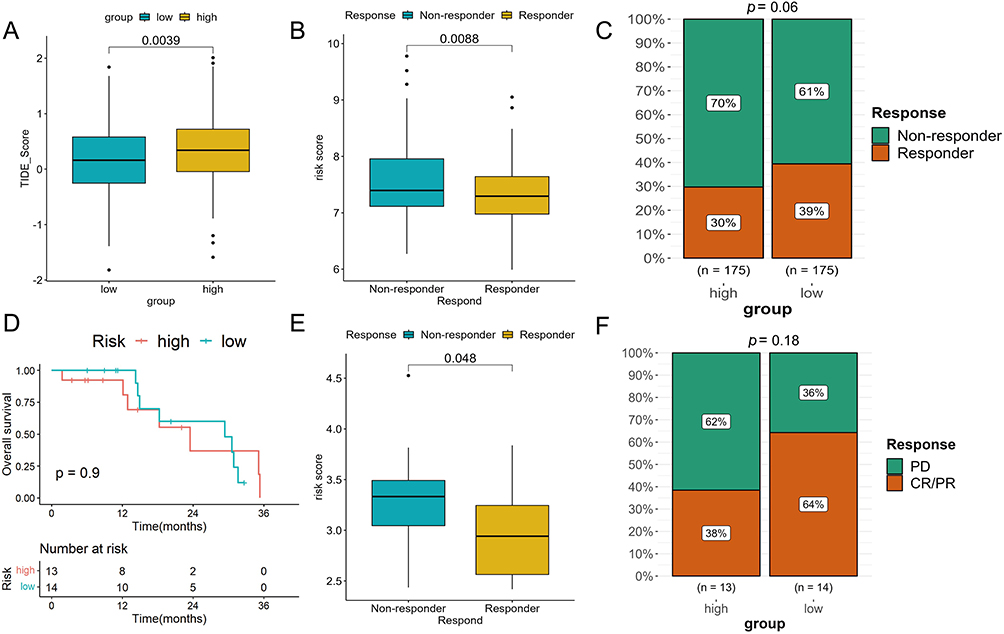 |
Figure 6 The assessment of the response to immunotherapy. (A) Differences in TIDE scores between high- and low-risk groups in TCGA-LIHC cohort. (B) Differences in risk scores between the responders and non-responders in TCGA-LIHC cohort. (C) The proportion of patients with response to immunotherapy in two risk groups in TCGA-LIHC cohort. (D) Kaplan-Meier analysis of two risk groups in GSE78220 cohort. (E) Comparison of the risk scores between the responders and non-responders in GSE78220 cohort. (F) The proportion of patients with response to anti-PD-1 immunotherapy in two risk groups in GSE78220 cohort. |
Furthermore, we tested the capability of the prognostic model in a common real-world immunotherapy cohort (anti-PD-1 in the GSE78220). The KM survival analysis showed no difference in OS between the two risk groups (Figure 6D). However, the risk scores in non-responders were significantly higher than those in responders (Figure 6E). We also found that the low-risk group had a better CR/PR rate compared to the high-risk group (64% vs 38%), indicating a negative correlation between the efficacy of immunotherapy and risk scores (Figure 6F).
Prediction of Response to Potential Chemotherapeutic Agents
To identify the potential chemotherapeutic agents for HCC, we evaluated IC50 values of the drugs in high- and low-risk groups. Our results showed that patients in the low-risk group were more sensitive to GNE-317, NVP-ADW72, savolitinib, foretinib, BIBR-1532, pyridostatin, BMS-754807, LJI308, AZ6102, AZD6482, AT13148 and JQ1, while patients with a high-risk score were more sensitive to WIIKI4, sepantronium bromide and WEHI-539 (Figure S3A–O). Sepantronium bromide has previously been shown to be more sensitive to TP53-mutant HCC patients with poor prognosis in another study,38 which is consistent with our results.
Additionally, we found that KIF20A was positively correlated with the IC50 values of foretinib, LJI308, AZ6102, AZD6482, AT13148 and BMS-754807, but negatively correlated with the IC50 value of WEHI-539. ADM showed a negative association with the IC50 values for foretinib and pyridostatin. IRAK1 was positively associated with the IC50 values of AZ6102, AT13148, foretinib and BIBR-1532. PPARGC1A exhibited a positive correlation with the IC50 of WEHI-539, whereas it displayed a negative correlation with AZD6482 (Figure S3P). Therefore, the HLPM has the potential to guide patients with HCC in receiving more appropriate drug treatment.
Establishment and Evaluation of a Predictive Nomogram
Univariate and multivariate Cox regression analyses in the TCGA-LIHC cohort were conducted to identify independent factors of the prognosis, including risk scores and other clinical characteristics. The results indicated that age, grade and risk score were significantly correlated with OS and had independent prognostic values (Figure 7A and B). Subsequently, the nomogram was constructed to quantitatively predict the 1-, 3-, and 5-year OS of patients with HCC (Figure 7C). The prediction model had a C-index value of 0.734. The calibration curves indicated good performance of the nomogram in predicting patients’ prognosis (Figure 7D). The AUC of 1-, 3-, and 5-year OS predictions were 0.743, 0.784 and 0.770, respectively (Figure 7E). The DCA curves for 1- and 3-year showed that the nomogram could provide more net benefits than clinical characteristics alone (Figure 7F and G).
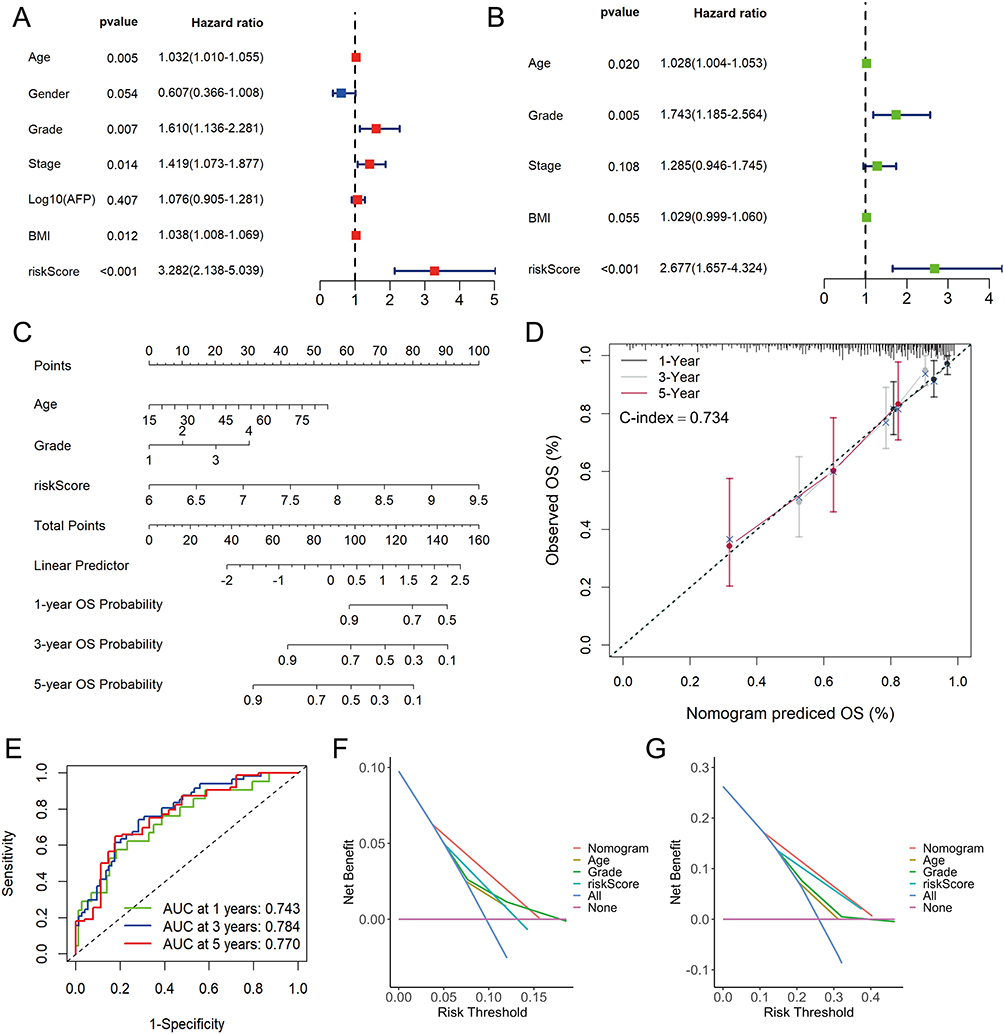 |
Figure 7 Construction and evaluation of nomogram in TCGA-LIHC cohort. The univariate (A) and multivariate (B) Cox regression analysis for risk score and other clinic characteristics. (C) The nomogram for predicting 1-, 3-, and 5-years overall survival (OS) by risk score, age and grade. (D) Calibration curves of the nomogram to predict 1-, 3- and 5-year OS probabilities. (E) Receiver operating characteristic (ROC) curves of the nomogram. Decision curve analysis (DCA) of the nomogram and other clinical characteristics at 1- (F) and 3-year (G) indicated the net clinical benefits. |
Discussion
Hypoxia and lactate are crucial regulators in the development and progression of various cancers. Hypoxia has been reported to reshape tumor immune microenvironment through modulating multiple signaling pathways (eg, HIF, STAT and NF-κB), thus promoting tumor growth.39 Accumulating evidence has also indicated that lactate plays an important role in cell metabolism and immune function.40,41 Lactylation of adenylate kinase 2 at K28 impairs its function and promotes the progression of tumor cells.42 Moreover, hypoxia and lactate contribute to the resistance of therapies, resulting poor prognosis of patients with cancer. HIFs such as HIF-1α and HIF-2α have been reported to endow HCC cells with sorafenib resistance.43 Lactate increases the resistance of gastric cancer cells to anlotinib through regulating BDNF-TrkB pathway, enhancing the interaction between fibroblasts and cancer cells.44 Establishing a hypoxia- and lactate metabolism-related signature is of great significance for predicting prognosis and evaluating therapeutic response in cancer patients.
HCC is a type of solid tumor that characterized by hypoxia and lactate overproduction. Moreover, it has been reported that hypoxia and lactate were intimately associated with therapy resistance and poor prognosis of HCC patients.17,45 Prognostic models based on HRGs or LRGs have been constructed for HCC.46,47 However, no research has been published on a HLPM for HCC, which integrated with the characteristics of both hypoxia and lactate metabolism. Given the heterogeneity of HCC and the strong relationship between hypoxia and lactate metabolism, it remains necessary to construct prognostic models of HLRGs for predicting survival, immune landscape and treatment responses of patients with HCC. To construct the HLPM, we identified five prognostic HLRGs including ADM, EPO, IRAK1, KIF20A and PPARGC1A, whose expression levels and distributions were demonstrated by the bulk RNA-seq, qRT-PCR and scRNA-seq analyses. However, inconsistent with the results from scRNA-seq analysis, the expression levels of ADM, EPO and PPARGC1A were downregulated in tumor tissues compared with normal tissues in the bulk RNA-seq and qRT-PCR analyses, which could be attributed to the heterogeneity among clinical samples and different detection depths. Multidimensional analysis verified the stability and reliability of the HLPM in predicting the prognosis of patients. The GSEA results indicated a significant enrichment of genes related to cell cycle and DNA replication in the high-risk group compared to the low-risk group, potentially resulting in the poor efficacy and survival of the high-risk patients. Although there was no strong correlation between risk scores and TMB, the mutation profiles were different between two risk groups.
Tumor immune microenvironment is significantly correlated with tumor progression and the response to immunotherapy.48–50 Our study found that the levels of critical ICGs were significantly upregulated in the high-risk group compared to the low-risk group and were positively correlated with risk scores. TIDE score was also noted to be increased in these patients. In the recent years, immunotherapy has made significant advances in the management of HCC, and one of the most promising therapies is the combination of atezolizumab and bevacizumab.6,51,52 However, the response of each patient to immunotherapy varies, necessitating the need for a signature that can predict efficacy.53,54 In this study, the HLPM was applied into the prediction of response to immunotherapy, and the results indicated that the negative association between risk scores and immunotherapy response. The HLPM was validated in the immunotherapy cohort GSE78220, showing good performance in predicting immunotherapy efficacy.
Our study also analyzed the sensitivity of potential drugs in treating HCC. We found that IC50 values of major chemical agents were higher in the high-risk group, while some drugs such as WIKI4, sepantronium bromide and WEHI-539 were more sensitive to patients at high risk. Correlation analysis further illustrated the close association between the five HLRGs and the sensitivity of potential chemical agents. Our findings provide new options for personalized treatment of HCC.
Nomograms have been widely used in predicting survival of patients through computing scores of different risk factors. In order to make the prognostic model more targeted and more comprehensive for clinical practice, we constructed a nomogram based on the risk scores of HLPM and clinical characteristics. The novel nomogram integrated with age, histological grade and risk scores of HLPM exhibited a better capacity in prognosis prediction and could provide more net benefits than clinical characteristics or HLPM alone. Our results would offer a novel option for personalized decision-making in HCC management.
However, our study has several limitations. First, the expression profiles of HCC patients were obtained from public databases such as TCGA and ICGC, which may introduce selection bias. Therefore, further prospective studies with large cohorts are needed to validate the reliability of this prognostic signature. In addition, the underlying mechanisms by which the five HLRGs affect tumor progression and therapeutic efficacy need to be demonstrated in cell and animal experiments.
Conclusion
In summary, our study identified five HLRGs that exhibited favorable prediction performance. Using these HLRGs, we constructed a prognostic model for HCC, which can reliably predict the clinical outcome and therapeutic responses of patients with HCC. Finally, we developed a nomogram integrated with age, histological grade, and risk score of HLPM, presenting a novel option for personalized decision-making in HCC management.
Data Sharing Statement
All data generated or analyzed during this study are available in this article. Further enquiries can be directed to the corresponding author Xiao Xu (Email: [email protected]).
Ethics Statement
This study was conducted according to the ethical guidelines of the 1975 Declaration of Helsinki. This research was approved by the Medical Ethics Committee of the hospitals. All patients included in the current study have provided written informed consent and agreed the application of their deidentified data.
Acknowledgments
We sincerely thank the TCGA, ICGC, GTEx, and HPA projects for their free use and the kind help and support from Chen Xu, Chenchen Shen, Wenbin Zhu and the Shulan (Hangzhou) Hospital. This research was funded by Zhejiang Provincial Natural Science Foundation (grant number LY22H160048 and LQ20H160029), the Major Research Plan of the National Natural Science Foundation of China (grant number 92159202) and the Youth Program of National Natural Science Foundation of China (grant number 82003248).
Disclosure
The authors report no conflicts of interest in this work.
References
1. Sung H, Ferlay J, Siegel RL, et al. Global cancer statistics 2020: GLOBOCAN estimates of incidence and mortality worldwide for 36 cancers in 185 countries. CA Cancer J Clin. 2021;71(3):209–249. doi:10.3322/caac.21660
2. Badwei N. Hepatocellular carcinoma gene expression: the new era, where it goes? iLIVER. 2023;2(1):36–40. doi:10.1016/j.iliver.2022.12.001
3. Llovet JM, Kelley RK, Villanueva A, et al. Hepatocellular carcinoma. Nat Rev Dis Primers. 2021;7(1):6. doi:10.1038/s41572-020-00240-3
4. Finn RS, Qin S, Ikeda M, et al. Atezolizumab plus bevacizumab in unresectable hepatocellular carcinoma. N Engl J Med. 2020;382(20):1894–1905. doi:10.1056/NEJMoa1915745
5. Kudo M, Finn RS, Qin S, et al. Lenvatinib versus sorafenib in first-line treatment of patients with unresectable hepatocellular carcinoma: a randomised Phase 3 non-inferiority trial. Lancet. 2018;391(10126):1163–1173. doi:10.1016/s0140-6736(18)30207-1
6. Llovet JM, Castet F, Heikenwalder M, et al. Immunotherapies for hepatocellular carcinoma. Nat Rev Clin Oncol. 2022;19(3):151–172. doi:10.1038/s41571-021-00573-2
7. Xia S, Pan Y, Liang Y, Xu J, Cai X. The microenvironmental and metabolic aspects of sorafenib resistance in hepatocellular carcinoma. EBioMedicine. 2020;51:102610. doi:10.1016/j.ebiom.2019.102610
8. Liu Y, Xun Z, Ma K, et al. Identification of a tumour immune barrier in the HCC microenvironment that determines the efficacy of immunotherapy. J Hepatol. 2023;78(4):770–782. doi:10.1016/j.jhep.2023.01.011
9. Sin SQ, Mohan CD, Goh RMW, et al. Hypoxia signaling in hepatocellular carcinoma: challenges and therapeutic opportunities. Cancer Metastasis Rev. 2022. doi:10.1007/s10555-022-10071-1
10. Zhuang Y, Liu K, He Q, Gu X, Jiang C, Wu J. Hypoxia signaling in cancer: implications for therapeutic interventions. MedComm. 2023;4(1):e203. doi:10.1002/mco2.203
11. Ling S, Shan Q, Zhan Q, et al. USP22 promotes hypoxia-induced hepatocellular carcinoma stemness by a HIF1α/USP22 positive feedback loop upon TP53 inactivation. Gut. 2020;69(7):1322–1334. doi:10.1136/gutjnl-2019-319616
12. Wu H, Wang T, Liu Y, et al. Mitophagy promotes sorafenib resistance through hypoxia-inducible ATAD3A dependent Axis. J Exp Clin Cancer Res. 2020;39(1):274. doi:10.1186/s13046-020-01768-8
13. Hu W, Zheng S, Guo H, et al. PLAGL2-EGFR-HIF-1/2α Signaling Loop Promotes HCC Progression and Erlotinib Insensitivity. Hepatology. 2021;73(2):674–691. doi:10.1002/hep.31293
14. Suthen S, Lim CJ, Nguyen PHD, et al. Hypoxia-driven immunosuppression by Treg and type-2 conventional dendritic cells in HCC. Hepatology. 2022;76(5):1329–1344. doi:10.1002/hep.32419
15. Zhang X, Li Y, Ma Y, et al. Yes-associated protein (YAP) binds to HIF-1α and sustains HIF-1α protein stability to promote hepatocellular carcinoma cell glycolysis under hypoxic stress. J Exp Clin Cancer Res. 2018;37(1):216. doi:10.1186/s13046-018-0892-2
16. Xu Y, Hao X, Ren Y, et al. Research progress of abnormal lactate metabolism and lactate modification in immunotherapy of hepatocellular carcinoma. Front Oncol. 2022;12:1063423. doi:10.3389/fonc.2022.1063423
17. Du D, Liu C, Qin M, et al. Metabolic dysregulation and emerging therapeutical targets for hepatocellular carcinoma. Acta Pharm Sin B. 2022;12(2):558–580. doi:10.1016/j.apsb.2021.09.019
18. Kotsiliti E. Lactylation and HCC progression. Nat Rev Gastroenterol Hepatol. 2023;20(3):131. doi:10.1038/s41575-023-00746-7
19. Xu C, Xia Y, Zhang BW, et al. Macrophages facilitate tumor cell PD-L1 expression via an IL-1β-centered loop to attenuate immune checkpoint blockade. MedComm. 2023;4(2):e242. doi:10.1002/mco2.242
20. Zhao Y, Li M, Yao X, et al. HCAR1/MCT1 regulates tumor ferroptosis through the lactate-mediated AMPK-SCD1 activity and its therapeutic implications. Cell Rep. 2020;33(10):108487. doi:10.1016/j.celrep.2020.108487
21. Pan L, Feng F, Wu J, et al. Demethylzeylasteral targets lactate by inhibiting histone lactylation to suppress the tumorigenicity of liver cancer stem cells. Pharmacol Res. 2022;181:106270. doi:10.1016/j.phrs.2022.106270
22. Gu J, Zhou J, Chen Q, et al. Tumor metabolite lactate promotes tumorigenesis by modulating MOESIN lactylation and enhancing TGF-β signaling in regulatory T cells. Cell Rep. 2022;39(12):110986. doi:10.1016/j.celrep.2022.110986
23. Liberzon A, Birger C, Thorvaldsdóttir H, Ghandi M, Mesirov JP, Tamayo P. The Molecular Signatures Database (MSigDB) hallmark gene set collection. Cell Syst. 2015;1(6):417–425. doi:10.1016/j.cels.2015.12.004
24. Lu Y, Yang A, Quan C, et al. A single-cell atlas of the multicellular ecosystem of primary and metastatic hepatocellular carcinoma. Nat Commun. 2022;13(1):4594. doi:10.1038/s41467-022-32283-3
25. Ma L, Heinrich S, Wang L, et al. Multiregional single-cell dissection of tumor and immune cells reveals stable lock-and-key features in liver cancer. Nat Commun. 2022;13(1):7533. doi:10.1038/s41467-022-35291-5
26. Miao YR, Zhang Q, Lei Q, et al. ImmuCellAI: a unique method for comprehensive T-cell subsets abundance prediction and its application in cancer immunotherapy. Adv Sci. 2020;7(7):1902880. doi:10.1002/advs.201902880
27. Fu J, Li K, Zhang W, et al. Large-scale public data reuse to model immunotherapy response and resistance. Genome Med. 2020;12(1):21. doi:10.1186/s13073-020-0721-z
28. Hugo W, Zaretsky JM, Sun L, et al. Genomic and transcriptomic features of response to anti-PD-1 therapy in metastatic melanoma. Cell. 2016;165(1):35–44. doi:10.1016/j.cell.2016.02.065
29. Maeser D, Gruener RF, Huang RS. oncoPredict: an R package for predicting in vivo or cancer patient drug response and biomarkers from cell line screening data. Brief Bioinform. 2021;22(6):bbab260.
30. Yang W, Soares J, Greninger P, et al. Genomics of Drug Sensitivity in Cancer (GDSC): a resource for therapeutic biomarker discovery in cancer cells. Nucleic Acids Res. 2013;41(Database issue):D955–D961. doi:10.1093/nar/gks1111
31. Gao X, Zhao C, Zhang N, et al. Genetic expression and mutational profile analysis in different pathologic stages of hepatocellular carcinoma patients. BMC Cancer. 2021;21(1):786. doi:10.1186/s12885-021-08442-y
32. Zuo Q, He J, Zhang S, et al. PPARγ coactivator-1α suppresses metastasis of hepatocellular carcinoma by inhibiting Warburg effect by PPARγ-dependent WNT/β-catenin/pyruvate dehydrogenase kinase isozyme 1 axis. Hepatology. 2021;73(2):644–660. doi:10.1002/hep.31280
33. Wang C, Dong L, Li X, et al. The PGC1α/NRF1-MPC1 axis suppresses tumor progression and enhances the sensitivity to sorafenib/doxorubicin treatment in hepatocellular carcinoma. Free Radic Biol Med. 2021;163:141–152. doi:10.1016/j.freeradbiomed.2020.11.035
34. Ruf B, Bruhns M, Babaei S, et al. Tumor-associated macrophages trigger MAIT cell dysfunction at the HCC invasive margin. Cell. 2023;186(17):3686–3705.e32. doi:10.1016/j.cell.2023.07.026
35. Healy K, Pavesi A, Parrot T, et al. Human MAIT cells endowed with HBV specificity are cytotoxic and migrate towards HBV-HCC while retaining antimicrobial functions. JHEP Rep. 2021;3(4):100318. doi:10.1016/j.jhepr.2021.100318
36. Faggioli F, Palagano E, Di Tommaso L, et al. B lymphocytes limit senescence-driven fibrosis resolution and favor hepatocarcinogenesis in mouse liver injury. Hepatology. 2018;67(5):1970–1985. doi:10.1002/hep.29636
37. Qin M, Wang D, Fang Y, et al. Current perspectives on B lymphocytes in the immunobiology of hepatocellular carcinoma. Front Oncol. 2021;11:647854. doi:10.3389/fonc.2021.647854
38. Yang C, Huang X, Li Y, Chen J, Lv Y, Dai S. Prognosis and personalized treatment prediction in TP53-mutant hepatocellular carcinoma: an in silico strategy towards precision oncology. Brief Bioinform. 2021;22(3):bbaa164.
39. Castillo-Rodríguez RA, Trejo-Solís C, Cabrera-Cano A, Gómez-Manzo S, Dávila-Borja VM. Hypoxia as a modulator of inflammation and immune response in cancer. Cancers. 2022;14(9):2291.
40. Chen L, Huang L, Gu Y, Cang W, Sun P, Xiang Y. Lactate-lactylation hands between metabolic reprogramming and immunosuppression. Int J Mol Sci. 2022;23(19):11943.
41. Ippolito L, Comito G, Parri M, et al. Lactate Rewires Lipid Metabolism and Sustains a Metabolic-Epigenetic Axis in Prostate Cancer. Cancer Res. 2022;82(7):1267–1282. doi:10.1158/0008-5472.Can-21-0914
42. Yang Z, Yan C, Ma J, et al. Lactylome analysis suggests lactylation-dependent mechanisms of metabolic adaptation in hepatocellular carcinoma. Nat Metab. 2023;5(1):61–79. doi:10.1038/s42255-022-00710-w
43. Méndez-Blanco C, Fondevila F, Fernández-Palanca P, et al. Stabilization of hypoxia-inducible factors and BNIP3 promoter methylation contribute to acquired sorafenib resistance in human hepatocarcinoma cells. Cancers. 2019;11(12):1984.
44. Jin Z, Lu Y, Wu X, et al. The cross-talk between tumor cells and activated fibroblasts mediated by lactate/BDNF/TrkB signaling promotes acquired resistance to anlotinib in human gastric cancer. Redox Biol. 2021;46:102076. doi:10.1016/j.redox.2021.102076
45. Bao MH, Wong CC. Hypoxia, metabolic reprogramming, and drug resistance in liver cancer. Cells. 2021;10(7). doi:10.3390/cells10071715
46. Guan Q, Pan J, Ren N, Qiao C, Wei M, Li Z. Identification of novel lactate metabolism signatures and molecular subtypes for prognosis in hepatocellular carcinoma. Front Cell Dev Biol. 2022;10:960277. doi:10.3389/fcell.2022.960277
47. Zhang B, Tang B, Gao J, Li J, Kong L, Qin L. A hypoxia-related signature for clinically predicting diagnosis, prognosis and immune microenvironment of hepatocellular carcinoma patients. J Transl Med. 2020;18(1):342. doi:10.1186/s12967-020-02492-9
48. Zhu Y, Qin LX. Strategies for improving the efficacy of immunotherapy in hepatocellular carcinoma. Hepatobiliary Pancreat Dis Int. 2022;21(5):420–429. doi:10.1016/j.hbpd.2022.08.003
49. Gu Y, Xu S, Wang Z, et al. When immunotherapy meets liver transplantation for hepatocellular carcinoma: a bumpy but promising road. Chin J Cancer Res. 2023;35(2):92–107. doi:10.21147/j.issn.1000-9604.2023.02.02
50. Qian Y, Yang T, Liang H, Deng M. Myeloid checkpoints for cancer immunotherapy. Chin J Cancer Res. 2022;34(5):460–482. doi:10.21147/j.issn.1000-9604.2022.05.07
51. Khan AA, Liu ZK, Xu X. Recent advances in immunotherapy for hepatocellular carcinoma. Hepatobiliary Pancreat Dis Int. 2021;20(6):511–520. doi:10.1016/j.hbpd.2021.06.010
52. Yuan J, Xu L, Zhou J, Shen L. Application of immune checkpoint inhibitors in hepatobiliary cancers. iLIVER. 2022;1(1):43–48. doi:10.1016/j.iliver.2022.03.002
53. Xiong J, Wang QQ. Mechanisms and strategies to overcome immunotherapy resistance in hepatobiliary malignancies. Hepatobiliary Pancreat Dis Int. 2022;21(5):430–439. doi:10.1016/j.hbpd.2022.07.006
54. Yang R, Li Y, Wang H, Qin T, Yin X, Ma X. Therapeutic progress and challenges for triple negative breast cancer: targeted therapy and immunotherapy. Mol Biomed. 2022;3(1):8. doi:10.1186/s43556-022-00071-6
 © 2024 The Author(s). This work is published and licensed by Dove Medical Press Limited. The
full terms of this license are available at https://www.dovepress.com/terms
and incorporate the Creative Commons Attribution
- Non Commercial (unported, 3.0) License.
By accessing the work you hereby accept the Terms. Non-commercial uses of the work are permitted
without any further permission from Dove Medical Press Limited, provided the work is properly
attributed. For permission for commercial use of this work, please see paragraphs 4.2 and 5 of our Terms.
© 2024 The Author(s). This work is published and licensed by Dove Medical Press Limited. The
full terms of this license are available at https://www.dovepress.com/terms
and incorporate the Creative Commons Attribution
- Non Commercial (unported, 3.0) License.
By accessing the work you hereby accept the Terms. Non-commercial uses of the work are permitted
without any further permission from Dove Medical Press Limited, provided the work is properly
attributed. For permission for commercial use of this work, please see paragraphs 4.2 and 5 of our Terms.
Recommended articles
Histological Severity of Cirrhosis Influences Surgical Outcomes of Hepatocellular Carcinoma After Curative Hepatectomy
Liang BY, Gu J, Xiong M, Zhang EL, Zhang ZY, Lau WY, Wang SF, Guan Y, Chen XP, Huang ZY
Journal of Hepatocellular Carcinoma 2022, 9:633-647
Published Date: 23 July 2022
Nomogram for the Preoperative Prediction of the Macrotrabecular-Massive Subtype of Hepatocellular Carcinoma
Shan Y, Yu X, Yang Y, Sun J, Wu S, Mao S, Lu C
Journal of Hepatocellular Carcinoma 2022, 9:717-728
Published Date: 10 August 2022
Identification and Validation of Ferroptosis-Related Subtypes and a Predictive Signature in Hepatocellular Carcinoma
Zheng C, Peng Y, Wang H, Wang Y, Liu L, Zhao Q
Pharmacogenomics and Personalized Medicine 2023, 16:39-58
Published Date: 26 January 2023
Beta2-Microglobulin as Predictive Biomarkers in the Prognosis of Hepatocellular Carcinoma and Development of a New Nomogram
Lin Q, Jiang Z, Mo D, Liu F, Qin Y, Liang Y, Cheng Y, Huang H, Fang M
Journal of Hepatocellular Carcinoma 2023, 10:1813-1825
Published Date: 11 October 2023
Development and Validation of a Prognostic Nomogram for Patients with AFP and DCP Double-Negative Hepatocellular Carcinoma After Local Ablation
Qiao W, Li J, Wang Q, Jin R, Zhang H
Journal of Hepatocellular Carcinoma 2024, 11:271-284
Published Date: 3 February 2024