
Back to Journals » Cancer Management and Research » Volume 17

Prognostic Significance of R-Loops in Lung Adenocarcinoma: Implications for Immune Response and Drug Sensitivity
Authors Jiang J, Zhang Y  , Men B , He Y, Yun L, Li F, Rao X, Cai K , Rao S
Received 10 April 2025
Accepted for publication 29 July 2025
Published 12 August 2025 Volume 2025:17 Pages 1625—1642
DOI https://doi.org/10.2147/CMAR.S533571
Checked for plagiarism Yes
Review by Single anonymous peer review
Peer reviewer comments 2
Editor who approved publication: Professor Yong Teng
Jianjun Jiang,* Yingxin Zhang,* Biying Men,* Yujing He, Liang Yun, Fangfang Li, Xuguang Rao, Kaican Cai, Shuan Rao
Department of Thoracic Surgery, Nanfang Hospital, Southern Medical University, Guangzhou, Guangdong, People’s Republic of China
*These authors contributed equally to this work
Correspondence: Kaican Cai, Email [email protected] Shuan Rao, Email [email protected]
Background: R-loops, RNA-DNA hybrid structures, play essential roles in maintaining genomic stability and regulating transcription. This study aims to identify key R-loop regulatory genes as prognostic markers for LUAD and explore their associations with immunotherapy response and drug sensitivity, supporting personalized treatment strategies.
Methods: We integrated 1771 R-loops genes with differentially expressed genes in LUAD. Through univariate Cox, LASSO, and multivariate Cox analyses, we constructed an R-loops prognostic risk score (R-loops Score) and validated it in three independent GEO cohorts. Correlations with clinical variables, immune features, and drug response were examined. Key genes were further evaluated by qPCR and Western blot in LUAD cell lines and tumor tissues.
Results: Patients with high R-loops Scores had significantly poorer overall survival compared with low-score patients. A nomogram combining the R-loops Score and clinical factors achieved AUCs of 0.732, 0.713, and 0.719 for predicting 1-, 2-, and 5-year OS, respectively. Pathway enrichment indicated that high-score tumors were enriched in cell cycle regulation, phase separation, and epithelial-mesenchymal transition. High R-loops Scores were associated with male sex, advanced stages, immune evasion and immunotherapy resistance, but increased chemotherapy and targeted therapy sensitivity. EIF3B was further validated as a key gene through analysis of a local patient cohort.
Conclusion: The R-loops Score represents a promising prognostic tool for LUAD, offering valuable insights into survival outcomes, immune characteristics and drug responsiveness. Notably, qPCR and Western blot validation consistently confirmed EIF3B as a key gene, further supporting their potential as biomarkers. These results support future research and serve as a reference for the personalized precision treatment of LUAD.
Keywords: lung adenocarcinoma, RNA-DNA hybrid structures, prognosis, immune response, drug sensitivity
Introduction
LUAD is the most common histological subtype of lung cancer and remains a leading cause of cancer-related mortality worldwide.1,2 Despite advances in diagnosis and treatment, the prognosis of LUAD patients remains poor, largely due to the high heterogeneity of the disease and its complex tumor microenvironment.3,4 Consequently, there is an urgent need to identify novel biomarkers and therapeutic targets to improve prognostic predictions and optimize personalized treatment strategies.
R-loops are triple-stranded structures formed during transcription, consisting of an RNA-DNA hybrid and a displaced single-stranded DNA region.5 These structures are known to play critical roles in maintaining genomic stability, regulating transcription, and influencing chromatin dynamics.6,7 While these canonical roles are well established, recent findings suggest that R-loops may also contribute more broadly to cancer progression. Increasing evidence indicates that R-loops influence not only genome integrity but also the tumor microenvironment. For instance, R-loop–derived cytoplasmic RNA–DNA hybrids can activate the cGAS–STING pathway and type I interferon signaling, affecting antigen presentation and thus modulating tumor immunity.8,9 Single-cell transcriptomic studies have revealed that R-loop patterns are associated with metabolic reprogramming and T cell exhaustion in cancer, characterized by elevated glycolytic activity and mitochondrial dysfunction.10 These analyses also highlight substantial heterogeneity in R-loop regulatory gene expression across immune and metabolic compartments within the tumor microenvironment, underscoring their potential as functional biomarkers and therapeutic targets.
R-loops are commonly detected using high-throughput techniques such as DNA-RNA immunoprecipitation sequencing (DRIP-seq) and R-ChIP, which enable genome-wide profiling of their distribution and abundance. Several genes involved in R-loop formation or resolution—such as DDX5, EIF4A3, and RNASEH2A—have been implicated in transcriptional regulation, DNA damage response, and tumor progression; however, their specific roles in LUAD remain largely undefined.11–13 While aberrant R-loop accumulation has been associated with various diseases,14 both their mechanistic roles in LUAD and their value as prognostic or predictive biomarkers have not been systematically explored.
Recent advances in high-throughput sequencing technologies and machine learning have provided new approaches for investigating cancer mechanisms.15,16 Zhang et al utilized single-cell technologies to investigate the connections between R-loops and immune evasion and metabolic reprogramming, highlighting their impact on cancer progression.10 Although a previous study has explored the relationship between R-loops and the prognosis of LUAD,17 it was likely limited by a small sample size and lacked a comprehensive analysis of pathway enrichment, immune characteristics, and drug sensitivity associated with R-loops. Therefore, there is an urgent need for a more detailed investigation into a prognostic model based on R-loops.
In this study, we conducted an integrated analysis of R-loops genes in LUAD to identify key regulatory genes. By developing a novel R-loops prognostic risk score model (R-loops Score), we aimed to assess its predictive value for overall survival and explore its associations with immune characteristics and drug sensitivity. Additionally, we investigated the underlying biological pathways and clinical implications of the R-loops Score. To further validate our findings, qPCR and Western blot analyses consistently confirmed EIF3B as a key gene, supporting its potential as a prognostic biomarker. This comprehensive analysis seeks to provide new insights into the role of R-loops in LUAD progression and offers potential guidance for personalized treatment strategies.
Methods
Data Source
We collected 803, 612, and 469 R-loop-associated proteins from three independent studies.18–20 From the R-loopBase database (https://rloopbase.nju.edu.cn/index.jsp), we downloaded the file “gene_list_of_R-loop_regulators.gz” and extracted 1185 human R-loop regulators. These datasets were integrated, and all protein or gene identifiers were standardized to gene symbols using R. After removing duplicates, we compiled a comprehensive, non-redundant list of 1,771 R-loop-associated genes.
Gene expression data and clinical information for TCGA-LUAD were obtained from the UCSC Xena database (https://xenabrowser.net/datapages/). Additionally, we retrieved expression and clinical data for four Affymetrix microarray cohorts (GSE50081, GSE31210, and GSE29013) from the Gene Expression Omnibus (GEO) database (https://www.ncbi.nlm.nih.gov/geo/).21–24
For TCGA-LUAD, gene expression data in FPKM format were downloaded and converted to TPM format using R.25 For the Affymetrix microarray datasets, we downloaded the raw CEL files for each dataset. Background correction, normalization, and summarization were performed using the Robust Multi-array Average (RMA) method with the R affy and simpleaffy packages.26
Construction of R-Loops Prognostic Risk Score Model
Differentially expressed genes (DEGs) were identified using the edgeR R package and intersected with the R-loop-associated gene set. Subsequently, univariate Cox regression, LASSO (Least Absolute Shrinkage and Selection Operator) regression, and multivariate Cox regression analyses were performed to identify nine core genes. These nine genes were used to construct the R-loops prognostic risk score model. The scoring formula for the model is as follows:

Expr represents the gene expression level, and Coef represents the weight coefficients of the genes.
Differential Gene Expression Analysis and Functional Enrichment Analysis
Differential gene expression analysis was conducted using the edgeR R package,27 with thresholds set at p < 0.05, FDR < 0.1, and |log2FC| > 1. Gene Ontology (GO) and Kyoto Encyclopedia of Genes and Genomes (KEGG) enrichment analyses were performed using the clusterProfiler R package.28,29 Gene Set Enrichment Analysis (GSEA) was conducted using the GSVA R package.30
Immune Infiltration Analysis
Immune infiltration analysis was conducted to estimate immune cell composition from bulk RNA-seq data. The Immunedeconv R package was employed, integrating multiple immune infiltration methods, including MCP-counter, quanTIseq, EPIC, ESTIMATE, ssGSEA, xCell, TIMER, and CIBERSORT.31–38
Immune Therapy Response and Drug Sensitivity
The response to immunotherapy was evaluated using the Tumor Immune Dysfunction and Exclusion (TIDE) algorithm (http://tide.dfci.harvard.edu/), and TIDE scores were calculated for each TCGA-LUAD patient. Patients were then stratified into high and low TIDE score groups based on the median value, and differences in R-loops Scores between the two groups were assessed using the Wilcoxon rank-sum test. Patients were categorized as responders (True) or non-responders (False) according to TIDE predictions. The association between R-loops Score groups (high vs low, based on median) and immunotherapy response status was evaluated using the Chi-square test.
Drug sensitivity analysis was performed by predicting the IC50 values of chemotherapeutic agents in TCGA-LUAD patients using the oncoPredict R package,39 based on cell line IC50 data from the Genomics of Drug Sensitivity in Cancer (GDSC) database (https://www.cancerrxgene.org). Patients were then stratified into high and low R-loops Score groups according to the median score. The predicted IC50 values for each drug were compared between the two groups using the Wilcoxon rank-sum test.
RNA Extraction and Quantification of Key Gene Expression
Total RNA was extracted from normal human bronchial epithelial cells (Beas-2B) and three LUAD cell lines (PC9, A549, and HCC827). All the cell lines were obtained from CHINA CENTER FOR TYPE CULTURE COLLECTION(CCTCC). Additionally, fresh tumor and adjacent non-tumor tissues were collected from LUAD patients undergoing surgical treatment at Nanfang Hospital, Southern Medical University. The mRNA expression levels of key genes in these cell lines, normal cells, and tissue samples were analyzed using qPCR, with primer sequences detailed in Table S1. The study protocol was approved by the Institutional Review Board of Nanfang Hospital, Southern Medical University (Ethics Approval No.: NFEC-202408-K24). Patient-derived lung cancer samples and paraffin-embedded tissues were obtained from the Department of Thoracic Surgery at Nanfang Hospital, with all patients providing written informed consent.
Western Blot
Total cellular proteins were extracted using RIPA lysis buffer (Biotech, China) on ice for 10 minutes. Protein concentrations were determined with a BCA assay kit (Biotech, China) according to the manufacturer’s instructions. Equal amounts of protein samples were resolved by SDS-PAGE with 8% or 10% gels, followed by electrotransfer onto PVDF membranes. The membranes were blocked with 5% non-fat dry milk in TBST at room temperature for 1 hour and then incubated overnight at 4 °C with the appropriate primary antibodies. After washing, membranes were incubated with HRP-conjugated secondary antibodies at ambient temperature for 1 hour. Finally, protein signals were detected using NcmECL SuperUltra chemiluminescence reagent (NCM Biotech, P10060).
Statistical Analysis
Statistical analyses were performed using R software (version 4.3.2). Kaplan-Meier survival curves were generated with the survival package, and the Log rank test was applied to determine statistical significance. Univariate and multivariate Cox proportional-hazards regression analyses were conducted using the survival package to assess the relationship between gene expression, clinical variables, and patient survival. Prognostic gene selection was performed through LASSO regression using the glmnet package. Time-dependent ROC analysis was carried out using the timeROC package to evaluate the predictive performance of the risk model, with results presented as the area under the curve (AUC).
Statistical tests, including the Chi-square test, Wilcoxon rank-sum test, Kruskal–Wallis test, and Pearson correlation analysis, were conducted with the stats package. A p-value < 0.05 was considered statistically significant. The following symbols were used to indicate significance levels: * indicates p < 0.05, ** indicates p < 0.01, and *** indicates p < 0.001.
Results
Construction of R-Loops Prognostic Risk Score Model (R-Loops Score)
The study design is illustrated in a flowchart (Figure 1). We collected 803, 612, and 469 R-loops-associated proteins from three independent studies18–20 and supplemented this collection with 1185 R-loop regulators(human) obtained from the R-loopBase database (https://rloopbase.nju.edu.cn/index.jsp). After removing duplicates, we compiled a non-redundant list of 1771 R-loops genes. Additionally, differential expression analysis was performed on the TCGA-LUAD dataset, resulting in the identification of 4863 differentially expressed genes (DEGs) (Figure 2a). By intersecting the DEGs with the R-loops gene set, we identified 197 R-loops genes that were differentially expressed in LUAD (Figure 2b).
 |
Figure 1 Workflow for the construction and validation of the R-loops prognostic risk score model (R-loops Score). Note: Red text highlights key methods and validation steps. |
 |
Figure 2 Identification of hub R-loops genes. (a) Volcano plot showing the differentially expressed genes (DEGs) between cancer and normal tissues. Red points represent upregulated genes, blue points represent downregulated genes, and gray points represent non-significant genes. The horizontal dashed line represents the FDR threshold, and the vertical dashed lines indicate log2 fold-change thresholds. (b) Venn diagram illustrating the overlap between DEGs (red circle) and R-loop-associated genes (blue circle). A total of 197 genes were identified as both DEGs and R-loop-associated. (c) Forest plot presenting the hazard ratios (HRs) and 95% confidence intervals (CIs) for significant genes derived from univariate Cox regression analysis. Genes with significant HRs (p < 0.05) are highlighted, indicating their potential prognostic value. (d) LASSO regression coefficient profiles of the candidate genes. Each curve corresponds to a gene, and the horizontal axis represents the log-transformed penalty parameter (λ). (e) Partial likelihood deviance plot for LASSO regression. The optimal λ value was determined using cross-validation, as indicated by the dashed line. (f) Forest plot summarizing the results of multivariate Cox regression analysis. Significant genes with adjusted HRs and 95% CIs are shown, highlighting their independent prognostic potential. *p-value < 0.05. |
To assess the prognostic significance of these genes, univariate Cox regression analysis was conducted, identifying 37 R-loop-associated genes significantly linked to LUAD prognosis (p < 0.0005, Figure 2c). These genes were further refined using LASSO regression and multivariate Cox regression, resulting in a final set of 9 hub R-loops genes (Figure 2d–f). Using these 9 genes, we developed a prognostic risk assessment model, referred to as the “R-loops Score”. The R-loops Score was calculated using the following formula (Expr represents the gene expression level, and Coef represents the weight coefficients of the genes):

Evaluation and Application of the R-Loops Prognostic Risk Score Model (R-Loops Score) in TCGA Cohort
The prognostic significance of the R-loops-based risk model was evaluated through multiple analyses. Patients were stratified into high-risk and low-risk groups based on the median R-loops Score. Kaplan-Meier survival analysis (Figure 3a) demonstrated that patients in the high-risk group had significantly shorter overall survival (OS) compared to those in the low-risk group (p < 0.0001). Time-dependent ROC curves (Figure 3b) showed that the model had good predictive performance, with AUC values of 0.704, 0.689, and 0.641 for 1-year, 2-year, and 5-year OS, respectively.
 |
Figure 3 Prognostic performance of the R-loops prognostic risk score model (R-loops Score) in predicting overall survival. (a) Kaplan-Meier survival curves for patients in the high R-loops Score (blue) and low R-loops Score (Orange) groups. The number of patients at risk at each time point is displayed below the plot, and the p-value indicates significant differences between the two groups. (b) Time-dependent receiver operating characteristic (ROC) curves for predicting 1-year, 2-year, and 5-year OS. The area under the curve (AUC) values for each time point are provided. (c) Forest plot of multivariate Cox regression analysis for overall survival. Variables include age, gender, stage, and risk group. Hazard ratios (HRs) and 95% confidence intervals (CIs) are shown. (d) Nomogram integrating age, stage, and risk score for predicting 1-year, 2-year, and 5-year OS. The total points correspond to the estimated survival probabilities. (e) Calibration plot assessing the agreement between predicted and observed OS at 1 year, 2 years, and 5 years. The diagonal dashed line represents perfect calibration, while colored lines indicate model performance. (f) ROC curves of the nomogram for predicting OS at 1 year, 2 years, and 5 years. The AUC values reflect the model’s predictive accuracy over time. |
Univariate Cox regression analysis across clinical subgroups (Figure 3c) revealed that the R-loops Score was an independent prognostic factor. Patients in the high-risk group exhibited a hazard ratio (HR) of 2.07 (95% CI: 1.51–2.82), while advanced stages (Stage III and IV) were also strongly associated with worse prognosis (HR = 2.98 and 3.52, respectively).
To provide individualized survival predictions, a nomogram was constructed (Figure 3d) incorporating the R-loops Score, age, and clinical stage. Calibration curves (Figure 3e) showed strong concordance between predicted and observed OS for 1-year, 2-year, and 5-year outcomes. Additionally, ROC curves for independent validation (Figure 3f) confirmed the robustness of the model, with AUC values of 0.732, 0.713, and 0.719 for 1-year, 2-year, and 5-year OS, respectively.
These findings suggest that the R-loops-based risk model has the potential to provide valuable insights for prognostic assessment in LUAD patients; however, further validation is necessary to confirm its clinical applicability.
Validation of the R-Loops Prognostic Risk Score Model (R-Loops Score) in GEO Cohorts
To assess the generalizability of the R-loops prognostic risk score model (R-loops Score), we applied it to three independent GEO cohorts: GSE31210, GSE72094, and GSE50081. Patients in each cohort were stratified into high-risk and low-risk groups based on the median R-loops Score.
In the GSE31210 cohort, Kaplan-Meier survival analysis (Figure 4a) demonstrated that patients in the high-risk group had significantly poorer overall survival (OS) compared to those in the low-risk group (p < 0.0001). The time-dependent ROC curves (Figure 4b) showed that the R-loops Score achieved AUC values of 0.779, 0.767, and 0.736 for 1-year, 2-year, and 5-year OS, respectively, indicating good predictive performance. Similarly, in the GSE72094 cohort, Kaplan-Meier survival analysis (Figure 4c) revealed a significant survival difference between the high-risk and low-risk groups (p = 0.00022). The ROC curves (Figure 4d) demonstrated AUC values of 0.693, 0.671, and 0.709 for 1-year, 2-year, and 5-year OS, respectively. In the GSE50081 cohort, Kaplan-Meier analysis (Figure 4e) also showed a significant difference in survival between the two risk groups (p = 0.011). The ROC analysis (Figure 4f) yielded AUC values of 0.744, 0.652, and 0.639 for 1-year, 2-year, and 5-year OS, respectively.
 |
Figure 4 Validation of the prognostic value of the R-loop score in multiple independent datasets. (a) Kaplan–Meier survival curves comparing overall survival (OS) between high and low R-loop score groups in the GSE31210 dataset. (b) Time-dependent receiver operating characteristic (ROC) curves for 1-, 2-, and 5-year OS prediction in GSE31210. (c) Kaplan–Meier survival curves comparing OS between R-loop score groups in the GSE72094 dataset. (d) Time-dependent ROC curves for 1-, 2-, and 5-year OS prediction in GSE72094. (e) Kaplan–Meier survival curves comparing OS between R-loop score groups in the GSE50081 dataset. (f) Time-dependent ROC curves for 1-, 2-, and 5-year OS prediction in GSE50081. |
These results suggest the potential robustness and generalizability of the R-loops Score in predicting overall survival across multiple independent GEO cohorts, highlighting its promise as a reliable prognostic tool.
Association Between the R-Loops Score and Clinical Characteristics
To investigate the association between the R-loops Score and various clinical characteristics, we performed statistical analyses on the TCGA-LUAD dataset.
We found no significant correlation between the R-loops Score and either age (p = 0.13, Figure 5a) or smoking history (p = 0.46, Figure 5b). However, the R-loops Score was significantly associated with gender, with male patients exhibiting higher scores than female patients (p = 0.032, Figure 5c). In terms of clinical staging, higher R-loops Scores were observed in patients with more advanced stages. As shown in Figure 5d–f, patients in stages III and IV had higher scores compared to those in stages I and II. Similarly, patients with higher T stages (T3 and T4) had significantly elevated R-loops Scores compared to those in T1 and T2. Additionally, patients with lymph node metastasis (N1-N3) exhibited higher R-loops Scores compared to those without lymph node involvement (N0). However, no significant difference in R-loops Scores was observed between patients with and without distant metastasis (pM0 vs pM1, p = 0.15, Figure 5g).
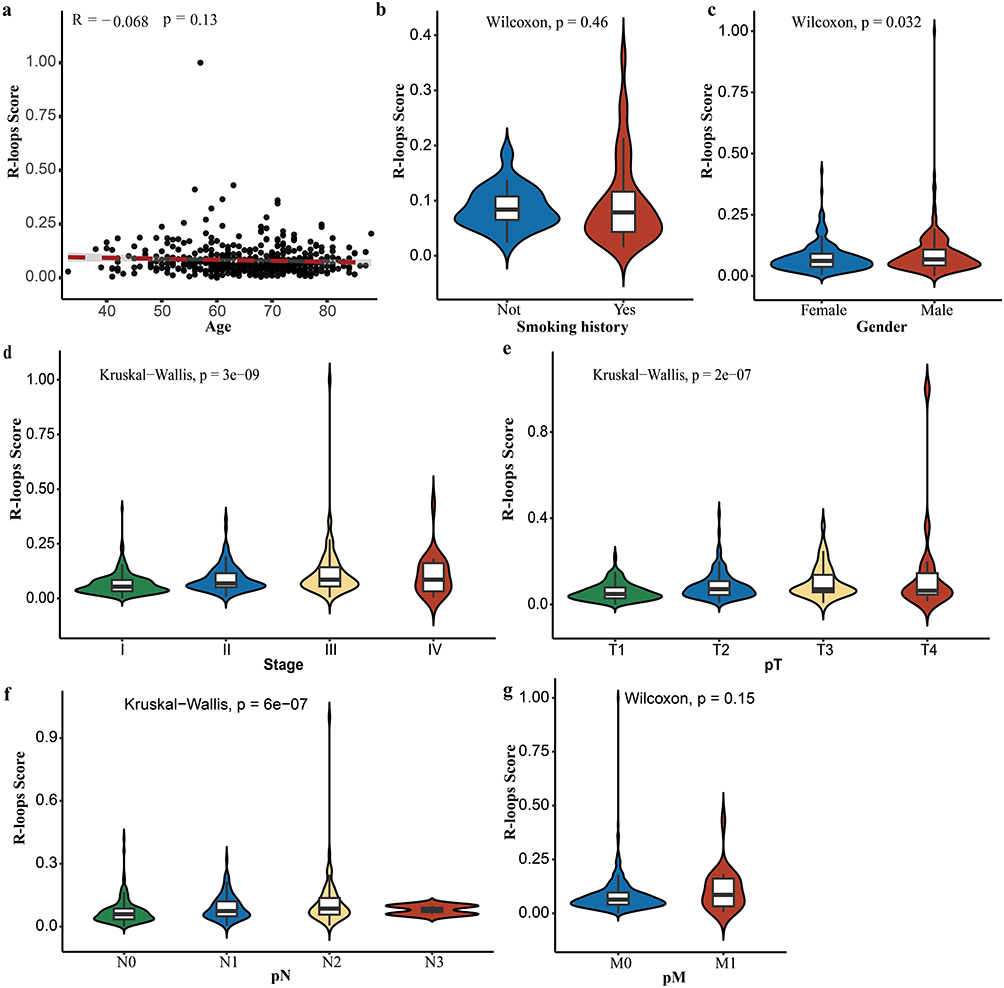 |
Figure 5 Analysis of R-loops Score across clinical and pathological features in patients. (a) Correlation between R-loops Score and patient age. The scatter plot displays the distribution of R-loops Score by age, with a Pearson correlation coefficient (R) of −0.068 and a p-value of 0.13, indicating no significant correlation. (b) Comparison of R-loops Score between patients with and without a smoking history using the Wilcoxon rank-sum test (p = 0.46), showing no significant difference. (c) R-loops Score between male and female patients compared by the Wilcoxon rank-sum test (p = 0.032), showing a statistically significant difference. (d) Distribution of R-loops Score across cancer stages (I–IV) analyzed using the Kruskal–Wallis test (p = 3e-09), revealing significant differences among stages. (e) Comparison of R-loops Score across pathological tumor stages (T1-T4) using the Kruskal–Wallis test (p = 2e-07), showing significant differences. (f) Distribution of R-loops Score among lymph node metastasis (pN0-N3) analyzed using the Kruskal–Wallis test (p = 6e-07), showing significant differences. (g) Comparison of R-loops Score between patients with and without distant metastasis (pM0 vs pM1) using the Wilcoxon rank-sum test (p = 0.15), showing no significant difference. |
Enrichment Analysis of High and Low R-Loops Score Groups with Multiple Datasets
To investigate the biological pathways associated with the high and low R-loops Score groups, we conducted GO and KEGG analyses across four datasets (TCGA-LUAD, GSE50081, GSE72094, and GSE31210). By intersecting the enriched pathways from these datasets, we identified 111 shared pathways (Figure 6a). Among these, Figure 6b highlights pathways with a Count > 30. The enrichment analysis revealed that the high R-loops Score group were significantly enriched in pathways and biological processes associated with the cell cycle, chromosome segregation, and organelle assembly.
 |
Figure 6 Functional and pathway enrichment analysis of genes in R-loops Score model. (a) Venn diagram illustrating the overlap of significantly enriched pathways identified in LUAD datasets (TCGA-LUAD, GSE50081, GSE72094, and GSE31210). (b) Enrichment analysis of the overlapping pathways from (a), including Gene Ontology (GO) categories—biological process (BP), cellular component (CC), and molecular function (MF)—and KEGG pathways. Bars represent the top enriched GO terms and KEGG pathways, with their lengths corresponding to -log10 transformed p-values, indicating statistical significance. (c) Venn diagram showing the overlap of hallmark pathways identified by GSEA analysis across different datasets. The intersections highlight the shared hallmark pathways among these datasets. (d) Gene Set Enrichment Analysis (GSEA) results for hallmark pathways shared in (c). The lower right subpanel displays the hallmark gene sets with significant enrichment, along with their p-values and adjusted p-values. |
Key biological processes (BP) included negative and positive regulation of the cell cycle, mitotic cell cycle phase transition, chromosome segregation, sister chromatid segregation, and non-membrane-bounded organelle assembly. Interestingly, the enrichment of non-membrane-bounded organelle assembly suggests that R-loops Score may be associated with the formation and regulation of membraneless organelles, which are driven by phase separation processes. For cellular components (CC), enriched pathways included the chromosomal region, midbody, spindle, and microtubule-associated complexes, emphasizing their involvement in mitotic and chromosomal dynamics. Molecular functions (MF) such as microtubule binding and microtubule motor activity were also significantly enriched, indicating their roles in structural organization and motor processes essential for cell division. KEGG pathway enrichment highlighted “Motor proteins” and “Cell cycle” underscoring the critical roles of these genes in cellular division and chromosomal segregation.
In addition, we employed the GSEA method to analyze hallmark pathways across the four datasets. The analysis revealed 12 pathways with consistent and statistically significant enrichment across all datasets (Figure 6c). The detailed results for these pathways are presented in Figure 6d, including key cancer-related pathways such as DNA repair, E2F targets, epithelial-mesenchymal transition (EMT), G2M checkpoint, and mitotic spindle, highlighting the association between high R-loops Score and tumor progression.
Correlation Analysis Between R-Loops Score and Immune Characteristics
To investigate the relationship between R-loops Score and immune-related characteristics, we performed a series of correlation analyses. Scatter plots revealed a significant positive correlation between R-loops Score and ImmuneScore (R = 0.16, p = 0.00025) as well as ESTIMATEScore (R = 0.12, p = 0.0072). However, no significant correlation was observed between R-loops Score and StromalScore (R = 0.06, p = 0.18) (Figure 7a–c). A heatmap analysis demonstrated the association between R-loops Score and immune checkpoint molecules (Figure 7d). Notably, R-loops Score showed a weak but significant positive correlation with CD274 (R = 0.11, p = 0.017) and CTLA4 (R = 0.1, p = 0.019), as illustrated in Figure 7e and f.
 |
Figure 7 Correlation between R-loops Score, immune microenvironment, and immune checkpoint. (a–c) Correlation of R-loops Score with ImmuneScore (a), StromalScore (b), and ESTIMATEScore (c) based on ESTIMATE analysis. (d) Heatmap showing the correlation between R-loops Score and the expression of immune checkpoint molecules. (e and f) Scatter plots showing the correlation of R-loops Score with CD274 (PD-L1, (e)) and CTLA4 (f), with significant positive correlations (CD274: R = 0.11, p = 0.017; CTLA4: R = 0.1, p = 0.019). (g) Venn diagram illustrating the overlap of significantly enriched immune-related pathways identified across LUAD datasets (TCGA-LUAD, GSE31210, GSE72094, and GSE50081). The central intersection represents common pathways shared across datasets. (h) Heatmap of correlations between R-loops Score and immune cell components shared in (g). (i) Correlation heatmap showing the relationships between the 9 R-loops genes and immune cell components estimated by CIBERSORT. *p < 0.05, **p < 0.01, ***p < 0.001. |
Subsequently, we performed immune infiltration analysis on TCGA-LUAD, GSE31210, GSE72094, and GSE50081 datasets. By identifying immune cell components significantly associated with R-loops Score in each dataset and taking their intersection, we found seven immune components that were consistently and significantly correlated with R-loops Score across all four datasets (Figure 7g). A heatmap provided detailed correlation information for these shared immune components (Figure 7h).
Finally, we analyzed the correlation between the 9 genes included in the R-loops Score and immune cell components estimated using cibersort algorithm. As shown in Figure 7i, the results highlight the relationships between these genes and various immune cell components, providing deeper insights into the interplay between the R-loops Score and immune regulation.
Correlation Between R-Loops Score and Drug Treatment Response
To evaluate the relationship between R-loops Score and response to immunotherapy or drug treatments, we performed Tumor Immune Dysfunction and Exclusion (TIDE) analysis and drug sensitivity assessments.
The results revealed that tumors with high R-loops Scores exhibited significantly higher TIDE scores compared to those with low R-loops Scores (Wilcoxon test, p = 3.2e-11, Figure 8a), suggesting a stronger capability for immune evasion. Furthermore, the distribution of immune responders revealed a lower proportion of immune-responsive patients in the high R-loops Score group (chi-squared test, p = 2.6e-06, Figure 8b), which is consistent with the previous conclusion that tumors with High R-loops Scores exhibit stronger immune evasion.
 |
Figure 8 Association between R-loops Score and therapeutic response. (a) Violin plot showing a significant difference in TIDE (Tumor Immune Dysfunction and Exclusion) scores between low and high R-loops Score groups (Wilcoxon test, p = 3.2e-11), indicating immune dysfunction in high R-loops Score tumors. (b) Proportion of responders and non-responders to immunotherapy in low and high R-loops Score groups. A significant association was observed (chi-square test, p = 2.6e-06). (c–h) Violin plots showing sensitivity (as measured by drug response scores) to six chemotherapeutic agents between low and high R-loops Score groups. Significant differences are observed for cisplatin ((c), p = 2e-04), paclitaxel ((d), p = 1.1e-15), docetaxel ((e), p < 2.2e-16), vincristine ((f), p = 3.4e-07), gefitinib ((g), p = 2.5e-05), and erlotinib ((h), p = 3.6e-06), with higher sensitivity associated with specific R-loops Score groups. |
Next, we assessed the association of R-loops Score with sensitivity to various chemotherapeutic agents. Tumors with high R-loops Scores demonstrated significantly sensitivity to cisplatin (Wilcoxon test, p = 2e-04), paclitaxel (p = 1.1e-15), docetaxel (p < 2.2e-16), vincristine (p = 3.4e-07), gefitinib (p = 2.5e-05), and erlotinib (p = 3.6e-06) compared to tumors with low R-loops Scores (Figure 8c–h). This trend was generally observed across stages I–III when stratified by clinical stage, as shown in Figure S1, whereas the differences were attenuated in stage IV, potentially due to increased tumor heterogeneity.
These findings suggest that patients with low R-loops Scores may be more responsive to immunotherapy but relatively resistant to traditional chemotherapy and targeted therapies, which may help inform clinical treatment strategies.
Evaluation of Gene Expression in the R-Loops Prognostic Risk Score Model
We employed qPCR to assess the mRNA expression levels of multiple genes in LUAD cell lines (A549, PC9, H23) and the normal human bronchial epithelial cell line (Beas-2B, referred to as 2B) (Figure 9a). The results showed that, compared to the normal cell line (2B), IGF2BP1, SFXN1, LDHA, FKBP4, CCT6A, FSCN1, and EIF3B were upregulated in multiple lung cancer cell lines, whereas WDHD1 and ALDOA were significantly downregulated across all LUAD cell lines. Further analysis of these genes in LUAD patient tumor tissues and paired normal tissues (Figure 9b) revealed that, apart from ALDOA and EIF3B, the expression differences of the other genes between tumor and normal tissues were not statistically significant (p > 0.05). Specifically, ALDOA was significantly downregulated in tumor tissues compared to normal tissues (p < 0.05), while EIF3B was significantly upregulated in tumor tissues (p < 0.05).
 |
Figure 9 The qPCR and Western blot analysis of gene expression in LUAD cell lines and patient tissues. (a) Relative mRNA expression levels of selected genes in LUAD cell lines (A549, PC9, H23) and the normal human bronchial epithelial cell line (Beas-2B, referred to as 2B). Gene expression levels were normalized to an internal control, and statistical comparisons were performed relative to the 2B cell line. (b) Relative mRNA expression levels of the same genes in LUAD tumor tissues and paired adjacent normal tissues. Statistical significance was determined using Student’s t-test. (c) Western blot analysis of EIF3B and ALDOA protein expression in LUAD cell lines and the 2B normal cell line. β-tubulin was used as a loading control. *p < 0.05, **p < 0.01, ***p < 0.001, ****p < 0.0001. Data are presented as mean ± SEM. Abbreviation: ns, not significant. |
To validate gene expression at the protein level, we performed Western blot (WB) analysis in LUAD cell lines and the 2B normal cell line (Figure 9c). The results showed that EIF3B protein levels were consistently upregulated in cancer cell lines, which aligns with the transcriptomic and qPCR findings. In contrast, ALDOA protein levels were elevated in LUAD cell lines, showing an opposite trend compared to its mRNA expression, suggesting possible post-transcriptional regulation or differential protein stability. In addition, siRNA-mediated knockdown of EIF3B or ALDOA resulted in no marked changes in drug sensitivity (Figure S2), supporting the view that drug response is likely driven by the integrated activity of multiple genes rather than any single gene alone.
The consistent upregulation of EIF3B at both mRNA and protein levels highlights its potential as a robust biomarker in LUAD.
Discussion
In this study, we developed and validated a novel R-loops Score model based on 9 hub R-loop-associated genes to predict prognosis, immune characteristics, and drug response in LUAD. Our findings demonstrate the complex roles of R-loops in cancer progression, highlighting their potential as both prognostic biomarkers and therapeutic targets.
Patients with high R-loop scores exhibited significantly shorter overall survival (OS) across multiple cohorts, further validating the robustness of the model. By integrating the R-loop score with clinical variables into a nomogram, we achieved highly accurate survival predictions, highlighting its clinical relevance. These results align with the pivotal roles of R-loops in maintaining genomic stability and regulating transcriptional dynamics.40,41
Enrichment analysis revealed pathways such as cell cycle, mitotic cell cycle phase transition, chromosome segregation, and sister chromatid segregation, all of which are strongly associated with genomic instability and align with established findings. Interestingly, non-membrane-bounded organelle assembly, a process linked to phase separation, was also enriched. These findings suggest that R-loops not only contribute to mitotic progression and cellular organization but may also play a role in phase separation-mediated biological processes, such as the assembly of membraneless organelles.42,43
Our analysis uncovered a positive correlation between the R-loops Score and immune evasion, including higher TIDE scores and increased expression of immune checkpoint molecules. Tumors with high R-loops Scores exhibited a lower proportion of immune-responsive patients, suggesting that R-loops may facilitate immune evasion and reduce responsiveness to immunotherapy. Conversely, tumors with high R-loops Scores demonstrated increased sensitivity to multiple chemotherapeutic and targeted agents, including cisplatin, paclitaxel, and EGFR inhibitors. This dual observation highlights the potential of R-loops as predictive markers for both immunotherapy resistance and chemotherapy responsiveness, emphasizing the importance of tailoring treatment strategies based on R-loops profiling.
To further validate the nine hub genes included in the R-loops Score model, we performed qPCR analysis in LUAD cell lines and patient tissues. Our results demonstrated that most of these genes (IGF2BP1, SFXN1, LDHA, FKBP4, CCT6A, FSCN1, and EIF3B) were significantly upregulated in LUAD cell lines compared to normal human bronchial epithelial cells, while WDHD1 and ALDOA were consistently downregulated. However, when analyzing their expression in LUAD tumor tissues and paired adjacent normal tissues, only EIF3B and ALDOA exhibited significant differential expression, with EIF3B upregulated and ALDOA downregulated in tumor tissues. These findings suggest that while the model’s genes are relevant in LUAD, their expression patterns in cell lines may not fully reflect clinical conditions, likely due to tumor microenvironmental influences and transcriptional regulatory differences in vitro. The differential expression of EIF3B and ALDOA in patient tissues highlights them as potential biomarkers for LUAD and warrants further investigation into their functional roles. To further validate their expression at the protein level, Western blot analysis was performed in LUAD cell lines. EIF3B protein levels were consistently upregulated in cancer cells, corroborating the transcriptomic and qPCR findings. In contrast, ALDOA protein levels were elevated in LUAD cell lines despite being downregulated at the mRNA level, suggesting a possible post-transcriptional regulatory mechanism. These findings underscore the robustness of EIF3B as a candidate biomarker and highlight the importance of integrating multi-omics approaches when evaluating gene function and clinical relevance.
To better understand the biological relevance of the R-loops Score model, we further explored the functional roles of the nine hub genes. EIF3B, a translation initiation factor, promotes cell proliferation and cisplatin resistance in LUAD, and its overexpression correlates with poor clinical outcomes.44 ALDOA, a glycolytic enzyme, promotes proliferation and cisplatin resistance in lung cancer cells.45 IGF2BP1, an m6A reader, stabilizes oncogenic mRNAs, driving tumor progression, metastasis, and therapy resistance in LUAD.46 WDHD1 (AND-1), involved in DNA replication and repair, is essential for NSCLC growth and its inhibition increases radiosensitivity.47 FKBP4 participates in protein folding and chromatin regulation; while detailed studies in LUAD are limited, it interfaces with genome integrity mechanisms linked to R-loops. LDHA, a key enzyme in glycolysis, contributes to stemness, immune suppression, and drug resistance under hypoxic conditions in lung tumors.48 FSCN1, an actin-bundling protein, is upregulated in NSCLC and promotes cell migration, invasion, and metastasis.49 CCT6A, part of the chaperonin family, is co-amplified with EGFR, and mediates LUAD progression via metabolic reprogramming.50 SFXN1, a mitochondrial serine transporter, has prognostic relevance in LUAD and plays roles in mitochondrial function and tumor cell survival.51 Collectively, these genes participate in key oncogenic pathways, including genomic stability maintenance, metabolic reprogramming, and post-transcriptional regulation, many of which are intimately connected to R-loop biology. Their functional provides a mechanistic basis for the prognostic and therapeutic predictive value of the R-loops Score model in LUAD.
Despite these promising insights, several limitations should be addressed. Firstly, this study utilized data from publicly available datasets, which may introduce sampling bias. In certain cohorts, the limited patient sample size could restrict the generalizability of our findings to larger and more diverse populations. Moreover, factors such as racial differences, clinical characteristics, and treatment histories could influence the results and should be considered. Secondly, while our study offers strong statistical evidence linking R-loops to immune regulation and chemotherapy sensitivity, it lacks direct experimental validation. Specifically, the absence of functional studies, such as in vitro or in vivo experiments, limits our ability to establish a causal relationship between R-loops-associated genes and the observed clinical outcomes. Conducting targeted experiments would provide critical mechanistic insights and significantly enhance the translational potential of our findings. Lastly, the absence of direct data on immunotherapy responses in LUAD limits our ability to fully explore the relationship between R-loops and treatment outcomes. This limitation highlights the necessity for future studies that integrate comprehensive clinical and treatment response data to provide a more holistic understanding.
Conclusion
In this study, we developed and validated a novel R-loops Score model based on nine genes to predict prognosis, immune landscape, and drug sensitivity in LUAD. This score demonstrated robust prognostic value across multiple cohorts and was associated with key biological processes, including genomic instability, immune evasion, and therapeutic responsiveness. Our findings highlight the potential of R-loops not only as mechanistic drivers of tumor progression but also as clinical biomarkers. These results provide a foundation for future translational research and underscore the promise of R-loop–targeted strategies in precision oncology.
Abbreviations
LUAD, Lung adenocarcinoma; FPKM, fragments per kilobase of transcript per million mapped reads; TPM, transcripts per million; ssGSEA, single-sample Gene Set Enrichment Analysis; LASSO, Least Absolute Shrinkage and Selection Operator; TIDE, Tumor Immune Dysfunction and Exclusion; AUC, the area under the curve; HR, hazard ratio; OS, overall survival.
Data Sharing Statement
GSE29013, GSE31210 and GSE50081: Available from the Gene Expression Omnibus (GEO) database (https://www.ncbi.nlm.nih.gov/geo/) under their respective accession numbers.
TCGA-LUAD: Available from UCSC Xena database (https://xenabrowser.net/datapages/).
Ethics Approval and Consent to Participate
The study was conducted in accordance with the ethical principles outlined in the Declaration of Helsinki. It was approved by the Institutional Review Board of Nanfang Hospital, Southern Medical University (Ethics Approval No.: NFEC-202408-K24). The patient-derived lung cancer tissue samples and paraffin-embedded tissues were obtained from the department of Thoracic in Nanfang hospital with patients’ written informed consent.
Acknowledgments
The authors thank the participants and staff of the Department of Thoracic Surgery, Nanfang Hospital, Southern Medical University, for their contributions.
Author Contributions
J.J., Y.Z. and B.M. contributed equally to this work. All authors read and approved the final manuscript. All authors made a significant contribution to the work reported, whether that is in the conception, study design, execution, acquisition of data, analysis and interpretation, or in all these areas; took part in drafting, revising or critically reviewing the article; gave final approval of the version to be published; have agreed on the journal to which the article has been submitted; and agree to be accountable for all aspects of the work.
Funding
This work was supported by the National Key Research and Development plan (2023YFC2508601 to K.C.), the National Key Research and Development plan (2023YFC2508605 to S.R.), the National Natural Science Foundation of China (82072587 to S.R), Guangdong Basic and Applied Basic Research foundation (2024A1515011188 to S.R.), Funding by Science and Technology Projects in Guangzhou (2060206 to S.R.), the Outstanding Youths Development Scheme of Nanfang Hospital, Southern Medical University (2020J001 to S.R.).
Disclosure
The authors declare no competing interests.
References
1. Siegel RL, Miller KD, Wagle NS, Jemal A. Cancer statistics, 2023. CA Cancer J Clin. 2023;73(1):17–48. doi:10.3322/caac.21763
2. Herbst RS, Morgensztern D, Boshoff C. The biology and management of non-small cell lung cancer. Nature. 2018;553(7689):446–454. doi:10.1038/nature25183
3. Altorki NK, Markowitz GJ, Gao D, et al. The lung microenvironment: an important regulator of tumour growth and metastasis. Nat Rev Cancer. 2019;19(1):9–31. doi:10.1038/s41568-018-0081-9
4. Lim ZF, Ma PC. Emerging insights of tumor heterogeneity and drug resistance mechanisms in lung cancer targeted therapy. J Hematol Oncol. 2019;12(1):134. doi:10.1186/s13045-019-0818-2
5. Xu Y, Jiao Y, Liu C, et al. R-loop and diseases: the cell cycle matters. Mol Cancer. 2024;23(1):84. doi:10.1186/s12943-024-02000-3
6. Niehrs C, Luke B. Regulatory R-loops as facilitators of gene expression and genome stability. Nat Rev Mol Cell Biol. 2020;21(3):167–178. doi:10.1038/s41580-019-0206-3
7. Xu C, Li C, Chen J, et al. R-loop-dependent promoter-proximal termination ensures genome stability. Nature. 2023;621(7979):610–619. doi:10.1038/s41586-023-06515-5
8. Murayama T, Nakayama J, Jiang X, et al. Targeting DHX9 Triggers Tumor-Intrinsic Interferon Response and Replication Stress in Small Cell Lung Cancer. Cancer Discov. 2024;14(3):468–491. doi:10.1158/2159-8290.CD-23-0486
9. Maxwell MB, Hom-Tedla MS, Yi J, et al. ARID1A suppresses R-loop mediated STING-Type I Interferon pathway activation of anti-tumor immunity. Cell. 2024;187(13):3390–3408.e19. doi:10.1016/j.cell.2024.04.025
10. Zhang S, Liu Y, Sun Y, et al. Aberrant R-loop–mediated immune evasion, cellular communication, and metabolic reprogramming affect cancer progression: a single-cell analysis. Mol Cancer. 2024;23:11. doi:10.1186/s12943-023-01924-6
11. Yu Z, Mersaoui SY, Guitton-Sert L, et al. DDX5 resolves R-loops at DNA double-strand breaks to promote DNA repair and avoid chromosomal deletions. NAR Cancer. 2020;2(3):zcaa028. doi:10.1093/narcan/zcaa028
12. Kanellis DC, Espinoza JA, Zisi A, et al. The exon-junction complex helicase eIF4A3 controls cell fate via coordinated regulation of ribosome biogenesis and translational output. Sci Adv. 2021;7(32):eabf7561. doi:10.1126/sciadv.abf7561
13. Kimura N, Takayama K, Yamada Y, Kume H, Fujimura T, Inoue S. Ribonuclease H2 Subunit A Preserves Genomic Integrity and Promotes Prostate Cancer Progression. Cancer Res Commun. 2022;2(8):870–883. doi:10.1158/2767-9764.CRC-22-0126
14. Wells JP, White J, Stirling PC. R Loops and Their Composite Cancer Connections. Trends Cancer. 2019;5(10):619–631. doi:10.1016/j.trecan.2019.08.006
15. Swanson K, Wu E, Zhang A, Alizadeh AA, Zou J. From patterns to patients: advances in clinical machine learning for cancer diagnosis, prognosis, and treatment. Cell. 2023;186(8):1772–1791. doi:10.1016/j.cell.2023.01.035
16. Kang J, Choi YJ, Kim IK, et al. LASSO-Based Machine Learning Algorithm for Prediction of Lymph Node Metastasis in T1 Colorectal Cancer. Cancer Res Treat. 2021;53(3):773–783. doi:10.4143/crt.2020.974
17. Wang T, Ding Y, Tao L. Association of R-loop binding proteins with prognosis and anti-tumor drug sensitivity in lung adenocarcinoma: a bioinfor-matic study. Zhejiang Xue Xue Bao Yi Xue Ban J Zhejiang Univ Med Sci. 2024;53(4):472–480. doi:10.3724/zdxbyxb-2024-0032
18. Wang IX, Grunseich C, Fox J, et al. Human proteins that interact with RNA/DNA hybrids. Genome Res. 2018;28(9):1405–1414. doi:10.1101/gr.237362.118
19. Mosler T, Conte F, Longo GMC, et al. R-loop proximity proteomics identifies a role of DDX41 in transcription-associated genomic instability. Nat Commun. 2021;12(1):7314. doi:10.1038/s41467-021-27530-y
20. Cristini A, Groh M, Kristiansen MS, Gromak N. RNA/DNA Hybrid Interactome Identifies DXH9 as a Molecular Player in Transcriptional Termination and R-Loop-Associated DNA Damage. Cell Rep. 2018;23(6):1891–1905. doi:10.1016/j.celrep.2018.04.025
21. Xie Y, Xiao G, Coombes KR, et al. Robust gene expression signature from formalin-fixed paraffin-embedded samples predicts prognosis of non-small-cell lung cancer patients. Clin Cancer Res off J Am Assoc Cancer Res. 2011;17(17):5705–5714. doi:10.1158/1078-0432.CCR-11-0196
22. Botling J, Edlund K, Lohr M, et al. Biomarker discovery in non-small cell lung cancer: integrating gene expression profiling, meta-analysis, and tissue microarray validation. Clin Cancer Res off J Am Assoc Cancer Res. 2013;19(1):194–204. doi:10.1158/1078-0432.CCR-12-1139
23. Okayama H, Kohno T, Ishii Y, et al. Identification of genes upregulated in ALK-positive and EGFR/KRAS/ALK-negative lung adenocarcinomas. Cancer Res. 2012;72(1):100–111. doi:10.1158/0008-5472.CAN-11-1403
24. Der SD, Sykes J, Pintilie M, et al. Validation of a histology-independent prognostic gene signature for early-stage, non-small-cell lung cancer including stage IA patients. J Thorac Oncol off Publ Int Assoc Study Lung Cancer. 2014;9(1):59–64. doi:10.1097/JTO.0000000000000042
25. Zhao Y, Li MC, Konaté MM, et al. TPM, FPKM, or Normalized Counts? A Comparative Study of Quantification Measures for the Analysis of RNA-seq Data from the NCI Patient-Derived Models Repository. J Transl Med. 2021;19(1):269. doi:10.1186/s12967-021-02936-w
26. Gautier L, Cope L, Bolstad BM, Irizarry RA. affy--analysis of Affymetrix GeneChip data at the probe level. Bioinforma Oxf Engl. 2004;20(3):307–315. doi:10.1093/bioinformatics/btg405
27. edgeR 4.0: powerful differential analysis of sequencing data with expanded functionality and improved support for small counts and larger datasets | bioRxiv. Available from: https://www.biorxiv.org/content/10.1101/2024.01.21.576131v1.
28. Wu T, Hu E, Xu S, et al. clusterProfiler 4.0: a universal enrichment tool for interpreting omics data. Innovation. 2021;2(3):100141. doi:10.1016/j.xinn.2021.100141
29. Yu G. Thirteen years of clusterProfiler. Innov Camb Mass. 2024;5(6):100722. doi:10.1016/j.xinn.2024.100722
30. Hänzelmann S, Castelo R, Guinney J. GSVA: gene set variation analysis for microarray and RNA-Seq data. BMC Bioinf. 2013;14(1):7. doi:10.1186/1471-2105-14-7
31. Sturm G, Finotello F, Petitprez F, et al. Comprehensive evaluation of transcriptome-based cell-type quantification methods for immuno-oncology. Bioinformatics. 2019;35(14):i436–i445. doi:10.1093/bioinformatics/btz363
32. Finotello F, Mayer C, Plattner C, et al. Molecular and pharmacological modulators of the tumor immune contexture revealed by deconvolution of RNA-seq data. Genome Med. 2019;11(1):34. doi:10.1186/s13073-019-0638-6
33. Li B, Severson E, Pignon JC, et al. Comprehensive analyses of tumor immunity: implications for cancer immunotherapy. Genome Biol. 2016;17(1):174. doi:10.1186/s13059-016-1028-7
34. Newman AM, Liu CL, Green MR, et al. Robust enumeration of cell subsets from tissue expression profiles. Nat Methods. 2015;12(5):453–457. doi:10.1038/nmeth.3337
35. Becht E, Giraldo NA, Lacroix L, et al. Estimating the population abundance of tissue-infiltrating immune and stromal cell populations using gene expression. Genome Biol. 2016;17(1):218. doi:10.1186/s13059-016-1070-5
36. Aran D, Hu Z, Butte AJ. xCell: digitally portraying the tissue cellular heterogeneity landscape. Genome Biol. 2017;18(1):220. doi:10.1186/s13059-017-1349-1
37. Racle J, de Jonge K, Baumgaertner P, Speiser DE, Gfeller D. Simultaneous enumeration of cancer and immune cell types from bulk tumor gene expression data. eLife. 2017;6:e26476. doi:10.7554/eLife.26476
38. Yoshihara K, Shahmoradgoli M, Martínez E, et al. Inferring tumour purity and stromal and immune cell admixture from expression data. Nat Commun. 2013;4(1):2612. doi:10.1038/ncomms3612
39. Maeser D, Gruener RF, Huang RS. oncoPredict: an R package for predicting in vivo or cancer patient drug response and biomarkers from cell line screening data. Brief Bioinform. 2021;22(6):bbab260. doi:10.1093/bib/bbab260
40. Brickner JR, Garzon JL, Cimprich KA. Walking a tightrope: the complex balancing act of R-loops in genome stability. Mol Cell. 2022;82(12):2267–2297. doi:10.1016/j.molcel.2022.04.014
41. García-Muse T, Aguilera A. R Loops: from Physiological to Pathological Roles. Cell. 2019;179(3):604–618. doi:10.1016/j.cell.2019.08.055
42. He X, Yuan J, Gao Z, Wang Y. Promoter R-Loops Recruit U2AF1 to Modulate Its Phase Separation and RNA Splicing. J Am Chem Soc. 2023;145(39):21646–21660. doi:10.1021/jacs.3c08204
43. Dettori LG, Torrejon D, Chakraborty A, et al. A Tale of Loops and Tails: the Role of Intrinsically Disordered Protein Regions in R-Loop Recognition and Phase Separation. Front Mol Biosci. 2021;8:691694. doi:10.3389/fmolb.2021.691694
44. Wang H, Ru Y, Sanchez-Carbayo M, et al. Translation Initiation Factor eIF3b Expression in Human Cancer and Its Role in Tumor Growth and Lung Colonization. Clin Cancer Res. 2013;19(11):2850–2860. doi:10.1158/1078-0432.CCR-12-3084
45. Chang YC, Yang YF, Chiou J, et al. Nonenzymatic function of Aldolase A downregulates miR-145 to promote the Oct4/DUSP4/TRAF4 axis and the acquisition of lung cancer stemness. Cell Death Dis. 2020;11(3):195. doi:10.1038/s41419-020-2387-2
46. Wu H, Xu H, Huang S, et al. m6A-binding protein IGF2BP1 promotes the malignant phenotypes of lung adenocarcinoma. Front Oncol. 2022;12:989817. doi:10.3389/fonc.2022.989817
47. Sato N, Koinuma J, Fujita M, et al. Activation of WD Repeat and High-Mobility Group Box DNA Binding Protein 1 in Pulmonary and Esophageal Carcinogenesis. Clin Cancer Res. 2010;16(1):226–239. doi:10.1158/1078-0432.CCR-09-1405
48. Wang M, Zhou Q, Cao T, et al. Lactate dehydrogenase A: a potential new target for tumor drug resistance intervention. J Transl Med. 2025;23(1):713. doi:10.1186/s12967-025-06773-z
49. Sun Q, Liu R, Zhang H, et al. Fascin actin-bundling protein 1 regulates non-small cell lung cancer progression by influencing the transcription and splicing of tumorigenesis-related genes. PeerJ. 2023;11:e16526. doi:10.7717/peerj.16526
50. Wang H, Wang X, Xu L, Lin Y, Zhang J. CCT6A and CHCHD2 Are Coamplified with EGFR and Associated with the Unfavorable Clinical Outcomes of Lung Adenocarcinoma. Dis Markers. 2022;2022:1560199. doi:10.1155/2022/1560199
51. Liu W, Du Q, Mei T, Wang J, Huang D, Qin T. Comprehensive analysis the prognostic and immune characteristics of mitochondrial transport-related gene SFXN1 in lung adenocarcinoma. BMC Cancer. 2024;24(1):94. doi:10.1186/s12885-023-11646-z
 © 2025 The Author(s). This work is published and licensed by Dove Medical Press Limited. The
full terms of this license are available at https://www.dovepress.com/terms
and incorporate the Creative Commons Attribution
- Non Commercial (unported, 4.0) License.
By accessing the work you hereby accept the Terms. Non-commercial uses of the work are permitted
without any further permission from Dove Medical Press Limited, provided the work is properly
attributed. For permission for commercial use of this work, please see paragraphs 4.2 and 5 of our Terms.
© 2025 The Author(s). This work is published and licensed by Dove Medical Press Limited. The
full terms of this license are available at https://www.dovepress.com/terms
and incorporate the Creative Commons Attribution
- Non Commercial (unported, 4.0) License.
By accessing the work you hereby accept the Terms. Non-commercial uses of the work are permitted
without any further permission from Dove Medical Press Limited, provided the work is properly
attributed. For permission for commercial use of this work, please see paragraphs 4.2 and 5 of our Terms.
Recommended articles

Comprehensive Analysis of the E2F Transcription Factor Family in Human Lung Adenocarcinoma
Wang Q, Liu J, Cheang I, Li J, Chen T, Li Y, Yu B
International Journal of General Medicine 2022, 15:5973-5984
Published Date: 2 July 2022
High Expression of DEPDC1B Predicts Poor Prognosis in Lung Adenocarcinoma

Li P, Chen X, Zhou S, Xia X, Wang E, Han R, Zeng D, Fei G, Wang R
Journal of Inflammation Research 2022, 15:4171-4184
Published Date: 23 July 2022
Expression, Clinical Significance, Immune Infiltration, and Regulation Network of miR-3940-5p in Lung Adenocarcinoma Based on Bioinformatic Analysis and Experimental Validation
Lin Z, Huang W, Xie Z, Yi Y, Li Z
International Journal of General Medicine 2022, 15:6451-6464
Published Date: 6 August 2022
Prognostic Significance of Iron Metabolism Related Genes in Human Lung Adenocarcinoma
Li P, Wu X, Chen P, Gu Z
Cancer Management and Research 2023, 15:203-216
Published Date: 22 February 2023
Disulfidptosis-Associated lncRNAs are Potential Biomarkers for Predicting Immune Response and Prognosis Within Individuals Diagnosed with Hepatocellular Carcinoma
Wei Q, Hou YC, Mao FF, Feng JK, Wang X, Cheng SQ
Hepatic Medicine: Evidence and Research 2023, 15:249-264
Published Date: 27 December 2023