Back to Journals » Neuropsychiatric Disease and Treatment » Volume 22
Predicting Post-Stroke Depression Risk in Elderly Patients Based on Machine Learning: A Retrospective Cohort Study Integrating Neuroimaging and Psychosocial Variables
Authors Zhang L, Yu P, Yang L, Zhong Z
Received 25 November 2025
Accepted for publication 30 January 2026
Published 24 February 2026 Volume 2026:22 580089
DOI https://doi.org/10.2147/NDT.S580089
Checked for plagiarism Yes
Review by Single anonymous peer review
Peer reviewer comments 2
Editor who approved publication: Dr Jun Chen
Liangjin Zhang,* Ping Yu,* Liu Yang, Zian Zhong
Department of Neurology, Xiangyang Central Hospital, Affiliated Hospital of Hubei University of Arts and Science, Xiangyang, Hubei, 441021, People’s Republic of China
*These authors contributed equally to this work
Correspondence: Zian Zhong, Department of Neurology, Xiangyang Central Hospital, Affiliated Hospital of Hubei University of Arts and Science, 136 Jingzhou Street, Xiangcheng District, Xiangyang, Hubei, 441021, People’s Republic of China, Email [email protected] Liu Yang, Department of Neurology, Xiangyang Central Hospital, Affiliated Hospital of Hubei University of Arts and Science, 136 Jingzhou Street, Xiangcheng District, Xiangyang, Hubei, 441021, People’s Republic of China, Email [email protected]
Objective: To construct a machine learning-based risk prediction model for post-stroke depression (PSD) in elderly stroke patients by integrating neuroimaging and psychosocial variables, and to improve prediction accuracy for individualized prevention.
Methods: A retrospective cohort study included 691 elderly (≥ 60 years) stroke patients from Xiangyang Central Hospital (2016– 2023). Baseline clinical data, neuroimaging features (eg, lesion volume, CMBs), and psychosocial variables (eg, SSRS, HAMA-14, HAMD-17) were collected. Seven machine learning models were built; performance was evaluated via AUC, accuracy, and DCA. The optimal model was used to develop a nomogram.
Results: The logistic regression (LR) model outperformed others, with AUC=0.88 in the test set. Seven independent predictors were identified: NIHSS score, lesion volume, CMB number, DWI range, Fazekas grade, SSRS score, and HAMA-14 score. The LR-derived nomogram showed good calibration and discriminated PSD from non-PSD effectively.
Conclusion: The LR model with 7 predictors is accurate and stable for elderly PSD prediction. Its nomogram aids early high-risk identification, supporting personalized intervention, though single-center limitations require multi-center validation.
Keywords: post-stroke depression, (PSD), elderly patients, machine learning, logistic regression, neuroimaging, psychosocial variables
Introduction
Stroke is the second leading cause of death and disability globally, with high morbidity and mortality, and its socioeconomic burden surpasses that of cardiovascular diseases and cancer.1,2 Post-stroke depression (PSD) is the most common and severe neuropsychiatric complication of stroke. It is an affective disorder marked by persistent low mood, anhedonia, alongside accompanying symptoms such as sleep disturbances and fatigue that significantly hinder rehabilitation. Globally, approximately 30% of stroke patients develop depressive symptoms (some data indicate 30~50%), bringing cascading harms including worsened neurological deficits, reduced quality of life, and elevated risks of recurrence or death.3,4 However, PSD is often overlooked due to prioritization of physical recovery, overlapping symptoms, insufficient clinical awareness, and patient concealment, resulting in missed opportunities for early intervention.
PSD arises from multi-dimensional risk factors including pre-stroke factors (genetics, gender, depression history), stroke-related factors (infarct location, neurological deficit severity), and post-stroke factors (social support, disability level).5–7 Pathophysiologically, brain structural damage and neurotransmitter imbalance are core triggers, whereas psychological stress from impaired function or social changes further heightens risk.8,9 Existing PSD prediction models have critical shortcomings, including overreliance on single-dimensional variables without integrating neuroimaging and psychosocial data, limited efficiency as traditional methods fail to handle multi-source data and machine learning models are not optimized for the elderly, and insufficient clinical practicality due to hard-to-obtain indicators or unclear thresholds.
Machine learning excels at disease risk prediction through its robust data mining capabilities, meanwhile neuroimaging captures post-stroke brain structural and functional changes (infarct volume, functional connectivity) and psychosocial variables (social support, coping style) reflect psychological adaptability.10,11 Their integration covers the physiological-psychological-social risks of PSD. This retrospective cohort study targets elderly stroke patients who are a high-risk group for PSD, integrates neuroimaging indicators and psychosocial variables, alongside applying machine learning algorithms (random forest, support vector machine, logistic regression) to construct a PSD risk early warning model. It aims to clarify the predictive value of multi-dimensional variables, enhance prediction accuracy, provide a basis for individualized prevention and intervention, and ultimately lower PSD incidence while improving patients’rehabilitation outcomes.
Materials and Methods
Study Population
This is a retrospective study focusing on elderly stroke patients admitted to Xiangyang Central Hospital from January 2016 to December 2023, covering an 8-year study period, from which eligible case data were collected using the convenience sampling method. The inclusion criteria included consistency with the standards outlined in the Chinese Guidelines for the Diagnosis and Treatment of Acute Ischemic Stroke and Chinese Guidelines for the Diagnosis and Treatment of Intracerebral Hemorrhage (confirmed by cranial CT and/or MRI), age ≥ 60 years (in line with the WHO definition of elderly for developing countries including China), stroke onset within < 2 weeks (presenting in the acute phase), and complete case data with informed consent signed by the patient or their guardian. The exclusion criteria included cognitive impairment (defined as a Montreal Cognitive Assessment [MoCA] score ≤ 22 points for patients with ≥6 years of education, or ≤ 18 points for those with <6 years of education [primary school or below]), severe aphasia precluding communication and assessment, a history of mental illnesses such as depression with confirmed diagnosis or ongoing treatment, severe hepatic and renal insufficiency (including Child-Pugh Class C liver function and creatinine clearance rate < 30 mL/min), and comorbid underlying diseases affecting prognosis (such as advanced tumors and severe infections).12,13 To determine the sample size, we referred to the EPV principle of logistic regression (EPV 10~20), and combined with literature and hospital data, the preset detection rate of post-stroke depression in the elderly was 38%. Since the study included 12 research factors, 120 cases of depression were required based on an EPV of 10, corresponding to a total sample size of approximately 316 cases; considering the availability of cases over 8 years and the follow-up loss rate, 691 cases were ultimately included to meet statistical requirements. The study was approved by the Hospital Ethics Committee and strictly followed the ethical guidelines of the Helsinki Declaration; additionally, all extraction and analysis of case data adhered to relevant medical ethics and privacy protection regulations, with the patient inclusion process detailed in Figure 1.
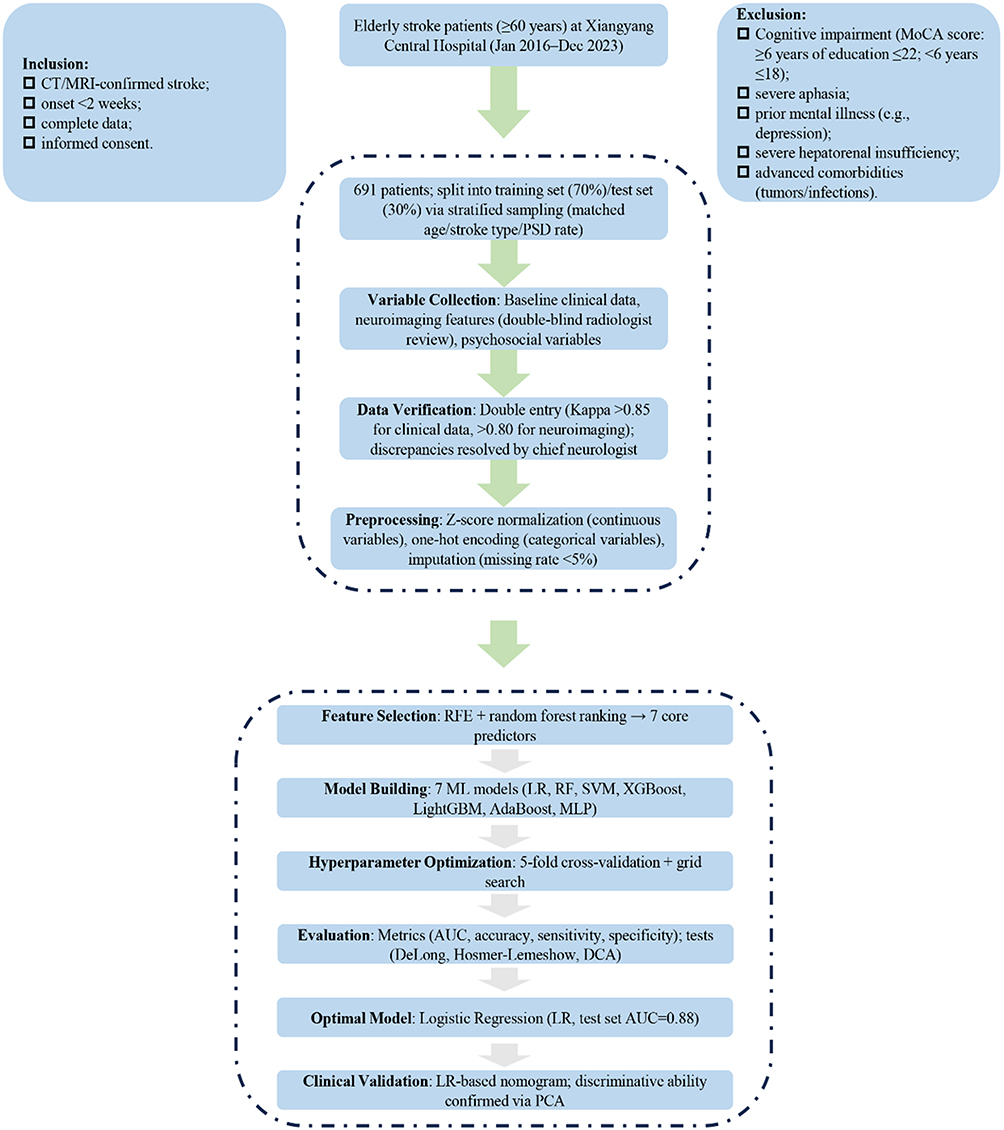 |
Figure 1 Flowchart for Patient Enrollment and Predictive Model Development. |
Entry and Collation of Variables
The predictor variables of this study included baseline clinical data, neuroimaging features, and psychosocial variables, which were extracted from electronic medical records, image archives, and follow-up databases. Two trained researchers independently collected the data, which was then verified through double entry by two separate individuals; discrepancies were resolved by a chief neurologist (with a data consistency Kappa value > 0.85). Baseline data encompassed demographic characteristics such as gender and age, underlying diseases including hypertension (either diagnosed or with blood pressure ≥ 140/90 mmHg) and diabetes mellitus (either diagnosed or with fasting blood glucose ≥ 7.0 mmol/L), core indicators like stroke type and admission NIHSS score, as well as initial laboratory results upon admission. Neuroimaging data were based on CT/MRI scans performed within 48 hours of admission, with double-blind interpretation by two radiologists (Kappa value > 0.80); indicators such as lesion location and volume (calculated using the ABC/2 method and Tada formula) and the range of DWI hyperintensity were extracted and quantitatively measured via ImageJ 1.8.0.
Psychosocial variables were assessed by combining nursing records and follow-up evaluations conducted 3 months after treatment: the Social Support Rating Scale (SSRS) was used to classify social support levels (low: ≤ 22 points, moderate: 23–44 points, high: ≥ 45 points), the 17-item Hamilton Depression Rating Scale (HAMD-17) (scores ≥ 7 indicating depression) and 14-item Hamilton Anxiety Rating Scale (HAMA-14) (scores ≥ 14 indicating anxiety) were employed to evaluate psychological status, and the Barthel Index (BI, 0–100 points) was used to assess daily living ability. Data with a missing rate < 5% were supplemented through telephone follow-up. Databases were established using EpiData 3.1 with logical validation rules (eg, ages > 120 years and NIHSS scores > 42 points were identified as outliers).
Construction and Evaluation of a Machine Learning Predictive Model
In this study, post-stroke depression in the elderly was defined as the outcome variable, with the diagnostic criterion being a score ≥ 7 on the 17-item Hamilton Depression Rating Scale (HAMD-17). The input features were strictly linked to the three categories of core indicators collected earlier to ensure data consistency and reliability, specifically including: baseline clinical data (age, gender, history of underlying diseases such as hypertension, type 2 diabetes mellitus, and coronary heart disease, National Institutes of Health Stroke Scale [NIHSS] score, initial fasting blood glucose and low-density lipoprotein test results upon admission), neuroimaging features (lesion location and volume extracted from cranial CT/MRI images within 48 hours of admission, Fazekas grading for leukoaraiosis, range of DWI hyperintensity involvement, and number of cerebral microbleeds), and psychosocial variables (Social Support Rating Scale [SSRS] score, Barthel Index [BI], and HAMA-14 score). Modeling was performed using Python 3.9 programming language, relying on toolkits such as Scikit-learn (including logistic regression, random forest, etc)., XGBoost (extreme gradient boosting), and LightGBM (light gradient boosting machine) to systematically construct 7 machine learning prediction models. The complete list of models included: logistic regression, random forest, support vector machine, extreme gradient boosting, light gradient boosting machine, adaptive boosting, and multilayer perceptron.
Data were divided into a training set (for model construction and parameter optimization) and a test set (for independent performance verification) at a ratio of 7:3 using stratified sampling. This approach ensured consistent age distribution, stroke type, and depression incidence between the two groups to reduce sampling bias. Standardized preprocessing was implemented before model training: continuous features (such as age and scale scores) were normalized using Z-score to eliminate the influence of dimensionality, while categorical features (such as gender and stroke type) were converted to numerical format using one-hot encoding. To reduce feature redundancy and improve model generalization ability, a subset of core features with the highest contribution to the depression outcome was selected through recursive feature elimination (RFE) combined with random forest feature importance ranking. Model performance was primarily evaluated using the area under the receiver operating characteristic curve (AUC), with comprehensive consideration of accuracy, sensitivity, specificity, F1-score, and Youden index. Hyperparameters (such as the number of decision trees and maximum depth for random forest, learning rate and number of tree nodes for extreme gradient boosting) were optimized using 5-fold cross-validation combined with grid search. Statistical differences in AUC among different models were compared using the DeLong test, with Bonferroni correction for multiple comparisons. Calibration curves and the Hosmer-Lemeshow test were used to assess the consistency between predicted probabilities and actual incidence of the models. Finally, decision curve analysis (DCA) was combined to select the prediction model with the optimal clinical net benefit.
Statistical Analysis
In this study, SPSS 26.0 was used to perform basic data statistics and difference tests, while Python 3.9 was employed to complete machine learning model construction, feature selection, and performance verification, with two-tailed tests applied for all analyses. Continuous data were tested for distribution using the Shapiro–Wilk test, and categorical data were described as n (%). After grouping by HAMD-17 scores, intergroup comparisons were conducted using t-tests, Mann–Whitney U-tests, or other appropriate methods based on data characteristics, and correlation analyses were performed using Spearman’s rank correlation or contingency table analysis. Data were managed with EpiData 3.1: missing values with a rate < 5% were imputed using multiple imputation, and those with a rate ≥ 5% were noted. A P-value < 0.05 was considered statistically significant.
Results
Baseline Characteristics of the Study Population
A total of 691 elderly stroke patients were enrolled in this study, including 483 in the training set and 208 in the testing set. As shown in Table 1, the median age of the overall population was 70.00 years (IQR: 66.00, 75.00), with nearly equal gender distribution in the training set (male 50.3%, female 49.7%) and a higher proportion of males in the testing set (60.1%). No significant differences were observed between the depressive and non-depressive groups in terms of age, gender, hypertension, type 2 diabetes mellitus, coronary heart disease, smoking history, drinking history, and other general characteristics (all P > 0.05). However, key clinical, neuroimaging, and psychosocial variables showed significant disparities: in both cohorts, the depressive group had higher NIHSS scores, larger lesion volumes, more cerebral microbleeds(CMBs), wider DWI involvement ranges, and higher Fazekas grades (all P < 0.001). Additionally, the depressive group exhibited lower SSRS scores, lower BI scores, and higher HAMA-14 scores (all P < 0.001). In the testing set, the proportion of hemorrhagic stroke in the depressive group was significantly higher (48.4% vs 27.1%, P = 0.03). These results indicate that neurological deficit severity, brain structural damage, social support, and anxiety status may be closely associated with PSD in the elderly.
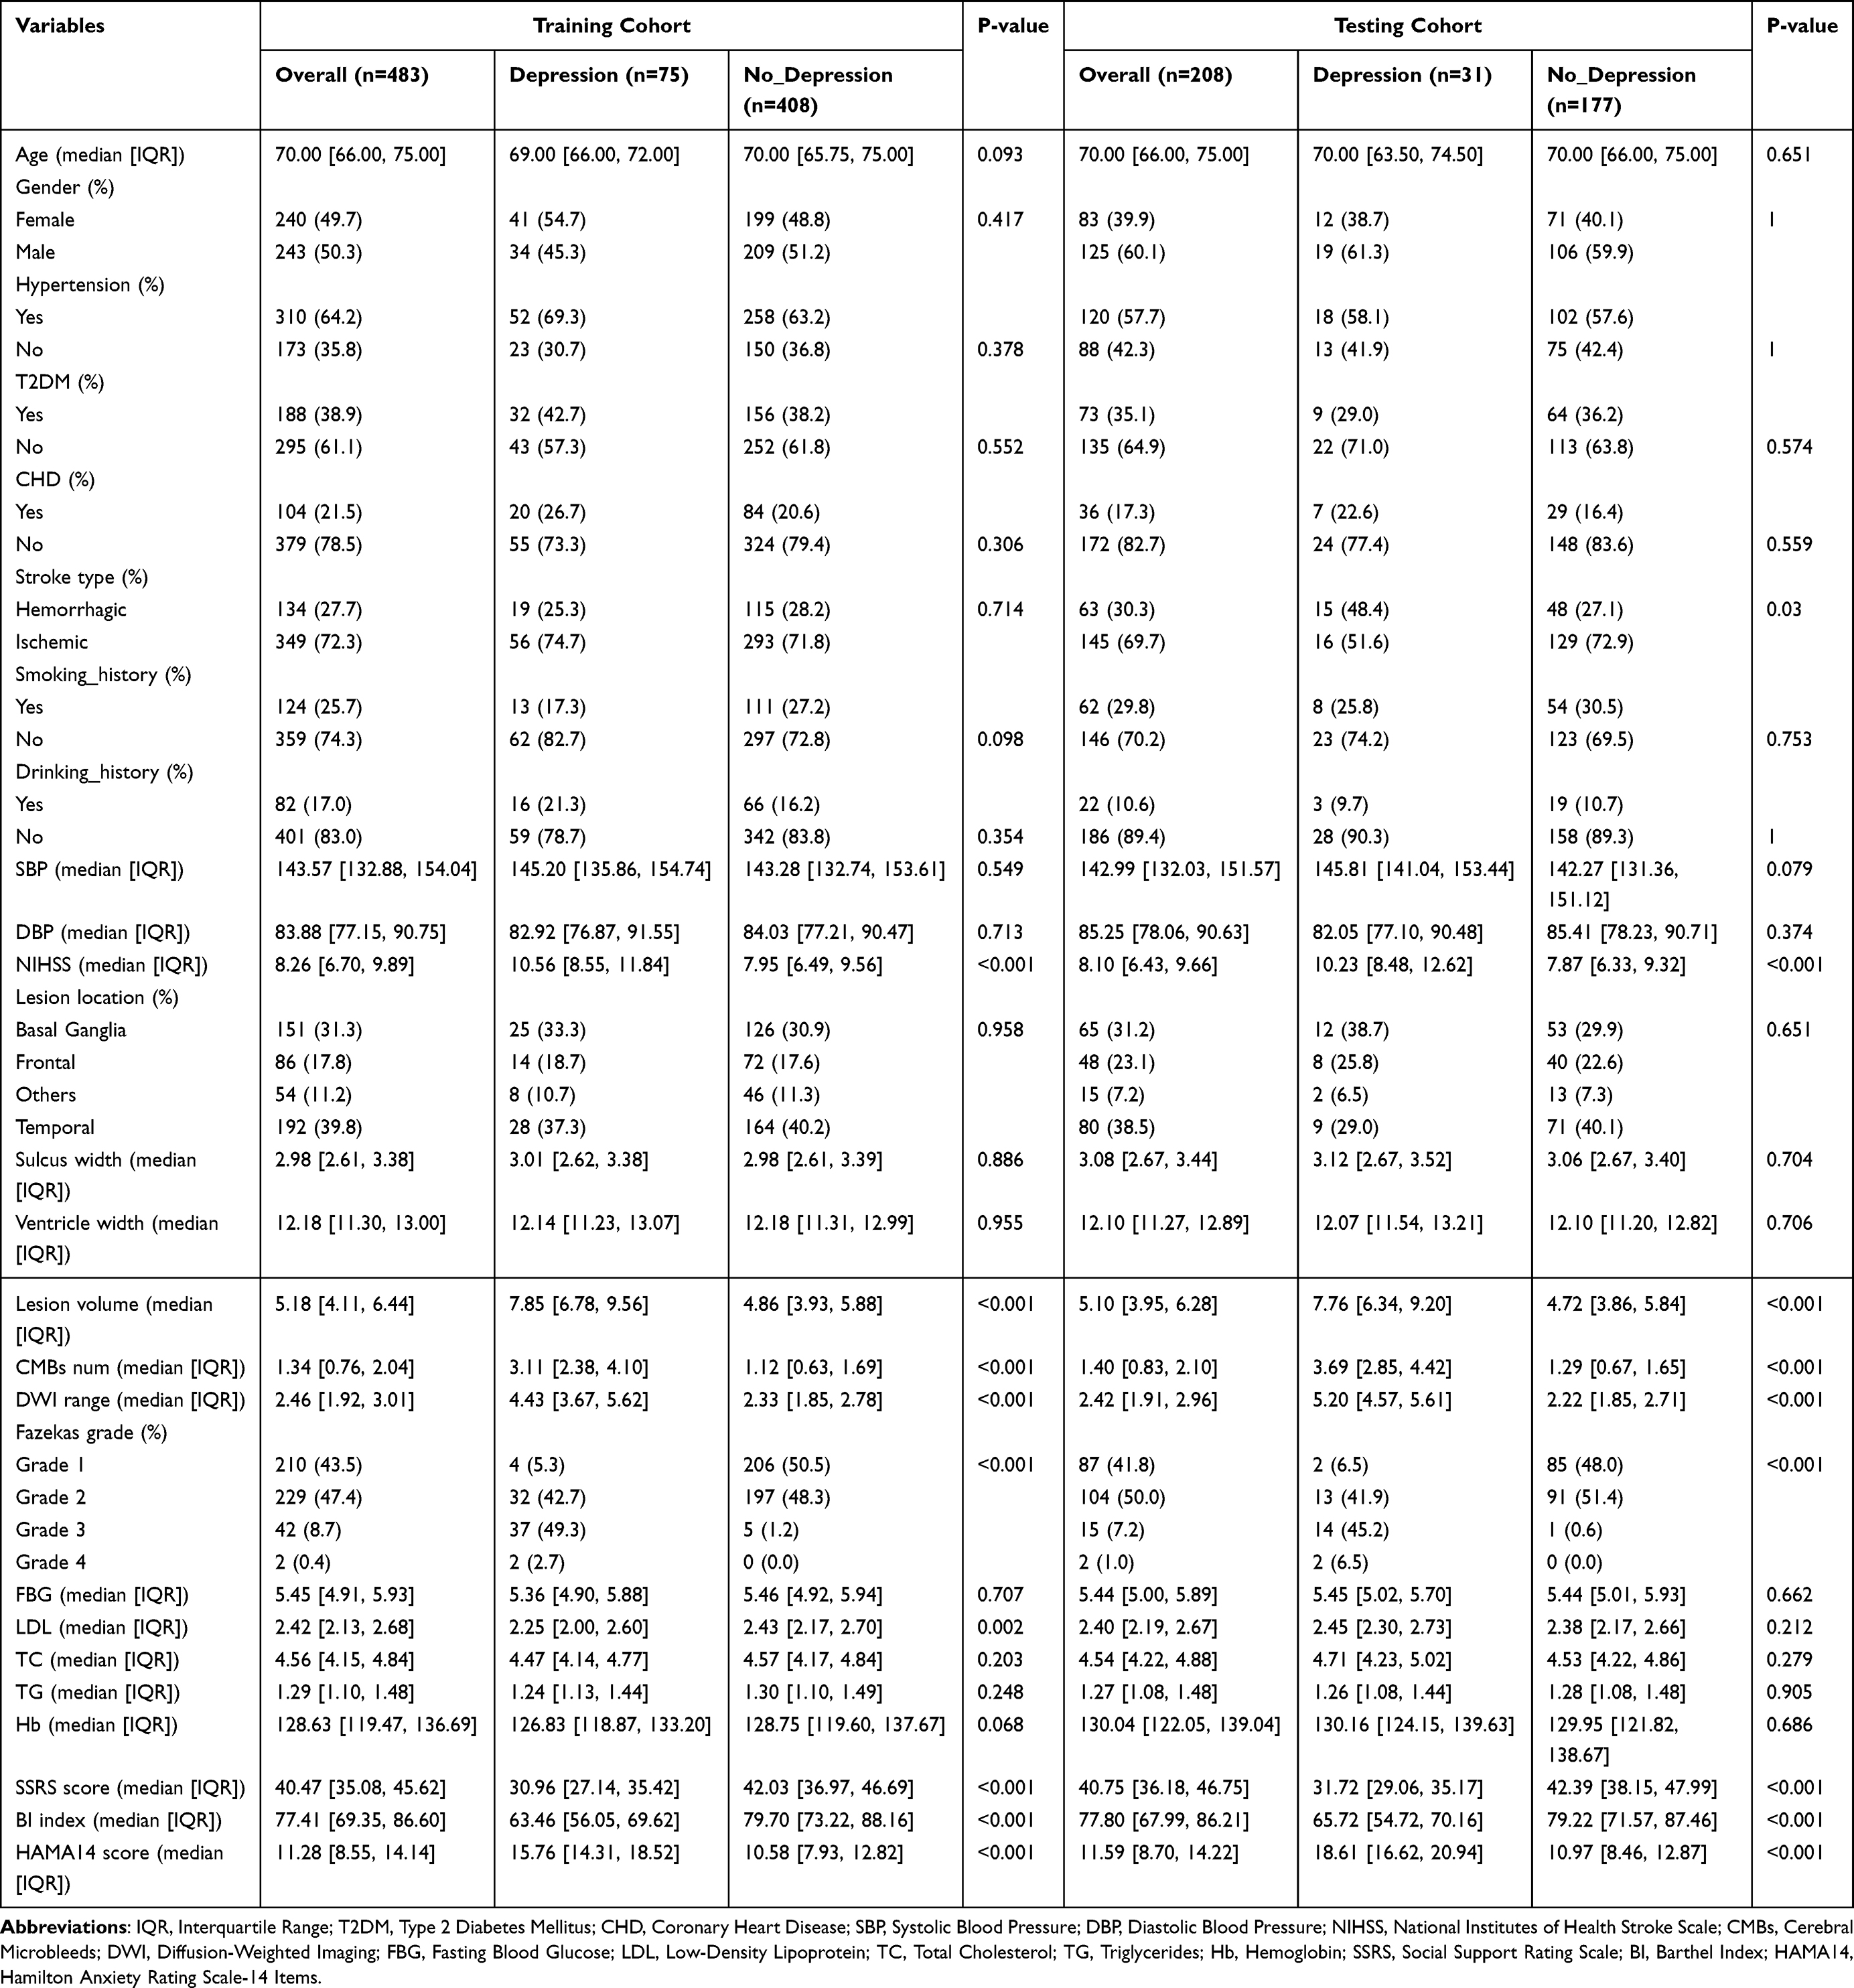 |
Table 1 Baseline Characteristics of Variables in Depressive and Non-Depressive Patients in Training and Testing Cohorts |
Selection of Predictive Variables for the PSD Risk Model
Univariate and multivariate logistic regression analyses were performed to identify potential predictors of PSD. As shown in Table 2, univariate analysis revealed that NIHSS score, lesion volume, CMBs number, DWI range, Fazekas grade (Grade 3–4 vs 1–2), SSRS score, and HAMA-14 score were significantly correlated with PSD (all P < 0.001). After adjusting for confounding factors, multivariate logistic regression confirmed these seven variables as independent predictors of PSD (all P < 0.001). Further variable screening was conducted using correlation analysis, LASSO regression, and Shapley value analysis (Figure 2). The correlation heatmap (Figure 2A) showed no severe multicollinearity among the candidate variables. The LASSO regression coefficient path plot (Figure 2B) and error curve (Figure 2C) helped eliminate redundant variables and determine the optimal lambda value. Shapley value-based weight analysis (Figure 2D) quantified the contribution of each variable, with HAMA-14 score, lesion volume, and CMBs number ranking among the top contributors. These results collectively confirmed that the seven independent variables identified by logistic regression are the core predictive factors for constructing the PSD risk model, covering clinical, neuroimaging, and psychosocial dimensions.
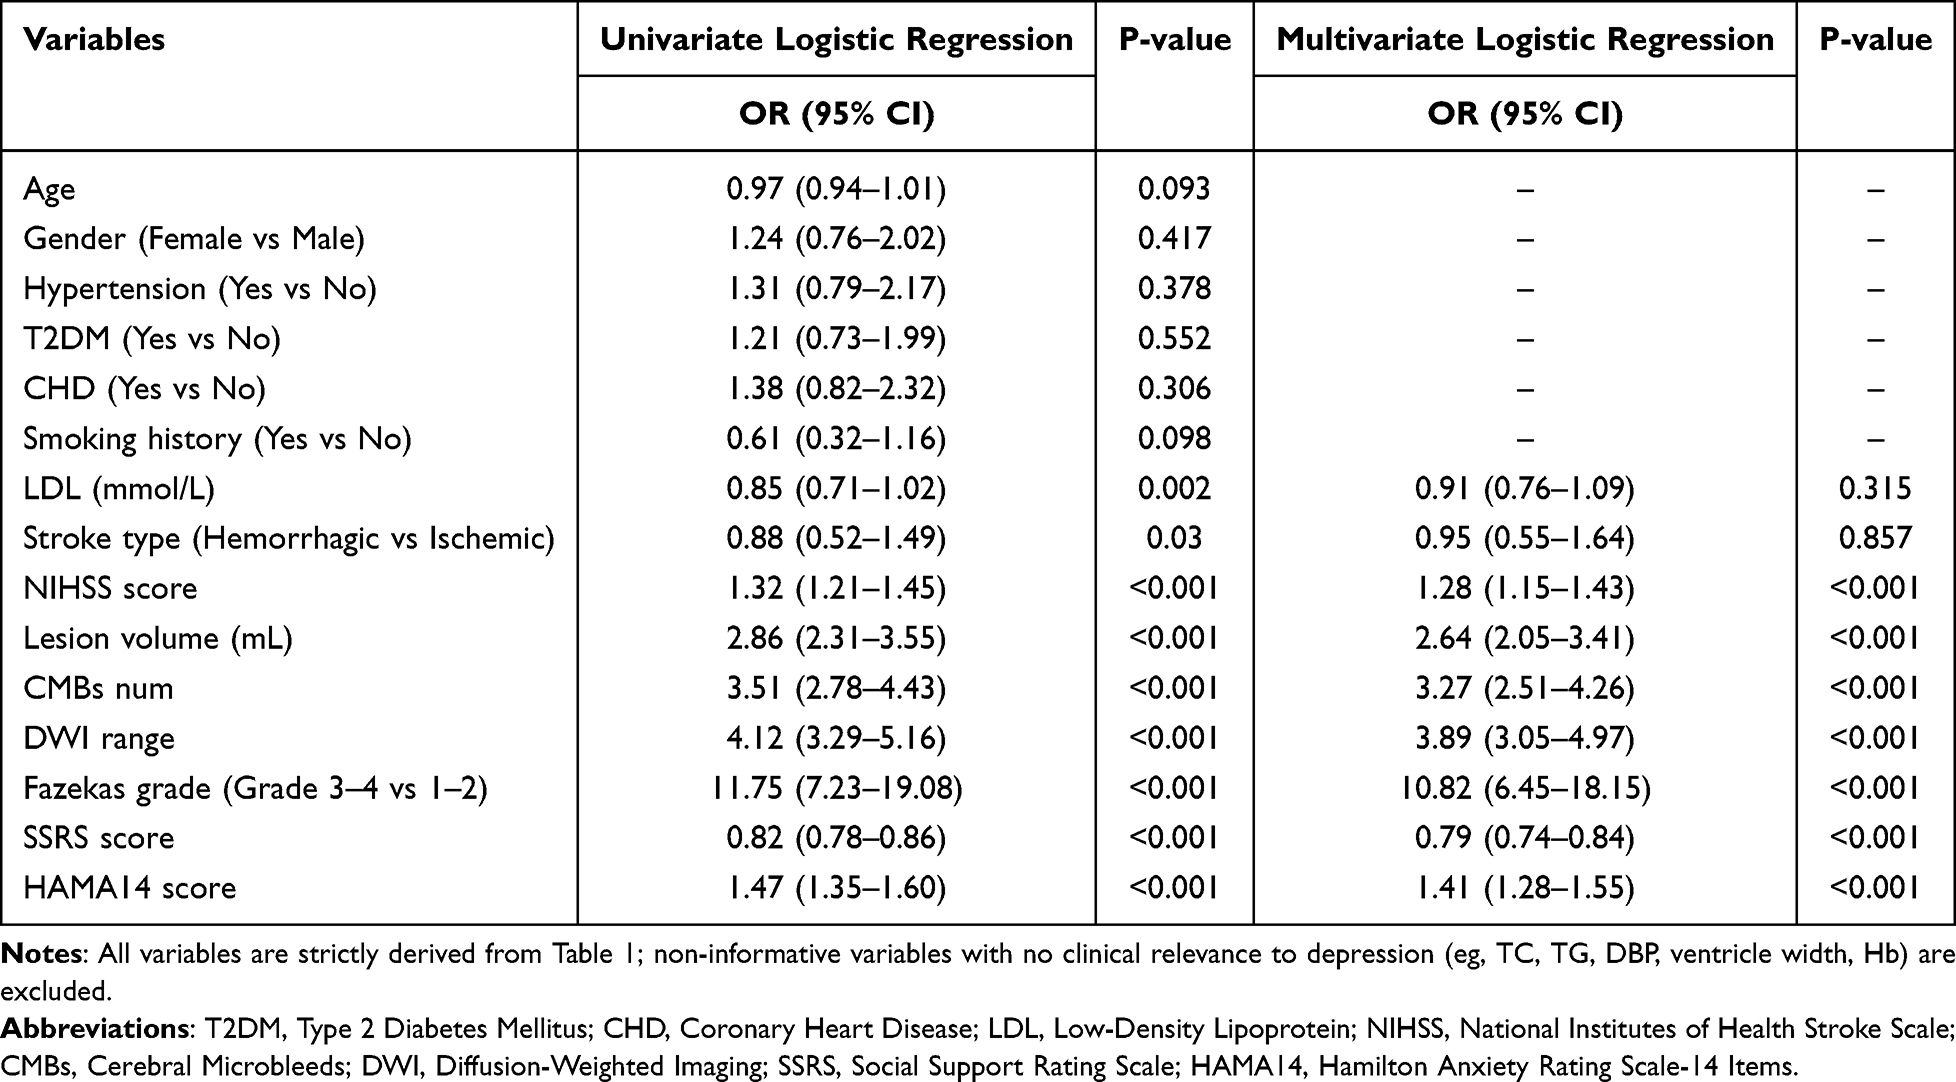 |
Table 2 Univariate and Multivariate Logistic Regression Analyses for Depression |
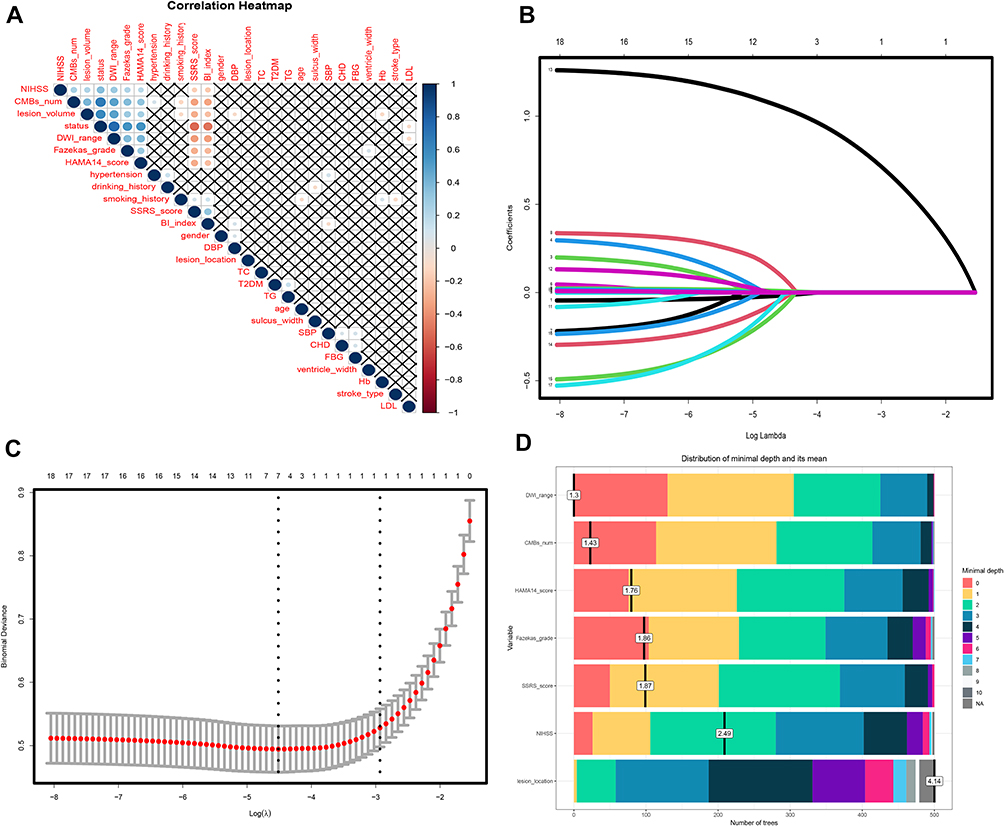 |
Figure 2 Multimodal Variable Selection for Depression Prediction in Elderly Stroke Patients. Notes: (A) Correlation heatmap depicting pairwise correlations among clinical, imaging, and psychological variables relevant to depression prediction in elderly stroke patients. (B) LASSO regression coefficient path plot, showing the evolution of feature coefficients for depression prediction as log lambda increases. (C) LASSO regression error curve plot, displaying the relationship between log lambda and cross-validation error in identifying depression predictors. (D) Shapley value-based weight analysis plot, quantifying the contribution and importance of each candidate variable to depression prediction in elderly stroke patients. |
Comparative Analysis of Predictive Performance Among Machine Learning Models
Seven machine learning models were constructed to predict PSD risk, and their performance was evaluated using multiple metrics in both training and testing sets (Table 3). Among all models, the logistic regression (LR) model achieved the best overall performance: in the training set, it had an accuracy of 0.90, a sensitivity of 0.89, a specificity of 0.87, and an area under the AUC of 0.90; in the testing set, these metrics were 0.89, 0.88, 0.85, and 0.88, respectively. Other models, including gradient boosting decision tree (GBDT), random forest (RF), extreme gradient boosting (XGBoost), support vector machine (SVM), LightGBM, and multilayer perceptron (MLP), showed lower performance, with AUC values ranging from 0.72 to 0.81 in the training set and 0.70 to 0.79 in the testing set. The ROC curves (Figure 3C and D) clearly demonstrated that the LR model had the largest AUC in both datasets. As shown in Figure 3A and B, the DCA indicated that the LR model provided a higher net clinical benefit than other models across a wide range of threshold probabilities. These findings suggest that the LR model has superior predictive accuracy, stability, and generalization ability compared to other machine learning models in predicting elderly PSD risk.
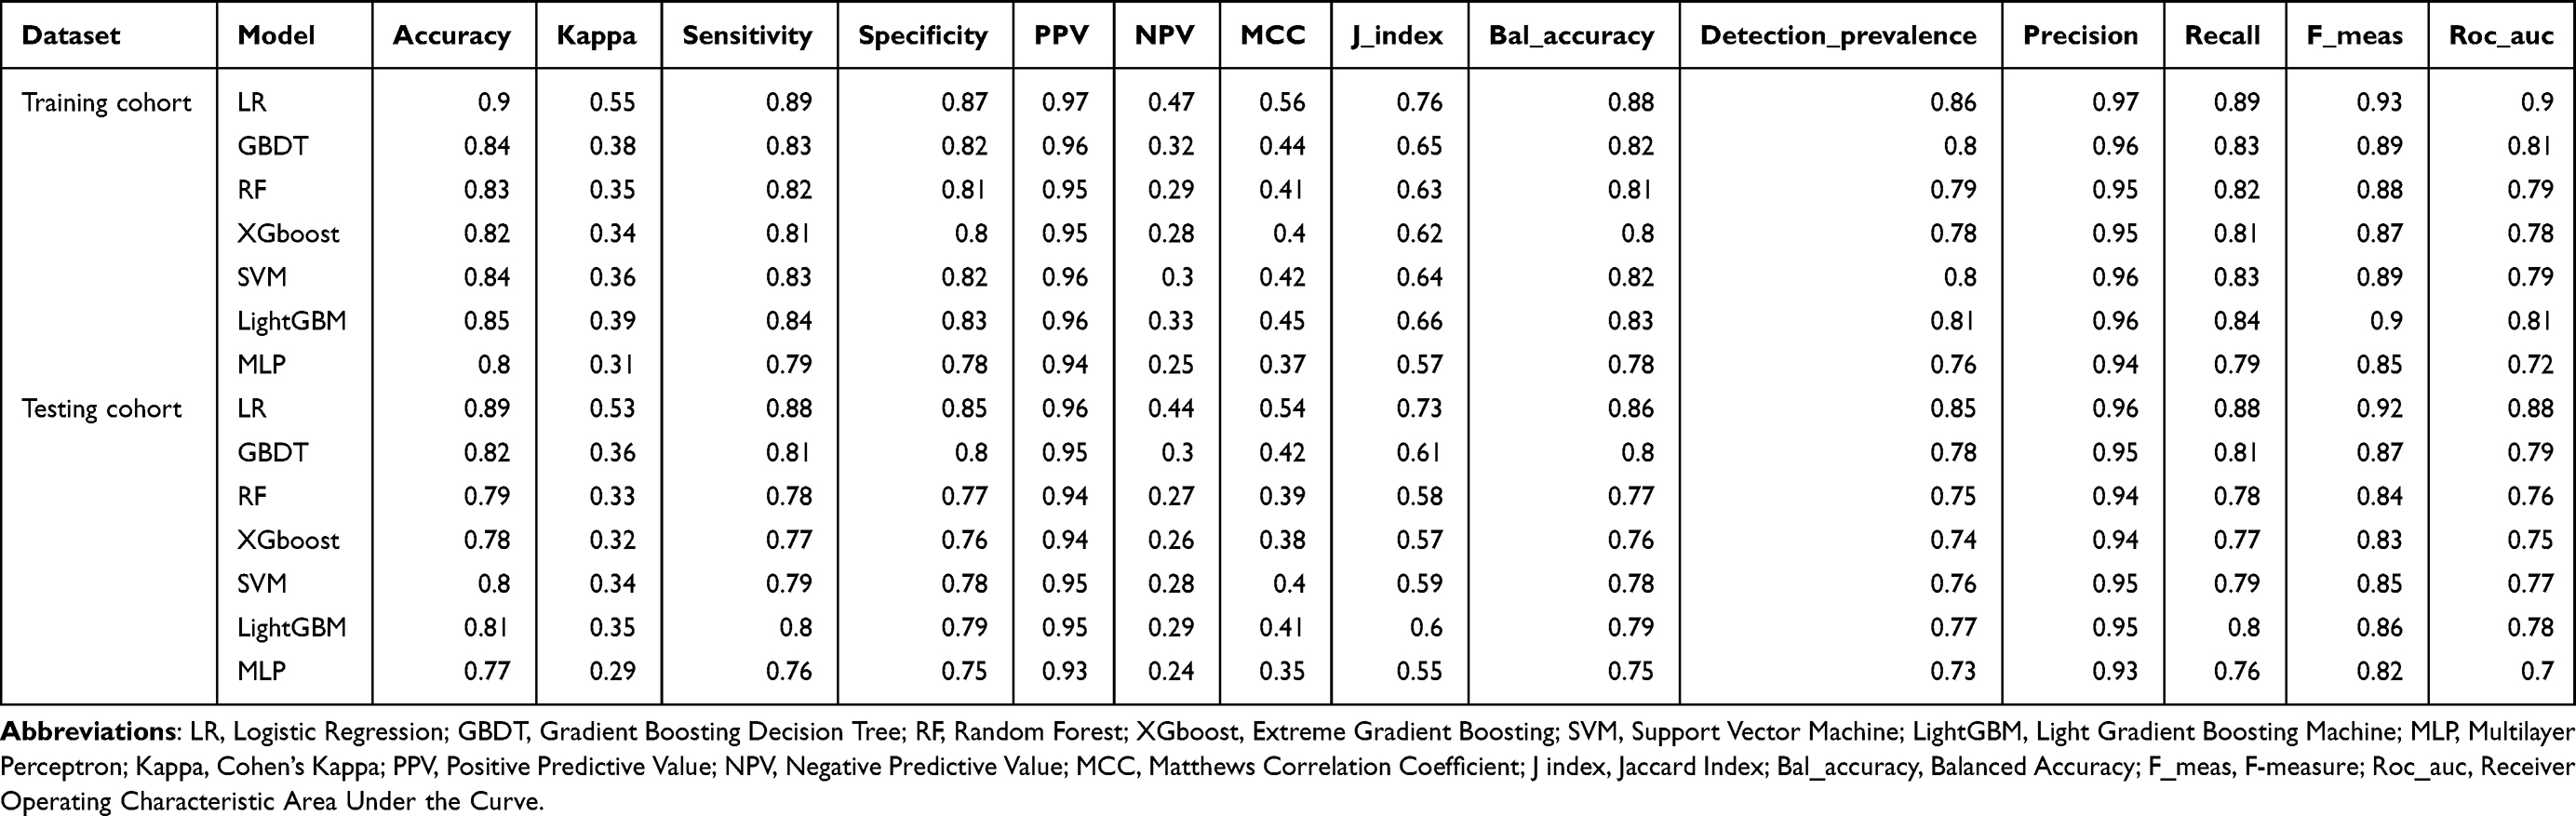 |
Table 3 Multi-Dimensional Performance Metric Comparison of Various Machine Learning Models in Training vs Testing Datasets |
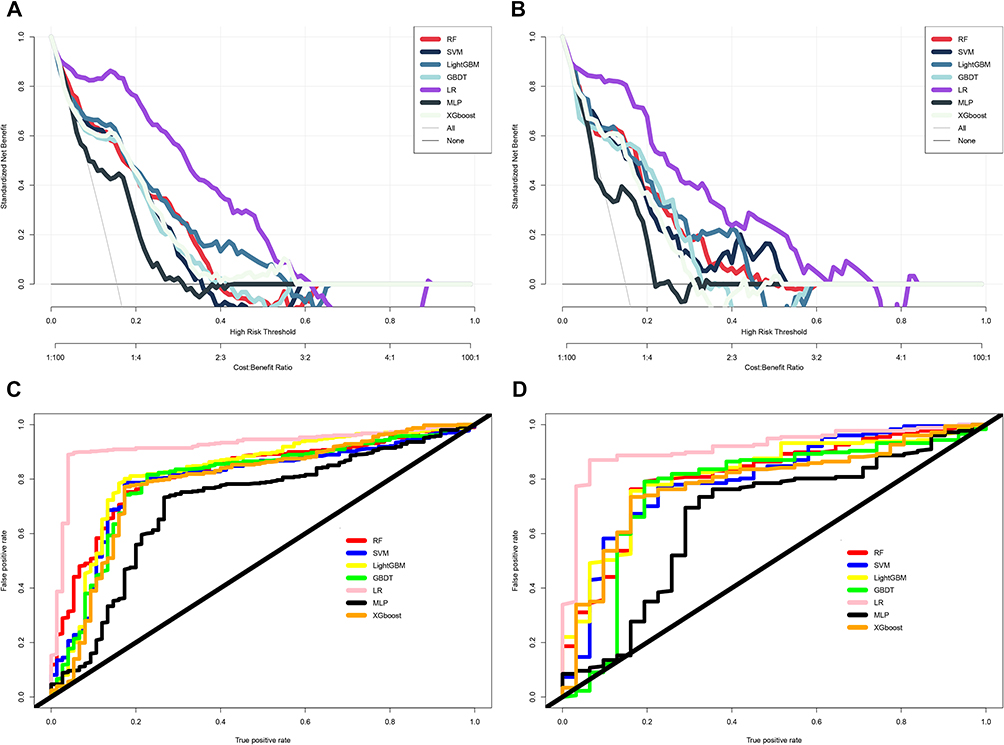 |
Figure 3 Comparative Predictive Performance Evaluation of Machine Learning Models for Post-stroke depression. (A and B) DCA in Training and Testing dataset; (C and D) ROC curves in Training and Testing dataset. |
Clinical Application Evaluation of the Optimal Predictive Model
Based on the LR model, a nomogram was established to visualize the PSD risk prediction (Figure 4A). The nomogram integrated the seven core predictive variables, allowing clinicians to calculate individual PSD risk by summing the points corresponding to each variable. Calibration curves for the training set (Figure 4B) and testing set (Figure 4C) showed good consistency between the predicted probabilities of the nomogram and the actual PSD incidence, indicating high calibration performance. Principal component analysis (PCA) further validated the model’s discriminative ability: as shown in Supplementary Figure 1, the PSD and non-PSD groups were clearly separated in both the training and testing set, with the first principal component explaining 35.9% and 38.0% of the total variance, respectively. These results confirm that the nomogram derived from the LR model has excellent clinical applicability, as it can accurately distinguish high-risk elderly stroke patients prone to PSD and provide intuitive risk assessment tools for clinical practice.
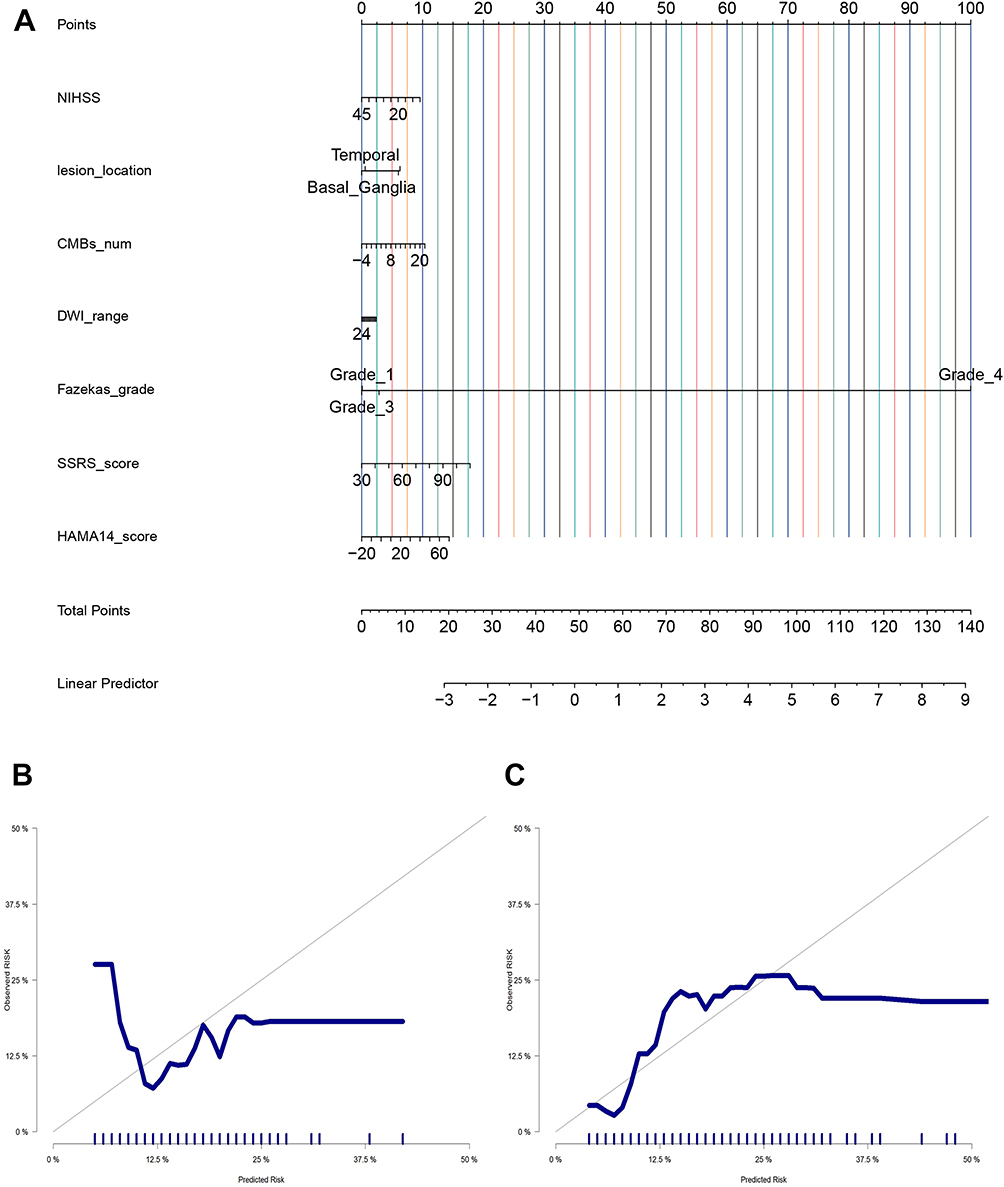 |
Figure 4 Nomogram Model for Predicting Post-Stroke Depression (PSD) with (A) Risk Assessment Nomogram, (B) Training Set Calibration Curve, and (C) Testing Set Calibration Curve. |
Discussion
On a global scale, PSD afflicts approximately 30% to 50% of stroke patients, profoundly impeding neurological rehabilitation, diminishing quality of life, and elevating the risk of stroke recurrence and mortality.14–16Yet it is often overlooked in clinical practice due to prioritization of physical recovery, overlapping symptoms, insufficient clinical awareness, and patient concealment.17,18 Against this backdrop the present retrospective cohort study focused on elderly stroke patients. These patients represent a high-risk group for PSD. The study integrated baseline clinical data, neuroimaging features and psychosocial variables. It aimed to construct machine learning-based PSD risk prediction models. The results showed that the logistic regression (LR) model emerged as the optimal predictor with an area under the AUC of 0.88 in the test set, and seven independent variables were identified as core predictors of PSD. This study addresses critical limitations of existing PSD prediction models such as overreliance on single-dimensional variables, poor adaptability to the elderly, and limited clinical practicality. By developing a clinically applicable nomogram, it provides a reliable tool for early risk stratification of PSD in elderly stroke patients, laying a foundation for individualized prevention and intervention to improve rehabilitation outcomes.
Seven independent predictors were identified. They are NIHSS, lesion volume, number of CMBs, DWI involvement range, Fazekas grade, SSRS and HAMA-14. The identification of these predictors aligns with the multi-dimensional pathogenesis of PSD. It is also supported by both pathophysiological mechanisms and existing research. The NIHSS score, a direct marker of neurological deficit severity, was confirmed as a robust predictor, which is consistent with findings from studies like Fang et al.19 Pathophysiologically, severe neurological deficits often involve damage to brain regions critical for emotional regulation, such as the prefrontal cortex, limbic system, and hypothalamic-pituitary-adrenal axis.20,21 This damage disrupts the synthesis and transmission of neurotransmitters like serotonin and norepinephrine that are essential for mood maintenance, thereby elevating depressive risk.22,23 Lesion volume and CMB number, two key neuroimaging indicators in this study, reflect the extent of brain structural damage and small-vessel disease respectively. Larger lesions can directly destroy monoaminergic neurotransmitter pathways, while CMBs indicate chronic cerebral hypoperfusion and blood-brain barrier dysfunction, both of which exacerbate neuronal vulnerability and further increase PSD risk. This finding extends previous research that primarily focused on lesion location rather than quantitative indicators like volume or CMB count, highlighting the value of precise neuroimaging measurements in capturing subtle structural changes linked to PSD.24,25 The Fazekas grade assesses the severity of WMLs, which are a key marker of cerebral small-vessel disease (cSVD), and it also emerged as a significant predictor of PSD. White matter lesions can impair functional connectivity between emotional regulation centers and other brain regions, a mechanism that aligns with the findings of Zhang et al24, who reported an association between vascular white matter changes and affective disorders in the elderly.
In terms of psychosocial factors, lower SSRS scores (indicating insufficient social support) and higher HAMA-14 scores (indicating significant anxiety) were strongly associated with PSD, which fits the biopsychosocial model of depression. Social support acts as a buffer against psychological stress. Such stress is caused by stroke-related disability and role transitions. Insufficient support reduces access to emotional and practical resources. This thereby increases depressive risk. This conclusion has been corroborated by Sun et al.26 The strong predictive power of HAMA-14 scores underscores the high comorbidity of anxiety and depression after stroke. This comorbidity may stem from shared pathophysiological mechanisms such as neurotransmitter imbalance or overlapping neural circuitry involvement.27,28 In clinical practice, anxiety often precedes depression in stroke patients because the uncertainty of recovery and functional impairment trigger persistent psychological distress that gradually evolves into depressive symptoms over time. Additionally, the test set revealed a significantly higher proportion of hemorrhagic stroke in the depressive group (48.4% vs 27.1%, P=0.03), suggesting that hemorrhagic stroke may pose a greater PSD risk than ischemic stroke in the elderly. This observation is partially supported by Lin et al who reported a higher PSD incidence in hemorrhagic stroke patients.29 The underlying reason may be that hemorrhagic stroke causes more sudden and severe damage to brain tissue compared to the gradual ischemia in ischemic stroke, leading to more profound disruption of emotional regulation pathways.30,31 However, this finding requires validation in larger multi-center cohorts to confirm its generalizability.
Notably, the LR model outperformed other machine learning algorithms (including random forest, XGBoost, and support vector machine) in both predictive accuracy and clinical utility, and this superiority can be attributed to several key factors. First, the LR model offers strong interpretability by establishing clear linear relationships between predictors and PSD risk. This allows clinicians to easily understand how each variable contributes to the prediction, a critical advantage over “black-box” ensemble models like XGBoost and LightGBM whose internal decision-making processes are difficult to explain and may thus be less trusted by healthcare providers in clinical practice. Second rigorous feature selection methods were applied. These methods combine recursive feature elimination with random forest importance ranking. They eliminated redundant variables. They also ensured no severe multicollinearity among the seven core predictors. This optimization is particularly beneficial for linear models like LR, as multicollinearity can distort coefficient estimates and reduce predictive stability. In contrast, complex ensemble models may overfit to noise in the data, especially given the moderate sample size (691 cases) of this study, leading to reduced generalization ability in the test set. This finding differs from Gu et al who reported that the Gradient Boosting Decision Tree model achieved an AUC of 0.86 for PSD prediction.32 The discrepancy may stem from differences in study populations (for example, Wang et al included non-elderly patients) or variable sets (they did not integrate both neuroimaging and psychosocial data).33 Furthermore, the nomogram derived from the LR model demonstrated excellent calibration; calibration curves showed consistent predicted probabilities and actual PSD incidence in both the training and test sets, and principal component analysis confirmed clear separation between PSD and non-PSD groups. These results confirm that the LR model not only has high predictive accuracy but also provides an intuitive tool for bedside risk assessment.
When compared to existing PSD prediction models, the present study offers notable innovations while aligning with key findings in the field. Consistent with previous research, it confirmed the predictive roles of NIHSS score, social support, and anxiety, reinforcing the robustness of these variables across different populations. However, unlike most existing models that rely solely on clinical factors or neuroimaging data, this study integrated three dimensions of variables (clinical, neuroimaging, psychosocial) to cover the physiological-psychological-social spectrum of PSD pathogenesis. This approach addresses the multi-factorial nature of PSD and improves predictive comprehensiveness. Additionally, the inclusion of CMB number and Fazekas grade as key predictors provides new insights into the vascular basis of PSD in the elderly. Previous studies rarely incorporated these quantitative neuroimaging markers, and their inclusion highlights the importance of assessing small-vessel disease and white matter changes in risk stratification for elderly stroke patients who are more prone to such vascular pathologies. The high AUC (0.88) of the LR model in the test set also exceeds that of many existing models (which typically range from 0.70 to 0.85). This superior performance may be attributed to strict inclusion and exclusion criteria. These criteria exclude patients with pre-existing mental illnesses or cognitive impairment. Such exclusion has reduced confounding factors. The performance may also relate to rigorous data collection and verification processes. Trained researchers conduct double entry in these processes. Experts resolve discrepancies when they occur. These measures have ensured data quality.This study has several limitations that warrant consideration. First, it is a single-center retrospective study, which may introduce selection bias and limit the generalizability of results to other healthcare settings or populations. Second, psychosocial variables were assessed 3 months after stroke, and the long-term predictive performance of the model (for example, at 6 or 12 months post-stroke) remains unclear. Third, potential predictors such as genetic factors, gut microbiota composition, and medication use (including antidepressants and antihypertensives) were not included due to data availability, which may have affected the model’s comprehensiveness. Fourth, the assessment of psychosocial variables relied on nursing records and follow-up evaluations, which may be subject to subjective bias. Future research should address these limitations by conducting multi-center prospective studies with longer follow-up periods, incorporating additional potential predictors, and validating the model in diverse elderly populations (such as different ethnicities or socioeconomic backgrounds). Furthermore, developing user-friendly tools (like mobile applications or web-based calculators) based on the nomogram could facilitate bedside risk assessment, and interventional studies are needed to verify whether early targeted interventions (such as psychological counseling and social support enhancement) for high-risk patients reduce PSD incidence and improve rehabilitation outcomes.
Conclusion
Our study constructed and validated a machine learning-based PSD risk prediction model for elderly stroke patients via multi-dimensional variables. The LR model (7 predictors: NIHSS score, lesion volume, CMB number, DWI range, Fazekas grade, SSRS score, HAMA-14 score) achieved high accuracy (AUC=0.88 in test set) with good stability and clinical applicability. Its nomogram aids early identification of high-risk patients. This further supports individualized prevention and intervention. The ultimate goals are to reduce PSD incidence and improve rehabilitation effects. Innovatively integrating quantitative neuroimaging markers (CMB number, Fazekas grade), the study addresses unmet needs for reliable PSD prediction in this group, aligning with existing evidence. Limited by single-center retrospective design, future multi-center prospective studies and interventional trials are needed for validation.
Disclosure
Liangjin Zhang and Ping Yu contributed equally as co-first authors. Liu Yang and Zian Zhong are co-corresponding authors. The authors report no conflicts of interest in this work.
References
1. Guzik A, Bushnell C. Stroke epidemiology and risk factor management. Continuum. 2017;23(1):15–15. doi:10.1212/CON.0000000000000416
2. Feigin VL, Brainin M, Norrving B, et al. World stroke organization: global stroke fact sheet 2025. Int J Stroke. 2025;20(2):132–144. doi:10.1177/17474930241308142
3. Guo J, Wang J, Sun W, Liu X. The advances of post-stroke depression: 2021 update. J Neurol. 2022;269(3):1236–1249. doi:10.1007/s00415-021-10597-4
4. Cai W, Mueller C, Li YJ, Shen WD, Stewart R. Post stroke depression and risk of stroke recurrence and mortality: a systematic review and meta-analysis. Ageing Res Rev. 2019;50:102–109. doi:10.1016/j.arr.2019.01.013
5. Getachew B, Mulu A. Prevalence and associated factors of post-stroke depression in Africa: a systematic review and meta-analysis. BMC Neurol. 2024;24(1):360. doi:10.1186/s12883-024-03867-x
6. Das J, KR G. Post stroke depression: the sequelae of cerebral stroke. Neurosci Biobehav Rev. 2018;90:104–114. doi:10.1016/j.neubiorev.2018.04.005
7. Shi Y, Yang D, Zeng Y, Wu W. Risk factors for post-stroke depression: a meta-analysis. Front Aging Neurosci. 2017;9:218. doi:10.3389/fnagi.2017.00218
8. Frank D, Gruenbaum BF, Zlotnik A, Semyonov M, Frenkel A, Boyko M. Pathophysiology and current drug treatments for post-stroke depression: a review. Int J Mol Sci. 2022;23(23).
9. Villa RF, Ferrari F, Moretti A. Post-stroke depression: mechanisms and pharmacological treatment. Pharmacol Ther. 2018;184:131–144. doi:10.1016/j.pharmthera.2017.11.005
10. Handelman GS, Kok HK, Chandra RV, Razavi AH, Lee MJ, Asadi H. eDoctor: machine learning and the future of medicine. J Internal Med. 2018;284(6):603–619. doi:10.1111/joim.12822
11. Husile H, Bao Q, Sarula S, et al. Accuracy of machine learning in predicting post-stroke depression: a systematic review and meta-analysis. Brain and Behav. 2025;15(5):e70557. doi:10.1002/brb3.70557
12. García-Pérez P, Rodríguez-Martínez MC, Gallardo-Tur A, Blanco-Reina E, de la Cruz-Cosme C, Lara JP. Early Occupational Therapy Intervention post-stroke (EOTIPS): a randomized controlled trial. PLoS One. 2024;19(8):e0308800. doi:10.1371/journal.pone.0308800
13. Lin C, Ren Y, Lu A. The effectiveness of virtual reality games in improving cognition, mobility, and emotion in elderly post-stroke patients: a systematic review and meta-analysis. Neurosurgical Rev. 2023;46(1):167. doi:10.1007/s10143-023-02061-w
14. Wijeratne T, Sales C, Wijeratne C. A narrative review on the non-pharmacologic interventions in post-stroke depression. Psychol Res and Behav Manag. 2022;15:1689–1706. doi:10.2147/PRBM.S310207
15. Gallucci L, Sperber C, Guggisberg AG, et al. Post-stroke cognitive impairment remains highly prevalent and disabling despite state-of-the-art stroke treatment. Int J of Stroke. 2024;19(8):888–897. doi:10.1177/17474930241238637
16. Dec-ćwiek M, Wrona P, Homa T, Słowik J, Bodzioch A, Słowik A. Incidence and factors associated with cognitive impairment 90 days after first ever ischemic stroke. Int J Geriatric Psychiatry. 2025;40(5):e70087. doi:10.1002/gps.70087
17. Butsing N, Zauszniewski JA, Ruksakulpiwat S, Griffin MTQ, Niyomyart A. Association between post-stroke depression and functional outcomes: a systematic review. PLoS One. 2024;19(8):e0309158. doi:10.1371/journal.pone.0309158
18. Mușat MI, Cătălin B, Hadjiargyrou M, Popa-Wagner A, Greșiță A. Advancing post-stroke depression research: insights from murine models and behavioral analyses. Life. 2024;14(9):1110. doi:10.3390/life14091110
19. Yang F, Zhang P. Prevalence and predictive factors of post-stroke depression in patients with acute cerebral infarction. Alpha Psychiatry. 2024;25(5):592–597. doi:10.5152/alphapsychiatry.2024.231381
20. Gu P, Ding Y, Ruchi M, et al. Post-stroke dizziness, depression and anxiety. Neurological Res. 2024;46(5):466–478. doi:10.1080/01616412.2024.2328490
21. Chang X, He Y, Liu Y, et al. Serum brain derived neurotrophic factor levels and post-stroke depression in ischemic stroke patients. J Affective Disorders. 2024;361:341–347. doi:10.1016/j.jad.2024.06.050
22. Zhan Q, Kong F. Mechanisms associated with post-stroke depression and pharmacologic therapy. Front Neurol. 2023;14:1274709. doi:10.3389/fneur.2023.1274709
23. Jing D, Hou X, Guo X, et al. Astrocytes in post-stroke depression: roles in inflammation, neurotransmission, and neurotrophin signaling. Cell Mol Neurobiol. 2023;43(7):3301–3313. doi:10.1007/s10571-023-01386-w
24. Zhang X, Tang Y, Xie Y, et al. Total magnetic resonance imaging burden of cerebral small-vessel disease is associated with post-stroke depression in patients with acute lacunar stroke. Eur J Neurol. 2017;24(2):374–380. doi:10.1111/ene.13213
25. Cao WW, Wang Y, Dong Q, et al. Deep microbleeds and periventricular white matter disintegrity are independent predictors of attention/executive dysfunction in non-dementia patients with small vessel disease. Int. Psychogeriatr. 2017;29(5):793–803. doi:10.1017/S1041610216002118
26. Sun X, Wang Z, Song Y, et al. Development and validation of a decision tree model for prediction of insomnia risk among ischemic stroke convalescence patients. BMC Public Health. 2025;25(1):2841. doi:10.1186/s12889-025-24025-z
27. Harrison M, Ryan T, Gardiner C, Jones A. Psychological and emotional needs, assessment, and support post-stroke: a multi-perspective qualitative study. Topic Stroke Rehabilitat. 2017;24(2):119–125. doi:10.1080/10749357.2016.1196908
28. Kuang J, Yang L, Lv R, Li J, Zhou K, Xu M. The mediating effect of post-stroke depression between social support and quality of life among stroke survivors: a meta-analytic structural equation modeling. Int J Geriatric Psychiatry. 2022;37(12). doi:10.1002/gps.5820
29. Lin HL, Sung FC, Muo CH, Chen PC. Depression risk in post-stroke aphasia patients: a nationwide population-based cohort study. Neuroepidemiology. 2023;57(3):162–169. doi:10.1159/000530070
30. Wen QH, Liu Y, Chen HD, et al. Relationship between depression after hemorrhagic stroke and auditory event-related potentials in a chinese patient group. Neuropsychiatr Dis Treat. 2022;18:1917–1925. doi:10.2147/NDT.S362824
31. Shi ZM, Jing JJ, Xue ZJ, et al. Stellate ganglion block ameliorated central post-stroke pain with comorbid anxiety and depression through inhibiting HIF-1α/NLRP3 signaling following thalamic hemorrhagic stroke. J Neuroinflammation. 2023;20(1):82. doi:10.1186/s12974-023-02765-2
32. Gu Y, Xue J, Xia X, et al. Prediction of post stroke depression with machine learning: a national multicenter cohort study. J Psychiatr Res. 2025;187:123–133. doi:10.1016/j.jpsychires.2025.05.015
33. Wang Y, Pan XF, Pan A. Lipidomics in gestational diabetes mellitus. Curr Opin Lipidol. 2023;34(1):1–11. doi:10.1097/MOL.0000000000000858
 © 2026 The Author(s). This work is published and licensed by Dove Medical Press Limited. The
full terms of this license are available at https://www.dovepress.com/terms
and incorporate the Creative Commons Attribution
- Non Commercial (unported, 4.0) License.
By accessing the work you hereby accept the Terms. Non-commercial uses of the work are permitted
without any further permission from Dove Medical Press Limited, provided the work is properly
attributed. For permission for commercial use of this work, please see paragraphs 4.2 and 5 of our Terms.
© 2026 The Author(s). This work is published and licensed by Dove Medical Press Limited. The
full terms of this license are available at https://www.dovepress.com/terms
and incorporate the Creative Commons Attribution
- Non Commercial (unported, 4.0) License.
By accessing the work you hereby accept the Terms. Non-commercial uses of the work are permitted
without any further permission from Dove Medical Press Limited, provided the work is properly
attributed. For permission for commercial use of this work, please see paragraphs 4.2 and 5 of our Terms.
Recommended articles
Machine Learning-Based Prediction of Subsequent Vascular Events After 6 Months in Chinese Patients with Minor Ischemic Stroke
Zhang R, Wang J
International Journal of General Medicine 2022, 15:3797-3808
Published Date: 7 April 2022
A Machine Learning Model for Predicting Diabetic Nephropathy Based on TG/Cys-C Ratio and Five Clinical Indicators
Zhou D, Shao L, Yang L, Chen Y, Zhang Y, Yue F, Gu W, Li S, Li S, Wei J
Diabetes, Metabolic Syndrome and Obesity 2025, 18:955-967
Published Date: 31 March 2025
Advanced Machine Learning did not Surpass Traditional Logistic Regression in First-Trimester Gestational Diabetes Mellitus Prediction: A Retrospective Single-Center Study From Eastern China
Ni H, Miao J, Chen J
International Journal of General Medicine 2025, 18:2263-2274
Published Date: 26 April 2025
A Real-Time Plasma Concentration Prediction Model for Voriconazole in Elderly Patients via Machine Learning Combined with Population Pharmacokinetics
Liu R, Ma P, Chen D, Yu M, Xie L, Zhao L, Huang Y, Shang S, Chen Y
Drug Design, Development and Therapy 2025, 19:4021-4037
Published Date: 17 May 2025
Exploring Inflammatory-Related Factors Associated with Postoperative Length of Hospital Stay in Elderly Patients Undergoing Gastrointestinal Tumor Surgery Using Machine Learning
Liu J, Hu Y, Zhan X, Wang H, Li C
Journal of Inflammation Research 2025, 18:12589-12597
Published Date: 12 September 2025