Back to Journals » Nature and Science of Sleep » Volume 18

Obstructive Sleep Apnea and Hypercoagulability: Combining Observational and Mendelian Randomization Analyses to Explore Causal Relationships
Authors Su L, Wu L, Han T, Li Y ![]() , Zhang X
, Zhang X
Received 21 October 2025
Accepted for publication 9 January 2026
Published 31 January 2026 Volume 2026:18 574439
DOI https://doi.org/10.2147/NSS.S574439
Checked for plagiarism Yes
Review by Single anonymous peer review
Peer reviewer comments 2
Editor who approved publication: Prof. Dr. Ahmed BaHammam
Linfan Su,1,* Lingwu Wu,1,2,* Teng Han,1 Yiming Li,1 Xiaolei Zhang1
1National Center for Respiratory Medicine, State Key Laboratory of Respiratory Health and Multimorbidity, National Clinical Research Center for Respiratory Diseases, Institute of Respiratory Medicine, Chinese Academy of Medical Sciences & Peking Union Medical College, Department of Pulmonary and Critical Care Medicine, Center of Respiratory Medicine, China-Japan Friendship Hospital, Beijing, People’s Republic of China; 2China Japan Friendship Institute of Clinical Medicine Research, Beijing, People’s Republic of China
*These authors contributed equally to this work
Correspondence: Xiaolei Zhang, Department of Pulmonary and Critical Care Medicine, China-Japan Friendship Hospital, Beijing, 100029, People’s Republic of China, Email [email protected]
Purpose: The relationship between Obstructive sleep apnea (OSA) and hypercoagulability remains unclear. To address this uncertainty, the present study combined observational and Mendelian randomization (MR) analyses to assess the associations of OSA and coagulation markers.
Patients and Methods: We conducted an observational study of 790 patients with OSA, evaluating associations between OSA severity and coagulation markers, including activated partial thromboplastin time (APTT), prothrombin time (PT), and fibrinogen (Fib). Multivariate linear regression adjusted for age, gender, body mass index (BMI), and comorbidities. Additionally, we performed a large-scale Mendelian randomization analysis using two East Asian OSA genome-wide association study (GWAS) datasets (Million Veteran Program [MVP], n=6550; Taiwan Precision Medicine Initiative [TPMI], n=316351) as exposures, and East Asian coagulation GWAS data from BioBank Japan (BBJ) as outcomes (APTT: n=37767; Fib: n=18348; PT: n=58110). Multivariable MR (MVMR) with body mass index (BMI)(TPMI GWAS, n=191458) was performed to assess residual direct effects of OSA.
Results: Severe OSA showed higher Fib (p-value< 0.01) and shorter PT (p-value< 0.05) and APTT (p-value< 0.05) than mild-moderate OSA. Multivariate regression analysis showed T90 (the percentage of time oxygen saturation is below 90%) and MSaO2 (mean oxygen saturation) were associated with Fib (β=− 0.259; β=− 0.224, p-value< 0.001). While OSA severity is observationally associated with subclinical hypercoagulability, these significances vanished after adjusting for BMI and are not supported by genetic evidence since MR analyses provide no evidence for a moderate or clinically meaningful independent causal effect between genetic OSA liability and coagulation markers. MVMR confirmed no residual direct effect of OSA on coagulation after accounting for BMI.
Conclusion: Severe OSA is associated with subclinical hypercoagulability, but this relationship is confounded by BMI. Genetic evidence does not support a moderate or clinically meaningful causal role for OSA in coagulation dysfunction, urging a paradigm shift toward obesity management as the primary strategy to reduce thrombotic risk in OSA patients.
Keywords: obstructive sleep apnea, hypercoagulability, Mendelian randomization, chronic intermittent hypoxia, obesity
Introduction
Obstructive sleep apnea (OSA) is a common sleep disorder affecting approximately 1 billion adults worldwide, characterized by recurrent upper airway obstructions during sleep that lead to chronic intermittent hypoxia (CIH), sleep fragmentation, and systemic inflammation.1 Epidemiological data show that among individuals aged 30–70 years, the prevalence of OSA was 34% in men and 17% in women.2 Accumulating evidence suggests associations between OSA and hypercoagulability, with hypothesized pathophysiological pathways including platelet activation, dysregulation of coagulation factors, and impaired fibrinolytic function induced by CIH, sleep fragmentation, and systemic inflammation.3,4 These pathways are theoretical speculations derived from preclinical and observational data, but whether they translate to a direct causal relationship remains unproven. However, the nature of the relationship between OSA and hypercoagulability remains controversial, with inconsistent findings across observational studies.3,5,6 Yet, whether these interactions reflect causal mechanisms or shared confounders such as obesity remains unknown.
Notably, OSA has been linked to an increased risk of venous thromboembolism (VTE), a connection hypothesized to involve CIH-mediated hypercoagulability, endothelial dysfunction, and venous stasis.7,8 Observational studies have reported associations between OSA severity and prothrombotic markers such as elevated fibrinogen (Fib), shortened prothrombin time (PT), and increased platelet activation, with some suggesting OSA as an independent risk factor for VTE.6,9–11 However, these findings are challenged by significant confounding, particularly by obesity, which is highly prevalent in OSA patients and independently influences coagulation through adipose inflammation and insulin resistance.12 Failure to adequately control for such confounders has hindered robust conclusions about the direct role of OSA in hypercoagulability.13–15 Moreover, the causal relationship between OSA and coagulation abnormalities remains unclarified. While observational data imply associations, but cannot distinguish between causation and shared risk factors.3
Mendelian randomization (MR), a method using genetic variants as instrumental variables to mitigate confounding and reverse causality, has recently shed new light on OSA-related comorbidities.16–19 By utilizing genetic variants as instrumental variables, MR can circumvent the confounding biases and reverse causality common in traditional observational studies, providing genetic evidence for the precise prevention and treatment of OSA.20 Recently, a bidirectional MR study found no genetic evidence supporting a causal link between OSA and VTE, suggesting that observed associations might be mediated by confounding factors rather than OSA itself.21 However, similar genetic investigations into the relationship between OSA and specific coagulation markers—critical intermediaries in thrombotic pathways—are lacking.16
To address these gaps, we tested the hypothesis that OSA exerts a direct causal influence on coagulation markers independent of obesity. We combined an observational study with MR analysis to achieve two key aims: (1) assess the association between OSA severity and coagulation markers in a clinical cohort; (2) determine whether genetic predisposition to OSA causally affects coagulation function, after accounting for BMI as a key confounder. This two-stage design allows us to disentangle confounding by obesity from true causality, providing insights into the underlying mechanism of OSA-related hypercoagulability.
Material and Methods
Study Design
This two-stage study included an observational analysis (stage 1) and a two-sample MR analysis (stage 2) following the Strengthening the Reporting of Observational Studies in Epidemiology using Mendelian Randomization (STROBE-MR) guidelines. The study flowchart is shown in Figure 1.
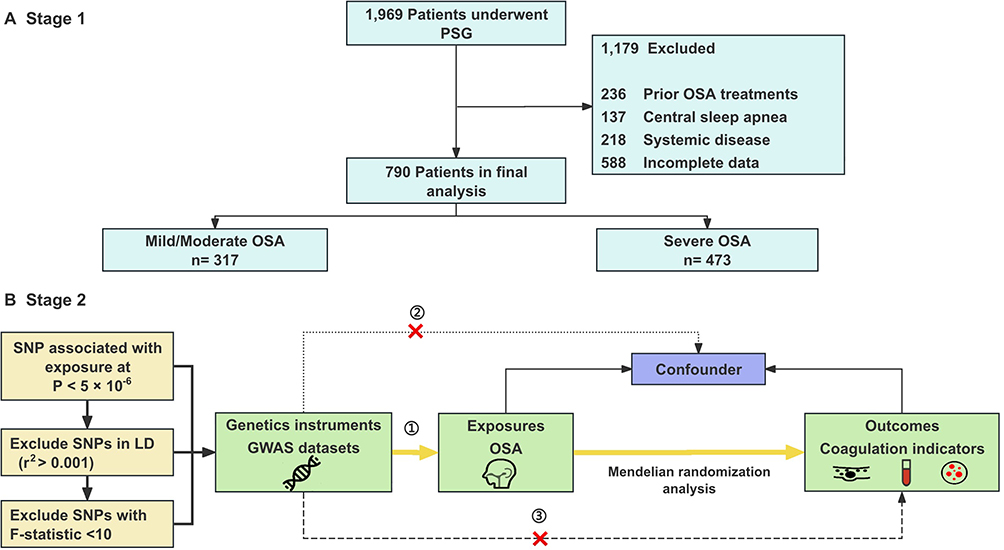 |
Figure 1 Study design overview. This flowchart illustrates the two-stage study design. (A) Stage 1: Observational study. (B) Stage 2: Mendelian randomization analysis. Abbreviations: OSA, Obstructive sleep apnea; PSG, Polysomnography; SNP, Single-nucleotide polymorphism. |
Observational Study Participants
Between January 2018 and July 2024, we recruited 790 participants from the Sleep Center of China-Japan Friendship Hospital. The inclusion criteria were: age ≥ 18 years; underwent overnight polysomnography (PSG) and coagulation function testing. The exclusion criteria were: previous OSA treatment (continuous positive airway pressure CPAP, upper airway surgery), systemic diseases (such as chronic liver disease, renal insufficiency, neoplasm), psychiatric or neurological disorders, alcohol intoxication, blood or platelet donation within the past six months, congenital or acquired coagulation disorders (such as factor deficiencies, disseminated intravascular coagulation), regular use of medications affecting coagulation (such as aspirin, clopidogrel, low-molecular-weight heparin) or other sleep disorders like narcolepsy. Demographic data (age, gender, body mass index BMI, and neck circumference) and medical history were collected.
OSA Diagnosis and PSG Assessment
The patients were asked to participate in a sleep study (Nox T3, Nox Medical Co., Iceland) during their routine sleep hours. Their data were evaluated by experienced PSG technologists based on the revised 2023 American Academy of Sleep Medicine criteria. OSA was defined as an AHI of ≥5 events/hour; and, OSA severity was defined according to the following criteria: mild OSA (5 ≤ AHI ≤ 15 events/hour), moderate OSA (15<AHI ≤ 30 events/hour), and severe OSA (AHI>30 events/hour).22,23
Coagulation Function Assessment
Fasting venous blood samples were collected between 07:00–08:00 on the morning immediately after overnight PSG (≥8 hours of fasting, no strenuous activity or caffeine intake before sampling) to avoid confounding by diurnal variation or acute physiological changes. Samples with hemolysis, lipemia, or icterus were excluded to avoid analytical interference. Coagulation markers were measured using a CS-5100 automated coagulation analyzer (SYSMEX) with commercially available reagents (Actin FS for APTT, Thrombin Reagent for TT, and Thromborel S for PT; Siemens Healthcare Diagnostics). Prothrombin time (PT, normal range 11–15 s), activated partial thromboplastin time (APTT, normal range 28–43.5 s), fibrinogen (Fib, normal range 2–4 g/L), and thrombin time (TT, normal range 14–21 s), Antithrombin III (ATIII, normal range 80–120%).
Data Sources
OSA genome-wide association study (GWAS) summary data were obtained from two East Asian ancestry cohorts: (datasets GCST90477484 from the Million Veteran Program (MVP) and TPMI:327.3 from Taiwan Precision Medicine Initiative (TPMI), including 6,550 and 316,351 participants with OSA diagnosed by ICD codes as exposure variables. Three key coagulation indicators were selected as outcome variables, with GWAS summary data derived from BioBank Japan (BBJ) (all East Asian ancestry), including APTT (sample size = 37,767), Fib (sample size = 18,348), and PT (sample size = 58,110). Additionally, BMI GWAS summary data (sample size = 191,458) from the Taiwan Precision Medicine Initiative (TPMI) (East Asian ancestry) were included for multivariable Mendelian randomization analyses. An additional file shows this in more detail (Supplementary Table 1).
Mendelian Randomization Analysis
For MR analyses, instrumental variables (IVs) were selected from genome-wide association study (GWAS) datasets following two criteria: first, single-nucleotide polymorphisms (SNPs) associated with OSA at a genome-wide significance level (p-value < 5×10⁻⁶); second, linkage disequilibrium (LD) pruning with r2 < 0.001 and a physical distance > 10 kb to ensure SNP independence.24 Palindromic SNPs were removed entirely, and no proxy variants were used. For the TPMI OSA GWAS, using a threshold of P < 5×10⁻⁶, 100 SNPs were initially selected; after LD clumping, 8 SNPs remained; and after allele harmonization and filtering, only 2 SNPs were retained. For the GCST90477484 OSA GWAS, 67 SNPs passed the P < 5×10⁻⁶ threshold; 12 SNPs remained after LD clumping; and 4 SNPs were retained after harmonization. The inverse variance weighted (IVW) method was adopted as the primary approach for causal inference. Sensitivity analyses encompassed MR-Egger regression, weighted median, simple mode, and weighted mode methods to evaluate result robustness. Heterogeneity among IVs was assessed using Cochran’s Q test, and horizontal pleiotropy was examined through the MR-Egger intercept and MR-PRESSO.25–28 The causal direction of the exposure and outcome was assessed using Steiger filtering, which compared the total variance explained by the instrumental SNPs in the exposure versus the outcome.29 A “TRUE” result indicates that the instruments explain more variance in the exposure than in the outcome, whereas “FALSE” suggests potential reverse direction. Steiger filtering results are presented in Supplementary Table 2. Additionally, leave-one-out analyses were conducted to measure the influence of individual SNPs on the results with F-statistics (>10 to exclude weak instruments).30 All MR analyses were carried out using the TwoSampleMR and MRPRESSO packages in R (version 4.3.2). All the MR estimates reflect the SD change in each coagulation biomarker per unit increase in OSA genetic liability (log-odds). Multiple-testing adjustment was performed for the primary causal estimator. As the primary causal estimator, the primary IVW results were corrected by the Bonferroni method across the two independent OSA genetic instruments (TPMI and GCST90477484) and the three coagulation traits (APTT, fibrinogen, PT). The resulting corrected significance threshold was α = 0.05/6. Bonferroni correction was applied to the primary IVW estimator; other MR methods were considered sensitivity analyses and interpreted accordingly.
Power Calculation of MR Analysis
Calculations for statistical power for MR analyses were performed according to Brion et al.31 Power was evaluated for continuous coagulation traits (APTT, fibrinogen, and PT) under a type I error rate of 0.05. For the OSA GWAS GCST90477484, the proportion of variance in OSA explained by the included SNPs (n = 4) was 0.0144. Power calculations were performed using the sample sizes of the outcome GWAS: 37,767 for APTT, 18,348 for fibrinogen, and 58,110 for PT. Under these parameters, our study had 80% power to detect a true causal effect of ≥0.12 SD for APTT, ≥0.17 SD for fibrinogen, and ≥0.10 SD for PT per unit increase in OSA. These values represent the minimal detectable effect sizes (MDE) with 80% power. For the OSA GWAS TPMI:327.3, the proportion of variance explained was 0.00015. With this instrument, 80% power would only be achieved for effects of ≥1.17 SD for APTT, ≥1.68 SD for fibrinogen, and ≥0.95 SD for PT. These detectable effect sizes are substantially larger than effect sizes typically observed in epidemiological or genetic studies of coagulation traits. Therefore, analyses based on TPMl instruments should be interpreted as exploratory.
Multivariate MR Analysis
To investigate whether any association between OSA and coagulation function is independent of adiposity, we conducted multivariable MR (MVMR) analyses with OSA, and BMI modeled jointly as exposures and coagulation markers as outcomes. We implemented a MVMR framework using GWAS data for OSA, BMI, and each coagulation outcome by the MVMR R package. A method flow diagram is shown in Supplementary Figure 1. The direct effect estimates of BMI-adjusted OSA were corrected using the Bonferroni method across the two independent OSA genetic instruments (TPMI and GCST90477484) and the three coagulation traits (APTT, fibrinogen, and PT). Accordingly, the corrected significance threshold was set at α = 0.05/6. BMI-adjusted OSA estimates were therefore interpreted as statistically significant only when p-value < 0.0083.
Statistical Analysis
Continuous variables were summarized as mean ± SD or median (IQR), and categorical variables as counts (%). Differences across OSA severity groups were evaluated using the Kruskal–Wallis test. Correlations between OSA parameters (AHI, ODI, LSaO2, T90) and coagulation markers were assessed using Pearson/Spearman correlations. Referring to previous population-based research focusing on sleep issues, multiple linear regression models were constructed to assess the impact of sleep parameters on coagulation markers.32,33 Three sequential adjustment models were used: Crude model: No covariates adjusted; Model 1: Adjusted for age and gender; Model 2: Adjusted for age, gender, and BMI; Model 3: Adjusted for age, gender, BMI, and comorbidities history (hypertension, diabetes). Exclusion of statistical outliers (defined as values beyond 3 standard deviations from the mean for continuous variables) and re-running regression models, with no material changes to core findings. Coefficients (β) and 95% confidence intervals (CI) were reported, with statistical significance set at p-value < 0.05.
Results
Baseline Characteristics of the Study Population
Of the 790 participants, 317 subjects had mild-moderate OSA and 473 subjects had severe OSA. Patients with severe OSA were elder, had a more proportion of male, and had higher BMI (28.34 kg/m2, IQR [26.40–31.84] vs 26.12 kg/m2, IQR [24.16–28.10], p-value < 0.001) and neck circumference (41 cm [IQR 39–43] vs 39 cm [IQR 37–41], p-value < 0.001 than those with mild-moderate OSA. Also, subjects with severe OSA had higher AHI (55.40 [IQR 41.60–70.25] vs 15.80 [IQR 10.30–21.50], p-value < 0.001), ODI (50.40 [IQR 36.30–71.40] vs 11.40 [IQR 5.80–21.40], p-value < 0.001), T90, and lower MSaO2, LSaO2 (73% [63–81] vs 88% [84–90], p-value < 0.001) and N3% than subjects with mild-moderate OSA. The frequency of hypertension and diabetes was comparable between the two groups (Table 1).
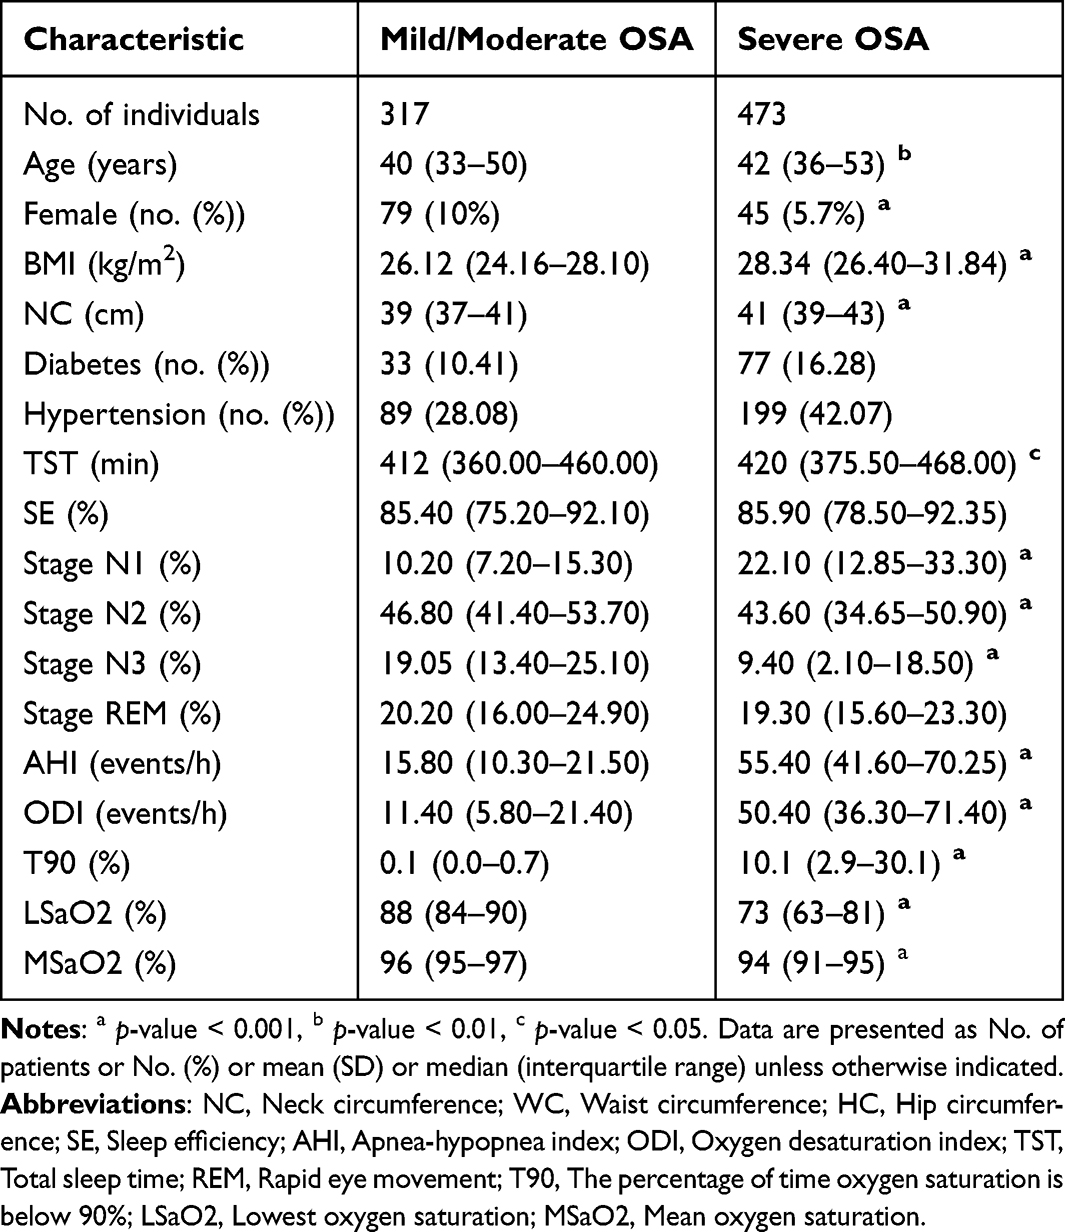 |
Table 1 Baseline OSA Participant Demographics and Sleep Characteristics |
Coagulation Parameter Differences Across OSA Stratifications
Severe OSA was associated with higher Fib (3.12 g/L [IQR 2.82–3.47] vs 3.05 g/L [IQR 2.74–3.35], p-value < 0.01), shorter PT (12.70 s [IQR 12.40–12.90] vs 12.74 s [IQR 12.50–13.10], p-value < 0.05), and lower APTT (35.30 s [IQR 33.60–37.20] vs 35.71 s [IQR 33.60–38.50], p-value < 0.05). Platelet count did not differ significantly between groups (Table 2).
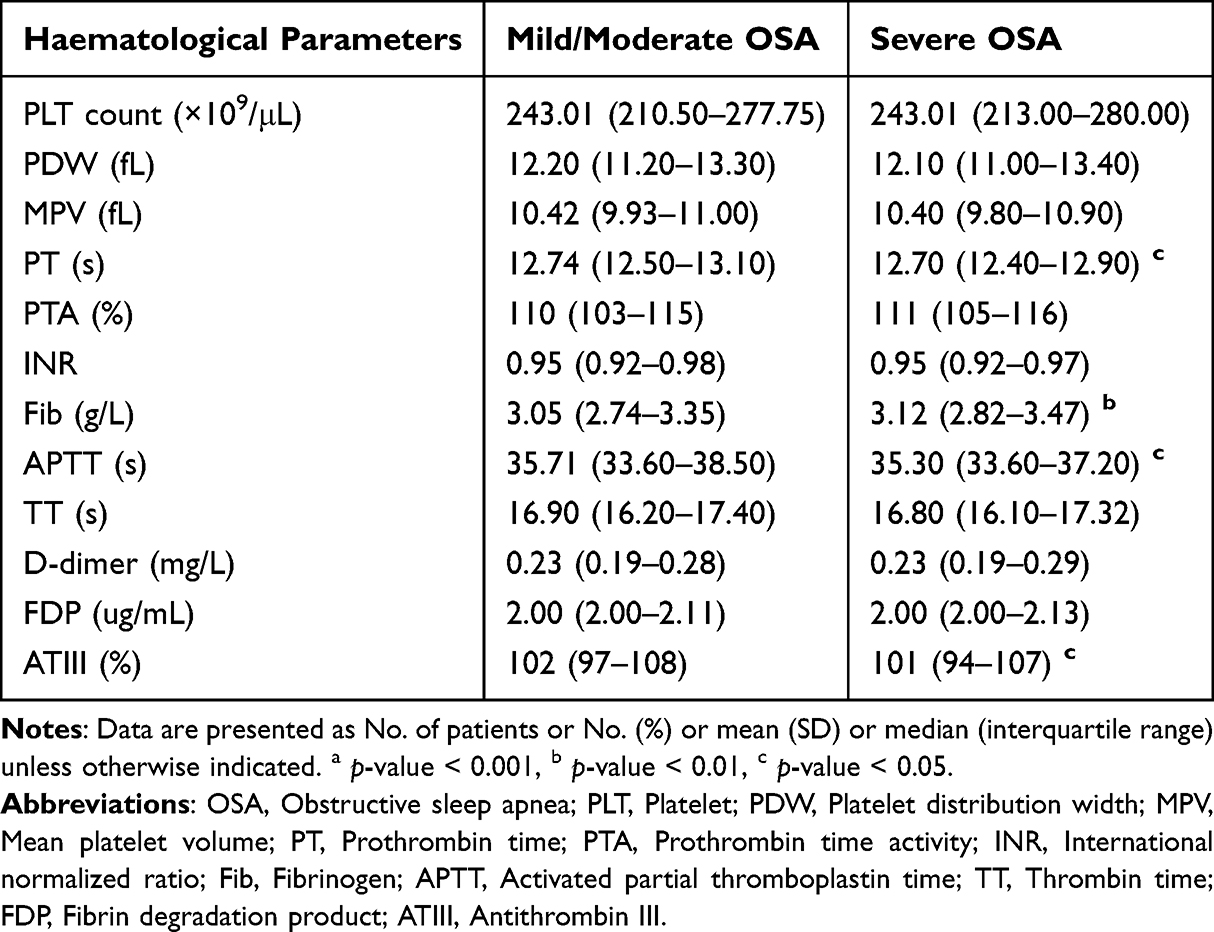 |
Table 2 Coagulation Parameter Differences Across OSA Stratifications |
Correlations Between OSA Clinical Characteristics and Coagulation Tests
AHI and ODI correlated positively with Fib (r=0.13, p-value < 0.01; r=0.12, p-value < 0.01, respectively) and negatively with PT (r=−0.09, p-value < 0.01; r=−0.09, p-value < 0.01). LSaO2 correlated positively with APTT (r=0.09, p-value < 0.05) and PT (r=0.07, p-value < 0.05). T90 was positively associated with Fib (r=0.20, p-value < 0.001). In contrast, MSaO2 was negatively associated with Fib (r=−0.018, p-value < 0.01). Additionally, N3% was correlated positively with TT and ATIII (r=0.11, p-value < 0.01; r=0.10, p-value < 0.01, respectively) (Figure 2).
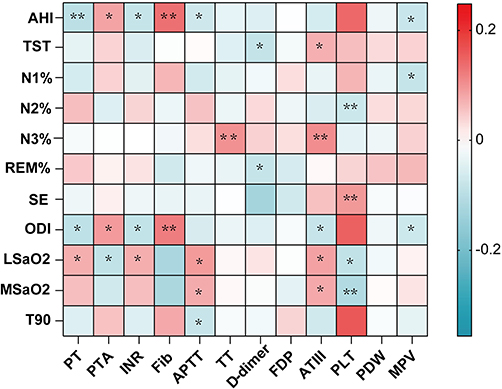 |
Figure 2 Correlation between OSA clinical characteristics and coagulation tests. Abbreviations: AHI, Apnea-hypopnea index; TST, Total sleep time; N1%, proportion of N1 sleep stage;N2%, proportion of N2 sleep stage;N3%, proportion of N3 sleep stage; REM%, proportion of rapid eye movement sleep stage; SE, Sleep efficiency; ODI, Oxygen desaturation index; LSaO2, Lowest oxygen saturation; MSaO2, Mean oxygen saturation; T90, The percentage of time oxygen saturation is below 90%; PT, Prothrombin time; PTA, Prothrombin time activity; INR, International normalized ratio; Fib, Fibrinogen; APTT, Activated partial thromboplastin time; TT, Thrombin time; FDP, Fibrin degradation product; ATIII, Antithrombin III; PLT, Platelet; PDW, Platelet distribution width; MPV, Mean platelet volume. Notes: *p-value < 0.05; **p-value < 0.01. |
Multivariable Linear Regression Analyses
Multivariate linear regression analysis of sleep parameters and coagulation markers showed that T90 and MSaO2 were significantly associated with Fib in unadjusted models (T90: β=−0.259, p-value<0.01; MSaO2: β=−0.224, p-value<0.001). N3% was significantly associated with PT (β=−0.089, p-value<0.05). After adjusting for age and gender, the associations remained significant for T90 (β=−0.197, p-value <0.001) and showed a trend toward significance for MSaO2 (β=−0.176, p-value=0.058). However, further adjustment for BMI attenuated these associations (T90: p-value =0.190; MSaO2: p-value =0.405). When comorbidities were included in the model (Model 3), all remaining associations lost statistical significance (Table 3).
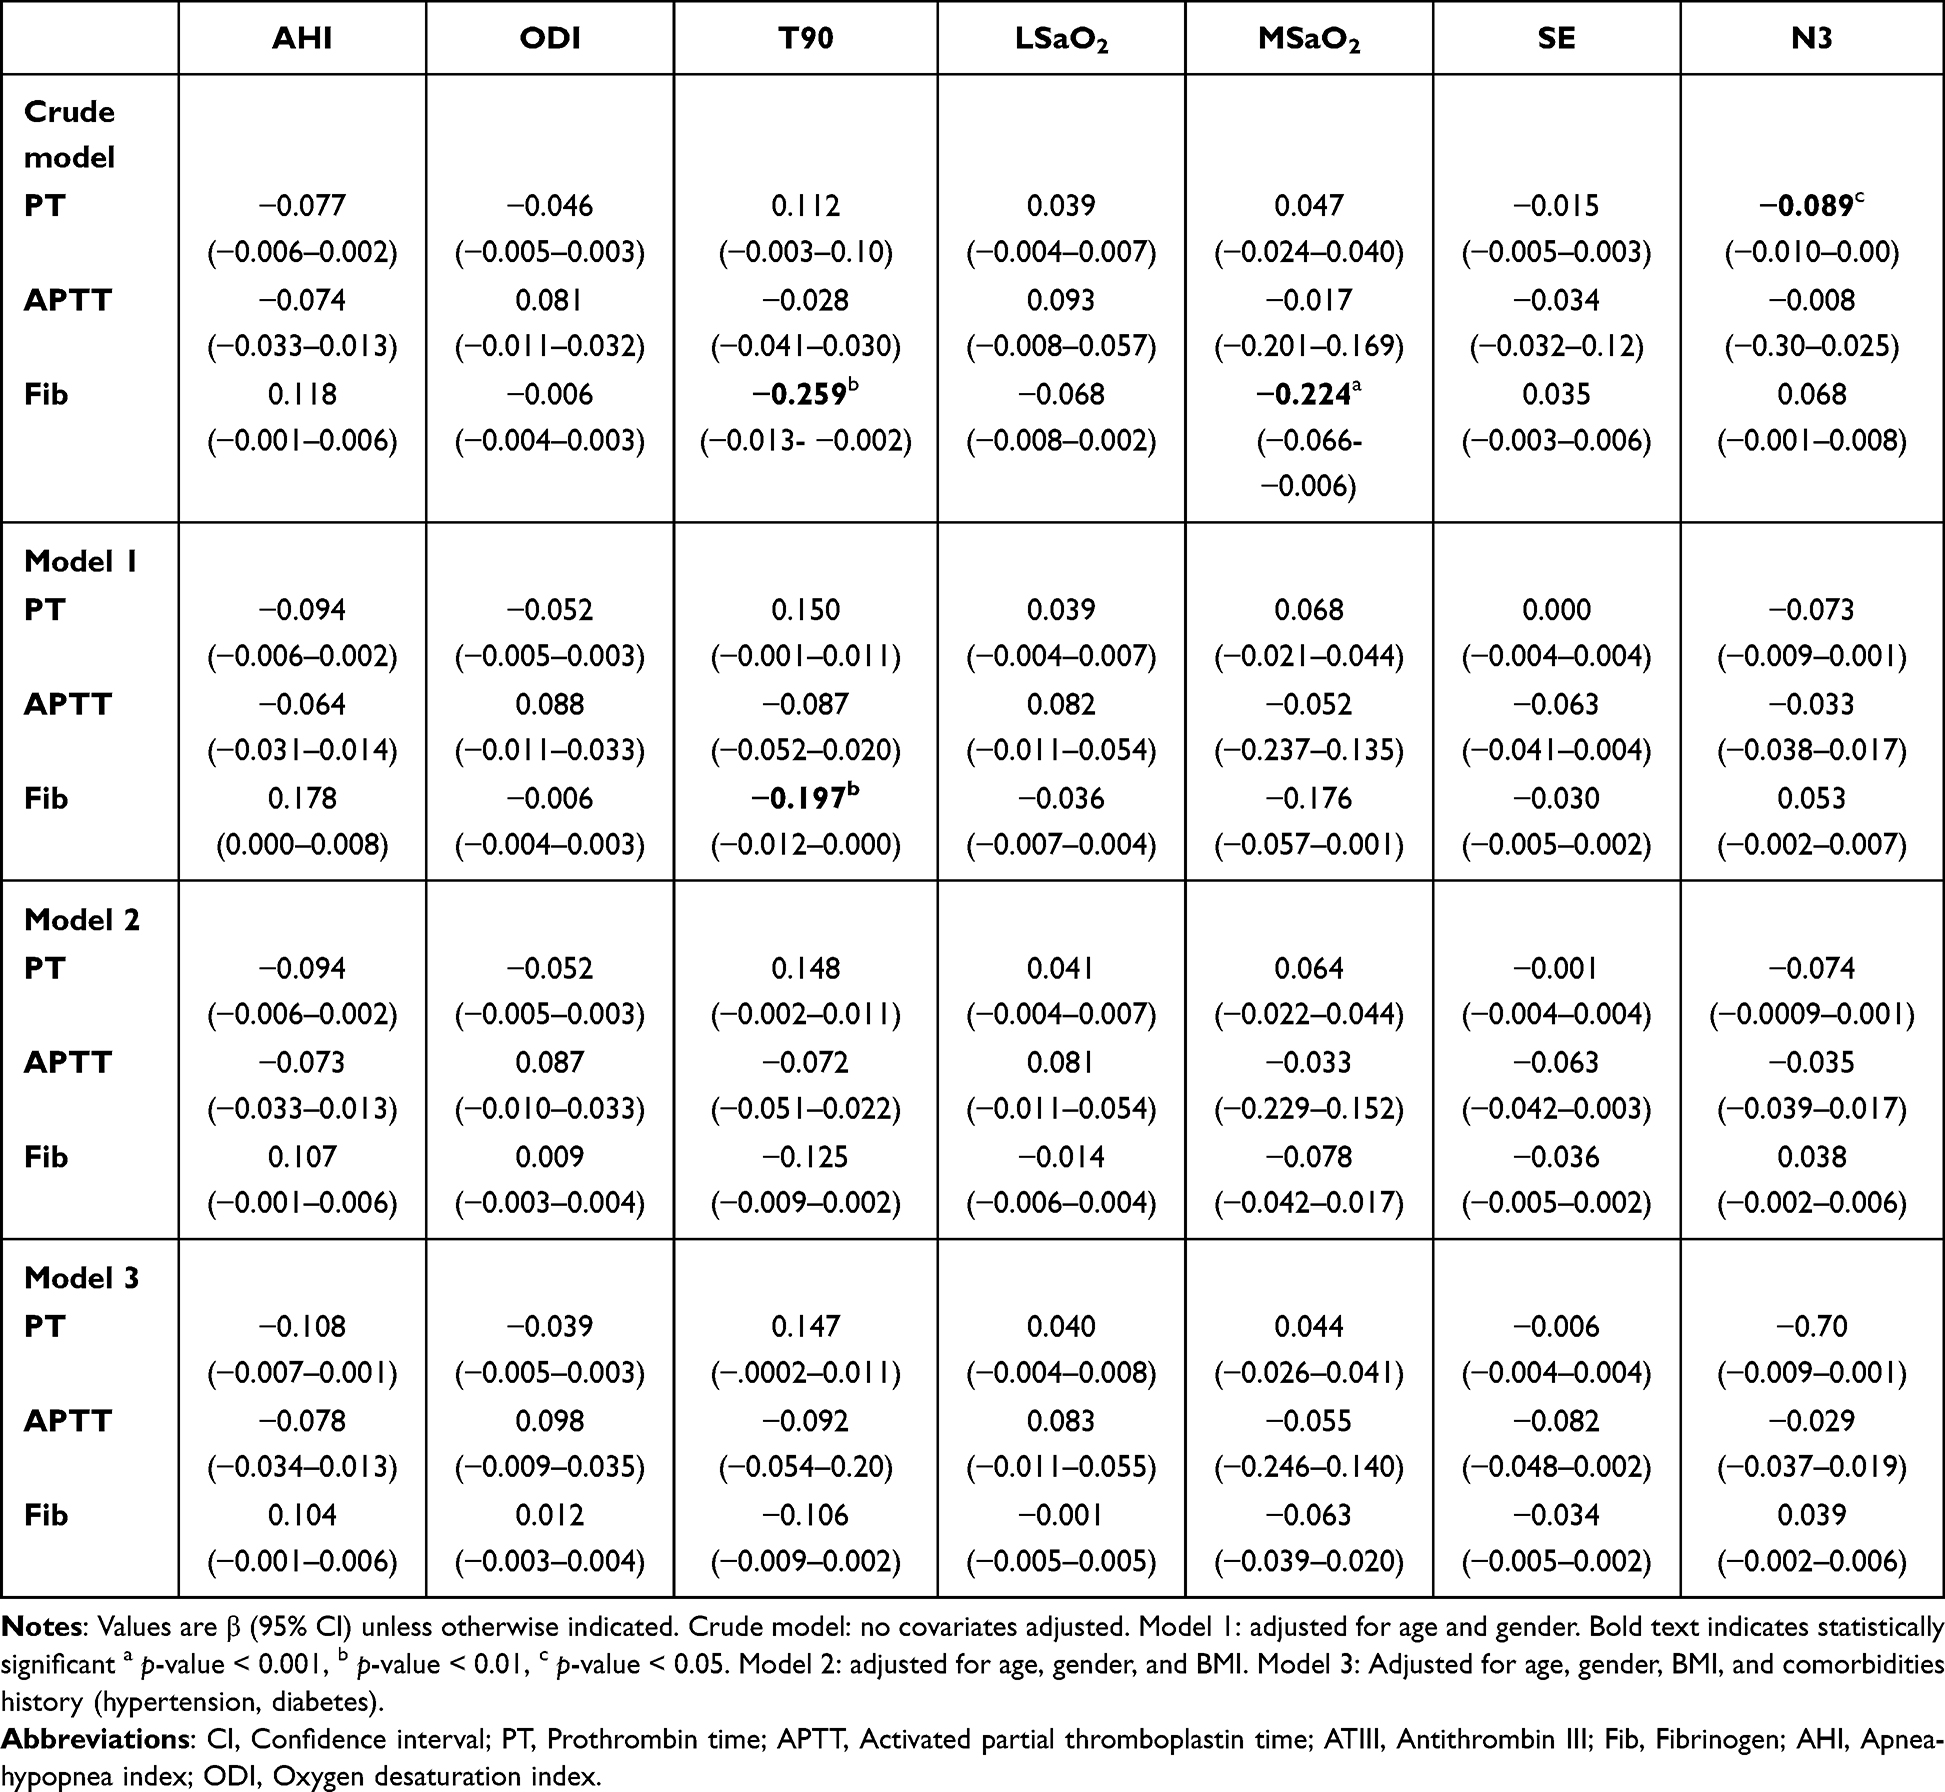 |
Table 3 Multiple Linear Regression Analyses of Sleep-Related Breathing Indices with Coagulation Marker |
Mendelian Randomization Results
After LD clumping, 2 and 4 SNPs were selected as instrumental variables for the two OSA GWAS datasets, all the instruments satisfied F > 10 and mean F = 23.70 (Table 4). The MR results indicated no evidence of causal effects after Bonferroni correction. IVW estimates for fibrinogen were β = −0.071 (95% CI −0.359 to 0.217, p-value = 0.631) in TPMI dataset and β = 0.022 (95% CI −0.046 to 0.091, p-value = 0.518) in GCST90477484 dataset. For PT, the IVW estimates were β = 0.207 (95% CI 0.048 to 0.366, p-value = 0.011) and β = −0.006 (95% CI −0.049 to 0.037, p-value = 0.777). Cochran’s Q tests showed no heterogeneity, and both horizontal pleiotropy tests and MR-PRESSO detected no evidence of pleiotropy (all p-value > 0.05). In the MR analysis of TPMI OSA GWAS with PT, the IVW P-value was 0.011, suggesting a potential association before Bonferroni correction (Table 5). We conducted multivariable MR including BMI as a covariate (Table 6). MVMR showed that genetically predicted BMI was not independently associated with PT (β = 0.020, 95% CI −0.037 to 0.078, p-value = 0.487), and the direct effect estimate for genetically predicted OSA remained non-significant after adjustment for BMI (β = −0.063, 95% CI −0.163 to 0.037, p-value = 0.218). The result indicates that neither OSA nor BMI exhibits an independent causal effect on PT when evaluated jointly.
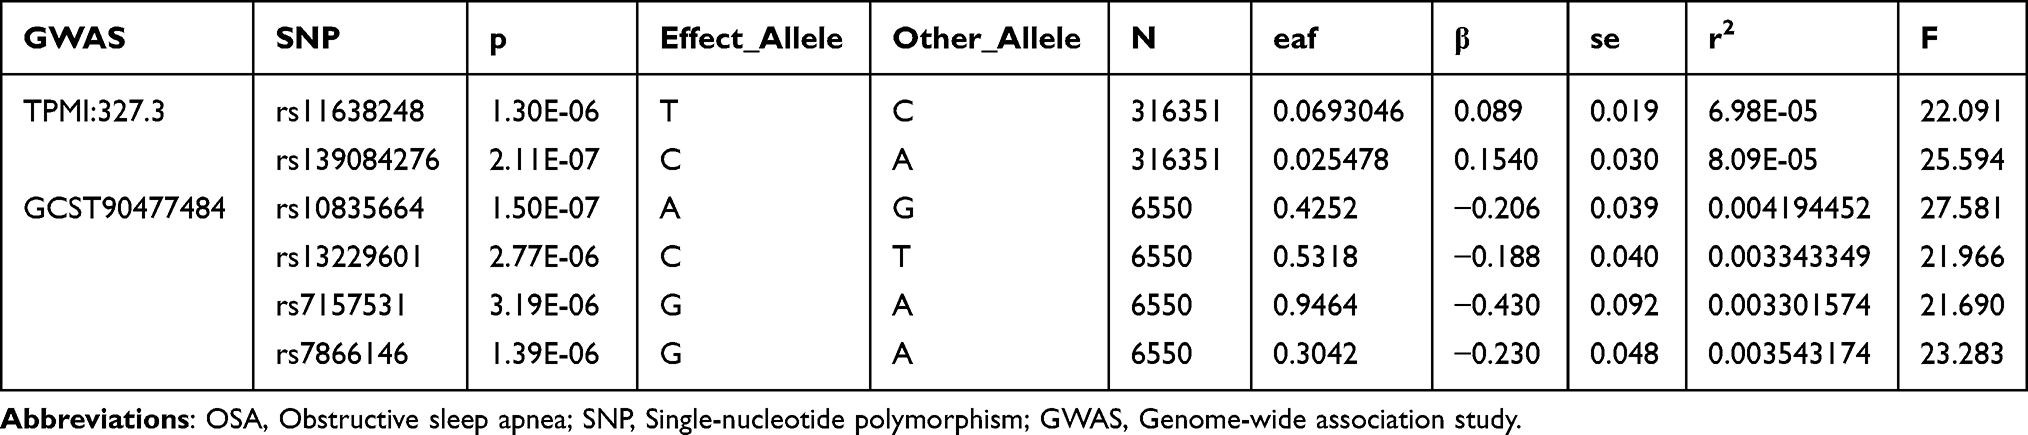 |
Table 4 Genetic Instrumental Variables of OSA |
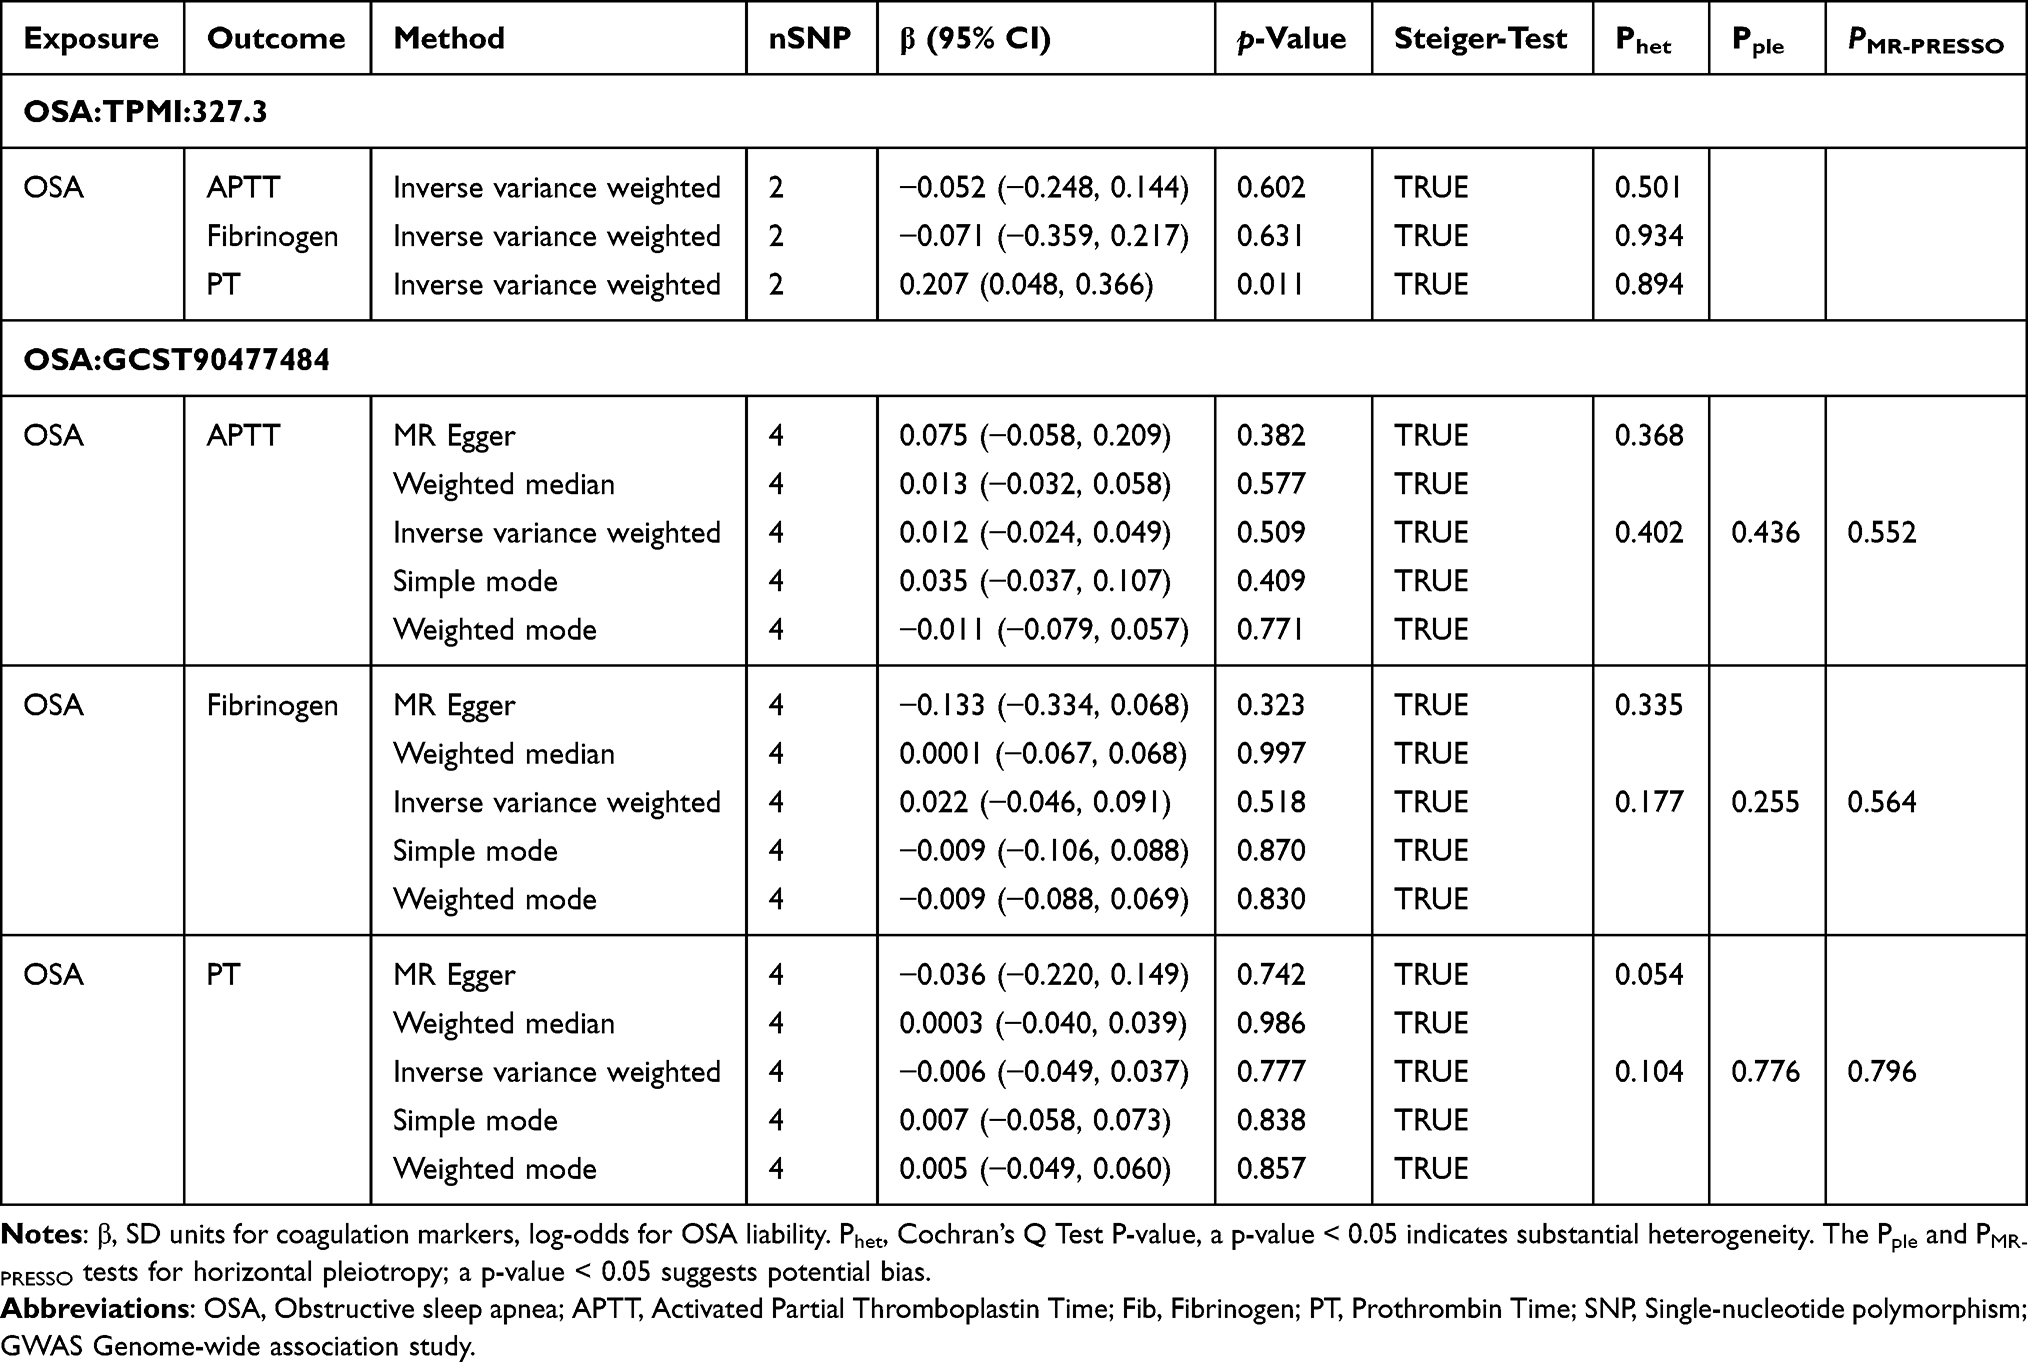 |
Table 5 Mendelian Randomization Analysis of OSA on Coagulation Markers |
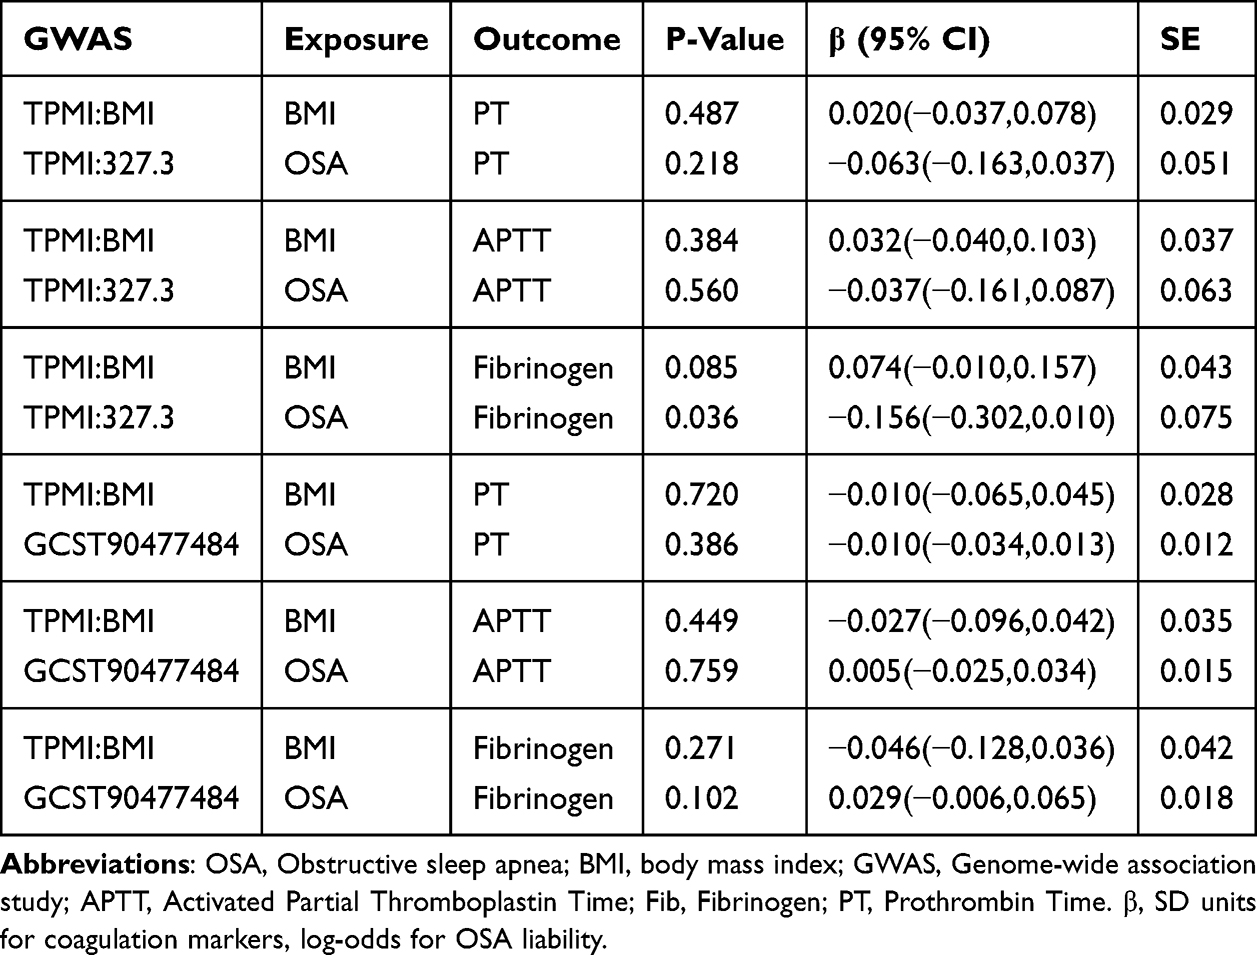 |
Table 6 Multivariable Mendelian Randomization Results for Independent Effects of BMI and OSA on Coagulation Markers |
Discussion
Our study combines observational and MR analyses to dissect the relationship between OSA and hypercoagulability, revealing critical insights into the underlying mechanisms and clinical implications. This study, for the first time, integrates large-sample clinical data with genetic causal inference to systematically explore the nature of the association between OSA and hypercoagulability.
The integrated observational and genetic analysis demonstrates that severe OSA correlates with a prothrombotic state, characterized by elevated fibrinogen, shortened PT and APTT, and reduced ATIII activity. These observational correlations align with the hypothesized pathophysiological pathway wherein OSA-related CIH may promote prothrombosis via Virchow’s triad—hypercoagulability, endothelial dysfunction, and venous stasis.3 CIH activates hypoxia-inducible factor-1α (HIF-1α) and nuclear factor-κB (NF-κB) pathways to trigger inflammation and upregulate procoagulant factors like fibrinogen, which could explain the observed coagulation abnormalities.3,6,10,34 However, these associations are not independent of confounding. Multivariate regression showed that after adjusting for BMI, the significant correlations between hypoxia indices such as T90, MSaO2, and Fib vanished.
Indeed, severe OSA patients in our cohort had a higher BMI (28.34 vs 26.12 kg/m2, p-value<0.001) and neck circumference (41 vs 39 cm, p-value <0.001), reinforcing obesity’s role as a shared risk factor for both OSA severity and hypercoagulability.35 Obese OSA patients exhibit greater adipose tissue inflammation and insulin resistance, which overshadow direct CIH effects.3,36,37 Notably, the absolute differences in coagulation markers (Fib: 3.12 g/L [IQR 2.82–3.47] vs 3.05 g/L [IQR 2.74–3.35], p-value < 0.01) remain within normal ranges (2–4 g/L), suggesting limited clinical relevance in the absence of overt thrombotic events, which underscores the need to contextualize these findings alongside clinical outcomes.
Additionally, sleep architecture disruption emerges as another potential contributor. Our regression analyses reveal that sleep fragmentation, reflected by altered sleep stages and increased transition frequency, showed associations with coagulation markers in unadjusted analyses, but these links were not independent of age and sex, highlighting the regulatory role of basic demographic factors. Mechanistically, deep sleep is integral to maintaining metabolic and inflammatory balance.38 Its reduction could disrupt circadian rhythms, altering diurnal cortisol secretion patterns, in turn regulating coagulation factor activity.39 Additionally, sleep fragmentation not only affects sleep quality but also is closely associated with systemic inflammatory responses, amplifying proinflammatory pathways that promote coagulation.40 These processes collectively could weaken anticoagulant mechanisms and strengthen procoagulant activity, aligning with the observed correlations in unadjusted analyses.3
Consistent with observational correlations, MR analyses using genetic variants associated with OSA found no evidence of a moderate or clinically meaningful independent causal relationship between genetically predicted OSA and coagulation markers. In multivariable MR analyses, there was no evidence of a residual direct effect of genetically predicted OSA on any coagulation marker after correction for multiple testing (Bonferroni α=0.0083). In sensitivity analyses, the TPMI OSA–fibrinogen association reached nominal significance in BMI-adjusted multivariable MR (P = 0.036, uncorrected for multiple testing, Table 6), but it did not survive Bonferroni correction and should be interpreted as exploratory given the weak TPMI instrument and limited power. Our null genetic findings align with and extend a recent bidirectional MR study, which reported no causal link between OSA and venous thromboembolism (VTE).2,21 That study focused on clinical thrombotic outcomes, while our work targets the intermediate coagulation markers (APTT, PT, fibrinogen) that mediate VTE risk—filling a critical gap in the causal chain. Together, these two MR studies provide complementary evidence that there is no support for a moderate or clinically meaningful causal influence of OSA on either coagulation biomarkers or the downstream clinical endpoint of VTE, reinforcing that observed OSA-thrombosis associations are driven by shared confounders such as obesity rather than OSA itself. This aligns with broader causal inference literature questioning direct causal roles for OSA in cardiovascular outcomes, such as atrial fibrillation and atherosclerosis, and underscores the need to prioritize comorbidity management in OSA care. While CIH and sleep fragmentation may transiently activate coagulation pathways, chronic hypercoagulability in OSA is more likely a consequence of comorbidities like obesity rather than OSA-specific pathophysiology.9,41 This is further supported by our finding that BMI fully accounts for the association between OSA-related hypoxia indices and fibrinogen, indicating that metabolic factors overshadow direct hypoxic effects. For the coagulation traits in BioBank Japan (BBJ), rank-based inverse normal transformation (INT) precludes direct conversion of SD-scale MR estimates to original clinical units (seconds or g/L), but these standardized effect sizes remain useful for assessing clinical relevance. All our MR estimates (<0.1 SD) reflect a negligible shift in the population distribution of coagulation biomarkers—far below the threshold for clinically meaningful changes—supporting that OSA genetic liability has no evidence of a moderate or clinically meaningful causal effect on coagulation function.
Our findings have important implications for clinical practice. The primacy of BMI as a confounder suggests that interventions targeting obesity—such as bariatric surgery or GLP-1 agonists may be more effective in mitigating thrombotic risk in OSA patients than therapies focused solely on OSA, such as continuous positive airway pressure (CPAP).35,42 This aligns with evidence that CPAP has a limited impact on coagulation markers, whereas reducing adiposity directly improves inflammatory and procoagulant profiles.3 Our results also emphasize the need to consider OSA as a “comorbidity amplifier” rather than an independent driver of hypercoagulability. In clinical settings, this means prioritizing holistic management of metabolic risk factors alongside OSA treatment, particularly in obese patients. Additionally, sleep architecture disruption correlated weakly with coagulation changes but was mediated by age and sex, highlighting demographic factors as overlooked modifiers. Future studies should explore whether targeted weight loss interventions reduce thrombotic events in OSA populations, complementing existing research on OSA-related end-organ damage.16
Several limitations of the current study should be mentioned. The observational data are from a single center, potentially introducing selection bias. MR analyses relied on East Asian ancestry GWAS data, limiting generalizability to other ethnicities. Additionally, coagulation markers were measured cross-sectionally, precluding assessment of temporal dynamics. Despite these constraints, the integration of observational and genetic approaches strengthens our conclusions by isolating confounding from causality.
Conclusion
In summary, while observational data associate severe OSA with subclinical hypercoagulability, Mendelian randomization analyses provide no genetic evidence for a moderate or clinically meaningful independent causal relationship. These findings suggest OSA likely exacerbates thrombosis risk through synergistic interactions with comorbid conditions, particularly obesity, rather than functioning as a standalone etiological driver. Translationally, this highlights that managing obesity may be a more effective strategy for thrombotic risk reduction in OSA patients than focusing solely on OSA-specific treatments. Future longitudinal or interventional studies are warranted to further confirm the mediating role of obesity and clarify the underlying mechanistic pathways.
Abbreviations
AHI, Apnea hypopnea index; APTT, Activated partial thromboplastin time; ATIII, Antithrombin III; BMI, Body mass index; CPAP, Continuous positive airway pressure; CIH, Chronic intermittent hypoxia; Fib, Fibrinogen; GWAS, Genome-wide association study; OSA, Obstructive sleep apnea; ODI, Oxygen desaturation index; PSG, Polysomnography; PT, Prothrombin time; SE, Sleep efficiency; SNP, Single-nucleotide polymorphism; LSaO2, Lowest oxygen saturation; IQR, Interquartile range; IVW, Inverse variance weighted; MSaO2, Mean Oxygen Saturation; MR, Mendelian randomization; T90, The percentage of time oxygen saturation is below 90%.
Data Sharing Statement
The data that support the findings of this study are available from the corresponding author, XLZ, upon reasonable request.
Ethical Statement
The study was approved by the Ethics Committee of the China-Japan Friendship Hospital (Approval No: KY-359-1), and all participants provided informed consent. This study complies with the Declaration of Helsinki.
Acknowledgments
The authors would like to thank all the study participants who dedicated themselves to our research.
Author Contributions
Linfan Su: Conceptualization, Data Curation, Formal analysis, Funding acquisition, Investigation, Methodology, Software, Visualization, and Writing - original draft. Lingwu Wu: Data curation, Formal analysis, Investigation, Methodology, Validation, and Writing - original draft. Teng Han: Resources, Data curation, Visualization, Writing-review and editing. Yiming Li: Data curation, Software, Validation, Writing-review and editing. Xiaolei Zhang: Conceptualization, Investigation, Project administration, Resources, Supervision, Writing-review and editing. All authors contributed significantly to the work, drafted or revised the article, approved the final version for publication, and agreed on the journal where this article was submitted, and to be accountable for all aspects of the work.
Funding
This work was supported by the Noncommunicable Chronic Diseases-National Science and Technology Major Project (No. 2024ZD0541000); Elite Medical Professionals Project of China-Japan Friendship Hospital (No. ZRJY2024-QMPY14); National High Level Hospital Clinical Research Funding.
Disclosure
The authors report no conflicts of interest in this work.
References
1. Benjafield AV, Ayas NT, Eastwood PR. et al. Estimation of the global prevalence and burden of obstructive sleep apnoea: a literature-based analysis. Lancet Respir Med. 2019;7(8):687–13. doi:10.1016/s2213-2600(19)30198-5
2. Peppard PE, Young T, Barnet JH, Palta M, Hagen EW, Hla KM. Increased prevalence of sleep-disordered breathing in adults. Am J Epidemiol. 2013;177(9):1006–1014. doi:10.1093/aje/kws342
3. García-Ortega A, Mañas E, López-Reyes R, et al. Obstructive sleep apnoea and venous thromboembolism: pathophysiological links and clinical implications. Eur Respir J. 2019;53(2):1800893. doi:10.1183/13993003.00893-2018
4. Wang H, Rosendaal FR, Cushman M, van Hylckama Vlieg A. Procoagulant factor levels and risk of venous thrombosis in the elderly. JTH. 2021;19(1):186–193. doi:10.1111/jth.15127
5. von Känel R, Princip M, Schmid JP, et al. Association of sleep problems with neuroendocrine hormones and coagulation factors in patients with acute myocardial infarction. BMC Cardiovasc Disord. 2018;18(1):213. doi:10.1186/s12872-018-0947-5
6. Hong SN, Yun HC, Yoo JH, Lee SH. Association Between Hypercoagulability and Severe Obstructive Sleep Apnea. JAMA Otolaryngol Head Neck Surg. 2017;143(10):996–1002. doi:10.1001/jamaoto.2017.1367
7. Zolotoff C, Bertoletti L, Gozal D, et al. Obstructive Sleep Apnea, Hypercoagulability, and the Blood-Brain Barrier. J Clin Med. 2021;10(14):3099. doi:10.3390/jcm10143099
8. Sánchez-de-la-Torre M, Campos-Rodriguez F, Barbé F. Obstructive sleep apnoea and cardiovascular disease. Lancet Respir Med. 2013;1(1):61–72. doi:10.1016/S2213-2600(12)70051-6
9. Alonso-Fernández A, Toledo-Pons N, García-Río F. Obstructive sleep apnea and venous thromboembolism: overview of an emerging relationship. Sleep Med Rev. 2020;50:101233. doi:10.1016/j.smrv.2019.101233
10. Bikov A, Meszaros M, Schwarz EI. Coagulation and Fibrinolysis in Obstructive Sleep Apnoea. Int J Mol Sci. 2021;22(6):2834. doi:10.3390/ijms22062834
11. Gao S, Shan D, Tang Y. Identification biomarkers in disease progression of obstructive sleep apnea from children serum based on WGCNA and Mfuzz. Front Neurol. 2024;15:1452507. doi:10.3389/fneur.2024.1452507
12. Shen T, Wang J, Yang W, et al. Hematological Parameters Characteristics in Children with Obstructive Sleep Apnea with Obesity. Risk Manag Healthc Policy. 2021;14:1015–1023. doi:10.2147/rmhp.S297341
13. Ignjatovic V. Activated partial thromboplastin time. Methods Mol Biol. 2013;992:111–120. doi:10.1007/978-1-62703-339-8_8
14. Barceló A, Morell-Garcia D, Sanchís P, et al. Prothrombotic state in children with obstructive sleep apnea. Sleep Med. 2019;53:101–105. doi:10.1016/j.sleep.2018.09.022
15. Shen T, Wang J, Li L, et al. Changes in platelet count and coagulation parameters in children with obstructive sleep apnea. Sleep Breath. 2022;26(2):871–878. doi:10.1007/s11325-021-02443-8
16. Wu K, Gan Q, Pi Y, et al. Obstructive sleep apnea and structural and functional brain alterations: a brain-wide investigation from clinical association to genetic causality. BMC Med. 2025;23(1):42. doi:10.1186/s12916-025-03876-8
17. Lawlor DA, Harbord RM, Sterne JA, Timpson N, Davey Smith G. Mendelian randomization: using genes as instruments for making causal inferences in epidemiology. Stat Med. 2008;27(8):1133–1163. doi:10.1002/sim.3034
18. Chen W, Cai X, Yan H, Pan Y. Causal Effect of Obstructive Sleep Apnea on Atrial Fibrillation: a Mendelian Randomization Study. J Am Heart Assoc. 2021;10(23):e022560. doi:10.1161/jaha.121.022560
19. Chen W, Pan W, Ling L, et al. Causal Effect of Obstructive Sleep Apnea on Sick Sinus Syndrome: a Bidirectional Mendelian Randomization Study. Nat Sci Sleep. 2025;17:689–700. doi:10.2147/nss.S511973
20. Feng K, Yang J, Liu K. Shared genetic associations and etiology between obstructive sleep apnea and CVDs: a genome-wide cross-trait analysis and bidirectional Mendelian randomization analysis. Eur J Prev Cardiol. 2024;2024:347. doi:10.1093/eurjpc/zwae347
21. Huang Z, Zheng Z, Pang L, et al. The Association between Obstructive Sleep Apnea and Venous Thromboembolism: a Bidirectional Two-Sample Mendelian Randomization Study. Thromb Haemost. 2024;124(11):1061–1074. doi:10.1055/a-2308-2290
22. Gottlieb DJ. Screening for Obstructive Sleep Apnea in Adults. JAMA. 2022;328(19):1908–1910. doi:10.1001/jama.2022.20670
23. Qaseem A, Dallas P, Owens DK, Starkey M, Holty JE, Shekelle P. Diagnosis of obstructive sleep apnea in adults: a clinical practice guideline from theAmerican College of Physicians. Ann Intern Med. 2014;161(3):210–220. doi:10.7326/m12-3187
24. Yu H, Wan X, Yang M, et al. A large-scale causal analysis of gut microbiota and delirium: a Mendelian randomization study. J Affect Disord. 2023;329:64–71. doi:10.1016/j.jad.2023.02.078
25. Burgess S, Butterworth A, Thompson SG. Mendelian randomization analysis with multiple genetic variants using summarized data. Genet Epidemiol. 2013;37(7):658–665. doi:10.1002/gepi.21758
26. Chen X, Kong J, Diao X, et al. Depression and prostate cancer risk: a Mendelian randomization study. Cancer Med. 2020;9(23):9160–9167. doi:10.1002/cam4.3493
27. Bowden J, Davey Smith G, Burgess S. Mendelian randomization with invalid instruments: effect estimation and bias detection through Egger regression. Int J Epidemiol. 2015;44(2):512–525. doi:10.1093/ije/dyv080
28. Wu F, Huang Y, Hu J, Shao Z. Mendelian randomization study of inflammatory bowel disease and bone mineral density. BMC Med. 2020;18(1):312. doi:10.1186/s12916-020-01778-5
29. Hemani G, Tilling K, Davey Smith G. Orienting the causal relationship between imprecisely measured traits using GWAS summary data. PLoS Genet. 2017;13(11):e1007081. doi:10.1371/journal.pgen.1007081
30. Sharma P, Klarin D, Voight BF, Tsao PS, Levin MG, Damrauer SM. Evaluation of Plasma Biomarkers for Causal Association With Peripheral Artery Disease. Arterioscler Thromb Vasc Biol. 2024;44(5):1114–1123. doi:10.1161/atvbaha.124.320674
31. Brion M-JA, Shakhbazov K, Visscher PM. Calculating statistical power in Mendelian randomization studies. Int J Epidemiol. 2013;42(5):1497–1501. doi:10.1093/ije/dyt179
32. You Y, Li J, Zhang Y, Li X, Li X, Ma X. Exploring the potential relationship between short sleep risks and cognitive function from the perspective of inflammatory biomarkers and cellular pathways: insights from population-based and mice studies. CNS Neurosci Ther. 2024;30(5):e14783. doi:10.1111/cns.14783
33. You Y, Chen Y, Fang W, et al. The association between sedentary behavior, exercise, and sleep disturbance: a mediation analysis of inflammatory biomarkers. Front Immunol. 2023;13:1080782. doi:10.3389/fimmu.2022.1080782
34. Yang J, Xue W, Wei Z, et al. The Associations of Platelet Activation and Coagulation Parameters with Obstructive Sleep Apnoea: a Large-Scale Observational Study. Int J Clin Pract. 2023;2023:5817644. doi:10.1155/2023/5817644
35. Malhotra A, Grunstein RR, Fietze I, et al. Tirzepatide for the Treatment of Obstructive Sleep Apnea and Obesity. N Engl J Med. 2024;391(13):1193–1205. doi:10.1056/NEJMoa2404881
36. Hur WS, King KC, Patel YN, et al. Elimination of fibrin polymer formation or crosslinking, but not fibrinogen deficiency, is protective against diet-induced obesity and associated pathologies. J Thromb Haemost. 2022;20(12):2873–2886. doi:10.1111/jth.15877
37. Cuevas-Sierra A, Chero-Sandoval L, Higuera-Gómez A, et al. Modulatory role of Faecalibacterium on insulin resistance and coagulation in patients with post-viral long haulers depending on adiposity. iScience. 2024;27(8):110450. doi:10.1016/j.isci.2024.110450
38. Li SB, Damonte VM, Chen C, et al. Hyperexcitable arousal circuits drive sleep instability during aging. Science. 2022;375(6583):eabh3021. doi:10.1126/science.abh3021
39. Domínguez F, Fuster V, Fernández-Alvira JM, et al. Association of Sleep Duration and Quality With Subclinical Atherosclerosis. J Am Coll Cardiol. 2019;73(2):134–144. doi:10.1016/j.jacc.2018.10.060
40. Puech C, Badran M, Runion AR, Barrow MB, Cataldo K, Gozal D. Cognitive Impairments, Neuroinflammation and Blood-Brain Barrier Permeability in Mice Exposed to Chronic Sleep Fragmentation during the Daylight Period. Int J Mol Sci. 2023;24(12):9880. doi:10.3390/ijms24129880
41. Manandhar-Sasaki P, Ban KF, Richard E, Braithwaite RS, Caniglia EC. How likely is unmeasured confounding to explain meta-analysis-derived associations between alcohol, other substances, and mood-related conditions with HIV risk behaviors? BMC Med Res Methodol. 2025;25(1):62. doi:10.1186/s12874-025-02490-9
42. Esmon CT. Basic mechanisms and pathogenesis of venous thrombosis. Blood Rev. 2009;23(5):225–229. doi:10.1016/j.blre.2009.07.002
 © 2026 The Author(s). This work is published and licensed by Dove Medical Press Limited. The
full terms of this license are available at https://www.dovepress.com/terms
and incorporate the Creative Commons Attribution
- Non Commercial (unported, 4.0) License.
By accessing the work you hereby accept the Terms. Non-commercial uses of the work are permitted
without any further permission from Dove Medical Press Limited, provided the work is properly
attributed. For permission for commercial use of this work, please see paragraphs 4.2 and 5 of our Terms.
© 2026 The Author(s). This work is published and licensed by Dove Medical Press Limited. The
full terms of this license are available at https://www.dovepress.com/terms
and incorporate the Creative Commons Attribution
- Non Commercial (unported, 4.0) License.
By accessing the work you hereby accept the Terms. Non-commercial uses of the work are permitted
without any further permission from Dove Medical Press Limited, provided the work is properly
attributed. For permission for commercial use of this work, please see paragraphs 4.2 and 5 of our Terms.
Recommended articles
Association Between Metabolic-Associated Fatty Liver Disease and Obstructive Sleep Apnea: A Cross-Sectional Study
Huang J, Chen L, Li X, Chen M, Lin T, Chen G
Nature and Science of Sleep 2023, 15:49-57
Published Date: 28 February 2023
A Case of Young Obese Heart Failure Patient Using Multidisciplinary Treatment Centered on the Fantastic Four Improved Cardio Ankle Vascular Index and Cardiac Function
Ikeda Y, Iwakawa M, Kiyokawa H, Nakagami T, Kanzaki S, Ogawa A, Tabata T, Takahashi M, Kinoshita T, Shimizu K
International Medical Case Reports Journal 2023, 16:545-549
Published Date: 14 September 2023
Effect of Weight Loss on the Apnea Hypopnea Index is Related to Waist Circumference in Chinese Adults with Overweight and Obesity
Ren Y, Cui X, Zhu X, Guo H, Zhou Q, Yuan P, Cheng H, Wu W
Diabetes, Metabolic Syndrome and Obesity 2024, 17:453-463
Published Date: 27 January 2024
Link Between Obstructive Sleep Apnea and Kidney Stones: NHANES 2015–2018 and Mendelian Randomization
Liu Y, Wang L, Bao EH, Wang JH, Yang L, Wang L, Xia L, Wang B, Zhu PY
Nature and Science of Sleep 2024, 16:1557-1568
Published Date: 3 October 2024
Association Between Obstructive Sleep Apnea and Non-Alcoholic Fatty Liver Disease: Epidemiological Cross-Sectional Study and Mendelian Randomization Analysis
Yu T, Zhou Y, Wu X, Fang Z, Liu C
Nature and Science of Sleep 2025, 17:1361-1376
Published Date: 17 June 2025