")
Back to Journals » Diabetes, Metabolic Syndrome and Obesity » Volume 17
Effect of Weight Loss on the Apnea Hypopnea Index is Related to Waist Circumference in Chinese Adults with Overweight and Obesity
Authors Ren Y , Cui X , Zhu X, Guo H , Zhou Q, Yuan P, Cheng H, Wu W
Received 24 October 2023
Accepted for publication 9 January 2024
Published 27 January 2024 Volume 2024:17 Pages 453—463
DOI https://doi.org/10.2147/DMSO.S442738
Checked for plagiarism Yes
Review by Single anonymous peer review
Peer reviewer comments 2
Editor who approved publication: Dr Konstantinos Tziomalos
Ye Ren,1,* Xiaochuan Cui,2,* Xiaowen Zhu,1 Hua Guo,2 Qunyan Zhou,3 Peng Yuan,4 Haiyan Cheng,1 Wenjun Wu1
1Department of Endocrinology, The Affiliated Wuxi People’s Hospital of Nanjing Medical University, Wuxi People’s Hospital, Wuxi Medical Center, Nanjing Medical University, Wuxi, People’s Republic of China; 2Department of Sleep Center, The Affiliated Wuxi People’s Hospital of Nanjing Medical University, Wuxi People’s Hospital, Wuxi Medical Center, Nanjing Medical University, Wuxi, People’s Republic of China; 3Department of Nutrition Department, The Affiliated Wuxi People’s Hospital of Nanjing Medical University, Wuxi People’s Hospital, Wuxi Medical Center, Nanjing Medical University, Wuxi, People’s Republic of China; 4Department of Rehabilitation, The Affiliated Wuxi People’s Hospital of Nanjing Medical University, Wuxi People’s Hospital, Wuxi Medical Center, Nanjing Medical University, Wuxi, People’s Republic of China
*These authors contributed equally to this work
Correspondence: Wenjun Wu, Department of Endocrinology, Wuxi People’s Hospital, No. 299, Qingyang Road, Wuxi, 214023, People’s Republic of China, Tel +86-15358008856, Email [email protected]
Purpose: The present study aimed to evaluate the efficiency of traditional anthropometric and body composition parameters in predicting apnea hypopnea index (AHI) change after weight loss.
Patients and Methods: Chinese adults with overweight and obesity were included into this study containing two parts. A cross-sectional study was conducted in 137 individuals using the baseline data from two weight loss intervention trials. The second part was the weight-loss intervention study conducted in 60 overweight and obese patients with obstructive sleep apnea (OSA). All participants underwent physical examination, bioelectrical impedance analysis and overnight polysomnography. Multivariate linear regression models were used to identify the most accurate parameters to predict AHI and the mediation analysis to evaluate the mediators between weight loss and AHI reduction.
Results: Waist circumference (WC), body mass index and fat mass were positively associated with AHI after adjusting multiple collinearities in the cross-sectional study. After weight-loss intervention, body weight decreased from 94.6 ± 15.3 to 88.0 ± 13.9 kg, and AHI decreased from 41.9 (13.0,66.9) to 20.7 (8.7,51.2) events/h. Among these parameters, only percentage changes in WC and AHI across the intervention were positively intercorrelated after controlling for covariates (adjusted r = 0.271, P = 0.041). The mediation analysis supported WC as a mediator between weight loss and AHI reduction (standardized indirect effect [95% CI] = 4.272[0.936,7.999]).
Conclusion: Both general and abdominal obesity are of high prognostic value for OSA. WC as an easily accessible parameter mediates the effects of weight loss in decreasing OSA severity.
Plain Language Summary: Current Knowledge: Obesity is a well-recognized risk factor for the development of obstructive sleep apnea (OSA), whereas weight loss has been written into the treatment guidelines for overweight and obese patients with OSA. However, the anthropometric parameters more related to OSA have not been fully clarified, and an easily acquired index is needed to predict the effect of weight loss on apnea hypopnea index (AHI) improvement.
Study Impact: This study found that both general obesity and abdominal obesity were positively associated with AHI, and waist circumference mediated the effect of weight loss in improving AHI. These results provide an easily acquired index to monitor the effect of weight loss on OSA.
Keywords: obesity, obstructive sleep apnea, weight loss, waist circumference, body composition
Introduction
Obstructive sleep apnea (OSA) has an incidence that has kept growing to 9–38%.1 Studies have indicated that OSA may increase morbidity and mortality from cardiovascular events,2,3 metabolic disease and cancer.4,5 Obesity is a well-recognized risk factor for OSA. Weight gain can increase, but weight loss reduces the severity of OSA.6,7
The following anthropometric parameters have been used to predict OSA in obese individuals, including body mass index (BMI), neck circumference (NC), waist circumference (WC), fat mass and muscle. BMI is not an accurate index to distinguish muscle from fat mass or distribution. Inter-ethnic population studies show that despite having a lower average BMI, Chinese subjects present higher prevalence and severity of OSA than Europeans, suggesting that fat distribution may play a role, rather than overall body weight.8–11 Reflecting neck fat distribution, NC is strongly associated with OSA severity, independent of visceral obesity.12,13 This association is more prominent for WC, a surrogate of the abdominal obesity.14,15 Additionally, body fat mass, body fat percentage and body muscle-to-fat ratio (BMFR), which can be measured by bioelectrical impedance analysis (BIA), show a significant association with OSA, and BMFR is a suitable index for screening OSA in patients with T2DM.16 However, the anthropometric parameters more related to OSA have not been fully clarified.
Weight loss has been written into the treatment guidelines for overweight and obese patients with OSA.17,18 Lifestyle interventions, pharmacotherapy, and bariatric surgery can lead to significant improvement or even remission of OSA through losing weight but with highly variable effects on apnea hypopnea index (AHI).19–21 The decrease in AHI is not only related to change in body weight but also baseline AHI and intervention, independent of weight change.19 And no matter whatever weight loss interventions, a goal of losing weight by at least 7% to 11% should be set for clinically significant improvement in OSA, while 25% to 30% for the maximal benefit on AHI.21 AHI is only moderately associated with weight loss.22 More efficient predictors for AHI improvement remain to be elucidated. Sutherland et al found that AHI improvement was strongly associated with upper airway length and visceral abdominal fat with weight loss, according to the computed tomography results of the upper airway and abdomen.23 Using magnetic resonance imaging results, Wang et al found that the effect of weight loss in improving AHI was mediated by the volume of tongue fat.24 However, these parameters are difficult and costly to obtain, and may not be suitable for routine examination. An easily acquired index is needed to predict the effect of weight loss on AHI improvement.
In this study, we aimed to compare the accuracies of traditional anthropometric and body composition parameters in predicting the effect of weight loss on AHI improvement in Chinese adults with overweight and obesity. First, we performed a cross-sectional study to identify which anthropometric parameters were related to OSA severity. Second, we performed an intervention study to tease out the correlation of these parameters with weight loss and AHI improvement.
Materials and Methods
Study Design
The study consisted of two parts. The first part was to identify anthropometric parameters evidently associated with the severity of OSA in overweight and obese patients. The baseline data were collected from 106 patients with overweight and obesity attending an open-label prospective weight-loss intervention study (ChiCTR1800015923) and 31 patients with metabolic syndrome (MetS) undergoing individualized multidisciplinary weight management (ChiCTR1900022948) in the Affiliated Wuxi People’s Hospital of Nanjing Medical University. Obesity and overweight were defined in Chinese adults as BMI ≥ 28kg/m2 and BMI between 24.0 kg/m2 and 27.9 kg/m2, respectively.25 The definition of MetS was stated by the Joint Committee for Developing Chinese Guidelines (JCDCG). In this study, MetS was defined as elevated WC (≥90 cm in males and ≥85 cm in females) with 2 or more of the following components: elevated triglycerides (TG ≥ 1.7 mmol/L); reduced high-density lipoprotein cholesterol (HDL-C <1.0 mmol/L); elevated blood pressure (systolic blood pressure ≥130 or diastolic blood pressure ≥85 mmHg) or receipt of treatment of previously diagnosed hypertension; or elevated glucose level (fasting plasma glucose ≥6.1 mmol/L or 2 h postprandial plasma glucose ≥7.8 mmol/L) or previously diagnosed diabetes mellitus.26 The second part was to identify the most efficient anthropometric index to predict the improvement in OSA caused by weight loss. Data were collected from 60 overweight and obese patients with OSA (ChiCTR1800015923) before and after weight-loss intervention. The two studies were carried out in adherence to the Declaration of Helsinki and approved by the hospital ethics committee (KYLLKS201806, KS2019020). All patients provided written informed consent.
Participants
The weight-loss intervention study (ChiCTR1800015923) with 117 participants screened was conducted from June 2018 through February 2020. Sixty-nine patients were evaluated and consecutively subjected to individualized multidisciplinary weight management (ChiCTR1900022948), which spanned from May 2019 to September 2020. The inclusion and exclusion criteria of two studies are detailed in the Supplementary Appendix (Supplementary Table 1). In addition to the eligibilities set in the original studies, additional inclusion and exclusion criteria were further introduced to screen the baseline data. Inclusion criteria were as follows: (1) ages 18 to 65 years; (2) BMI between 27kg/m2 and 46kg/m2; (3) available BIA and polysomnography (PSG) data. The exclusion criteria were as follows: (1) a history of diabetes which had been medically treated; (2) previous use of pharmacologic agents to normalize fat metabolism; (3) being on positive airway pressure therapy at recruitment. According to the above inclusion and exclusion criteria, 11 participants (1 with lung cancer, 1 with severe thrombocytopenia, 2 with diabetes, 1 with BMI >46kg/m2 and 6 with no PSG) were excluded from the weight-loss intervention study (ChiCTR1800015923), and 38 participants (20 with a medical history of diabetes, 13 with BMI <27kg/m2 and 5 with BMI >46kg/m2) from the individualized multidisciplinary weight management study (ChiCTR1900022948). Finally, a total of 137 participants were included into the cross-sectional study. Of the 117 participants screened in the weight-loss intervention study (ChiCTR1800015923), 4 subjects were excluded for having lung cancer, severe thrombocytopenia, or diabetes at baseline; 9 subjects (including 1 with BMI > 46kg/m2 and 2 with no PSG) dropped out of the study during the 4-week run-in phase and 14 subjects during the 12-week weight loss phase. Among the 90 subjects who finished the 16-week study, 4 subjects were excluded for having no PSG data, 15 subjects having an AHI less than 5, and 11 subjects refusing PSG re-examination. Finally, 60 overweight and obese patients with OSA completed weight-loss intervention and were included into the analysis. The flowchart of participants is detailed in Supplementary Figure 1.
All patients were assessed in an outpatient setting. Self-reported demographic parameters, medical history, smoking and alcohol drinking were collected as baseline data. Anthropometric assessment, BIA and PSG were performed at both baseline and the end of weight-loss intervention.
Anthropometric Assessment
A well-trained nurse collected anthropometric data (including body weight, height, as well as NC, WC and hip circumference [HC]) from all participants at baseline and from weight-loss participants after follow-up. Body weight and height of each patient were recorded using a calibrated scale (HNH-318, Omron, Japan) with 0.1kg and 0.5cm accuracy, respectively. BMI was calculated as weight/height squared (kg/m2). NC was measured horizontally at the level of the cricothyroid membrane using a standard flexible nonelastic metric tape, WC at the midway between the lower rib margin and the iliac crest, and HC at the symphysis greater trochanter level. Waist-to-hip ratio (WHR) was calculated as WC (cm)/HC (cm).
Body Composition Assessment
Body composition parameters were assessed by an InBody® S10 device (Biospace, Seoul, Korea). The BIA was measured in the morning after at least 3 hours of fasting without physical activity and in a room at controlled temperature between 20°C and 25°C. The participants were required to empty their bladders, remove their coats and footwear, and stand on the equipment. Electrodes were placed on the person’s both hands and feet, then 30 impedance values were measured at 6 frequencies (1, 5, 50, 250, 500, and 1000 kHz) on each arm, each leg, and the trunk, with data being obtained automatically. The parameters consisted of fat mass (FM, kg), fat-free mass (FFM, kg), skeletal muscle mass (SMM, kg), and body fat percentage (BFP, %). BMFR was calculated as muscle mass (kg)/fat mass (kg).
Polysomnography
All participants underwent an overnight PSG (Alice 5, Philips Respironics, USA), which was performed by an experienced sleep technician blinded to participants’ data. Apnea was defined as the complete cessation of airflow for at least 10 sec. Hypopnea was defined as an ≥30% decrease in airflow lasting for ≥10 sec with ≥3% oxygen desaturation. AHI, as the main metric for diagnosing OSA, was the average number of apneas and hypopneas per hour of sleep. OSA was diagnosed with the number of AHI ≥5 events per hour. According to AHI, OSA was classified as mild (5 ≤ AHI < 15 events/h), moderate (15 ≤ AHI < 30 events/h), and severe (AHI ≥ 30 events/h).
Weight Loss Intervention
The weight-loss intervention study was carried out by a multidisciplinary team composed of an endocrine physician, a registered nutritionist, a nutrition technician and two rehabilitation physicians. The study consisted of a 4-week run-in phase and a 12-week intervention phase. During the run-in phase, all participants consumed a hypocaloric balanced diet (HBD), with 39% of its total energy from carbohydrate, 37% from fat, and 24% from protein. The total calories of HBD were calculated by multiplying the basal metabolic rate (measured by BIA) by 1.2. During the intervention phase, all participants chose any of three weight-loss programs at their will. Patients in the lifestyle modification group underwent an HBD for a 12-week intervention. Patients in the multiphase modified ketogenic diet (MMKD) group underwent two cycles of multiphase diet, which comprised 2 weeks of ketogenic diet, 2 weeks of transition diet and 2 weeks of HBD. The total calories of ketogenic diet were the actual basal metabolic rate measured by BIA, or 1500 kcal if the basal metabolism exceeded 1500 kcal. Of the total energy of the ketogenic diet, 27% was from carbohydrates, 41% from fat and 32% from protein. In the beinaglutide group, patients consumed a HBD plus daily 0.4 mg of slowly titrated beinaglutide for 2 weeks. Beinaglutide and injector pens were supplied by Shanghai Benemae Pharmaceutical Corporation. Meanwhile, all participants performed aerobic and resistance exercises. Aerobic exercise referred to daily 30 min of 4.8 km/h brisk walking during the whole study. Resistance exercise, only performed during the intervention period, involved daily 10 groups of hip bridges, plank supports, static squatting against the wall, and 60-degree double straight-leg elevation. Each movement was maintained for 30 sec, with one 1-min rest every 5 min. The detailed weight-loss protocols have been described in our previous studies.27,28 Of the 60 obese patients with OSA who completed weight-loss intervention, 31 were treated with lifestyle modification, 12 with MMKD and 17 with beinaglutide.
Statistical Analysis
Mean and standard deviation (SD) and median (Q1, Q3) were used to describe quantitative parameters in normal distribution and non-normal distribution, respectively. The one-way analysis of variance (ANOVA) and the Kruskal–Wallis test were performed to compare parameters among groups. Categorical parameters were expressed by frequencies and percentages and analyzed with the chi-square test. The relationships between anthropometric parameters, body composition parameters, and continuous values of AHI were estimated using Spearman correlation coefficient. All parameters were log-transformed to conform to homogeneity of residual variance before further statistical analysis. The simple linear regression model was used to explore the parameters related to AHI. Then, the factors with p-values less than 0.05 were submitted to the multivariate linear regression model to identify the most potent predictor for AHI. Considering the possibility of multicollinearity, different prediction models were developed. NC and WC were applied in model 1; BMI, NC and WHR in model 2; body composition in model 3. All models were adjusted for age and sex. Sex of participants was defined based on assigned following external or internal examination of body characteristics.
The data before and after weight loss intervention were analyzed by the paired t-test, chi-square test or Wilcoxon-rank sum test, according to variable type. The percentage change was calculated as follow-up minus baseline divided by baseline. Pearson correlation analysis was used to assess relationships (1) between percentage change in body weight and those in anthropometric parameters and body composition parameters; (2) between percentage change in AHI and those in anthropometric parameters and body composition parameters. Mediation analysis was used to evaluate the mediators between percentage change in body weight and those in AHI. Bootstrap method was used to estimate 95% confidence interval (CI) to verify indirect effect. Mediation was shown if the CI excluded zero.
All statistical analyses were performed using SPSS statistical software (version 26; Chicago, IL, USA). Graphs were created in GraphPad Prism version 8.3.0 (GraphPad Software, San Diego, CA, USA). P-value <0.05 was considered statistically significant.
Results
Clinical Characteristics of Participants Stratified by AHI
As shown in Table 1, 20 patients (14.6%) had no OSA; 37 (27.0%), 22 (16.1%) and 58 (42.3%) presented mild, moderate and severe OSA, respectively. The participants with severe OSA were more likely to be male and drinkers. Body weight, BMI, NC, WC, WHR, SMM, FM and FFM were higher in OSA participants than in non-OSA participants and increased with the severity of OSA. Body weight, NC, WHR, SMM and FFM in participants with severe OSA were significantly higher than those in the participants with mild OSA. Curiously, patients with severe OSA had a lower PBF and a higher BMFR than patients with mild OSA.
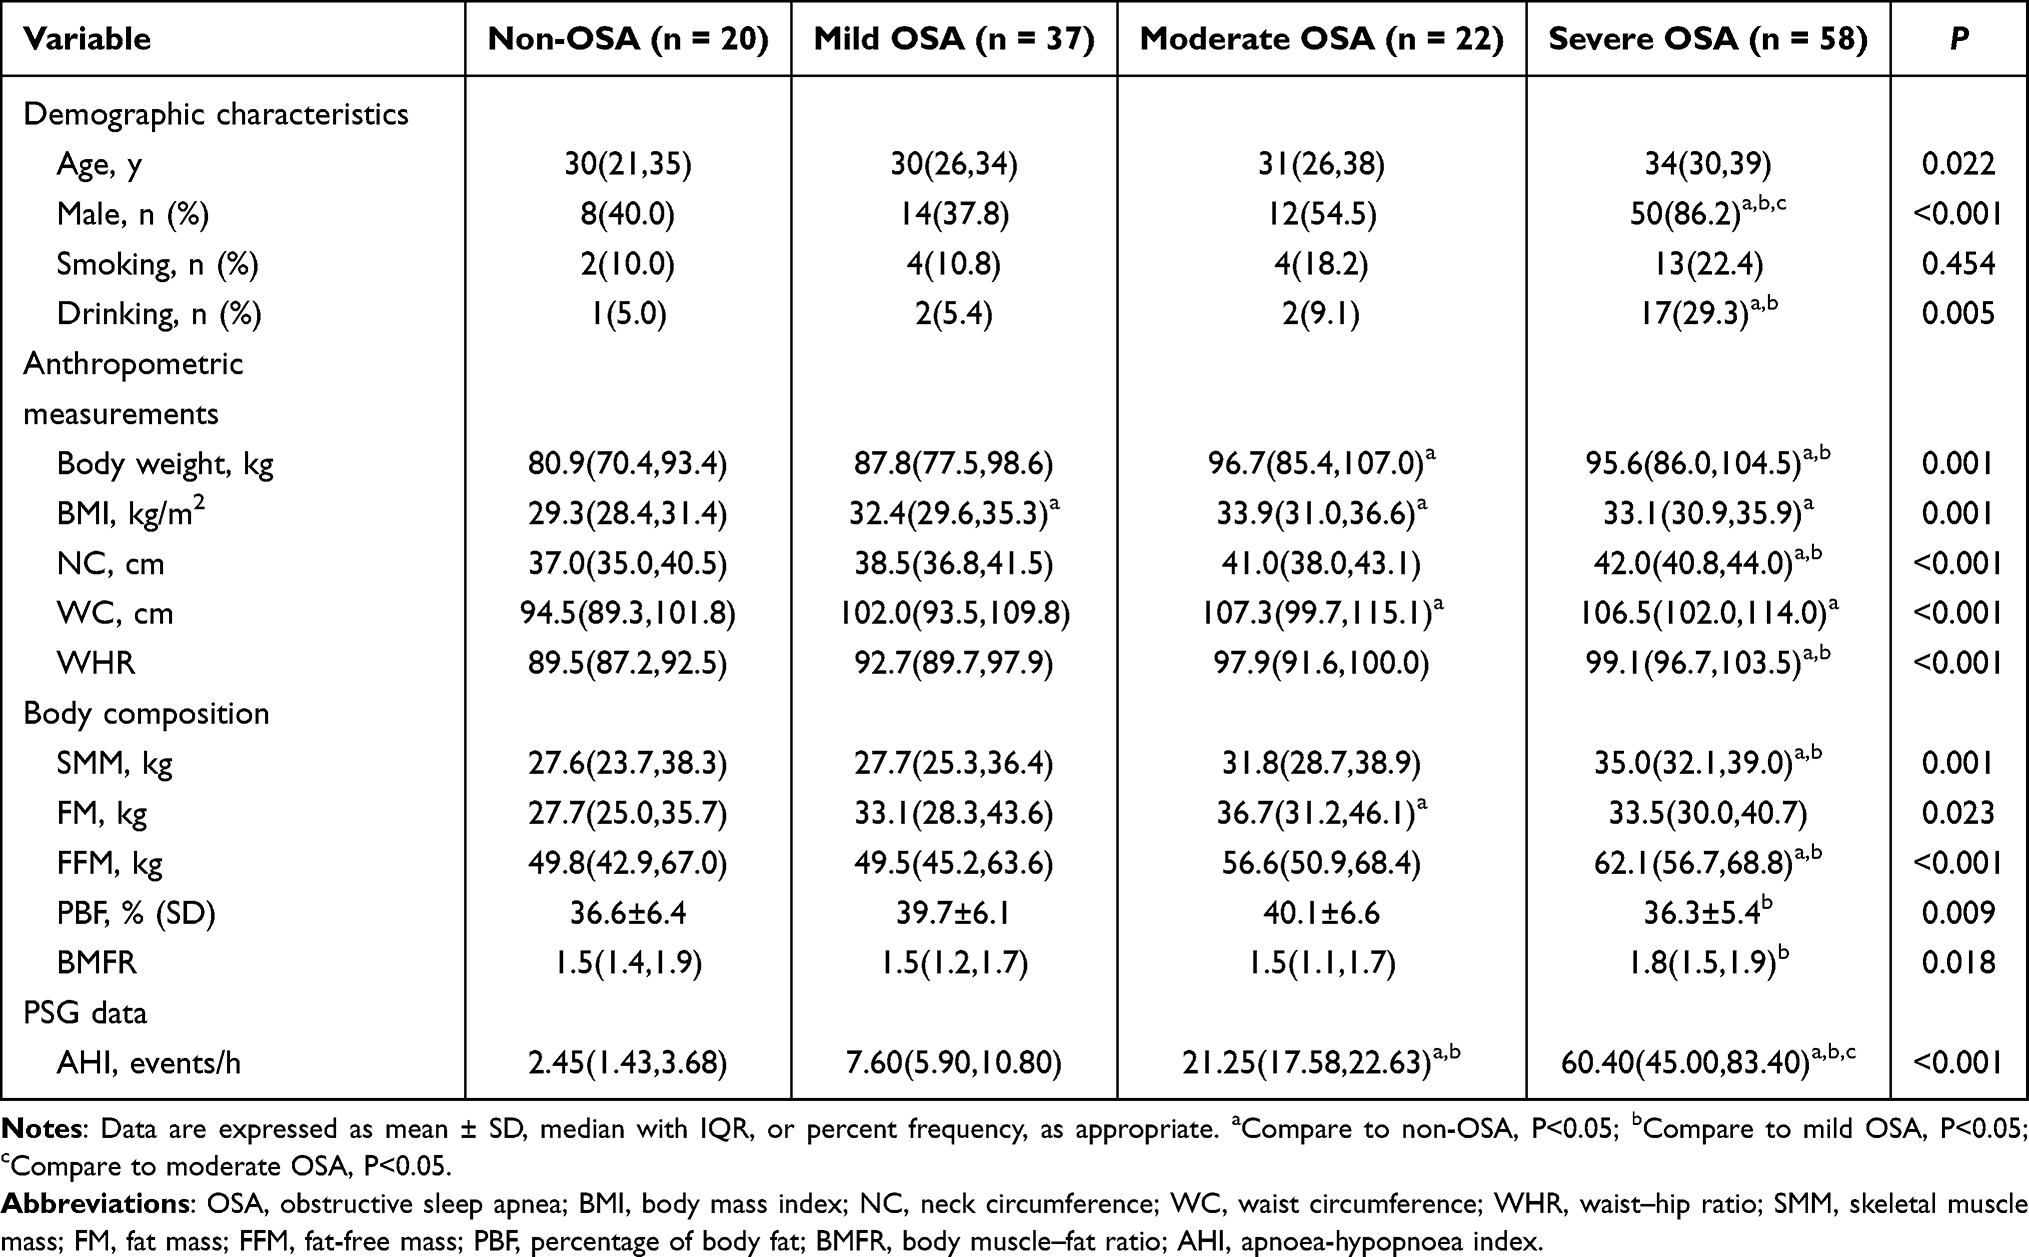 |
Table 1 Demographic Characteristics, Anthropometric Indicators and Body Composition in Overweight and Obese Patients According to AHI |
Relationships Between Anthropometric Parameters, Body Composition and AHI
AHI had an association with body weight, BMI, NC, WC, WHR, SMM, FM, FFM PBF and BMFR, especially a significantly positive association with NC, WC, WHR and FFM (r > 0.4, P < 0.01) (Supplementary Table 2). The simple linear regressions showed that AHI was significantly associated with age, body weight, BMI, NC, WC, WHR, SMM, FM and FFM (Supplementary Table 3). The relationships between AHI and other parameters were further analyzed using three multivariate linear regression models adjusted by age and sex (Table 2). Model 1, in which NC and WC were incorporated, showed that WC was positively associated with AHI (β = 3.564, P = 0.001, adjusted R-squared = 0.313). Model 2, in which BMI, NC and WHR were incorporated, showed that BMI was positively associated with AHI (β = 2.374, P = 0.018, adjusted R squared = 0.343). Model 3, in which SMM, FM and FFM were incorporated, showed that FM was positively associated with AHI (β = 1.664, P = 0.001, adjusted R squared = 0.295).
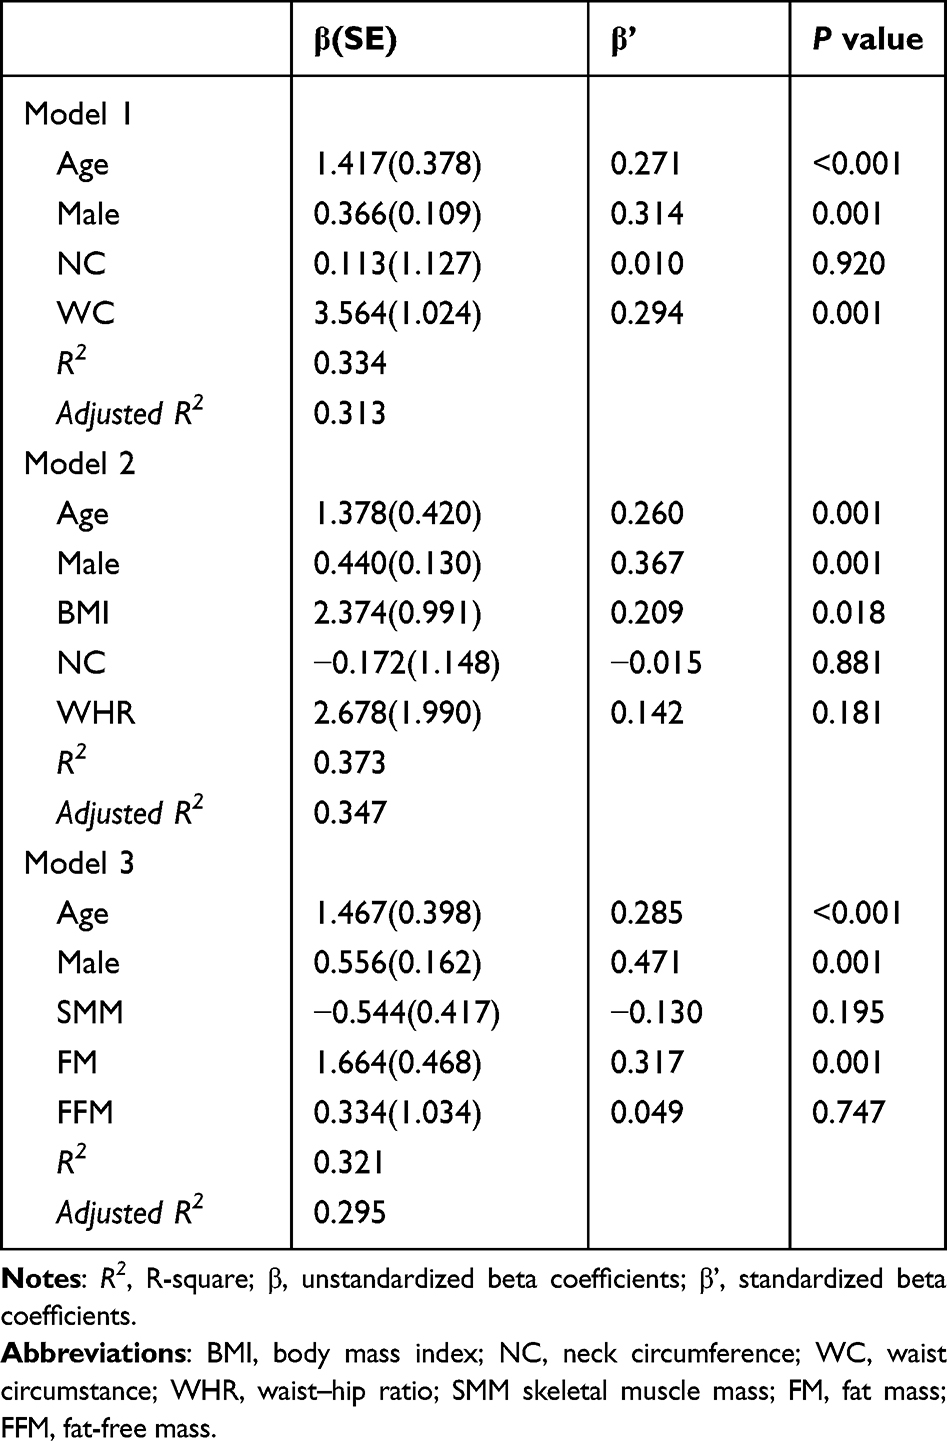 |
Table 2 Multivariate Linear Regression Models for Predicting Log (AHI) in Overweight and Obese Patients |
Effect of Weight-Loss Intervention on AHI
A total of 60 overweight and obese participants received weight-loss management, with a median age of 33 years and 40 (66.7%) being males. After 12 weeks of weight-loss intervention, AHI decreased from 41.9 (13.0,66.9) to 20.7 (8.7,51.2) events/h, downgrading 11 OSA cases from severe to moderate, 5 from moderate to mild, 1 from severe to none, and 6 from mild to none (Table 3, Supplementary Figure 2). On the other hand, body weight dropped significantly so did BMI, NC, WC and WHR. Furthermore, a significant improvement in body composition was observed, with decreases in SMM, FM, FFM and PBF and an increase in BMFR.
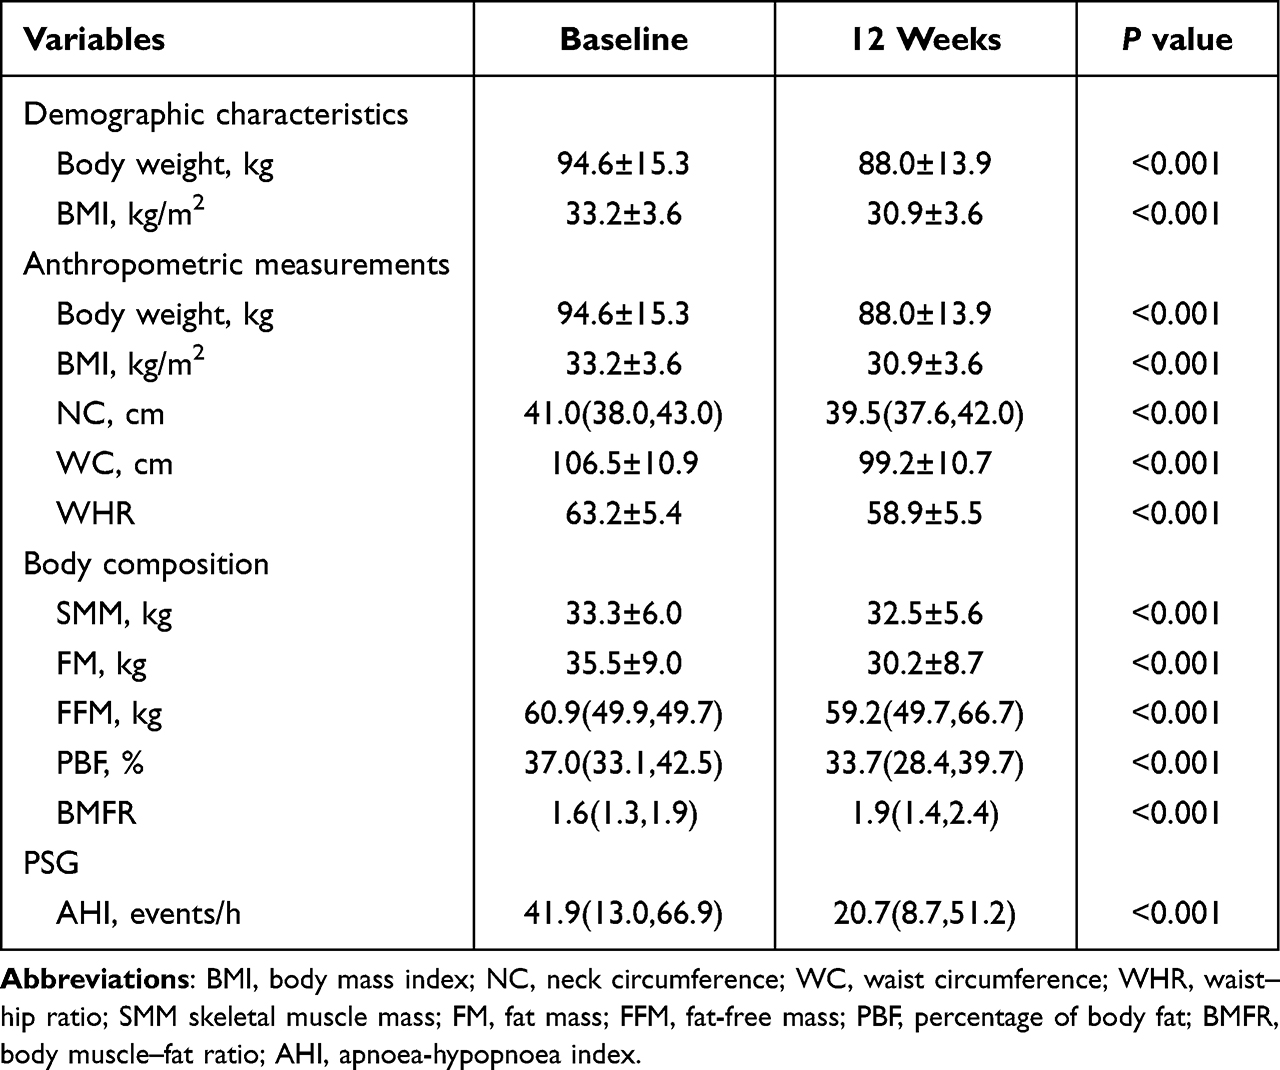 |
Table 3 Paired Comparisons of Anthropometric Indicators, Body Composition and AHI at Baseline and After a 12-Week Weight Loss Intervention |
Mediating Effect of WC Between Weight Loss and AHI
The percentage change in body weight was significantly positively related to those in BMI, NC, WC, WHR, SMM, FM, FFM and PBF, and negatively related with that in BMFR (Supplementary Table 4, Figure 1). After controlling for covariates, similar results were observed. The percentage change in AHI was significantly positively related to those in BMI, NC, WC, WHR, SMM, FM and FFM. However, after controlling for covariates, only a positive correlation between AHI and WC was observed (adjusted r = 0.271, P = 0.041) (Supplementary Table 5, Figure 1).
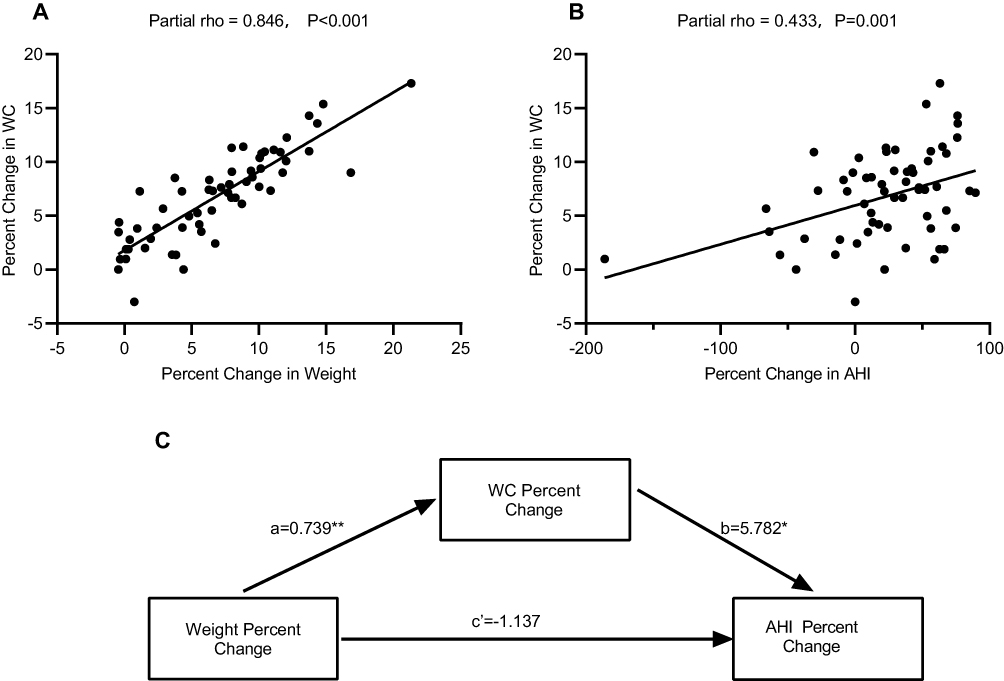 |
Figure 1 Association between percent change in WC, percent change in body weight and percent change in AHI. (A) Percent change in body weight had a positive association with that in WC; (B) percent change in WC had a positive association with that in AHI; (C) schematic diagram of WC as a mediator between percent change of body weight and AHI. Abbreviations: WC, waist circumference; AHI, apnoea-hypopnoea index. Notes: coefficient a, the effect of percent change in weight on percent change in WC; coefficient b, the effect of percent change in WC on percent change in AHI; coefficient c’, the direct effect of percent change in body weight on percent change in AHI. *p < 0.05, **p < 0.01. |
To identify which parameter mediates the effect of weight loss on AHI, the mediation analysis was used. The findings showed that the AHI decreased by 3% (unstandardized total effect [95% CI] = 3.135 [0.676,5.593]; standardized total effect = 0.332) with one percent reduction in weight, suggesting the mediating role of WC between body weight and AHI (standardized indirect effect [95% CI] = 4.272[0.936,7.999]) (Supplementary Table 6, Figure 1).
Discussion
In the present study, both general obesity (measured by BMI and FM) and abdominal obesity (measured by WC) were found positively associated with AHI. Weight loss reduced AHI effectively, and all anthropometric parameters and body composition parameters changed with weight loss. Notably, WC significantly mediated the effect of weight loss in reducing AHI.
The contribution of fat mass and fat distribution to OSA in obesity has been proven in previous studies.29 However, whether abdominal or general obesity parameters are more strongly associated with OSA is controversial across studies. A study from Brazil held that surrogate markers of regional adiposity were not more accurate than BMI in predicting OSA and that age and sex-adjusted BMI were the most accurate to detect OSA.30 Another large population-based study, including 3699 Chinese adults, showed that the abdominal obesity parameters (NC, WC, and HC) were associated with OSA severity, and WC was the strongest predictor.31 Unal et al also supported this view, finding a cutoff value of 95.5 cm in females and 100.5 cm in males for predicting OSA and a cutoff value of 104.5 cm in females and 106.5 cm in males for predicting severe OSA.15 Chinese patients, who are more prone to central obesity, consistently exhibit lower BMIs for an equivalent OSA severity. Our study showed BMI, FM (reflecting general obesity) and WC (reflecting abdominal obesity) were all associated with AHI. Different from those in previous studies in China, we found that WC was no more correlated with AHI than BMI. One explanation may be that the participants included in our study were mostly young and middle-aged. One age-related study demonstrated that general adiposity appeared to be more strongly associated with OSA in the non-elderly.30,32 Confusingly, we found no association between AHI and visceral fat area (VFA, data not provided), a parameter that always changes in the same manner with that of WC.33 A possible reason is that VFA was determined by BIA in our study, the accuracy of which is limited in adults, particularly in men, or participants with a high BMI.34–36
Interestingly, the body composition variables were similar between the moderate OSA and severe OSA groups. Most of the key factors that cause OSA vary with disease severity. Obesity plays a partial role in the pathogenesis of severe OSA.37 The upper airway (UA) anatomy/collapsibility differs across a range of OSA severities. Severe OSA patients always have smaller airway lumen/cross-sectional area, larger number of lesion sites and higher degree of collapse, and longer airway length.37
For the first time, we found that WC, as an easily acquired index, could predict AHI improvement after weight loss. Studies have shown that a 10% decrease in body weight results in a 14–34% decrease in AHI.6,22,38 In accordance with previous studies, we also found an average 6.8% decrease in body weight resulted in an average 23.2% decrease in AHI in the present study. Meanwhile, body dimensions and body composition changed with weight loss, which is consistent with those reported in previous studies.39,40 Moreover, our mediation analysis supported that WC was a variable most related to OSA improvement. This mediating effect may be achieved through three mechanisms. One mechanism is that the reduction in abdominal fat area can relieve pressure on the chest and increase lung volume, thereby expanding pharyngeal cross-sectional area (CSA). With such an expansion, the upper airway length reduces and AHI drops.23 In addition, the change in tongue adiposity may be parallel to that in ectopic fat elsewhere, including abdominal adipose.41,42 Correlation between the percentage changes in tongue fat and total abdominal fat has been proved (Wang, et al, 2020).24 Another mechanism may involve metabolic factors. Ample evidence demonstrates that insulin resistance may contribute to OSA pathogenesis, independent of the presence or absence of obesity.43 In the overweight or obese group, WC serves as an important marker of insulin resistance in patients with OSA.44 On the contrary, the reduction of WC may indicate the fall of insulin resistance.
One strength of this study is the standard and homogenous evaluation of the participants. All participants were assessed by the high-quality overnight PSG for diagnosing OSA and treated by the same multidisciplinary team following the same protocol. Second, this is the first study to evaluate the AHI-predicting anthropometric parameters that change with weight loss Anthropometric parameters are cheap and easy to be obtained and can be used to personalize OSA treatments.
Its limitations cannot be ignored. First, the data in our study were collected from one single center and the sample size was small, which may introduce some selection bias. Second, OSA was not distinguished from obesity hypoventilation syndrome (OHS), for we had not measured the carbonate levels in the participants awake in daytime. BMI was significantly higher in OHS than in OSA,45 which may influence the results to some extent. In addition, we did not exclude the effects of several potential confounders, such as sleep position and skeletal malformations.46–48 Third, this study was limited to young and middle-aged Chinese adults with overweight and obesity. The findings may not apply to non-Asian individuals and older individuals (>60 years of age). Further studies are required to verify whether WC is an effective index in predicting AHI reduction with weight loss.
Conclusion
Both general and abdominal obesity are implicated in the development of OSA, and WC mediates the effect of weight loss in lowering AHI. For OSA patients with obesity, WC should be monitored to optimize the effect of weight loss on OSA.
Abbreviations
AHI, apnea hypopnea index; ANOVA, analysis of variance; BFP, body fat percentage; BIA, bioelectrical impedance analysis; BMFR, body muscle-to-fat ratio; BMI, body mass index; CI, confidence interval; FFM, fat-free mass; FM, fat mass; HBD, hypocaloric balanced diet; HC, hip circumference; HDL-C, high-density lipoprotein cholesterol; JCDCG, the Joint Committee for Developing Chinese Guidelines; MetS, metabolic syndrome; MMKD, multiphase modified ketogenic diet; NC, neck circumference; NPOSA, non-positional obstructive sleep apnea; OHS, obesity hypoventilation syndrome; OSA, obstructive sleep apnea; PSG, polysomnography; SD, standard deviation; SMM, skeletal muscle mass; TG, triglyceridesVFA, visceral fat area; WC, waist circumference; WHR, Waist-to-hip ratio.
Data Sharing Statement
The data presented in this study are available upon request from the corresponding author. The data are not publicly available due to privacy reasons.
Ethics Statement
The two studies were carried out in adherence with the Declaration of Helsinki and approved by the Ethics Committee of the Affiliated Wuxi People’s Hospital of Nanjing Medical University (KYLLKS201806, KS2019020). The two trials were registered in the Chinese Clinical Trial Registry (ChiCTR1900022948, ChiCTR1900022948). All participants provided written informed consent.
Acknowledgments
We thank all the participants in this study.
Funding
Fundings for the study were provided by the Top Talent Support Program for young and middle-aged people of Wuxi Health Committee (BJ2020005) and the Wuxi Science and Technology Development Fund (Y20212024).
Disclosure
The authors report no conflicts of interest in this work.
References
1. Senaratna CV, Perret JL, Lodge CJ, et al. Prevalence of obstructive sleep apnea in the general population: a systematic review. Sleep Med Rev. 2017;34:70–81. doi:10.1016/j.smrv.2016.07.002
2. Chahal CAA, Sherif AA, Somers VK. The complex and instructive relationship between OSA and nocturnal cardiovascular death. Sleep Med. 2017;38:151–152. doi:10.1016/j.sleep.2017.08.001
3. Wang X, Fan J, Guo R, et al. Association of obstructive sleep apnoea with cardiovascular events in women and men with acute coronary syndrome. Europ resp J. 2023;61(1). doi:10.1183/13993003.01110-2022
4. Kim T, Kang J. Relationship between obstructive sleep apnea, insulin resistance, and metabolic syndrome: a nationwide population-based survey. Endocr J. 2023;70(1):107–119. doi:10.1507/endocrj.EJ22-0280
5. Martínez-García M, Campos-Rodriguez F, Barbé F. Cancer and OSA: current Evidence From Human Studies. Chest. 2016;150(2):451–463. doi:10.1016/j.chest.2016.04.029
6. Joosten SA, Hamilton GS, Naughton MT. Impact of weight loss management in OSA. Chest. 2017;152(1):194–203. doi:10.1016/j.chest.2017.01.027
7. Peppard PE, Young T, Palta M, Dempsey J, Skatrud J. Longitudinal study of moderate weight change and sleep-disordered breathing. JAMA. 2000;284(23):3015–3021. doi:10.1001/jama.284.23.3015
8. Hnin K, Mukherjee S, Antic NA, et al. The impact of ethnicity on the prevalence and severity of obstructive sleep apnea. Sleep Med Rev. 2018;41:78–86. doi:10.1016/j.smrv.2018.01.003
9. Liu Y, Zou J, Qian Y, et al. The association between obesity indices and obstructive sleep apnea is modified by age in a sex-specific manner. Sleep Breathing. 2021;25(1):189–197. doi:10.1007/s11325-020-02083-4
10. Ma B, Li Y, Wang X, et al. Association between abdominal adipose tissue distribution and obstructive sleep apnea in Chinese Obese Patients. Front Endocrinol. 2022;13:847324. doi:10.3389/fendo.2022.847324
11. Turnbull CD, Wang SH, Manuel AR, et al. Relationships between MRI fat distributions and sleep apnea and obesity hypoventilation syndrome in very obese patients. Sleep Breathing. 2018;22(3):673–681. doi:10.1007/s11325-017-1599-x
12. Kawaguchi Y, Fukumoto S, Inaba M, et al. Different impacts of neck circumference and visceral obesity on the severity of obstructive sleep apnea syndrome. Obesity. 2011;19(2):276–282. doi:10.1038/oby.2010.170
13. Yildirim Y, Yilmaz S, Güven M, et al. Evaluation of anthropometric and metabolic parameters in obstructive sleep apnea. Pulm Med. 2015;2015:189761. doi:10.1155/2015/189761
14. Polesel DN, Nozoe KT, Bittencourt L, et al. Waist-to-height ratio and waist circumference as the main measures to evaluate obstructive sleep apnea in the woman’s reproductive life stages. Women Health. 2021;61(3):277–288. doi:10.1080/03630242.2020.1862386
15. Unal Y, Ozturk DA, Tosun K, Kutlu G. Association between obstructive sleep apnea syndrome and waist-to-height ratio. Sleep Breathing. 2019;23(2):523–529. doi:10.1007/s11325-018-1725-4
16. Kurinami N, Sugiyama S, Ijima H, et al. Clinical usefulness of the body muscle-to-fat ratio for screening obstructive sleep apnea syndrome in patients with inadequately controlled type 2 diabetes mellitus. Diabet Res Clin Pract. 2018;143:134–139. doi:10.1016/j.diabres.2018.07.008
17. Hudgel DW, Patel SR, Ahasic AM, et al. The role of weight management in the treatment of adult obstructive sleep apnea. An Official American Thoracic Society Clinical Practice Guideline. Am J Respir Crit Care Med. 2018;198(6):e70–e87. doi:10.1164/rccm.201807-1326ST
18. Randerath W, Verbraecken J, de Raaff CAL, et al. European Respiratory Society guideline on non-CPAP therapies for obstructive sleep apnoea. Eur Respir Rev. 2021;30(162). doi:10.1183/16000617.0200-2021
19. Kuna ST, Reboussin DM, Strotmeyer ES, et al. Effects of weight loss on obstructive sleep apnea severity. ten-year results of the sleep AHEAD study. Am J Respir Crit Care Med. 2021;203(2):221–229. doi:10.1164/rccm.201912-2511OC
20. Roche J, Isacco L, Masurier J, et al. Are obstructive sleep apnea and sleep improved in response to multidisciplinary weight loss interventions in youth with obesity? A systematic review and meta-analysis. Int J Obesity. 2020;44(4):753–770.
21. Tham KW, Lee PC, Lim CH. Weight management in obstructive sleep apnea: medical and surgical options. Sleep Med Clin. 2019;14(1):143–153. doi:10.1016/j.jsmc.2018.10.002
22. Sutherland K, Chapman JL, Cayanan EA, et al. Does craniofacial morphology relate to sleep apnea severity reduction following weight loss intervention? A patient-level meta-analysis. Sleep. 2021;44(3). doi:10.1093/sleep/zsaa207
23. Sutherland K, Lee RW, Phillips CL, et al. Effect of weight loss on upper airway size and facial fat in men with obstructive sleep apnoea. Thorax. 2011;66(9):797–803. doi:10.1136/thx.2010.151613
24. Wang SH, Keenan BT, Wiemken A, et al. Effect of weight loss on upper airway anatomy and the apnea-hypopnea index. the importance of tongue fat. Am J Respir Crit Care Med. 2020;201(6):718–727. doi:10.1164/rccm.201903-0692OC
25. Pan XF, Wang L, Pan A. Epidemiology and determinants of obesity in China. Lancet Diabetes Endocrinol. 2021;9(6):373–392. doi:10.1016/s2213-8587(21)00045-0
26. Zhu J, Gao R, Zhao S, et al. Chinese guidelines on prevention and treatment of dyslipidemia in adults (2016 Revised Edition). Chin Circulat J. 2016;31(10):937–950. doi:10.3969/j.issn.1000-3614.2016.10.001
27. Wu W, Zhou Q, Yuan P, et al. A novel multiphase modified ketogenic diet: an effective and safe tool for weight loss in Chinese Obese Patients. Diabetes Metabol Syndr Obes. 2022;15:2521–2534. doi:10.2147/dmso.S365192
28. Yuan W, Lu W, Wang H, et al. A multiphase dietetic protocol incorporating an improved ketogenic diet enhances weight loss and alters the gut microbiome of obese people. Int J Food Sci Nutr. 2022;73(2):238–250. doi:10.1080/09637486.2021.1960957
29. Isono S. Obesity and obstructive sleep apnoea: mechanisms for increased collapsibility of the passive pharyngeal airway. Respirology. 2012;17(1):32–42. doi:10.1111/j.1440-1843.2011.02093.x
30. Santos RB, Silva WA, Parise BK, et al. Accuracy of global and/or regional anthropometric measurements of adiposity in screening sleep apnea: the ELSA-Brasil cohort. Sleep Med. 2019;63:115–121. doi:10.1016/j.sleep.2019.04.020
31. Zhao X, Xu H, Qian Y, et al. Abdominal obesity is more strongly correlated with obstructive sleep apnea than general obesity in China: results from two separated observational and longitudinal studies. Obes Surg. 2019;29(8):2535–2547. doi:10.1007/s11695-019-03870-z
32. Zhang Z, Wang Y, Li H, Ni L, Liu X. Age-specific markers of adiposity in patients with obstructive sleep apnea. Sleep Med. 2021;83:196–203. doi:10.1016/j.sleep.2021.02.051
33. Zheng C, Zheng X, Lin X, et al. Visceral adipose tissue indices independently correlated with obstructive sleep apnea in patients with type 2 diabetes. J Diabetes Res. 2022;2022:4950528. doi:10.1155/2022/4950528
34. Lee DH, Park KS, Ahn S, et al. Comparison of abdominal visceral adipose tissue area measured by computed tomography with that estimated by bioelectrical impedance analysis method in Korean Subjects. Nutrients. 2015;7(12):10513–10524. doi:10.3390/nu7125548
35. Qin Q, Yang Y, Chen J, et al. Bioelectrical impedance analysis versus quantitative computer tomography and anthropometry for the assessment of body composition parameters in China. Sci Rep. 2021;11(1):11076. doi:10.1038/s41598-021-90641-5
36. Xu Z, Liu Y, Yan C, et al. Measurement of visceral fat and abdominal obesity by single-frequency bioelectrical impedance and CT: a cross-sectional study. BMJ Open. 2021;11(10):e048221. doi:10.1136/bmjopen-2020-048221
37. Edwards BA, Eckert DJ, Jordan AS. Obstructive sleep apnoea pathogenesis from mild to severe: is it all the same? Respirology. 2017;22(1):33–42. doi:10.1111/resp.12913
38. Carneiro‐Barrera A, Díaz‐Román A, Guillén‐Riquelme A, Buela‐Casal G. Weight loss and lifestyle interventions for obstructive sleep apnoea in adults: systematic review and meta‐analysis. Obesity Rev. 2019;20(5):750–762.
39. Dobrosielski DA, Patil S, Schwartz AR, Bandeen-Roche K, Stewart KJ. Effects of exercise and weight loss in older adults with obstructive sleep apnea. Med Sci Sports Exerc. 2015;47(1):20–26. doi:10.1249/mss.0000000000000387
40. Lu D, Yuan Z, Yang L, et al. Body composition and metabolic improvement in patients followed up by a multidisciplinary team for obesity in China. J Diabetes Res. 2021;2021:8862217. doi:10.1155/2021/8862217
41. Godoy IR, Martinez-Salazar EL, Eajazi A, Genta PR, Bredella MA, Torriani M. Fat accumulation in the tongue is associated with male gender, abnormal upper airway patency and whole-body adiposity. Metabolism. 2016;65(11):1657–1663. doi:10.1016/j.metabol.2016.08.008
42. Kim DH, Kim B, Han K, Kim SW. The relationship between metabolic syndrome and obstructive sleep apnea syndrome: a nationwide population-based study. Sci Rep. 2021;11(1):8751. doi:10.1038/s41598-021-88233-4
43. Framnes SN, Arble DM. The bidirectional relationship between obstructive sleep apnea and metabolic disease. Front Endocrinol. 2018;9:440. doi:10.3389/fendo.2018.00440
44. Wei R, Gao Z, Xu H, et al. Body fat indices as effective predictors of insulin resistance in obstructive sleep apnea: evidence from a cross-sectional and longitudinal study: BFI as predictors of IR in OSA. Obes Surg. 2021;31(5):2219–2230. doi:10.1007/s11695-021-05261-9
45. Herkenrath SD, Treml M, Hagmeyer L, Matthes S, Randerath WJ. Severity stages of obesity-related breathing disorders - a cross-sectional cohort study. Sleep Med. 2022;90:9–16. doi:10.1016/j.sleep.2021.12.015
46. Jeong JI, Gu S, Cho J, et al. Impact of gender and sleep position on relationships between anthropometric parameters and obstructive sleep apnea syndrome. Sleep Breathing. 2017;21(2):535–541. doi:10.1007/s11325-016-1413-1
47. Huang L, Gao X. The interaction of obesity and craniofacial deformity in obstructive sleep apnea. Dento maxillo facial radiol. 2021;50(4):20200425. doi:10.1259/dmfr.20200425
48. Leppänen T, Töyräs J, Muraja-Murro A, et al. Length of individual apnea events is increased by supine position and modulated by severity of obstructive sleep apnea. Sleep Disord. 2016;2016:9645347. doi:10.1155/2016/9645347
 © 2024 The Author(s). This work is published and licensed by Dove Medical Press Limited. The full terms of this license are available at https://www.dovepress.com/terms.php and incorporate the Creative Commons Attribution - Non Commercial (unported, v3.0) License.
By accessing the work you hereby accept the Terms. Non-commercial uses of the work are permitted without any further permission from Dove Medical Press Limited, provided the work is properly attributed. For permission for commercial use of this work, please see paragraphs 4.2 and 5 of our Terms.
© 2024 The Author(s). This work is published and licensed by Dove Medical Press Limited. The full terms of this license are available at https://www.dovepress.com/terms.php and incorporate the Creative Commons Attribution - Non Commercial (unported, v3.0) License.
By accessing the work you hereby accept the Terms. Non-commercial uses of the work are permitted without any further permission from Dove Medical Press Limited, provided the work is properly attributed. For permission for commercial use of this work, please see paragraphs 4.2 and 5 of our Terms.