
Back to Journals » International Journal of Chronic Obstructive Pulmonary Disease » Volume 21
Multi‑feature Prediction Model for Coronary Heart Disease Comorbidity in Middle‑aged and Older Adults with COPD Based on Machine Learning and SHAP
Authors Li R  , Wang Q, Zhang X, Zhou F
Received 8 May 2026
Accepted for publication 3 July 2026
Published 10 July 2026 Volume 2026:21 623174
DOI https://doi.org/10.2147/COPD.S623174
Checked for plagiarism Yes
Review by Single anonymous peer review
Peer reviewer comments 7
Editor who approved publication: Prof. Dr. Zijing Zhou
Rui Li,1 Qiushi Wang,1 Xiao Zhang,2 Fu Zhou1
1Department of Respiratory Medicine, Affiliated Banan Hospital of Chongqing Medical University, Chongqing, 401320, People’s Republic of China; 2Department of Medical Records and Statistics, Affiliated Banan Hospital of Chongqing Medical University, Chongqing, 401320, People’s Republic of China
Correspondence: Fu Zhou, Department of Respiratory Medicine, Affiliated Banan Hospital of Chongqing Medical University, Chongqing, 401320, People’s Republic of China, Email [email protected]
Background: Chronic obstructive pulmonary disease (COPD) frequently coexists with coronary heart disease (CHD), markedly worsening prognosis in middle-aged and older patients. Early identification of CHD comorbidity in this population remains clinically imperative.
Methods: This single-center, cross-sectional study included COPD patients aged 45 years or older admitted between 2020 and 2025. Missing data were imputed using random forest, and least absolute shrinkage and selection operator regression was applied for feature selection. Nine machine learning models were constructed and evaluated by the area under the receiver operating characteristic curve (AUC), calibration curves, and decision curve analysis. SHapley Additive exPlanations and restricted cubic splines (RCS) were employed for model interpretation and dose-response exploration.
Results: Of 17,862 eligible patients, 7,211 (40.37%) had coexisting CHD. Sixteen predictors were identified. The XGBoost model demonstrated moderate predictive performance (training AUC 0.871, 95% CI: 0.864– 0.877; validation AUC 0.743, 95% CI: 0.730– 0.756), significantly outperforming all other models in the training set and showing comparable performance to GBDT in the validation set. Age, hypertension, total cholesterol (TC), chronic gastritis, and uric acid (UA) were the top five predictors. RCS identified various dose-response patterns, including nonlinear associations for pulse rate, diastolic blood pressure, TC, and platelet count, and linear positive associations for prothrombin time and UA.
Conclusion: The XGBoost model showed moderate discriminative ability for predicting CHD comorbidity in middle-aged and older COPD patients. However, further external validation is required before clinical application, and the findings should be interpreted with caution given the single-center, cross-sectional design.
Keywords: chronic obstructive pulmonary disease, coronary heart disease, machine learning, SHapley Additive exPlanations, restricted cubic splines
Introduction
Chronic obstructive pulmonary disease (COPD) is a common chronic inflammatory airway disorder characterized by progressive and partially reversible airflow limitation, typically diagnosed by post-bronchodilator spirometry, clinically manifesting as exertional dyspnea, wheezing, chronic cough, and sputum production.1,2 As a major non-communicable disease, COPD currently affects more than 400 million people worldwide, ranks as the third leading cause of death, and accounts for approximately 3 million deaths annually.3 It is also a leading cause of poor health as measured by disability-adjusted life years (DALYs).4 COPD frequently coexists with other conditions—referred to as comorbidities—that can substantially influence patient prognosis.5 Among these, coronary heart disease (CHD) is one of the most common and clinically impactful comorbidities in middle-aged and older patients with COPD. The Global Initiative for Chronic Obstructive Lung Disease (GOLD) explicitly emphasizes that the management of COPD patients must include the identification and appropriate treatment of comorbidities, regardless of whether a direct causal relationship between COPD and these comorbid conditions exists.6
The coexistence of COPD and CHD is associated with significantly increased risks of all‑cause and cardiovascular mortality.7–9 A cross-sectional study based on data from the National Health and Nutrition Examination Survey (NHANES) 1999–2018 revealed that, among individuals aged over 40 years, the prevalence of CHD was only 9.2% in those without COPD, whereas it increased to 17.5% in the overall COPD population.10 Longitudinal cohort studies further demonstrated that, compared with individuals free of both COPD and cardiovascular disease, middle-aged and older patients with coexisting COPD and CHD had a 2.02-fold higher risk of all-cause mortality and a 2.35-fold higher risk of cardiovascular-specific mortality.11 Given the high prevalence and substantial mortality burden of CHD in this population, early identification and precise prediction of CHD risk are of great clinical and public health importance.12 The age threshold of 45 years was selected based on the substantial increase in both COPD and CHD prevalence after this age in previous epidemiological studies, aligning with the definition of “middle-aged” used in comparable cohort studies.13,14
In recent years, machine learning (ML) algorithms have been extensively validated in various clinical scenarios, including cardiovascular risk prediction, owing to their ability to capture complex nonlinear interactions among variables.15–17 Several recent studies have developed prediction models for cardiovascular comorbidity in COPD patients using traditional regression approaches or basic nomograms.18–20 However, these models are often limited by predefined linear assumptions, small sample sizes, or lack of rigorous internal validation, and they do not adequately address the complex, nonlinear relationships inherent in multidimensional clinical data. Nevertheless, predictive studies specifically targeting CHD in patients with COPD using advanced ML methods with model interpretability tools remain relatively scarce. Therefore, the present study aims to develop a machine learning‑based risk classification model integrating demographic characteristics, comorbidities, vital signs, and laboratory parameters to classify CHD comorbidity in middle‑aged and older patients with COPD using cross‑sectional data, with the goal of internal model development.
Methods
Data Source and Study Population
This study was a single‑center, retrospective, observational investigation. All data were extracted from the electronic medical record (EMR) system of the Affiliated Banan Hospital of Chongqing Medical University. The study protocol was approved by the Ethics Committee of the Affiliated Banan Hospital of Chongqing Medical University (approval number: BNLL-KY-2026-016). Because the analysis was based solely on anonymized historical data without any patient intervention, the requirement for informed consent was waived by the ethics committee.
Patients admitted with a diagnosis of COPD between January 2020 and December 2025 were considered for inclusion. The initial cohort comprised 22,883 patients. Exclusion criteria were applied sequentially: (1) age younger than 45 years (as this study specifically targeted middle-aged and older adults, consistent with previous studies defining middle-aged as ≥45 years) (n = 73); (2) hospital stay shorter than 24 hours (n = 558, these patients were excluded to minimize the inclusion of transient visits or incomplete diagnostic evaluations); (3) presence of active pulmonary tuberculosis (n = 588), pulmonary interstitial fibrosis (n = 127), or lung cancer (n = 1,397); and (4) coexisting severe liver dysfunction (n = 1,076), severe renal dysfunction (n = 1,097), or other malignancies (n = 881). After applying these exclusion criteria, 17,862 patients remained eligible. These eligible patients were subsequently randomly assigned in a 7:3 ratio to a training set (n = 12,503) and a validation set (n = 5,359) using stratified random sampling by CHD status to ensure balanced representation of the outcome in both sets. For patients with multiple hospitalizations during the study period, only the first admission was included to ensure independence of observations and to avoid potential data leakage between training and validation sets. Supplementary Figure 1 illustrates the patient selection and data partitioning workflow.
Study Definition
COPD was defined based on post-bronchodilator spirometry showing a forced expiratory volume in 1 second to forced vital capacity (FEV1/FVC) ratio of less than 0.70, in accordance with the Global Initiative for Chronic Obstructive Lung Disease (GOLD) guidelines, as documented in the EMR.21
The outcome of interest was coexisting CHD, defined as a history of myocardial infarction, percutaneous coronary intervention, coronary artery bypass grafting, or significant coronary artery stenosis (≥50%) documented by coronary angiography, based on electronic medical record documentation and discharge diagnoses.22 CHD diagnoses were identified using International Classification of Diseases, Tenth Revision (ICD-10) codes I20–I25. CHD was identified based on diagnoses present at admission or established during hospitalization; no post-discharge follow-up was conducted given the cross-sectional design.
Data Collection and Processing
Eligible patients were identified from the electronic medical records using ICD-10 codes for COPD as the primary or secondary discharge diagnosis, encompassing both patients admitted for acute exacerbation of COPD and those hospitalized for other reasons with coexisting COPD. The selection of candidate predictors was guided by prior literature on cardiovascular risk factors in COPD patients, as well as by the availability of routinely collected clinical variables in the electronic medical record system.23–25 The following clinical variables were included as potential predictors. Demographic and lifestyle data comprised age, gender, marital status, smoking history, drinking history, and surgical history. Comorbidities of interest included hypertension, diabetes, chronic gastritis, and hypokalemia. The selection of comorbidities was based on the most prevalent conditions in our cohort to ensure sufficient statistical power for each included comorbidity. Consequently, less prevalent but clinically relevant conditions such as dyslipidemia and chronic kidney disease were not prioritized for inclusion, despite their established associations with CHD in general populations. Hemodynamic measurements recorded were pulse rate, systolic blood pressure (SBP), and diastolic blood pressure (DBP). Laboratory parameters fell into several categories: lipid metabolism (total cholesterol (TC) and triglycerides (TG)), coagulation function (prothrombin time (PT), fibrinogen (FIB), and D-dimer (D-D)), complete blood cell counts (platelet (PLT), white blood cell (WBC), neutrophil (NEUT), lymphocyte (LYM), and monocyte (MONO)), inflammation (C-reactive protein (CRP)), hepatorenal function and metabolism (blood urea nitrogen (BUN), creatinine (CREA), uric acid (UA), direct bilirubin (DBIL), albumin (ALB), and prealbumin (PAB)), and electrolytes (potassium (K⁺) phosphorus (P), sodium (Na⁺), and calcium (Ca2⁺)). All laboratory measurements and hemodynamic parameters were obtained on the day of admission, prior to the initiation of any major therapeutic interventions, to ensure that these values reflected the baseline status rather than treatment effects.
To maximize data utilization, variables with more than 30% missing values were excluded prior to imputation. The excluded variables and their respective missing percentages are presented in Supplementary Table 1. For the remaining variables, missing data were imputed using a random forest (RF)-based approach. Importantly, imputation was performed separately within the training and validation sets after the 7:3 data split, rather than on the combined dataset, to prevent potential data leakage from the validation set into the training process. This method is advantageous for handling mixed‑type missing data, as it accommodates nonlinearities and interactions among variables and is potentially scalable to large‑scale data environments.26
ML Model Development
To minimize overfitting and identify the optimal set of predictors, we applied least absolute shrinkage and selection operator (LASSO) regression to reduce dimensionality among all candidate variables, without prior filtering by between-group differences.27 LASSO regression inherently performs its own regularization and variable selection; therefore, prior univariate screening was not used to avoid the potential loss of important variables. The optimal penalty coefficient λ was determined via ten‑fold cross‑validation based on the one‑standard‑error (1‑SE) criterion. Using the variables with non‑zero coefficients selected by LASSO, we then constructed nine ML models, namely extreme gradient boosting (XGBoost), K‑nearest neighbors (KNN), gradient boosting decision tree (GBDT), artificial neural network (ANN), RF, logistic regression (LR), decision tree (DT), support vector machine (SVM), and light gradient boosting machine (LightGBM). All ML models were trained using ten‑fold cross‑validation. For hyperparameter tuning, a grid search strategy coupled with ten‑fold cross‑validation was employed. To facilitate a more coherent interpretation of the model findings, we performed SHapley Additive exPlanations (SHAP) for visualization.28 This method was applied primarily to the best‑performing model in terms of predictive accuracy, with the individual contribution of each variable being calculated. Specifically, the SHAP value reflects the marginal contribution of a given feature to the predicted outcome: a positive value indicates that the feature increases the likelihood of a positive outcome, whereas a negative value suggests a reduced probability of such an outcome.
Performance Evaluation
All models were evaluated on both the training and validation cohorts. The performance metrics compared across models included the area under the receiver operating characteristic curve (AUC) with its 95% confidence interval (CI), sensitivity, specificity, F1 score, and Youden index. Sensitivity, specificity, F1 score, and Youden index were calculated using the optimal cutoff value determined by maximizing Youden index from the ROC curve. Formal comparisons between AUC values of different models were performed using DeLong’s test. Calibration curves were constructed to assess the agreement between the predicted probabilities and the observed prevalence of CHD. Calibration was assessed using the Hosmer-Lemeshow goodness-of-fit test and calibration slopes, with 95% confidence intervals (CIs). Furthermore, decision curve analysis (DCA) was performed to quantify the net benefit of each model across a range of threshold probabilities, based on the trade-off between anticipated gains and potential risks derived from the predictions.
Statistical Analysis
Due to the non-normal distribution of the data, continuous variables were summarized as medians with interquartile ranges and compared between groups using the Mann–Whitney U-test. Categorical variables were presented as counts (percentages) and analyzed using the chi-square test. All statistical analyses were conducted using R software (version 4.3.3) and SPSS software (version 26.0). A two-sided P value of less than 0.05 was considered statistically significant.
Prior to LASSO regression, we performed collinearity diagnostics by calculating the variance inflation factor (VIF) and its reciprocal, tolerance, for all candidate variables. A VIF below 5 or tolerance above 0.1 was considered indicative of no significant collinearity. Additionally, for the quantitative variables included, we constructed a correlation heatmap and computed correlation coefficients to assess the strength of associations among them. To explore the dose–response relationship between continuous variables (eg., age, pulse rate, DBP) and the risk of CHD, we employed restricted cubic spline (RCS) regression with three to five knots, adjusting for all other variables identified by LASSO.29 The optimal number of knots was determined based on the Akaike information criterion (AIC). Nonlinearity was formally tested, and the corresponding P-value for nonlinearity is reported.
No formal a priori sample size calculation was performed, as this was a retrospective analysis using all available eligible data. The final sample size of 17,862 patients provided sufficient events for model development and internal validation, with more than 10 events per candidate predictor.30 To assess the potential impact of missing data imputation, we conducted a sensitivity analysis comparing the results obtained from the imputed dataset with those from complete-case analysis (excluding patients with any missing values). Specifically, we re-trained all nine models using complete-case data and evaluated their performance on complete-case validation data, and compared these results with those obtained from the imputed training and validation sets.
Results
Patient Basic Clinical Characteristics
A total of 17,862 eligible middle‑aged and older patients with COPD were ultimately included in this study, of whom 7,211 (40.37%) had coexisting CHD. Among the 7,211 patients with coexisting CHD, the distribution of CHD subtypes was as follows: chronic ischemic heart disease (I25, n = 4,842, 67.15%), angina pectoris (I20, n = 1,156, 16.03%), acute myocardial infarction (I21, n = 634, 8.79%), and other ischemic heart diseases (I22–I24, n = 579, 8.03%). In the training set, the prevalence of CHD was 40.68% (5,087/12,503), and in the validation set, it was 39.54% (2,124/5,359). Although the training and validation sets were well balanced by stratification, the outcome distribution was moderately imbalanced (approximately 4:6 for CHD vs. non-CHD), which was considered in model evaluation. All enrolled patients were randomly assigned in a 7:3 ratio to a training set (n = 12,503) and a validation set (n = 5,359). With the exception of D‑D and PAB levels, which differed significantly between the two sets (P < 0.05), baseline characteristics were generally balanced between the training and validation sets, indicating a reasonable data split (Table 1). The median age of the overall population was 75 years (interquartile range: 69–81 years), and 78.38% of the patients were male. Regarding comorbidities, the prevalence rates of hypertension, diabetes mellitus, chronic gastritis, and hypokalemia were 43.95%, 19.00%, 16.58%, and 17.91%, respectively. For variables with a missing rate below 30%, missing data were imputed using a random forest method separately for the training and validation sets; detailed results are presented in Supplementary Tables 2 and 3. Except for a minor difference in CRP levels before and after imputation observed in the training set (P = 0.028), no statistically significant differences were found for any of the other variables in either dataset (P > 0.05), suggesting satisfactory imputation performance.
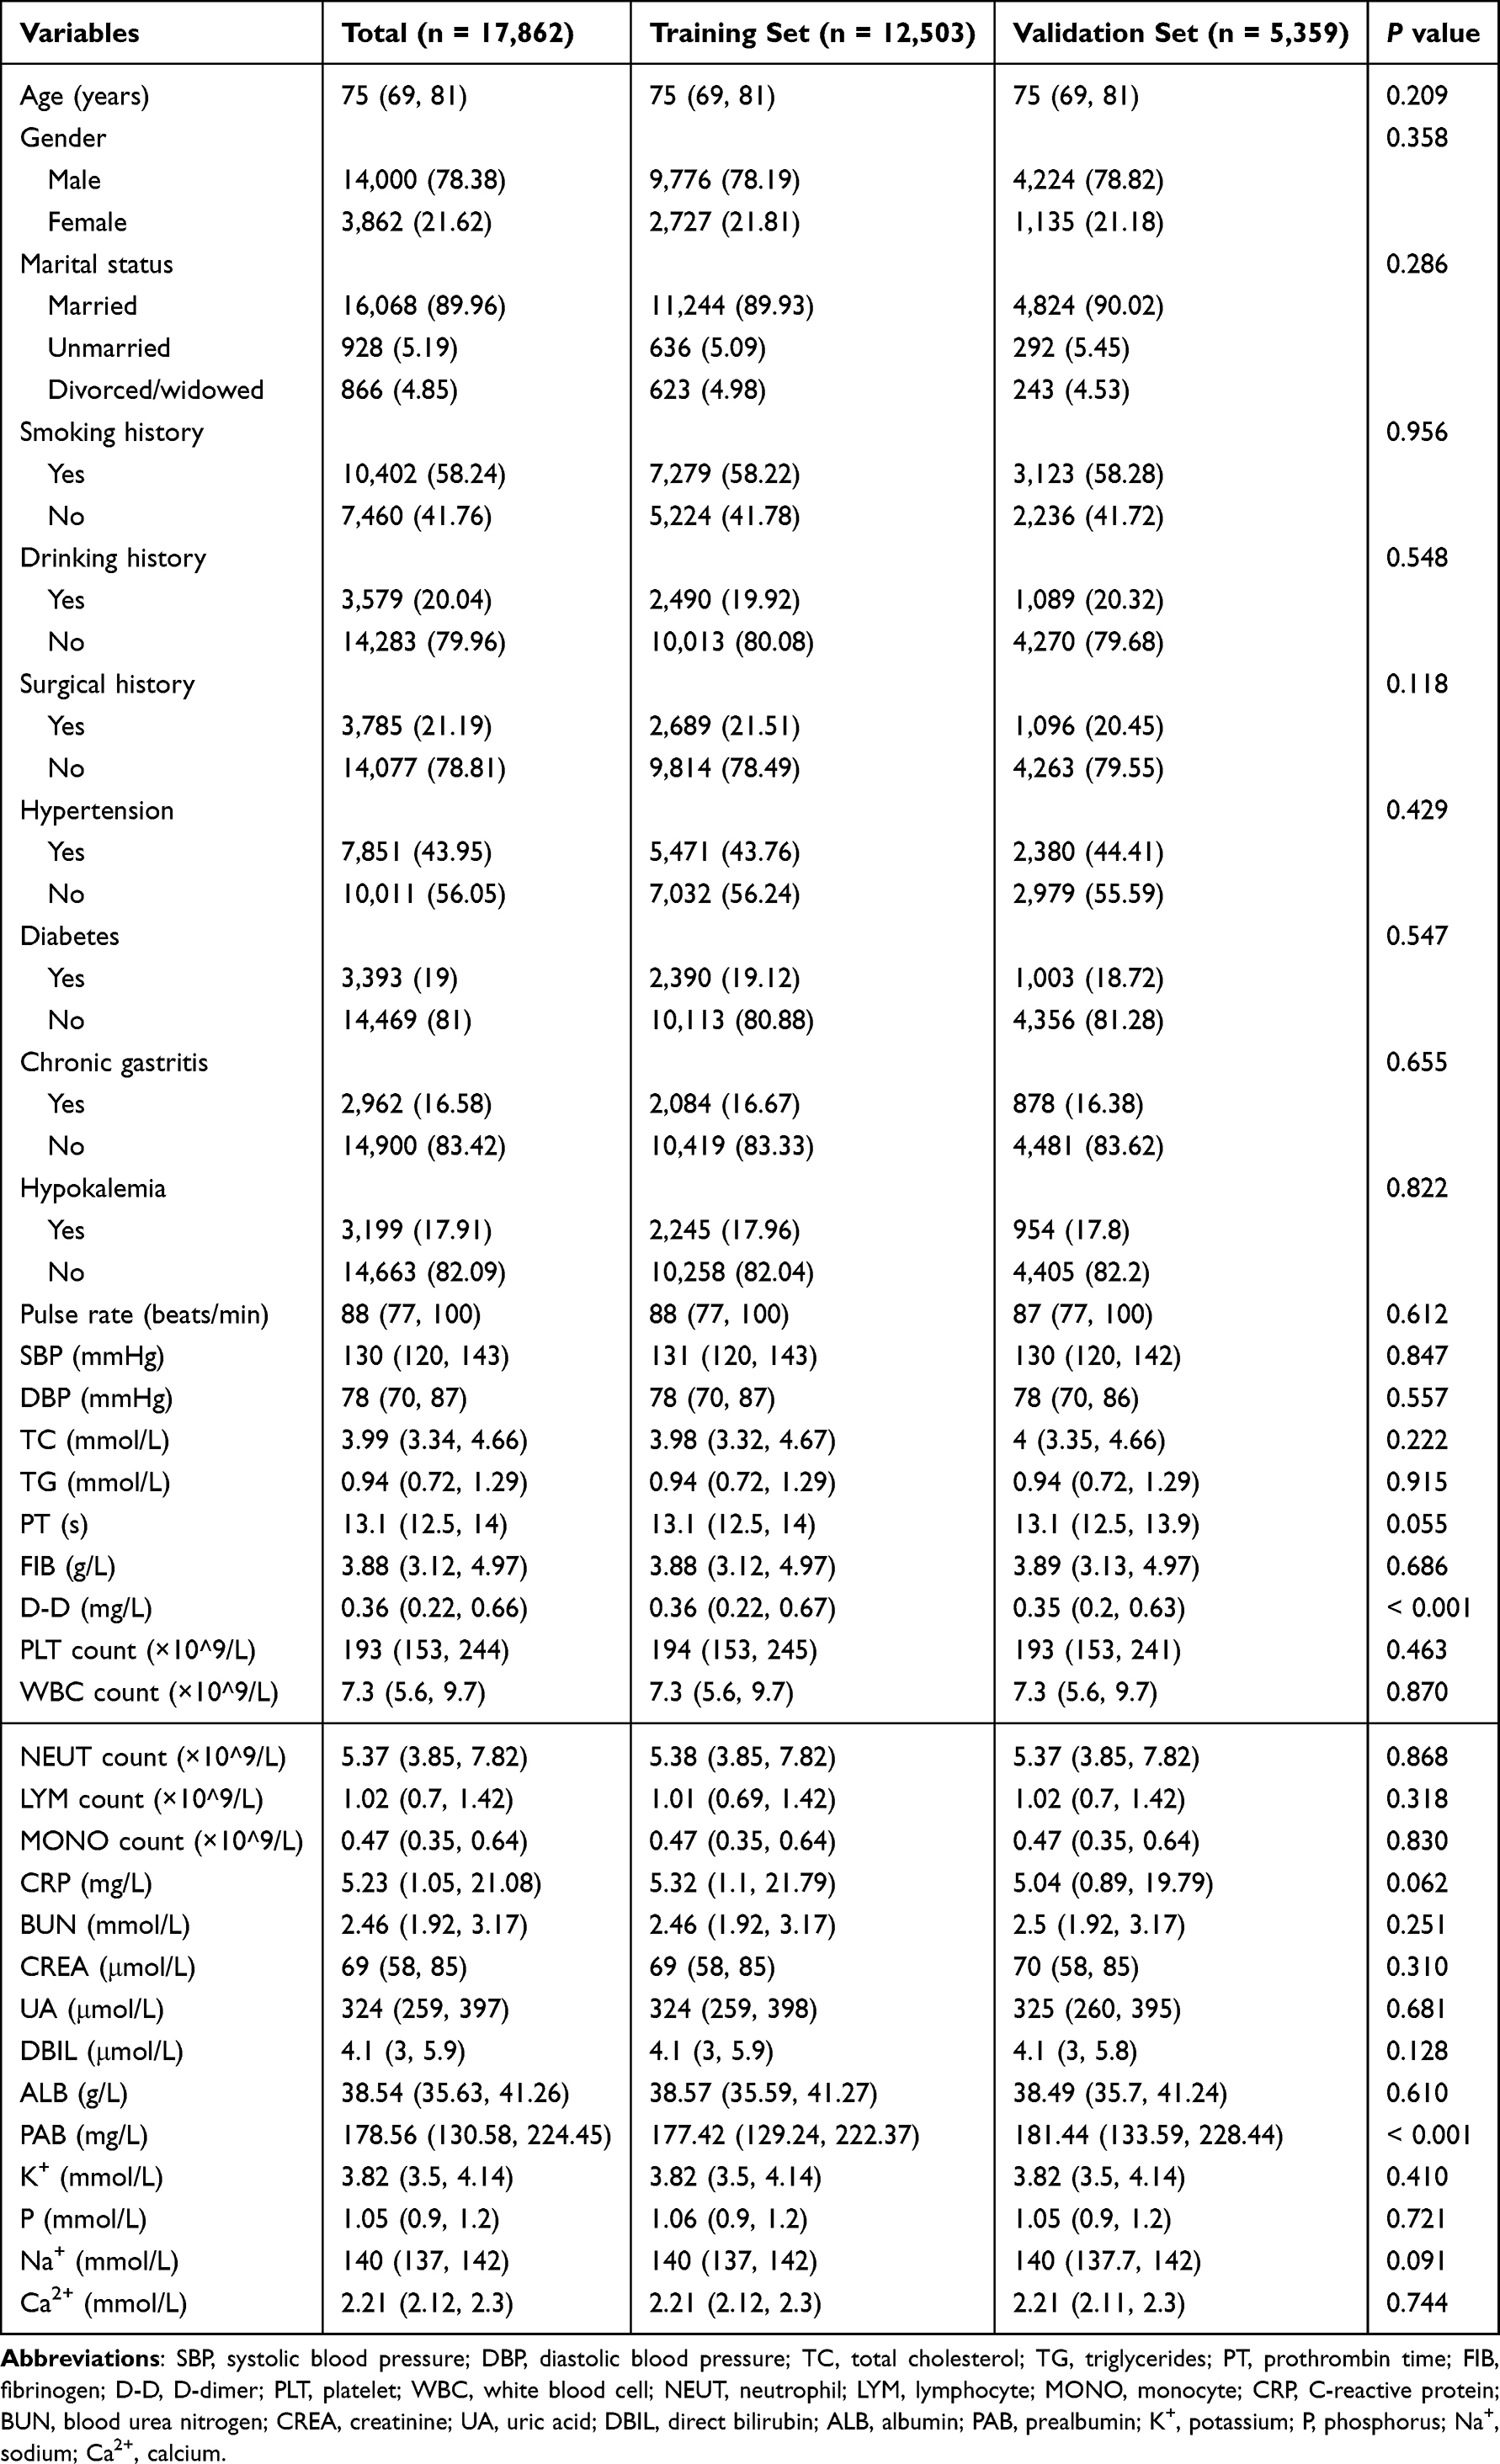 |
Table 1 Baseline Characteristics of the Training and Validation Sets |
Feature Selection and Collinearity Analysis
In the training set, all variables except TG (P = 0.490), MONO count (P = 0.051), PAB (P = 0.071), Na⁺ (P = 0.657), and Ca2⁺ (P = 0.883) showed significant differences between the CHD group and the non‑CHD group (P < 0.05) (Table 2). To assess the relationships among continuous variables and to detect potential multicollinearity prior to feature selection, we performed collinearity diagnostics on all candidate variables. Supplementary Table 4 presents the VIF and its reciprocal, tolerance, for each variable before and after exclusion of WBC count. The WBC count exhibited a VIF of 52.453, indicating significant collinearity, and was therefore excluded from further analysis. After excluding WBC count, the VIF values for all remaining variables were well below the commonly used threshold of 5 (range: 1.010 to 2.250), and tolerance values ranged from 0.445 to 0.990, all exceeding the threshold of 0.1, confirming the absence of significant multicollinearity. Then, we performed correlation analysis on the remaining continuous variables. As shown in Figure 1, the absolute values of Spearman correlation coefficients between the remaining continuous variables ranged from 0.00 to 0.59, with most pairs showing weak or moderate correlations. The strongest correlations were observed between CRP and FIB (r = 0.59), followed by SBP and DBP (r = 0.58), and ALB and PAB (r = 0.51). Subsequently, LASSO regression was applied to all candidate variables for feature selection. At the optimal penalty coefficient λ value (lambda.1se = 0.01289841), a total of sixteen variables with non‑zero coefficients were identified: age, gender, hypertension, diabetes, chronic gastritis, hypokalemia, pulse rate, DBP, TC, PT, FIB, PLT count, LYM count, UA, PAB, and P (Figure 2).
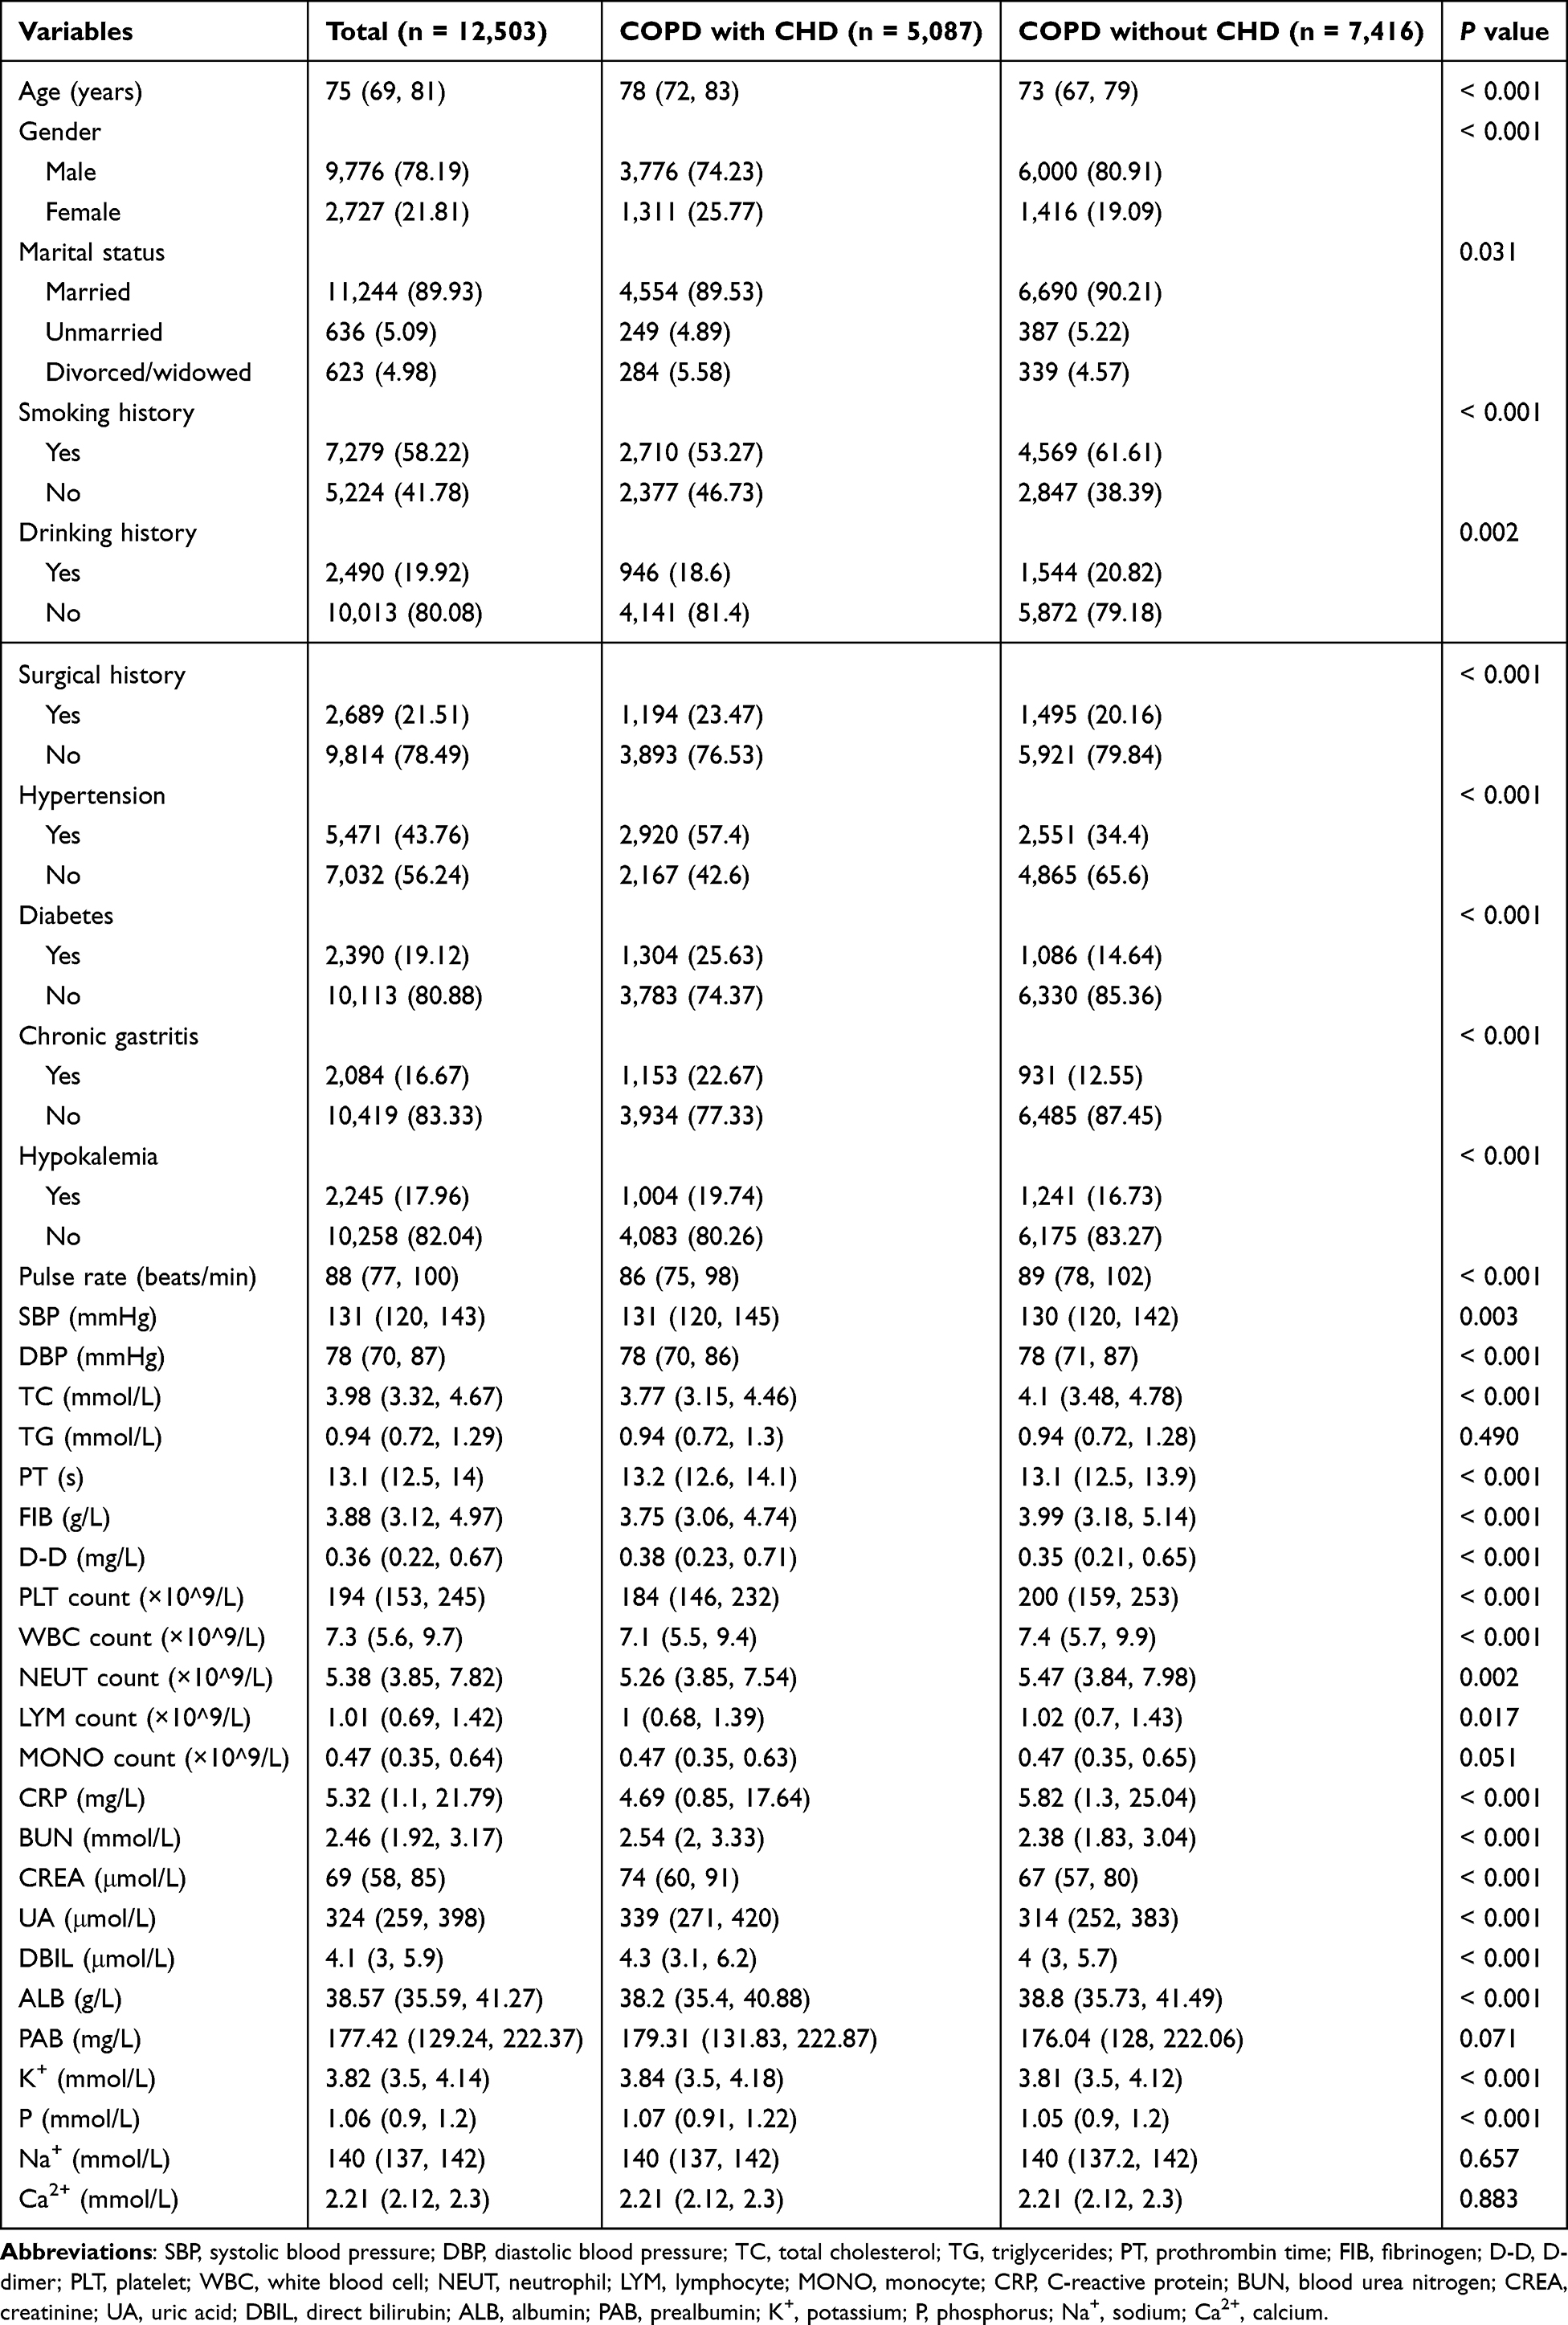 |
Table 2 Comparison of Variables Between CHD and Non-CHD Groups in the Training Set |
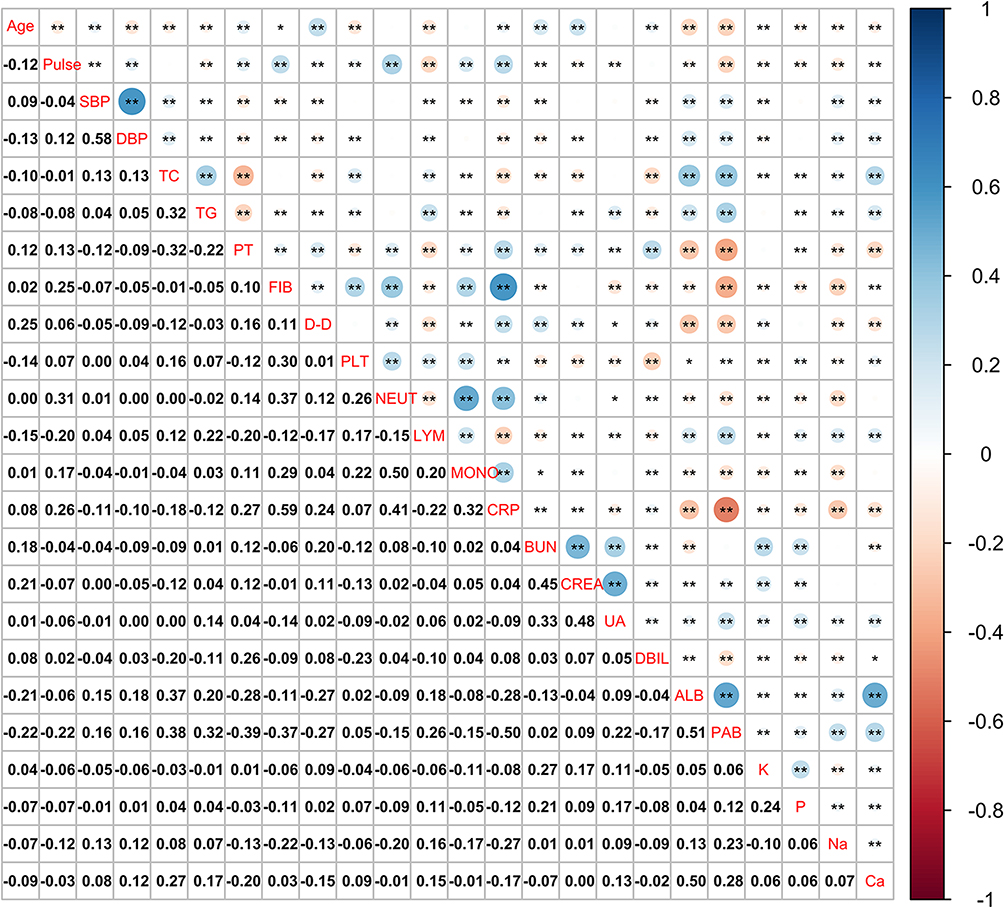 |
Figure 1 Correlation heatmap of continuous variables selected by LASSO. The color gradient represents the Spearman correlation coefficient (ρ), ranging from blue (positive correlation) to red (negative correlation). The numerical values within each cell indicate the correlation coefficient. Statistical significance levels are denoted as follows: * P < 0.05; ** P < 0.01. Blank cells indicate non-significant correlations (P ≥ 0.05). |
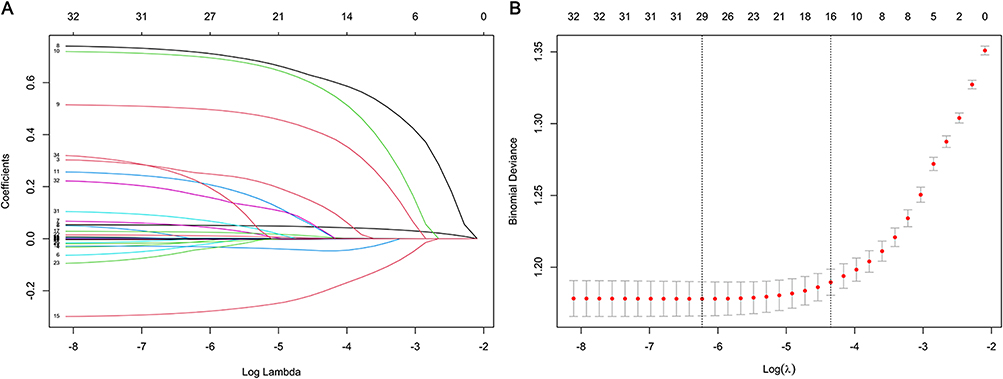 |
Figure 2 Variable selection via LASSO regression model. (A) LASSO coefficient shrinkage paths illustrating the selection dynamics of the sixteen retained predictors. Each trajectory represents the evolution of a variable’s coefficient as λ increases, highlighting the hierarchy of variable importance and demonstrating how regularization strength influences model parsimony. (B) Cross‑validation error plotted against the log‑transformed penalty parameter (λ) in the LASSO framework. Vertical dashed lines indicate two critical thresholds: the λ value that minimizes the cross‑validation error (left) and the λ value at one standard error from the minimum (right, lambda.1se = 0.01289841). |
Dose-Response Relationships of Continuous Variables
To explore the dose‑response relationship between the 11 continuous variables identified by LASSO and the risk of CHD, we performed RCS regression (Figure 3). The results revealed distinct patterns of association across the variables. Age demonstrated a predominantly increasing dose–response relationship (P for overall < 0.001; P for nonlinear = 0.003) with a subtle inflection point around 75 years. Pulse rate and DBP each exhibited a U‑shaped association (P for overall < 0.001 for both; P for nonlinear < 0.001 and 0.007, respectively). PT (linear positive; P for overall < 0.001; P for nonlinear = 0.342) and UA (linear positive; P for overall < 0.001; P for nonlinear = 0.785) showed linear positive associations. FIB presented a linear negative association (P for overall = 0.034; P for nonlinear = 0.745), whereas TC displayed a negative association that plateaued at higher levels (P for overall < 0.001; P for nonlinear < 0.001). PLT count showed an inverted U‑shaped association (P for overall < 0.001; P for nonlinear = 0.003). In contrast, LYM count revealed no clear dose‑response relationship (P for overall = 0.133; P for nonlinear = 0.205). PAB demonstrated a decreasing trend (P for overall < 0.001; P for nonlinear = 0.158), while P showed an increasing trend (P for overall = 0.017; P for nonlinear = 0.274).
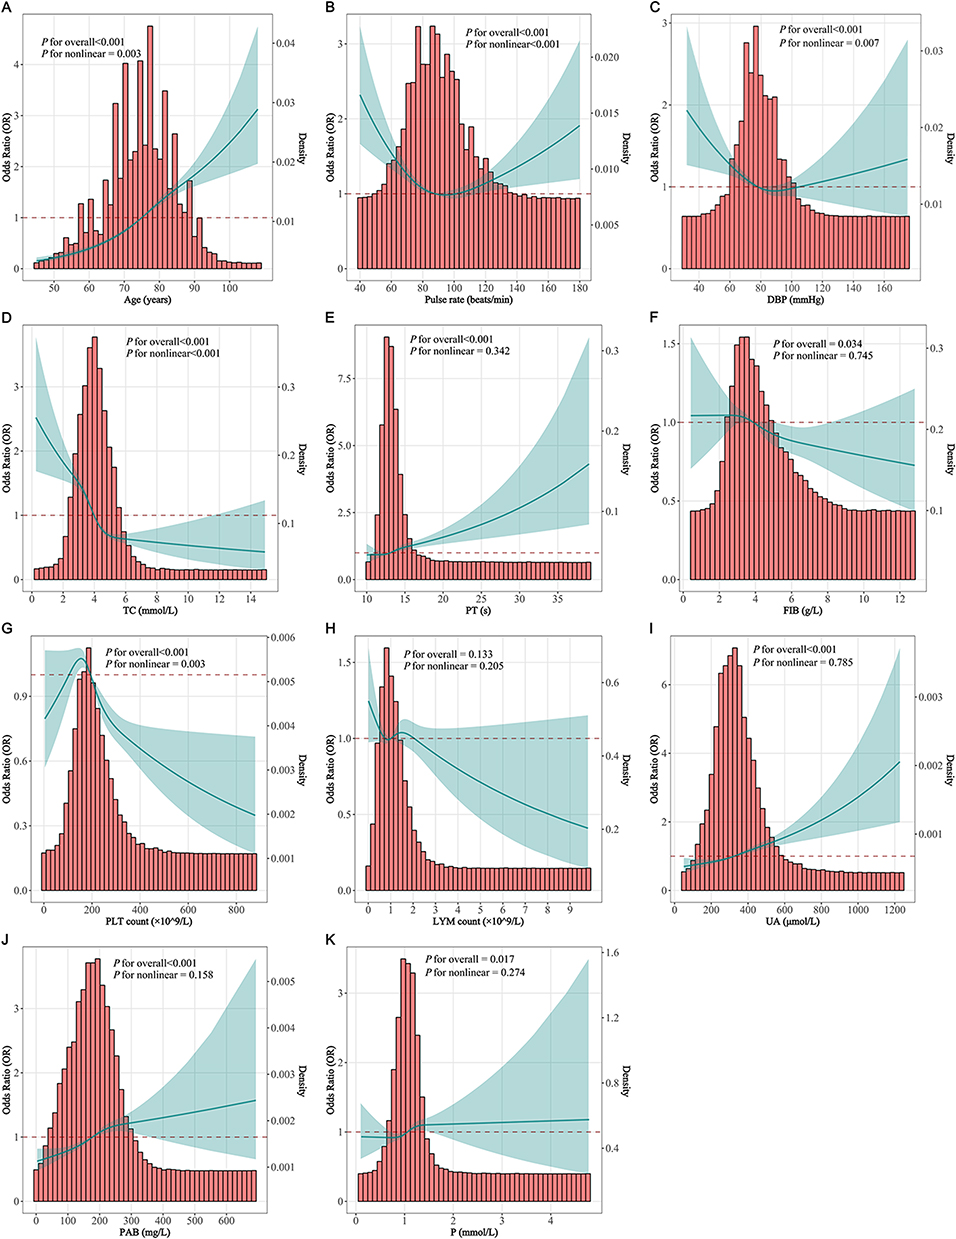 |
Figure 3 Restricted cubic spline (RCS) analysis for dose-response relationships. (A) Age; (B) Pulse rate; (C) DBP; (D) TC; (E) PT; (F) FIB; (G) PLT count; (H) LYM count; (I) UA; (J) PAB; (K) P. |
Models Development and Performance Evaluation
Based on the sixteen predictors identified by LASSO regression, we constructed nine ML models to predict the risk of CHD in middle‑aged and older patients with COPD. The predictive performance of each model was evaluated in both the training and validation sets. Figure 4 presents the AUC for the nine models in the two datasets. In addition, Tables 3 and 4 summarize four performance metrics—sensitivity, specificity, Youden index, and F1 score—for the training and validation sets, respectively. Among the nine models, XGBoost exhibited the highest AUC in both training and validation sets, with performance comparable to GBDT in the validation set. Specifically, the XGBoost model demonstrated moderate predictive performance (training AUC 0.871, 95% CI: 0.864–0.877; validation AUC 0.743, 95% CI: 0.730–0.756). The sensitivity values in the training and validation sets were 0.669 and 0.530, respectively, with corresponding specificity values of 0.883 and 0.805, F1 scores of 0.727 and 0.580, and Youden indices of 0.552 and 0.335. Formal comparison of AUC values using DeLong’s test revealed that XGBoost significantly outperformed all other models in the training set (all P < 0.001). In the validation set, XGBoost showed no statistically significant difference compared with GBDT (P = 0.104), but performed significantly better than the remaining seven models (all P < 0.05). The optimal hyperparameters of the XGBoost model are presented in Supplementary Table 5.
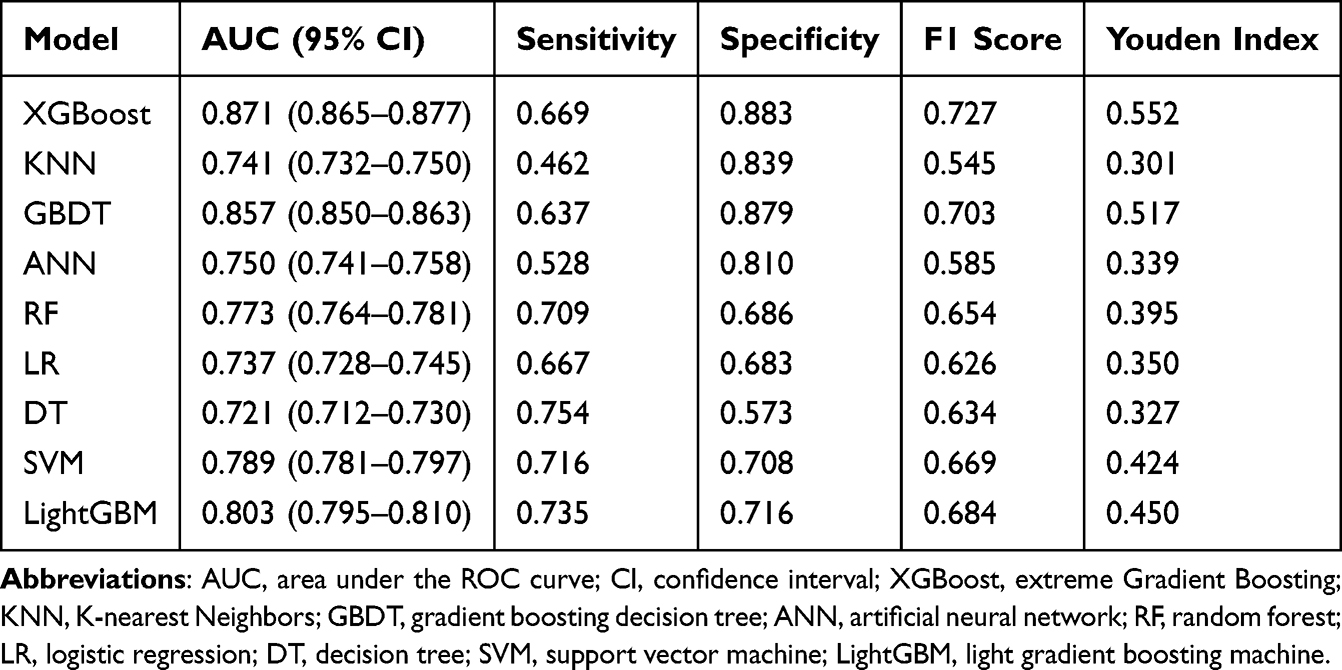 |
Table 3 Performance Metrics of Nine ML Models in the Training Set |
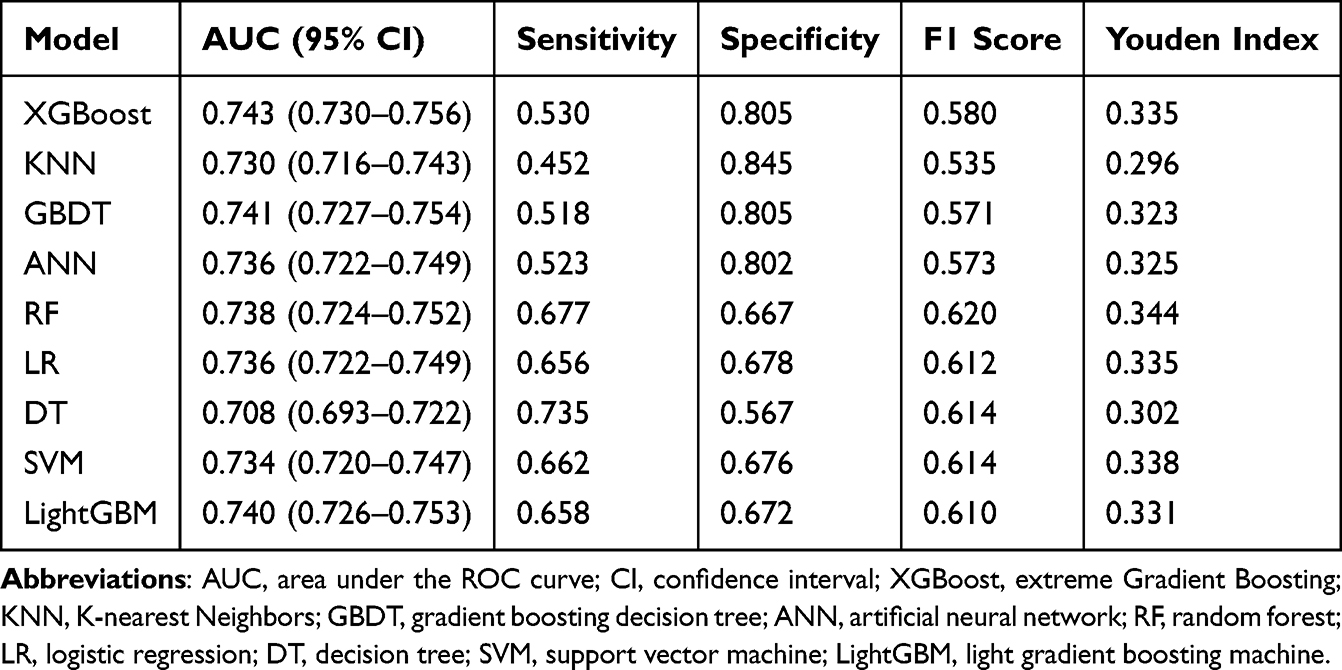 |
Table 4 Performance Metrics of Nine ML Models in the Validation Set |
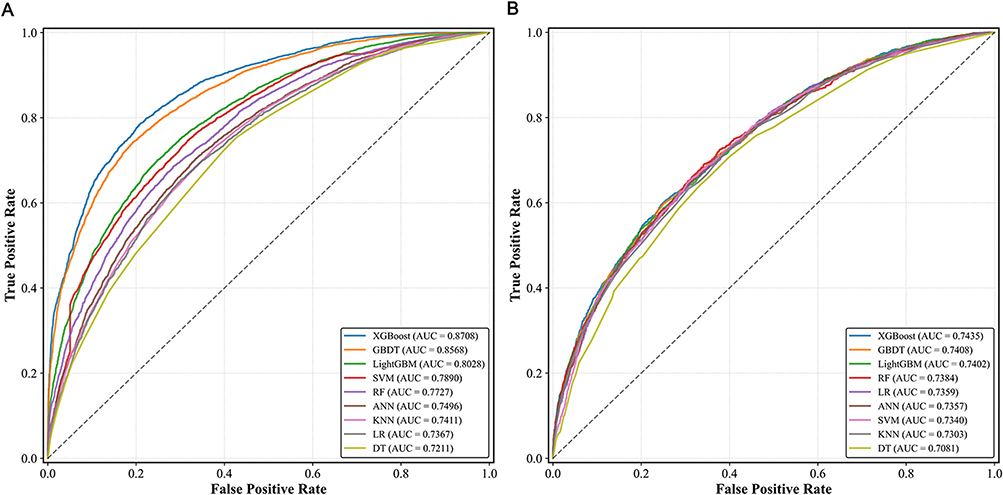 |
Figure 4 Area under the curve (AUC) of nine machine learning (ML) models in training and validation sets. (A) Training set; (B) Validation set. |
The calibration curve (Figure 5) demonstrated good agreement between predicted probabilities and observed outcomes for the XGBoost model, with a calibration intercept of −0.034 (95% CI: −0.095 to 0.026) and a calibration slope of 1.019 (95% CI: 0.947–1.093), indicating acceptable calibration in the validation set. The DCA (Figure 6) showed that the XGBoost model provided positive net benefit across a range of threshold probabilities (approximately 0.20–0.90), supporting its potential clinical utility as a screening tool. This threshold range was selected based on the clinically relevant spectrum where the net benefit of intervention outweighs the harms of unnecessary workup, consistent with previous DCA studies in cardiovascular risk prediction. For clinical application, a probability cutoff of approximately 0.42 (the optimal threshold maximizing the Youden index) was identified. Using this cutoff, the XGBoost model achieved a sensitivity of 0.530 and a specificity of 0.805. Clinicians may choose to adjust this threshold based on the relative costs of false-positive versus false-negative classifications in their specific practice setting.
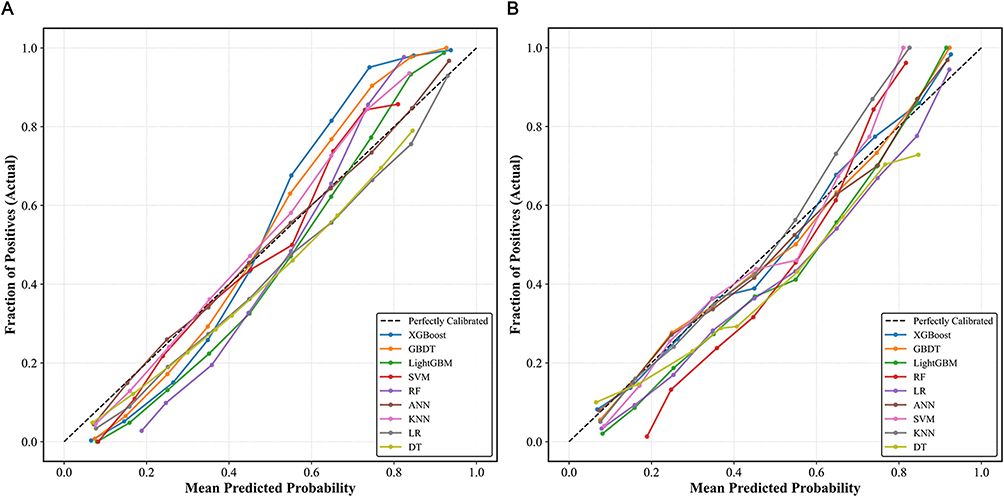 |
Figure 5 Calibration curves of nine machine learning (ML) models in training and validation sets. (A) Training set; (B) Validation set. |
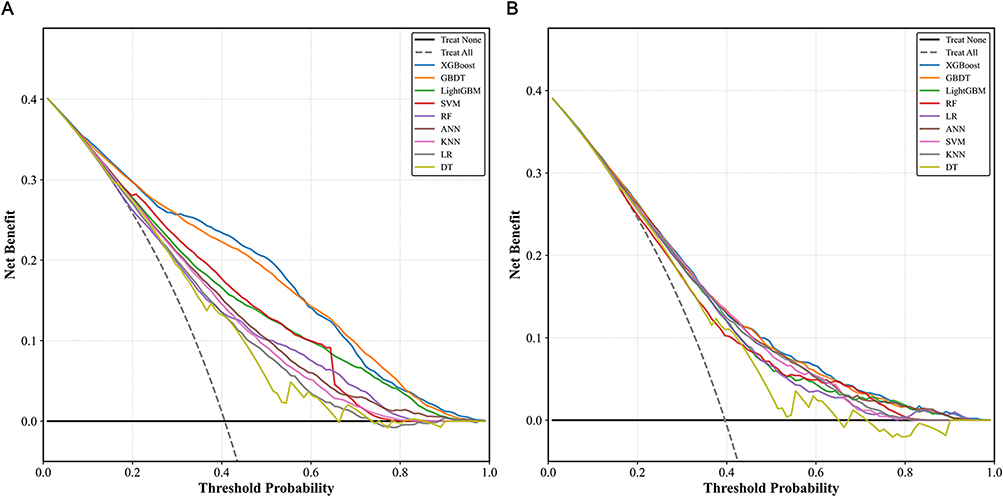 |
Figure 6 Decision curve analysis (DCA) of nine machine learning (ML) models in training and validation sets. (A) Training set; (B) Validation set. |
SHAP Values Evaluate Feature Importance
To enhance the interpretability of the XGBoost model and validate its predictive logic, we performed SHAP analysis (Figure 7). Figure 7A presents the variable importance ranking based on SHAP values, with the top five predictors being age, hypertension, TC, chronic gastritis, and UA. Figure 7B displays the SHAP summary plot, in which red and blue indicate high and low feature values, respectively. A positive SHAP value denotes a positive contribution to CHD risk, whereas a negative value indicates a negative contribution. Feature importance is reflected by the magnitude and horizontal dispersion of SHAP values; variables with greater absolute SHAP values and wider horizontal spread exert stronger influence on the model’s predictions. Specifically, age, hypertension, chronic gastritis, UA, and diabetes exerted positive effects on CHD risk, whereas TC, pulse rate, PLT count, DBP, and LYM count showed negative effects. Figure 7C further illustrates a SHAP force plot for a representative patient, detailing the direction and magnitude of each feature’s contribution to the individual prediction. To facilitate the clinical translation of the XGBoost model, we developed an interactive online web-based calculator that allows clinicians to input patient characteristics and obtain real-time individualized risk predictions for CHD comorbidity. The online tool is freely accessible at: https://copd-chd-risk.streamlit.app/.
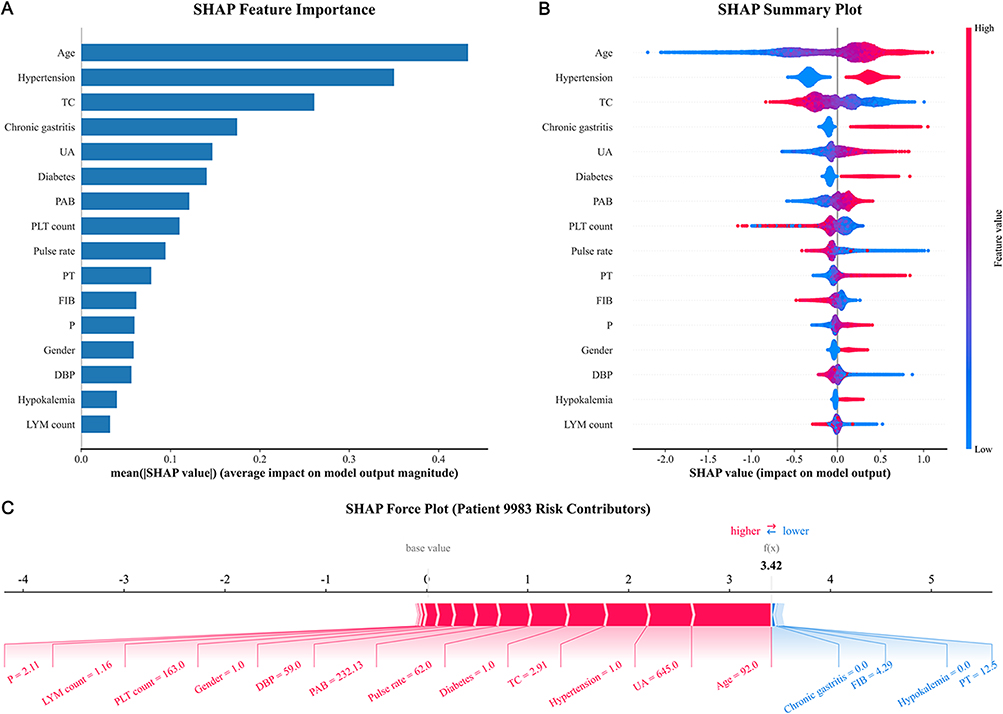 |
Figure 7 SHAP analysis of the XGBoost model. (A) SHAP-based feature importance bar chart; (B) Summary dot plot showing the relationship between feature values and SHAP contributions. Red and blue hues denote high and low feature values, respectively. SHAP values to the left of the vertical axis suppress CHD risk prediction, while those to the right enhance it; (C) Force plot for an example patient, providing a patient-level breakdown of how each feature contributes to the final risk prediction. |
Simplified Model Based on Top Five Predictors
To assess the feasibility of a more clinically accessible tool, we constructed a simplified XGBoost model using only the top five predictors identified by SHAP importance. In the training set, the simplified model achieved an AUC of 0.800 (95% CI: 0.791–0.807); in the validation set, it achieved an AUC of 0.722 (95% CI: 0.707–0.736), compared with 0.743 (95% CI: 0.730–0.756) for the full 16‑variable model (ΔAUC = −0.021). The simplified model showed a modest decrease in discriminative performance while retaining acceptable predictive ability for settings where comprehensive laboratory data are unavailable.
Sensitivity Analysis for Missing Data Imputation
To assess the robustness of the imputation procedure, we performed a sensitivity analysis comparing the performance of all nine models on the complete-case dataset (excluding patients with any missing values) versus the imputed dataset. The results were consistent across both approaches in both training and validation sets (Supplementary Table 6). In the training set, the AUC differences between complete-case and imputed models ranged from −0.021 to −0.002; in the validation set, the AUC differences ranged from −0.013 to −0.002. For the XGBoost model, the AUC was 0.862 in the complete-case training set and 0.734 in the complete-case validation set, compared with 0.871 and 0.743 in the imputed datasets, respectively.
Discussion
In this single‑center retrospective study of 17,862 middle‑aged and older patients with COPD, we developed and validated nine ML models for predicting the risk of coexisting CHD. Using LASSO regression, we identified sixteen key predictors spanning demographic characteristics, comorbidities, hemodynamic parameters, lipid metabolism, coagulation function, and inflammatory markers. Among the nine models, XGBoost achieved the highest AUC in both training (0.871) and validation (0.743) sets, with performance comparable to GBDT in the validation set. SHAP analysis further enhanced model interpretability, revealing age, hypertension, TC, chronic gastritis, and UA as the top five contributors to CHD risk.
Several recent studies have developed predictive models for cardiovascular comorbidity in COPD using traditional regression approaches, but they are often limited by small sample sizes or lack model interpretability.18,19,23 To our knowledge, this study is among the first to apply an ensemble of nine ML algorithms with SHAP-based interpretability and RCS-based dose-response analysis in a large COPD cohort of 17,862 patients. This framework captures complex nonlinear relationships and enables individualized risk decomposition at the patient level—features less accessible with traditional regression-based approaches. Although XGBoost did not show a statistically significant AUC advantage over GBDT in the validation set, its integration with SHAP provides practical value for personalized risk assessment and clinical decision-making. It is important to distinguish between association, classification, and prediction in the interpretation of our findings. The LASSO-selected predictors demonstrate statistical associations with CHD prevalence in this cross-sectional cohort; however, this does not imply that these factors can predict future CHD events. Our model provides a classification tool for identifying prevalent CHD at the time of hospitalization, rather than a longitudinal risk prediction tool for incident CHD. This distinction is critical for appropriately contextualizing the model’s clinical utility.
The comorbidity between COPD and CHD is rooted in multifaceted pathophysiological interactions, particularly systemic inflammation, oxidative stress, and endothelial dysfunction.31–33 Chronic inflammation in the airways can “spill over” into the systemic circulation, driving sustained elevations of pro‑inflammatory factors that promote atherosclerotic plaque formation and rupture.24 Oxidative stress impairs vascular endothelial function and increases arterial stiffness, while chronic hypoxia activates the hypoxia‑inducible factor pathway, alters hemodynamics, and promotes thrombogenesis.34,35 Moreover, the inflammatory storm accompanying acute exacerbations of COPD can rapidly deteriorate hemodynamic status and precipitate acute cardiac dysfunction.36 Collectively, these mechanisms constitute the pathological basis for the high prevalence of CHD in COPD patients and provide biological grounds for early risk identification.
Among the sixteen predictors selected by LASSO regression, several deserve specific discussion. Age emerged as the most influential predictor in the SHAP analysis, which aligns with the well‑established understanding that both COPD and CHD are age‑related diseases.4,37 The approximately linear positive dose‑response relationship (P for overall < 0.001; P for nonlinear = 0.002) indicates a continuously incremental effect of age on CHD risk. Hypertension, ranking second in importance, affected 43.95% of our cohort and is a well‑recognized modifiable risk factor for CHD.38 Chronic gastritis, present in 16.58% of patients, represents a relatively novel finding in the context of COPD-CHD prediction. While this variable is not a traditionally recognized risk factor for CHD, its association in our model may reflect unmeasured confounding rather than a direct biological effect. Specifically, chronic gastritis could serve as a proxy for long-term corticosteroid use (which is common in COPD management and may affect cardiovascular risk), proton pump inhibitor (PPI) use (which has been associated with cardiovascular events in some studies), or autonomic dysfunction affecting gastric motility.39 However, without detailed medication data in our EMR system, this interpretation remains speculative, and the finding should be interpreted with caution.
From a biological perspective, the identification of UA as a top predictor is mechanistically plausible. UA may promote oxidative stress and endothelial dysfunction, thereby contributing to atherosclerotic progression.40 Its linear positive association (P for nonlinear = 0.785) supports its role as a continuous risk factor for CHD in this population. Diabetes, affecting 19.00% of patients, further substantiates the metabolic burden in this population. FIB and PLT count—both inflammatory and coagulation markers—were retained in the final model, reinforcing the central role of systemic inflammation and hypercoagulability in linking COPD to CHD.41 Of note, TC exhibited a negative association with CHD risk in our analysis. This inverse association should be interpreted with caution, as it may reflect confounding by unmeasured factors such as statin use, disease-related malnutrition, or the systemic inflammatory state characteristic of advanced COPD, rather than a true biological protective effect. This phenomenon, often referred to as the “lipid paradox,” has been observed in various chronic disease populations.42 Similarly, the inverse association between FIB and CHD risk may be explained by reduced hepatic synthetic capacity in patients with severe malnutrition or cachexia, rather than a protective effect of lower fibrinogen itself.
RCS analysis revealed several clinically informative nonlinear dose‑response relationships. Both pulse rate and DBP exhibited U‑shaped associations with the risk of CHD. For pulse rate, the nadir of risk occurred at approximately 90–95 beats/min, with increasing risk at both lower and higher heart rates—a pattern consistent with previous epidemiological studies, although less well characterized in patients with COPD.43 This elevated nadir may reflect sympathetic overdrive, which is a hallmark of advanced COPD due to chronic hypoxia, hypercapnia, and systemic inflammation. Alternatively, it could be attributable to beta-blocker underuse in this population, as many clinicians may be hesitant to prescribe beta-blockers to COPD patients due to concerns about bronchospasm. The nadir may also be shifted upward by concomitant conditions such as pulmonary hypertension or right ventricular dysfunction. These possibilities warrant further investigation in prospective studies with detailed medication records. Regarding DBP, the risk increased steeply above 110 mmHg and moderately below 60 mmHg, underscoring the importance of avoiding both undertreatment and overtreatment of blood pressure in this vulnerable population.44 Age demonstrated an approximately linear positive association with a subtle inflection point around 75 years, which may reflect competing mortality risks. Both PT and UA showed linear positive associations, supporting their roles as continuous risk factors without clear thresholds. FIB presented a linear negative association. Although this finding may appear counterintuitive, it could be explained by the fact that severe malnutrition and cachexia in advanced COPD reduce hepatic synthetic capacity; thus, disease severity itself, rather than fibrinogen per se, may drive the observed inverse association.45 Collectively, these nonlinear patterns highlight the limitations of treating such variables as simple linear risk factors in traditional regression models and underscore a key advantage of ML approaches in capturing complex exposure‑response relationships.
We also acknowledge the performance gap between the training (AUC 0.871) and validation (AUC 0.743) sets, which suggests some degree of overfitting despite the use of ten-fold cross-validation and grid search for hyperparameter tuning. This further underscores the need for external validation in independent cohorts before any clinical deployment of the model. Additionally, we acknowledge the trade-off between sensitivity and specificity in the XGBoost model. The high specificity (0.805) and relatively lower sensitivity (0.530) in the validation set mean that while the model correctly identifies most non-CHD patients, it misses approximately 47% of true CHD cases at the optimal cutoff. In a screening context, this trade-off may be acceptable if the priority is to avoid over-referral; however, a lower threshold could be selected to improve sensitivity at the cost of reduced specificity, depending on the clinical setting and the relative costs of false-positive versus false-negative classifications. Therefore, the choice of operating threshold should be guided by the specific clinical context and resource availability.
ML is increasingly recognized as a transformative tool in clinical risk prediction.46 In this study, the XGBoost model outperformed nine alternative algorithms, achieving an AUC of 0.743 in the validation cohort. Given the substantial clinical heterogeneity inherent to patients with COPD and the multifactorial, intertwined nature of CHD risk, this discriminative performance—while not exceptional—reaches a practical threshold sufficient to inform clinical decision-making. Nevertheless, translating ML models into routine clinical practice faces multiple challenges, among which the “black box” nature of complex algorithms has long been a critical barrier limiting clinicians’ trust and adoption.47 By introducing the SHAP analysis framework, this study addresses the interpretability issue from two complementary perspectives: global-level variable importance ranking and individual-level risk decomposition for single patients. The former reveals the marginal contributions of key factors such as age and hypertension, whereas the latter quantifies the directional effects of specific features on an individual patient’s risk score. This paradigm shift—from algorithmic opacity to decision transparency—not only enhances the explainability and clinical credibility of model outputs but also provides methodological support for the practical deployment of ML tools in real-world healthcare settings. While SHAP analysis substantially enhances model interpretability by quantifying the marginal contribution of each feature to individual predictions, it does not overcome inherent limitations in study design, including the cross-sectional nature of the data, the timing of predictor and outcome ascertainment, or the absence of external validation. SHAP should be viewed as a complementary tool for understanding model behavior rather than a substitute for rigorous prospective validation.
Several limitations of this study should be acknowledged. This study is a cross-sectional analysis examining CHD prevalence at the time of hospitalization for COPD. Consequently, CHD events occurring after discharge were not captured, and the temporal relationship between predictor variables and CHD outcome cannot be established with certainty. This design limitation means that our model should be interpreted as a classification tool for prevalent CHD rather than a predictive tool for incident CHD. Future longitudinal studies with prospective follow-up are needed to evaluate whether the identified predictors can truly forecast future CHD events. First, the data were derived from a single center, which may limit the generalizability of our findings to broader populations. External validation using independent multi‑center cohorts is warranted to confirm the robustness of the proposed model before any clinical application. Additionally, it is possible that some patients without a recorded CHD diagnosis may not have undergone appropriate diagnostic testing, resulting in undetected CHD and potential misclassification bias. This limitation should be considered when interpreting the findings. Second, the retrospective design introduces inherent biases, including potential selection bias and unmeasured confounding. Third, despite the inclusion of comprehensive clinical variables, certain potentially relevant predictors—such as smoking pack‑years, detailed medication history, and imaging biomarkers (eg., coronary artery calcium score)—were not available in the EMR system and thus could not be incorporated into the models. In addition, although comorbidities such as dyslipidemia and chronic kidney disease have well-established associations with CHD, they were not included in the final model due to their low prevalence in our cohort (7.64% and 3.08%, respectively), which limited statistical power for stable estimation. Their absence may affect the model’s generalizability to populations where these conditions are more common. Fourth, the imputation of missing data, although performed using a robust RF method, may still introduce some degree of bias. Finally, the optimal threshold for clinical deployment of the XGBoost model requires further calibration in prospective studies. Future research should focus on external validation, integration of additional biomarkers, and development of user‑friendly clinical decision support tools.
Conclusions
This study developed and internally validated an XGBoost‑based ML classification model for identifying coexisting CHD in middle‑aged and older patients with COPD using cross‑sectional, single‑center data. The model integrates demographic characteristics, comorbidities, and routine laboratory parameters, demonstrating moderate discriminative ability and acceptable calibration in the validation set, with interpretable risk prediction through SHAP analysis. However, further work is needed before clinical application: external validation in geographically distinct, multi‑center prospective cohorts is essential to confirm generalizability; patient‑level data independence should be confirmed in future studies; and the added clinical value of the model beyond LR and routine clinical assessment remains to be determined. The model should not be used for personalized intervention strategies or widespread implementation at this stage.
Data Sharing Statement
The datasets used and/or analyzed in the current study are available from the corresponding authors upon reasonable request.
Ethics Approval and Consent to Participate
Approval for this study was obtained from the Ethics Committee of the Affiliated Banan Hospital of Chongqing Medical University (approval number: BNLL-KY-2026-016). Because the study employed a retrospective design, informed consent in written form was not deemed necessary, and this requirement was formally waived by the ethics committee. The entire study was conducted in strict observance of the ethical standards set forth in the Declaration of Helsinki (1964) as well as its subsequent amendments. Furthermore, all methodologies and procedures strictly conformed to pertinent ethical guidelines and statutory regulations.
Acknowledgments
We extend our heartfelt gratitude to all the participants and investigators involved in this project for their invaluable contributions to data collection.
Author Contributions
All authors made a significant contribution to the work reported, whether that is in the conception, study design, execution, acquisition of data, analysis and interpretation, or in all these areas; took part in drafting, revising or critically reviewing the article; gave final approval of the version to be published; have agreed on the journal to which the article has been submitted; and agree to be accountable for all aspects of the work.
Funding
There is no funding to report.
Disclosure
All authors declare no conflicts of interest in this work.
References
1. Xu J, Zeng Q, Li S, Su Q, Fan H. Inflammation mechanism and research progress of COPD. Front Immunol. 2024;15:1404615. doi:10.3389/fimmu.2024.1404615
2. Celli BR, Christenson SA, Rabe KF, et al. Current smoker: a clinical chronic obstructive pulmonary disease phenotype affecting disease progression and response to therapy. Am J Respir Crit Care Med. 2025;211(5):729–19. doi:10.1164/rccm.202407-1379CI
3. MMd O, Padilla RP, Celli B, et al. The global burden of COPD: epidemiology and effect of prevention strategies. Lancet Respir Med. 2025;13(8):709–724. doi:10.1016/S2213-2600(24)00339-4
4. Xu J, Xu H, Zhang D, et al. Global, regional and national trends in burden of chronic obstructive pulmonary disease from 2000 to 2021 and the prediction for 2030. Chron Respir Dis. 2026;23:14799731261432520. doi:10.1177/14799731261432520
5. Almagro P, Soler-Cataluña JJ, Huerta A, González-Segura D, Cosío BG, Investigators CS. Impact of comorbidities in COPD clinical control criteria. The CLAVE study. BMC Pulm Med. 2024;24(1):6. doi:10.1186/s12890-023-02758-0
6. Agustí A, Celli BR, Criner GJ, et al. Global initiative for chronic obstructive lung disease 2023 report: GOLD executive summary. Eur Respir J. 2023;61(4):2300239. doi:10.1183/13993003.00239-2023
7. Chen S, Li X, Xie R. Genetic architecture of comorbidity between chronic obstructive pulmonary disease and cardiovascular diseases: exploring shared mechanisms and potential therapeutic targets. Int J Chron Obstruct Pulmon Dis. 2026;21:572586. doi:10.2147/COPD.S572586
8. Bian H, Qian H, Zhu S, et al. Nomogram model for identifying the risk of coronary heart disease in patients with chronic obstructive pulmonary disease based on deep learning radiomics and clinical data: a multicenter study. Int J Chron Obstruct Pulmon Dis. 2025;20:3045–3057. doi:10.2147/COPD.S539307
9. Zhang Y, Zhu P, Gao D, et al. Joint associations of sleep patterns and genetic susceptibility with dynamic transitions of chronic obstructive pulmonary disease and coronary heart disease and the mediating role of inflammatory biomarkers and metabolites. J Am Heart Assoc. 2026;15(8):e046469. doi:10.1161/JAHA.125.046469
10. Cobb K, Kenyon J, Lu J, et al. COPD is associated with increased cardiovascular disease risk independent of phenotype. Respirology. 2024;29(12):1047–1057. doi:10.1111/resp.14799
11. Li Y, Li F, Wang G, Zeng Q, Xie P. Additive impact of chronic obstructive pulmonary disease (COPD) and cardiovascular disease(CVD) on all-cause and disease-specific mortality: a longitudinal nationwide population-based study. BMC Pulm Med. 2025;25(1):275. doi:10.1186/s12890-025-03688-9
12. Chen H, Luo X, Du Y, et al. Association between chronic obstructive pulmonary disease and cardiovascular disease in adults aged 40 years and above: data from NHANES 2013–2018. BMC Pulm Med. 2023;23(1):318. doi:10.1186/s12890-023-02606-1
13. Luo Y, Wang F, Zeng X, et al. Prevalence of chronic obstructive pulmonary disease in adults aged 40 years and older in China from 2014 to 2024: a systematic review and meta-analysis. Asia Pac J Public Health. 2025;37(5):467–481. doi:10.1177/10105395251329194
14. Szalontai K, Gémes N, Furák J, et al. Chronic obstructive pulmonary disease: epidemiology, biomarkers, and paving the way to lung cancer. J Clin Med. 2021;10(13):2889. doi:10.3390/jcm10132889
15. Mridha K, Kuri AC, Saha T, Shukla M. SmartHeart: a conceptual framework for explainable machine learning in cardiovascular risk prediction. Comput Biol Med. 2025;198(Pt B):111221. doi:10.1016/j.compbiomed.2025.111221
16. Sheetal, Deora SS, Haq IU, Rufai SZ, Kumar A. Evaluating machine learning models for cardiovascular disease prediction: balancing accuracy and minority class detection. Arch Comput Method E. 2026;33:2451–2469. doi:10.1007/s11831-025-10383-9
17. Lei M, Liu X, Cheng L, et al. An ensemble machine learning-based risk stratification tool for 30-day mortality prediction in critically ill cardiovascular patients. Cardiovasc Diabetol. 2025;24(1):373. doi:10.1186/s12933-025-02911-5
18. Chen Z, Li H, Cai Y, et al. Development and validation of a nomogram prediction model for cardiovascular comorbidities in COPD patients based on hypertension. Front Med. 2026;13:1766827. doi:10.3389/fmed.2026.1766827
19. Yuan Y, Zhu J, Zhao X, et al. Development and interpretable machine learning-based prediction of cardiovascular disease risk in Chinese COPD patients: an analysis of the CHARLS database. Int J Chron Obstruct Pulmon Dis. 2026;21:590631. doi:10.2147/COPD.S590631
20. Lin X, Zhou T, Ni J, et al. CT-Based radiomics nomogram of lung and mediastinal features to identify cardiovascular disease in chronic obstructive pulmonary disease: a multicenter study. BMC Pulm Med. 2025;25(1):121. doi:10.1186/s12890-025-03568-2
21. Singh D, Stockley R, Anzueto A, et al. GOLD science committee recommendations for the use of pre- and post-bronchodilator spirometry for the diagnosis of COPD. Eur Respir J. 2024;65(2):2401603. doi:10.1183/13993003.01603-2024
22. Thygesen K, Alpert JS, Jaffe AS, et al. Fourth universal definition of myocardial infarction (2018). Glob Heart. 2018;13(4):305–338. doi:10.1016/j.gheart.2018.08.004
23. Sun F, Ye M, Jumahan A, Aainiwaier A, Xia Y. MHR as a promising predictor for coronary artery disease in COPD patients: insights from a retrospective nomogram study. Respir Med. 2025;239:107993. doi:10.1016/j.rmed.2025.107993
24. Ragnoli B, Chiazza F, Tarsi G, Malerba M. Biological pathways and mechanisms linking COPD and cardiovascular disease. Ther Adv Chronic Dis. 2025;16:20406223251314286. doi:10.1177/20406223251314286
25. Chen W, Thomas J, Sadatsafavi M, FitzGerald JM. Risk of cardiovascular comorbidity in patients with chronic obstructive pulmonary disease: a systematic review and meta-analysis. Lancet Respir Med. 2015;3(8):631–639. doi:10.1016/S2213-2600(15)00241-6
26. Tang F, Ishwaran H. Random forest missing data algorithms. Stat Anal Data Min. 2017;10(6):363–377. doi:10.1002/sam.11348
27. Wang J, Xu Y, Liu L, et al. Comparison of LASSO and random forest models for predicting the risk of premature coronary artery disease. BMC Med Inform Decis Mak. 2023;23(1):297. doi:10.1186/s12911-023-02407-w
28. Sadhukhan B, Gupta P, Narayan A, Mourya AK, Kumar S. Empowering coronary heart disease diagnosis: a comprehensive analysis of machine learning models on clinical data with explainable AI insights. Multimed Tools Appl. 2025;84(31):37815–37844. doi:10.1007/s11042-025-20974-0
29. Zhang B, Ma D, Pei Z, Ren Q, Qiu J. Relationship between dynamic changes in remnant cholesterol and cardiovascular disease in middle-aged and older Chinese: a national cohort study. Front Cardiovasc Med. 2025;12:1503705. doi:10.3389/fcvm.2025.1503705
30. Peduzzi P, Concato J, Kemper E, Holford TR, Feinstein AR. A simulation study of the number of events per variable in logistic regression analysis. J Clin Epidemiol. 1996;49(12):1373–1379. doi:10.1016/s0895-4356(96)00236-3
31. JdM D, Villota JN, Pérez SS, et al. Multidisciplinary management of patients with chronic obstructive pulmonary disease and cardiovascular disease. Arch Bronconeumol. 2024;60(4):226–237. doi:10.1016/j.arbres.2024.01.013
32. Xing K, Tan C, Cheng X, Jiang F. Evaluation of the impact of cardiopulmonary rehabilitation exercise training on cardiopulmonary function in patients with chronic obstructive pulmonary disease complicated by unstable angina pectoris using a hierarchical deep learning CT image model. Front Physiol. 2026;17:1735687. doi:10.3389/fphys.2026.1735687
33. Maeda T, Dransfield MT. Chronic obstructive pulmonary disease and cardiovascular disease: mechanistic links and implications for practice. Curr Opin Pulm Med. 2024;30(2):141–149. doi:10.1097/MCP.0000000000001040
34. Marcuccio G, Candia C, Maniscalco M, Ambrosino P. Endothelial dysfunction in chronic obstructive pulmonary disease: an update on mechanisms, assessment tools and treatment strategies. Front Med. 2025;12:1550716. doi:10.3389/fmed.2025.1550716
35. Myronenko O, Foris V, Crnkovic S, et al. Endotyping COPD: hypoxia-inducible factor-2 as a molecular “switch” between the vascular and airway phenotypes? Eur Respir Rev. 2023;32(167):220173. doi:10.1183/16000617.0173-2022
36. Kar T, Qadri SM, Altaf J, et al. Echocardiographic changes in chronic obstructive pulmonary disease exacerbations: a systematic review of pre- and post-treatment findings. Cureus. 2025;17(8):e89985. doi:10.7759/cureus.89985
37. Colantonio LD, Bittner V. Cardiovascular risk prediction in older adults. Curr Atheroscler Rep. 2025;27(1):88. doi:10.1007/s11883-025-01339-2
38. Yang C, Sui J, Jin J, Yu R. Associations between the atherogenic index of plasma and coronary heart disease in hypertensive patients: results from NHANES 2005–2018. BMC Cardiovasc Disord. 2025;25(1):738. doi:10.1186/s12872-025-05214-5
39. Zhang W, Yuan Z, Zhou J. Association between proton pump inhibitor use and the risk of myocardial infarction: a cross-sectional study based on NHANES 2007 to 2018. Medicine. 2025;104(35):e44030. doi:10.1097/MD.0000000000044030
40. Ko J, Kang H-J, Kim D-A, et al. Uric acid induced the phenotype transition of vascular endothelial cells via induction of oxidative stress and glycocalyx shedding. FASEB J. 2019;33(12):13334–13345. doi:10.1096/fj.201901148R
41. Kyriakopoulos C, Gogali A, Kostikas K, Konstantinidis A. Hypercoagulable state in COPD-A comprehensive literature review. Diagnostics. 2021;11(8):1447. doi:10.3390/diagnostics11081447
42. Zeng G, Zhang C, Song Y, et al. The potential impact of inflammation on the lipid paradox in patients with acute myocardial infarction: a multicenter study. BMC Med. 2024;22(1):599. doi:10.1186/s12916-024-03823-z
43. Tian J, Yuan Y, Shen M, et al. Association of resting heart rate and its change with incident cardiovascular events in the middle-aged and older Chinese. Sci Rep. 2019;9(1):6556. doi:10.1038/s41598-019-43045-5
44. Filippone EJ, Foy AJ, Naccarelli GV. The diastolic blood pressure J-curve revisited: an update. Am Heart J Plus. 2021;12:100065. doi:10.1016/j.ahjo.2021.100065
45. Hu C, Song B, Liu X, Sun L, Li M, He X. The association between COPD, acute exacerbations of COPD, and Survival in COPD, with fat-free body mass index: a systematic review and meta-analysis. Int J Chron Obstruct Pulmon Dis. 2025;20:2589–2600. doi:10.2147/COPD.S526194
46. Sadr H, Nazari M, Khodaverdian Z, et al. Unveiling the potential of artificial intelligence in revolutionizing disease diagnosis and prediction: a comprehensive review of machine learning and deep learning approaches. Eur J Med Res. 2025;30(1):418. doi:10.1186/s40001-025-02680-7
47. Grammenos G, Vrahatis AG, Lazaros K, Exarchos TP, Vlamos P, Krokidis MG. AI agents in Alzheimer’s disease management: challenges and future directions. Front Aging Neurosci. 2026;17:1735892. doi:10.3389/fnagi.2025.1735892
 © 2026 The Author(s). This work is published and licensed by Dove Medical Press Limited. The
full terms of this license are available at https://www.dovepress.com/terms
and incorporate the Creative Commons Attribution
- Non Commercial (unported, 4.0) License.
By accessing the work you hereby accept the Terms. Non-commercial uses of the work are permitted
without any further permission from Dove Medical Press Limited, provided the work is properly
attributed. For permission for commercial use of this work, please see paragraphs 4.2 and 5 of our Terms.
© 2026 The Author(s). This work is published and licensed by Dove Medical Press Limited. The
full terms of this license are available at https://www.dovepress.com/terms
and incorporate the Creative Commons Attribution
- Non Commercial (unported, 4.0) License.
By accessing the work you hereby accept the Terms. Non-commercial uses of the work are permitted
without any further permission from Dove Medical Press Limited, provided the work is properly
attributed. For permission for commercial use of this work, please see paragraphs 4.2 and 5 of our Terms.
Recommended articles

Predicting Superaverage Length of Stay in COPD Patients with Hypercapnic Respiratory Failure Using Machine Learning
Zuo B, Jin L, Sun Z, Hu H, Yin Y, Yang S, Liu Z
Journal of Inflammation Research 2025, 18:5993-6008
Published Date: 8 May 2025
Identifying Common Diagnostic Biomarkers and Therapeutic Targets between COPD and Sepsis: A Bioinformatics and Machine Learning Approach
Li X, Xiao Y, Yang M, Zhang X, Yuan Z, Zhang Z, Zhang H, Liu L, Zhao M
International Journal of Chronic Obstructive Pulmonary Disease 2025, 20:1761-1786
Published Date: 28 May 2025
A Machine Learning Model Integrating Tongue Image Features and Myocardial Injury Markers Predicts Major Adverse Cardiovascular Events in Patients with Coronary Heart Disease
Zhou M, Li J, Lim J, Xiao X, Xia Y, Wang Q, Xu Z
International Journal of General Medicine 2025, 18:3739-3765
Published Date: 5 July 2025
Diagnosis and Severity Assessment of COPD Based on Machine Learning of Chest CT Images
Sui H, Mo Z, Wei Y, Shi F, Cheng K, Liu L
International Journal of Chronic Obstructive Pulmonary Disease 2025, 20:2853-2867
Published Date: 14 August 2025
Nomogram Model for Identifying the Risk of Coronary Heart Disease in Patients with Chronic Obstructive Pulmonary Disease Based on Deep Learning Radiomics and Clinical Data: A Multicenter Study
Bian H, Qian H, Zhu S, Xue J, Qi L, Peng X, Li M, Zheng Y, Xu P, Zhao H, Jiang J
International Journal of Chronic Obstructive Pulmonary Disease 2025, 20:3045-3057
Published Date: 2 September 2025