
Back to Journals » International Journal of Chronic Obstructive Pulmonary Disease » Volume 20
Diagnosis and Severity Assessment of COPD Based on Machine Learning of Chest CT Images
Authors Sui H  , Mo Z, Wei Y, Shi F , Cheng K, Liu L
Received 18 March 2025
Accepted for publication 2 August 2025
Published 14 August 2025 Volume 2025:20 Pages 2853—2867
DOI https://doi.org/10.2147/COPD.S528988
Checked for plagiarism Yes
Review by Single anonymous peer review
Peer reviewer comments 2
Editor who approved publication: Dr Fanny Wai San Ko
He Sui,1,* Zhanhao Mo,1,* Ying Wei,2 Feng Shi,2 Kailiang Cheng,1 Lin Liu1
1China-Japan Union Hospital of Jilin University, Changchun, People’s Republic of China; 2Shanghai United Imaging Intelligence Co., Ltd., Shanghai, People’s Republic of China
*These authors contributed equally to this work
Correspondence: Kailiang Cheng, Department of Radiology, China-Japan Union Hospital of Jilin University, No. 126 Xiantai Street, Erdao District, Changchun, People’s Republic of China, Email [email protected] Lin Liu, Department of Radiology, China-Japan Union Hospital of Jilin University, No. 126 Xiantai Street, Erdao District, Changchun, People’s Republic of China, Email [email protected]
Purpose: During the acute phase of obstructive pulmonary disease (COPD), completing a standard pulmonary function test may be challenging for some patients. The goal of this experiment is to develop a machine learning model that uses chest CT images for automated diagnosis and grading of COPD patients, aiming to enhance diagnostic efficiency and accuracy.
Patients and Methods: The study retrospectively included 173 COPD patients and 176 healthy controls from December 2017 to June 2023. Deep learning segmentation modules were used to automatically segment the obtained chest CT images for lung parenchyma, airway, pulmonary artery, and vein. Imaging features were extracted from these segmented regions. The most reliable and relevant features were selected using Mann–Whitney U-test with a significant p-value of 0.05 and the least absolute shrinkage and selection operator (LASSO) method. Machine learning models were established through support vector machine (SVM) classifier in the training set and further tested in the internal testing set. Additional tests were performed on an external testing set with 68 individuals.
Results: In the machine learning model for COPD diagnosis, the image model achieved AUC values of 0.981 and 0.977 in the training and testing sets, with corresponding accuracies of 0.949 and 0.956 respectively. For COPD severity grading, the image model obtained AUC values of 0.889 and 0.796 in the training and testing sets, along with accuracies of 0.784 and 0.719.
Conclusion: The machine learning model based on chest CT images can accurately predict lung function, which can assist in the diagnosis and severity grading of COPD.
Keywords: chronic obstructive pulmonary disease, machine learning, lung parenchyma, airway, pulmonary vessels
Introduction
Chronic obstructive pulmonary disease (COPD) is a common chronic respiratory disease and ranks as the third leading cause of death globally.1 According to the 2023 Global Initiative for Chronic Obstructive Lung Disease (GOLD) report, it is defined as a heterogeneous pulmonary condition characterized by chronic respiratory symptoms (such as dyspnea, cough, and sputum) and persistent airflow obstruction caused by airway or alveolar lesions due to long-term exposure to toxic particles or gas.2 Variations in clinical manifestations, physiological characteristics, imaging features, treatment response, disease progression, and survival rates exist among COPD patients, resulting in irreversible pathological changes and permanent damage to the respiratory system.3 Therefore, timely diagnosis and early treatment are crucial for delaying disease progression, extending patient lifespan, and improving quality of life.4,5
The pulmonary function test (PFT) is considered the gold standard for diagnosing COPD and evaluating disease severity. It is a simple, reproducible, and noninvasive diagnostic technique with high sensitivity, quick operation, and comprehensive evaluation of overall pulmonary function.6 However, PFT cannot solely reflect emphysema or airway lesions in COPD patients. Additionally, some patients may have difficulty completing routine pulmonary function tests during the acute stage of COPD or if they have pneumothorax or cardiovascular and cerebrovascular diseases.7 In clinical practice, CT scans are preferred for diagnosing COPD. They allow visual and quantitative evaluation of emphysema presence, pattern, and degree in vivo.8,9 If chest CT images can be used to diagnose and assess severity noninvasively in COPD patients, it may help adjust individualized treatment plans during early intervention stages of the disease while significantly improving patient quality of life.
CT post-processing technology can provide more detailed information on pulmonary anatomical structure and pathophysiology through segmentation, reconstruction, and quantitative measurement of lung parenchyma and bronchus, thereby reflecting specific changes in lung lesions.10–14 Currently, artificial intelligence technology is being applied in early screening, diagnosis, classification, treatment monitoring, and prognosis evaluation of COPD.15–21 However, it has not been found in existing studies that all airway and pulmonary vascular characteristics have been included in the study of COPD. Table 1 summarizes existing chest CT techniques for assessing lung function in COPD patients, including a concise overview of each method’s advantages and limitations.
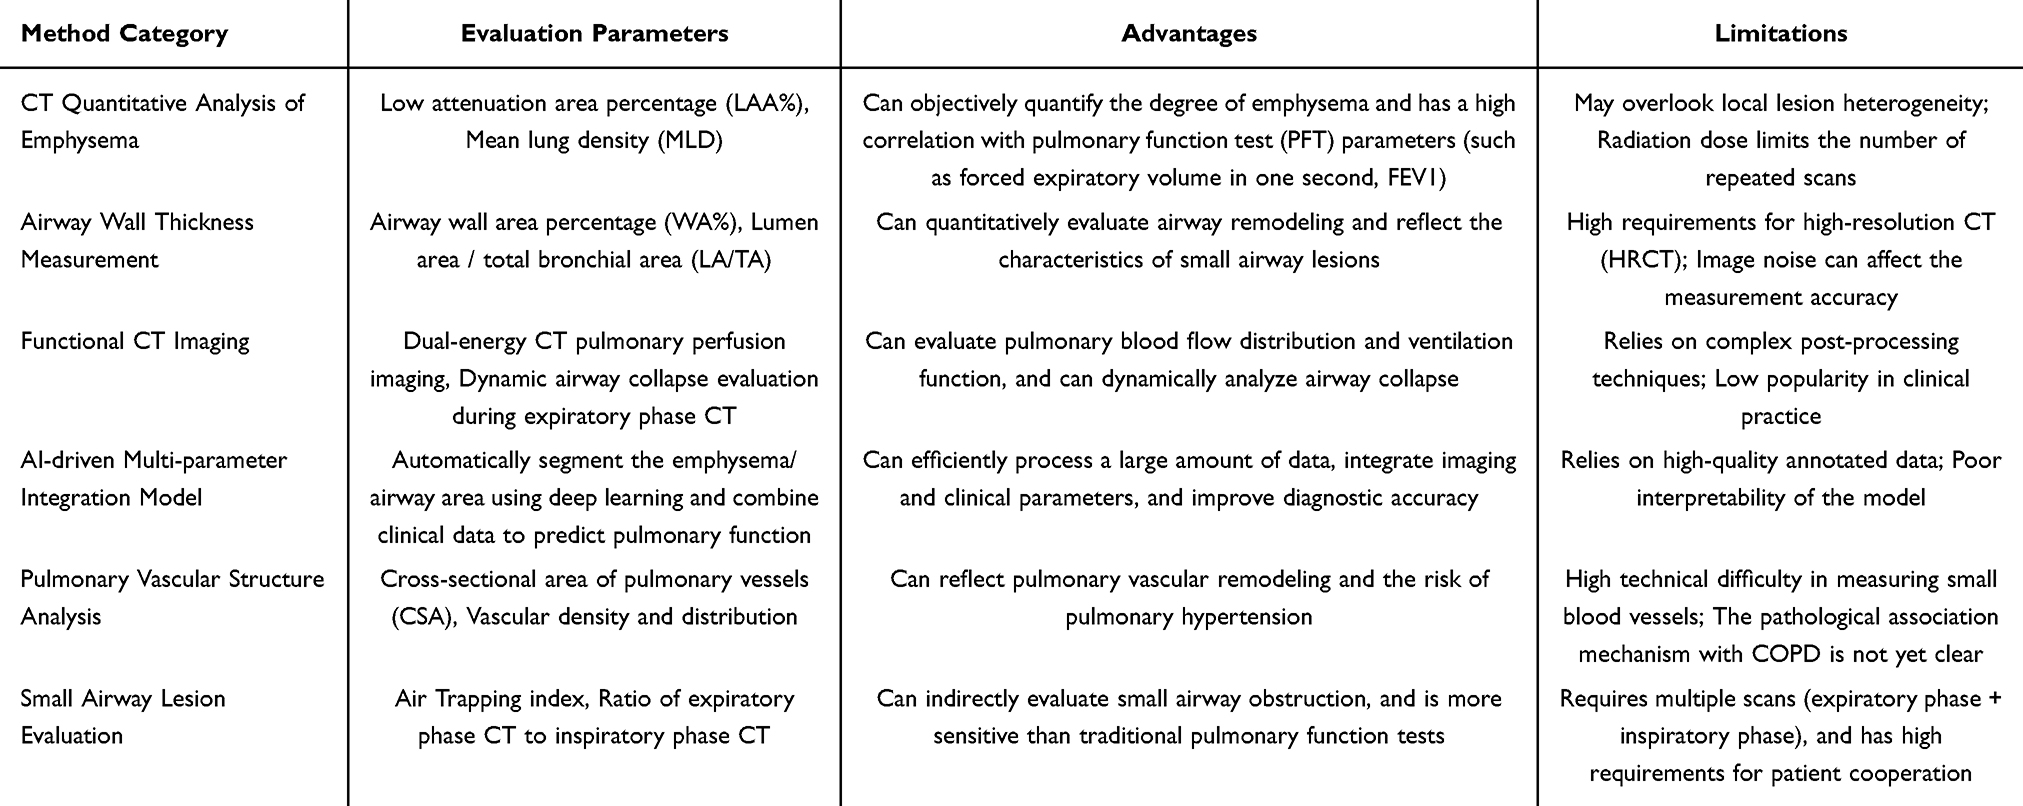 |
Table 1 Summary of Current Chest CT Imaging Methods for Assessing Lung Function in COPD Patients |
Therefore, this experiment is conducted using chest CT images to automatically extract features of lung parenchyma, air passages, and pulmonary vessels through a deep learning model. This enables the establishment of a machine learning model for the diagnosis and severity grading of COPD.
Contributions
Multi-Dimensional Feature Integration
This study represents the first comprehensive integration of lung parenchyma, the entire airway tree, and pulmonary vascular features into a COPD diagnostic model. This approach overcomes the limitations of conventional methods that focus only on localized bronchi or single-modality imaging.
Enhanced Diagnostic Performance
The developed machine learning model demonstrates superior sensitivity in detecting early-stage lesions by intelligently capturing patterns of pulmonary vascular remodeling—features often overlooked by traditional diagnostic approaches.
Clinical Application Benefits
By implementing a deep-inspiration single-phase CT scanning protocol, this method reduces radiation exposure while maintaining high diagnostic accuracy. Its compatibility with clinical workflow standards enhances its applicability in primary healthcare settings.
Intelligent Feature Learning
Although clinical variables such as BMI were not selected through algorithmic feature screening, the model successfully learned latent imaging features associated with body composition via deep autoencoder techniques. This constitutes an unexpected yet valuable advancement in non-invasive body composition assessment.
Refined Mechanistic Insights
Feature importance analysis revealed a significant association between pulmonary vein alterations and COPD progression. These findings challenge the prevailing view that pulmonary arterial remodeling dominates disease pathogenesis and suggest novel therapeutic targets for intervention.
Materials and Methods
Data Sets
This retrospective study received approval from the Institutional Review Board (IRB) of the China-Japan Union Hospital of Jilin University to waive the requirement for informed consent, with the reference number 2024110709. All procedures involving human participants in this research were conducted in strict accordance with the ethical standards set forth by the institutional and national research committees, as well as the 1964 Declaration of Helsinki and its subsequent amendments, or equivalent ethical guidelines. Clinical trial number is not applicable.
The study involved a retrospective data collection from 173 patients diagnosed with COPD from December 2017 to June 2023, and 176 healthy individuals who had undergone physical examinations during the same timeframe. Furthermore, for the purpose of external validation, we also collected data on 68 individuals undergoing physical examinations in other hospitals from July to December 2023, comprising 33 COPD patients and 35 healthy individuals. All participants were subjected to CT scans, with the COPD patients additionally undergoing pulmonary function tests as part of the study protocol.
The inclusion criteria for COPD patients are as follows: 1) Meeting the diagnostic criteria of the GOLD in 2023, which includes a post-bronchodilator FEV1/FVC ratio less than 0.70; 2) Having complete clinical and imaging data.
The exclusion criteria include: 1) Presence of large chest CT image artifacts that prevent analysis; 2) Inability to cooperate during pulmonary function examination or failure to meet quality control requirements; 3) Congenital or acquired thoracic deformity; 4) Presence of other pulmonary diseases such as pneumonia, bronchiectasis, lung cancer, lung consolidation, severe pulmonary fibrosis, or other diffuse pulmonary diseases; 5) History of previous chest surgery including lung volume reduction surgery or heart valve replacement surgery; 6) Patients with congenital bronchial variation; 7) Mental illness or any other factors that hinder completion of this study. The process of inclusion and exclusion is illustrated in the Figure 1.
 |
Figure 1 A multi-center COPD dataset establishment diagram. |
The inclusion criteria for healthy individuals are: 1) No respiratory symptoms and no history of disease exposure; 2) Complete clinical and imaging data. The exclusion criteria: 1) Inability to cooperate during pulmonary function examination or failure to meet quality control requirements; 2) Presence of large chest CT image artifacts that prevent analysis.
Diagnosis and Grading Criteria of COPD
The GOLD level was used as the diagnostic and grading criteria for COPD patients in this study. The diagnostic and clinical grading criteria of COPD are as follows (shown in Table 2):
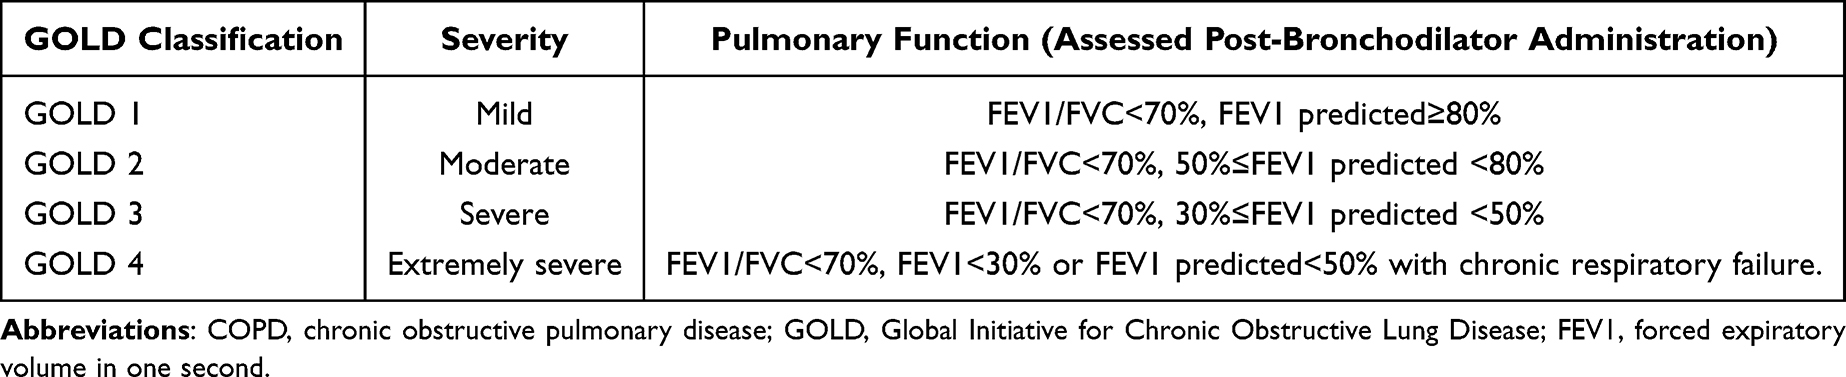 |
Table 2 The Classification of Airflow Limitation in Patients with COPD Based on Pulmonary Function |
Diagnostic criteria: FEV1/FVC<70% after bronchodilator inhalation.
Grouping Criteria
In this study, the population of the main data set was divided into normal control group, mild COPD group, and severe COPD group, with a total of 349 cases. There were 176 cases in the normal control group, 91 cases in the mild COPD group, and 82 cases in the severe COPD group. In addition, a total of 68 external test subjects were included, including 35 healthy subjects, 21 cases in the mild COPD group, and 12 cases in the severe COPD group (shown in Table 3).
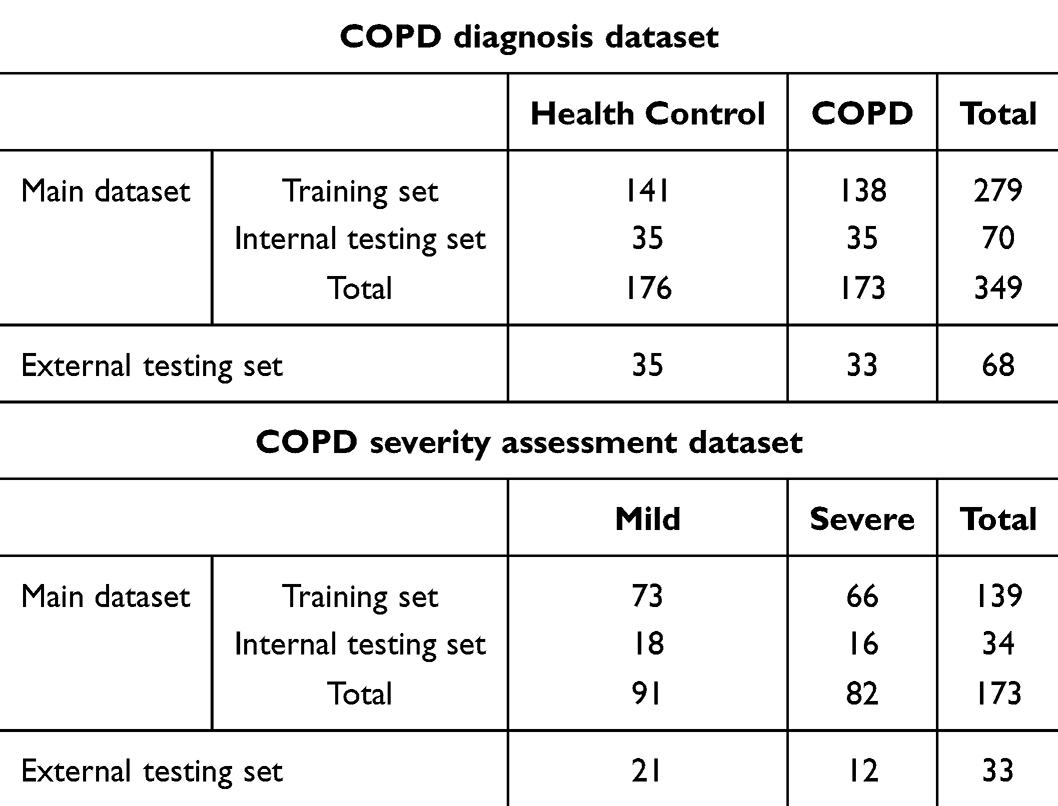 |
Table 3 Dataset Distribution for COPD Diagnosis and Severity Assessment Tasks |
The specific grouping criteria were as follows:
(1) Normal control group: healthy people in the same period.
(2) Mild COPD group: patients with GOLD 1 to 2 levels.
(3) Severe COPD group: patients with GOLD 3 to 4 levels.
Image Acquisition
The patient received detailed instructions and repeated breath-holding training to ensure maximum deep inspiration during the chest CT scan. The CT scanning was performed using Siemens, Toshiba, and GE Healthcare CT scanners with the following parameters: tube voltage 120kvp; matrix 512×512; axial image layer thickness 5mm; axial layer spacing 5mm; reconstruction layer thickness 1mm; reconstruction layer spacing 1mm.
Feature Extraction and Establishment of Machine Learning Model
The patient’s chest CT images were uploaded to the uAI Research Portal (Shanghai United Imaging Intelligence, Co., Ltd.) platform for the segmentation of lung parenchyma, airway, and pulmonary arteriovenous regions. Radiomics features, including first-order statistics, morphology, and texture features, of the lung and lung segment were extracted from the left, and right lung regions as well as the lung segments. At the same time, CT quantitative features, including the volume, density, mass, and percentage of volume of the airway, airway wall, artery and vein were extracted, shown in Figure 2. Finally, a total of 2100 radiomics features and 320 CT quantitative features were extracted from each individual. In the model construction, firstly, the main data set was randomly divided into training set and internal testing set according to a ratio of 8:2 using a stratified sampling approach. Subsequently, 5-fold cross-validation method was used to select features and build the model based on the training set. Finally, the model with the best performance in the 5-fold cross-validation was selected for the validation of the internal testing set and external testing set. Specifically, the Z-score standardization method was first used to normalize the features, and then the minimum-redundancy and maximum-relevance (MRMR) and the least absolute shrinkage and selection operator (LASSO) were used for feature selection. The important features with the least redundancy between the most relevant features of the classification task selected in the 5-fold cross-validation were adopted, and support vector machine (SVM) was used to build the prediction model. Finally, the optimal model on the validation set in the 5-fold cross-validation was selected for the internal testing set and the external testing set. The overall process of model construction is illustrated in Figure 3.
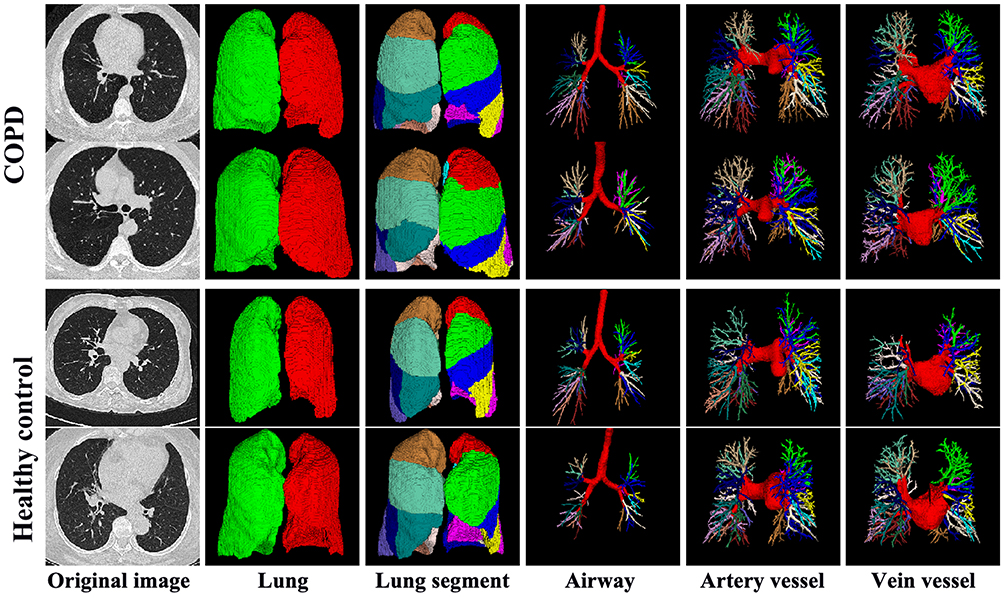 |
Figure 2 Image segmentations of lung parenchyma, airway, arteries and veins in COPD patients and healthy controls. |
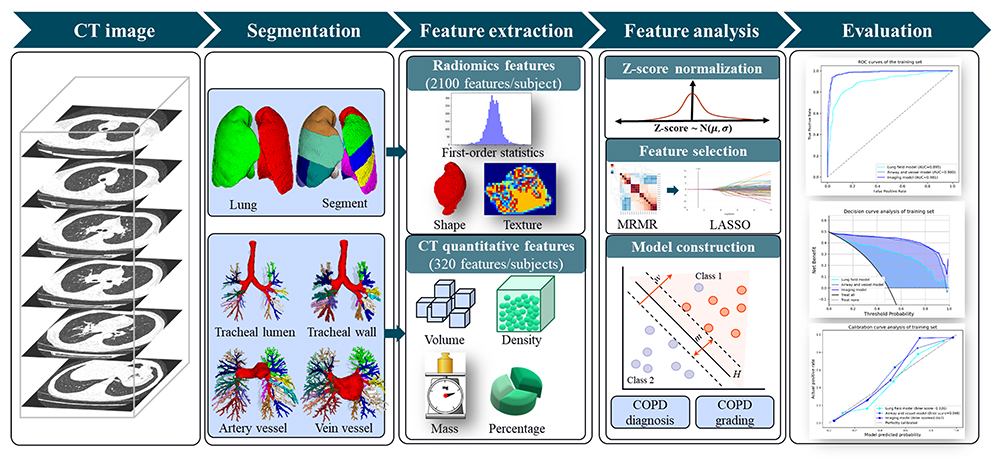 |
Figure 3 The flowchart for the proposed COPD diagnosis and grading models. |
Statistical Analysis
Nonparametric statistical tests were used for comparing measurement data between groups, while the chi-square test was employed for categorical data and Mann–Whitney U-test was adopted for the continues variables. Measurement data were presented as mean±standard deviation. The predictive efficiency of the machine learning models for diagnosing and grading COPD was evaluated using area under the ROC curve (AUC), accuracy, sensitivity, and specificity. A significance level of P<0.05 indicated statistical significance. Calibration plots and decision curve analysis (DCA) were analyzed to explore the correction effect and assess the clinical applicability of our proposed COPD diagnosis and grading models, respectively. Brier scores were also calculated for each model to quantitatively verify the distance in the probability domain and a lower score means better prediction. Confusion matrices were used to calculate the accuracy, sensitivity, specificity, and F1-score values in the validation set, internal testing set and external testing set.
Results
Study Population
The main data set included 349 subjects who underwent chest CT scanning and PFT simultaneously, comprising of 176 healthy individuals and 173 COPD patients, with a total of 208 males and 141 females. Healthy individuals had an average age of 61.4±5.4 years old and a body mass index (BMI) of 24.1±3.1 kg/m2, while COPD patients had an average age of 62.4±10.0 years old and a BMI of 23.6±4.4 kg/m2. No significant difference was found between the COPD patients and healthy subjects. In the main data set, there were mild group consisted of 91 COPD patients and severe group consisted of 82 COPD patients. There was a statistically significant difference in BMI (P<0.05) between the mild and severe COPD groups. The basic clinical data for both groups are shown in Table 4. The external testing set included 68 subjects, including 35 healthy people and 33 COPD patients (21 in the mild group and 12 in the severe group).
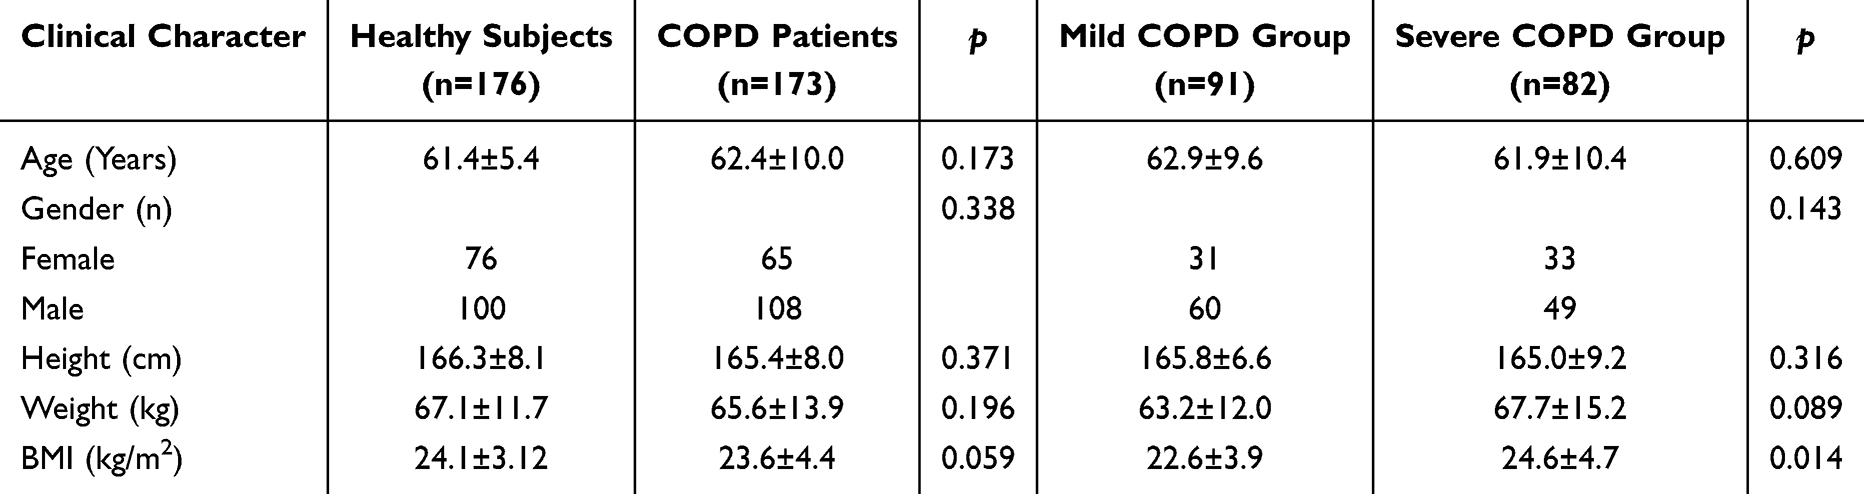 |
Table 4 Clinical Characteristics for the Development Dataset |
The Value of Machine Learning in the Diagnosis of COPD
In this study, three different models were constructed to assess their performance in identifying COPD: a lung parenchyma-based model (Lung field model), an airway and pulmonary vascular-based model (Airway and Vessel model), and an integrated image-based model (Imaging model) incorporating all three features’ sets. The lung parenchyma model utilized 24 important features, the airway and pulmonary vascular model employed 18 essential features, and the integrated imaging model was constructed based on 17 selected features (Figure 4).
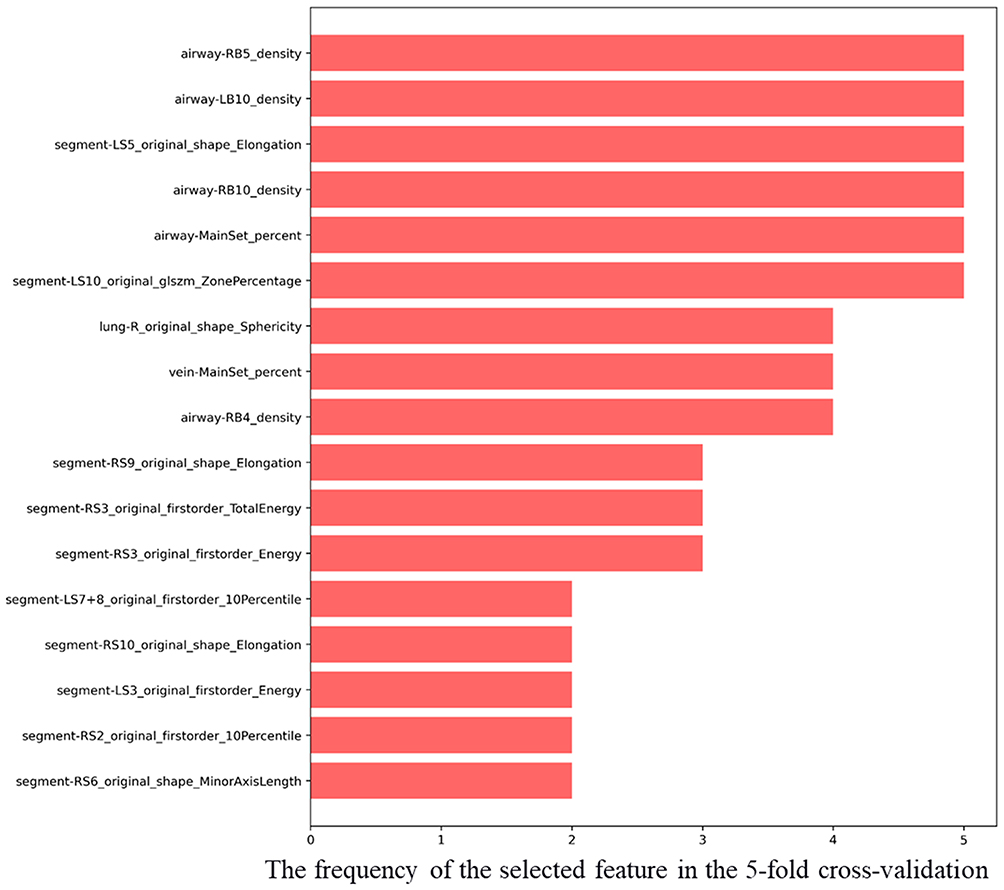 |
Figure 4 The selected features used for the integrated imaging model for COPD diagnosis. |
Comparative analysis revealed that the evaluation metrics of the integrated imaging model surpassed those of the individual models in both main dataset and external testing set with AUC values of 0.981 in the training set, 0.977 in the internal testing set, and 0.965 in the external testing set, respectively. For the decision curve analysis, the integrated imaging model achieved the highest net benefit compared to the other models at nearly entire ranges of the probability threshold. Additionally, the calibration curve analyses also indicated that the imaging model have the best agreement between observation and prediction to evaluate COPD patients and healthy controls with the lowest Brier scores in both the main dataset and the external testing set (Figure 5). Confusion matrices of the validation set, internal testing set, and external testing set were shown in the Figure 6. Note that, For the validation set, the confusion matrix was constructed by aggregating (summing) all validation samples across the 5 folds, which reflects the full validation sample size. For the internal testing set and external testing set, we first computed a confusion matrix for each fold, then calculated the average of these fold-specific matrices and rounded the values to the nearest integers to maintain the interpretability of sample counts. The performance metrics for these sets are derived from these averaged (and rounded) confusion matrices, providing a balanced representation of model performance across folds (shown in Table 5).
 |
Table 5 Diagnostic Performance of COPD Machine Learning Model |
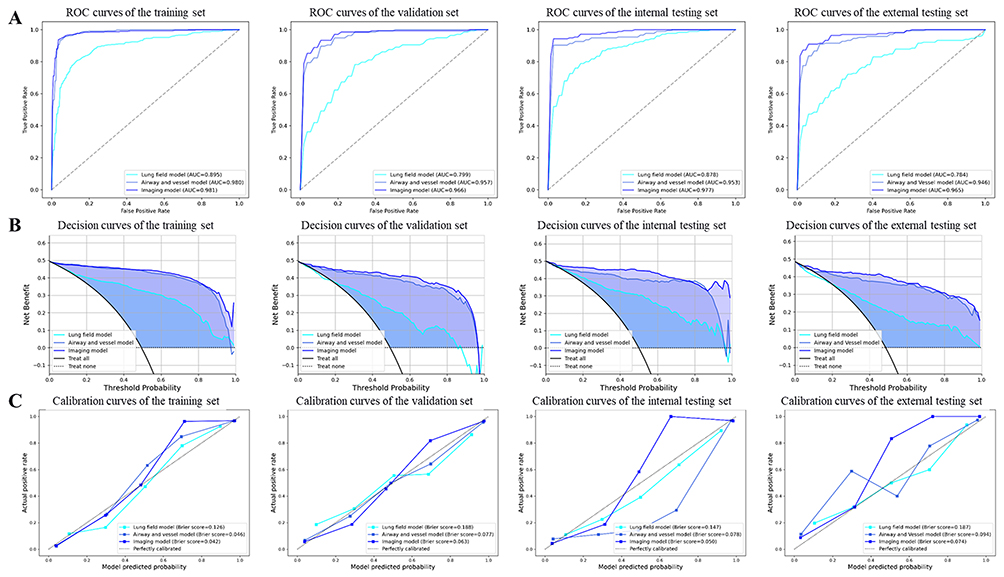 |
Figure 5 COPD diagnosis performance using the machine learning model. Receiver operating characteristic (ROC) curves (A), decision curve analysis (B) and calibration curve analysis (C) of the training set, validation set, internal and external testing set, respectively. |
 |
Figure 6 Confusion matrix of COPD diagnosis in validation set, internal and external testing set. |
The Value of Machine Learning in COPD Severity Grading
In the establishment of COPD severity grading model, we first constructed a comprehensive imaging model based on lung parenchyma, airway, and pulmonary vessels features. Through 5-fold cross-validation, we selected 24 important features and built the model using SVM. Additionally, we included the statistically significant BMI variable (P<0.05) from patient’s clinical data along with the selected imaging features to construct an imaging and clinical combined COPD severity grading model. The results demonstrated that the AUC values of the imaging model were 0.889, 0.828, 0.796, and 0.813 in the training set, validation set, internal testing set, and external testing set respectively. Similarly, AUC values of the combined model were 0.887, 0.828, 0.777, 0.811 in these respective sets as well (shown in Table 6 and Figure 7). Confusion matrices of the validation set, internal testing set, and external testing set were shown in the Figure 8.
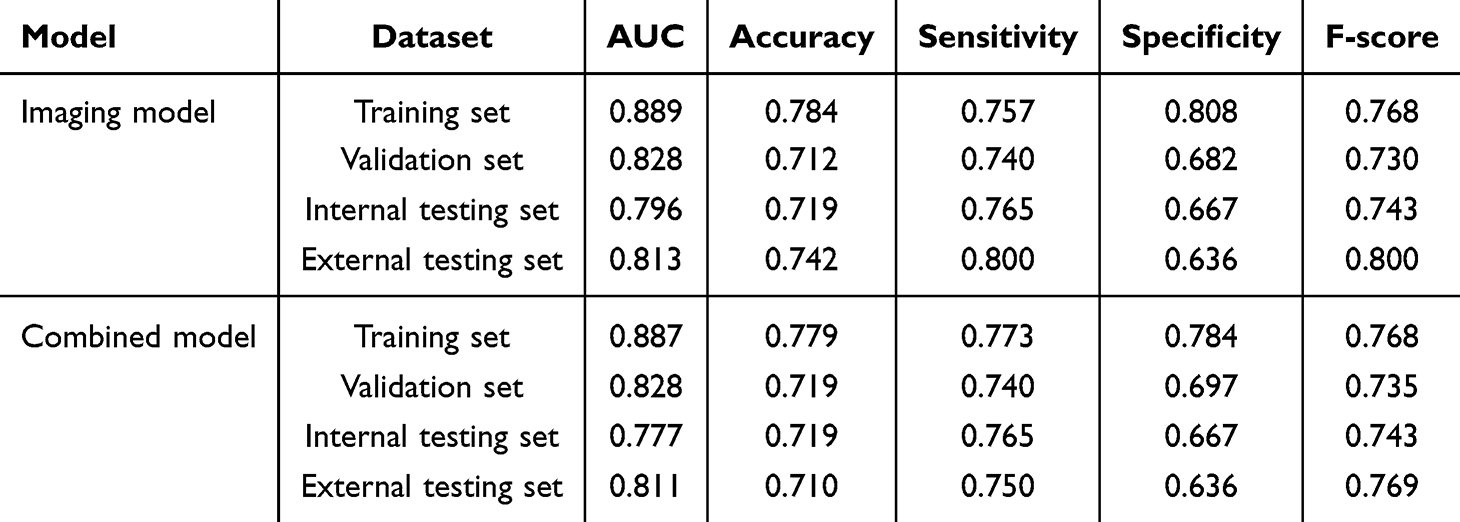 |
Table 6 Grading Performance of COPD Machine Learning Model |
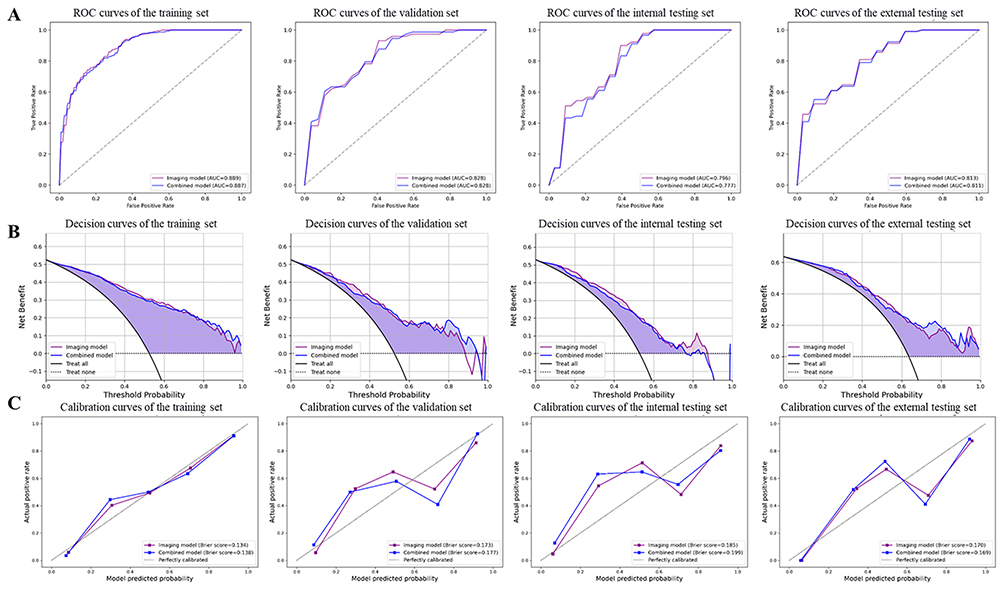 |
Figure 7 COPD severity grading performance using the machine learning model. Receiver operating characteristic (ROC) curves (A), decision curve analysis (B) and calibration curve analysis (C) of training set, validation set, internal and external testing set. |
 |
Figure 8 Confusion matrix of COPD severity assessment in validation set, internal and external testing set. |
Discussion
The machine learning-based imaging model, constructed on the features of lung parenchyma, airway structures, and pulmonary vessels, demonstrated robust predictive capability for both diagnosing and severity grading of COPD in this study. The employed machine learning model utilized chest CT images to accurately identify key features of lung tissue as well as all airways and pulmonary vessels, thereby inferring lung function. In comparison with quantitative CT methods reported in previous studies within this field, our developed machine learning model exhibited significantly superior diagnostic performance for COPD patients. This breakthrough holds immense significance in terms of delaying disease progression, extending patient lifespan, and enhancing overall quality of life.
Studies have demonstrated that changes in vascular morphology on chest CT scans can provide valuable information regarding pulmonary hypertension, which is caused by remodeling of the pulmonary vessels and alterations in cardiac morphology.21 Additionally, segmented vessels can also indicate abnormal perfusion.22 Therefore, in this study, both the cardiac and pulmonary vascular trees were automatically segmented and comprehensively evaluated, resulting in a more comprehensive and convincing analysis compared to previous studies that only focused on lung tissue segmentation. Furthermore, previous research has indicated that chest CT scans can be utilized to measure bone mineral density, which serves as a better indicator of body fat and muscle distribution.23 It should be noted that body fat distribution may impact lung capacity,24 thus, assessment indicators such as BMI that reflect overall health could potentially affect the evaluation of lung function. In this experiment, when using the feature screening method to select imaging and clinical features for assessing COPD severity in machine learning, no clinical features are chosen by the algorithm. Therefore, a combined model is constructed by directly combining clinical features (BMI) with the selected imaging-based features that show statistical significance at P<0.05 in the clinical results. The findings suggest that incorporating a single BMI clinical variable has minimal impact on model performance and may even lead to slight reduction instead. This could be due to other unconsidered clinical factors or automatic extraction of imaging features including BMI characteristics of responsive patients by the machine learning model during construction. Hence, in this comparison, we utilize the imaging model instead of the combined model.
Compared to previous studies that utilized quantitative CT parameters (the extent of emphysema (Low Attenuation Area Percentage at −950 Hounsfield Units, LAA%−950), airway wall thickness (WT), airway wall area (WA%), etc.) for assessing lung function, the machine learning model we built demonstrates higher efficiency in detecting severe cases of COPD.25,26 This could be attributed to the fact that small airway obstruction in COPD primarily occurs in bronchi with a diameter less than 2mm, and manual measurement of CT-based quantitative parameters based on bronchial contour may have certain inaccuracies. Previous experiments have observed changes in LAA%−950 values during the evaluation of quantitative CT parameters between COPD patients and healthy controls.27 This difference can be attributed to the complex pathological mechanism of COPD, which depends not only on pulmonary parenchyma factors but also on airway and pulmonary vascular elements. Some patients may exhibit extensive emphysema while others with similar dysfunction present an airway dominance phenotype. In this study, lung tissue, small airways, and pulmonary blood vessels were segmented and analyzed. The established model exhibits higher diagnostic efficiency and can help prevent complications such as pulmonary heart disease, arrhythmia, and heart failure caused by delayed diagnosis. Timely diagnosis can help prevent complications such as pulmonary heart disease, arrhythmia, and heart failure, ultimately influencing patient prognosis.
In this experiment, our focus was on extracting the characteristics of lung parenchyma, pulmonary arteries and veins, and trachea. The experimental results demonstrate that our extraction of lung tissue and airway features primarily emphasizes morphological features and first-order radiomics features, such as image gray difference and texture features. These extracted features provide valuable information regarding the structure of the lung and airway. Specifically, morphological features encompass the shape, size, distribution of lung parenchyma, as well as the morphology and branching patterns of the airway. Through analyzing these morphological features, we can comprehend both structural and functional changes in the lung which serve as a foundation for further clinical diagnosis and treatment. First-order radiomics features, such as image gray difference and texture characteristics, play a crucial role in the evaluation of pulmonary tissue density and texture. These features are the primary indicators of radiological changes in the lungs and can provide valuable insights into the underlying pathological processes. Image gray difference, for instance, refers to the variation in pixel values within an image. In the context of pulmonary imaging, it represents the variation in lung density, which can be an indicator of disease severity. Increased gray difference may suggest areas of consolidation or fibrosis, while decreased gray difference may indicate air trapping or atrophy. Texture characteristics, on the other hand, refer to the spatial distribution of gray values in an image. They can be used to quantify the heterogeneity of lung tissue and provide information about the organization of the parenchyma. Texture characteristics such as coarseness, smoothness, and regularity can be used to differentiate between healthy and diseased lungs, thereby assisting us in evaluating disease severity and development trends.
The lung parenchyma and five pulmonary segments’ horizontal bronchial trees were analyzed by ZHANG et al to establish a deep learning model for COPD diagnosis,28 of which the results showed that the AUC value of the external testing set was 0.899, with an accuracy of 0.817, sensitivity of 0.810, and specificity of 0.835. Compared to ZHANG’s study, our proposed model based on lung parenchyma, airway, and pulmonary vessels in this research exhibited significantly superior prediction performance. Including additional airway and pulmonary vascular characteristics improved both the objectivity and diagnostic ability of the prediction model for COPD. Gonzalez G et al, using a subset of chest CT images, constructed a deep learning model which yielded an AUC value of 0.856 for COPD diagnosis - considerably lower than the predictive performance observed in this study.29 Other deep learning or radiomics models developed separately for the lung segment or lung and tracheal segment showed varying degrees of incompleteness compared with this experiment.19,30,31
This study has several limitations. First, the small sample size—173 COPD patients and 176 healthy controls—may affect the reliability and reproducibility of the findings. Larger cohorts are needed to improve statistical power. Second, disease severity was classified solely based on FEV1% predicted values, grouping patients into only mild and severe categories. This binary system may oversimplify clinical heterogeneity. A multi-tiered classification system that includes moderate stages and additional clinical data could enhance model applicability. The retrospective design introduces selection bias due to strict adherence to GOLD criteria, limiting how well results apply to broader COPD populations. External validation included only 68 participants from multiple institutions, restricting generalizability across demographics, regions, and clinical settings. Finally, the machine learning models are computationally intensive and rely on specific imaging protocols and algorithms, which may limit their use in low-resource settings or with alternative diagnostic tools. While our study focuses on evaluating SVM for COPD analysis, we acknowledge the potential of methods proposed by Hussain et al such as their soft voting ensemble framework and hybrid feature engineering pipeline integrating recursive feature elimination (RFE) with clinical domain expertise.32 These approaches may complement our work by addressing challenges like model generalization and class imbalance. In future research, we plan to integrate and analyze such methods to optimize COPD diagnosis and severity assessment frameworks.
Conclusions
Machine learning models that integrate the lung parenchyma, airways, and pulmonary vessels demonstrate optimized performance in diagnosing and classifying the severity of COPD. This can aid in guiding personalized management strategies and enhancing disease outcomes by providing quantitative information and facilitating early and precise diagnoses through structural assessment.
Abbreviations
COPD, obstructive pulmonary disease; PFT, pulmonary function tests; FEV1, forced expiratory volume in one second; LAA%, Low attenuation area percentage; WA%, Airway wall area percentage; WT, wall thickness; LASSO, least absolute shrinkage and selection operator; SVM, support vector machine; GOLD, Global Initiative for Chronic Obstructive Lung Disease; MRMR, minimum-redundancy and maximum-relevance; AUC, area under the ROC curve; DCA, decision curve analysis; RFE, recursive feature elimination.
Patient and Public Involvement statement
Patients or the public WERE NOT involved in the design, or conduct, or reporting, or dissemination plans of our research.
Patient Data Confidentiality Statement
Patient confidentiality is strictly maintained throughout this process. All medical records and personal information are handled in full compliance with HIPAA guidelines and institutional data protection protocols, accessible only to authorized research personnel through encrypted systems.
Data Sharing Statement
The data that support the findings of this study are available from the corresponding author, upon reasonable request.
Ethics Approval and Consent to Participate
This study received approval from the Institutional Review Board (IRB) of the China-Japan Union Hospital of Jilin University, with the reference number 2024110709. All procedures involving human participants in this research were conducted in strict accordance with the ethical standards set forth by the institutional and national research committees, as well as the 1964 Declaration of Helsinki and its subsequent amendments, or equivalent ethical guidelines.
Author Contributions
All authors made a significant contribution to the work reported, whether that is in the conception, study design, execution, acquisition of data, analysis and interpretation, or in all these areas; took part in drafting, revising or critically reviewing the article; gave final approval of the version to be published; have agreed on the journal to which the article has been submitted; and agree to be accountable for all aspects of the work.
Funding
This study was funded by Jilin Province Department of Finance Special Project for Health Science Research Talents (Grant number: 2024SCZ06).
Disclosure
The authors declare that they have no competing interests.
References
1. Calverley PMA, Walker PPP. Contemporary concise review 2022: chronic obstructive pulmonary disease. Respirology. 2023;28(5):428–436. doi:10.1111/resp.14489
2. Terry PD, Dhand R. The 2023 GOLD report: updated guidelines for inhaled pharmacological therapy in patients with stable COPD. review. Pulmonary Ther. 2023;9(3):345–357. doi:10.1007/s41030-023-00233-z
3. Galal I, Rabie Z, Ahmed S, Mhsb AH, Kotb S. Clinical, physiological, and radiological different phenotypes of COPD patients. Egyp J Bronchol. 2023;17(1):59. doi:10.1186/s43168-023-00232-3
4. Chapron A, Andres E, Fiquet L, et al. Early detection of chronic obstructive pulmonary disease in primary care: a randomised controlled trial. Br J Gen Pract. 2023;73(737):e876–e884. doi:10.3399/bjgp.2022.0565
5. Bhatta L, Leivseth L, Mai X-M, et al. GOLD classifications, COPD hospitalization, and all-cause mortality in chronic obstructive pulmonary disease: the HUNT study. Int J Chronic Obstr. 2020;15:225–233. doi:10.2147/copd.S228958
6. Alshamari AHI, Deli F, Kadhum HI, Kadhim IJ. Assessment of thyroid function tests in patients with chronic obstructive pulmonary disease. J Med Life. 2022;15(12):1532–1535. doi:10.25122/jml-2022-0069
7. Alam MS, Ahmad J, Kumar A, Shameem M. Efficacy and safety of inhaled indacaterol and tiotropium in patients of chronic obstructive pulmonary disease. Int J Pharm Invest. 2020;10(2):217–220. doi:10.5530/ijpi.2020.2.40
8. Abadi E, Jadick G, Hoffman EA, Lynch D, Segars WP, Samei E. COPD quantifications via CT imaging: ascertaining the effects of acquisition protocol using virtual imaging trial. 2021.
9. Dolliver WR, Diaz AA. Advances in chronic obstructive pulmonary disease imaging. Barcelona Resp Network Rev. 2020;6(2):128–143. doi:10.23866/brnrev:2019-0023
10. Pu J, Zhou MJ, Shao JW, et al. High resolution computerized tomography quantitative evaluation of the correlation between central airway and pulmonary function grading in chronic obstructive pulmonary disease. J Biol Regul Homeost Agents. 2021;35(3):1067–1072. doi:10.23812/20-491-L
11. Dutta IN, Nadeem SA, Comellas AP, Hoffman EA, Saha PK. CT-based segmentation of pectoral muscle using deep learning and association of computed metrics with aging and sex. 2022.
12. Xing H, Zhang X, Nie Y, et al. A deep learning-based post-processing method for automated pulmonary lobe and airway trees segmentation using chest CT images in PET/CT. Quant Imaging Med Surg. 2022;12(10):4747–4757. doi:10.21037/qims-21-1116
13. Wang X, Zheng F, Xiao R, et al. Comparison of image quality and lesion diagnosis in abdominopelvic unenhanced CT between reduced-dose CT using deep learning post-processing and standard-dose CT using iterative reconstruction: a prospective study. Eur J Radiol. 2021:139109735. doi:10.1016/j.ejrad.2021.109735.
14. Hagen F, Grimmer R, Ditt H, et al. Effects of different virtual monoenergetic CT image data on chest wall post-processing “unfolded ribs” and proposal of an algorithm improvement. Int J Comp Assisted Radiol Surg. 2023;18(2):339–351. doi:10.1007/s11548-022-02721-0
15. Bakker JT, Klooster K, Vliegenthart R, Slebos D-J. Measuring pulmonary function in COPD using quantitative chest computed tomography analysis. Eur Respir Rev. 2021;30(161):210031. doi:10.1183/16000617.0031-2021
16. Bao Y, Al Makady Y, Mahmoodi S. Automatic Diagnosis of COPD in Lung CT Images based on Multi-View DCNN. 2021;571–578.
17. Deng X, Li W, Yang Y, et al. COPD stage detection: leveraging the auto-metric graph neural network with inspiratory and expiratory chest CT images. Med Biol Eng Comput. 2024;62(6):1733–1749. doi:10.1007/s11517-024-03016-z
18. Li T, Zhou H-P, Zhou Z-J, Guo L-Q, Zhou L. Computed tomography-identified phenotypes of small airway obstructions in chronic obstructive pulmonary disease. Chinese Med J. 2021;134(17):2025–2036. doi:10.1097/cm9.0000000000001724
19. Zhang C, Liu J, Cao L, et al. Deep learning-based computed tomography features in evaluating early screening and risk factors for chronic obstructive pulmonary disease. Contrast Media Mol Imaging. 2022:20225951418. doi:10.1155/2022/5951418.
20. Zhou M, Wang T, Wei D, et al. Incidence, severity and tolerability of pneumothorax following low-dose CT-guided lung biopsy in different severities of COPD. Clin Resp J. 2021;15(1):84–90. doi:10.1111/crj.13272
21. Zhai Z, Staring M, Giron IH, et al. Automatic quantitative analysis of pulmonary vascular morphology in CT images. Med Phys. 2019;46(9):3985–3997. doi:10.1002/mp.13659
22. Koster TD, Hazrati E, Van Rikxoort EM, Klooster K, Charbonnier J-P, Slebos D-J. CT-approximated perfusion is comparable to nuclear perfusion imaging. Eur Resp J. 2020;56. doi:10.1183/13993003.congress-2020.1575.
23. Ceylan E, Comlekci A, Akkoclu A, et al. The effects of body fat distribution on pulmonary function tests in the overweight and obese. Southern Med J. 2009;102(1):30–35. doi:10.1097/SMJ.0b013e31818c9585
24. Littleton SW. Impact of obesity on respiratory function. Respirology. 2012;17(1):43–49. doi:10.1111/j.1440-1843.2011.02096.x
25. Aslan E, Kaya F, Ozgul E, Balci A, Demirel E, Gunay E. Quantitative computed tomography analysis of emphysema severity and distribution in chronic obstructive lung disease, correlation with clinical findings. Tuberkuloz Ve Toraks-Tuberculosis and Thorax. 2021;69(3):338–348. doi:10.5578/tt.20219706
26. Saad MM, Bayoumy AA, El-Nisr MM, Zaki NM, Khalil TH, Elserafi AF. Assessment of artificial intelligence-aided chest computed tomography in diagnosis of chronic obstructive airway disease: an observational study. Egypt J Radiol Nucl Med. 2023;54(1):97. doi:10.1186/s43055-023-01043-8
27. Zhu D, Dai H, Zhu H, et al. Identification of frequent acute exacerbations phenotype in COPD patients based on imaging and clinical characteristics. Respir Med. 2023:209107150. doi:10.1016/j.rmed.2023.107150.
28. Zhang L, Jiang B, Wisselink HJ, Vliegenthart R, Xie X. COPD identification and grading based on deep learning of lung parenchyma and bronchial wall in chest CT images. Brit J Radiol. 2022;95(1133):20210637. doi:10.1259/bjr.20210637
29. Gonzalez G, Ash SY, Vegas-Sanchez-Ferrero G, et al. Disease staging and prognosis in smokers using deep learning in chest computed tomography. Am J Respir Crit Care Med. 2018;197(2):193–203. doi:10.1164/rccm.201705-0860OC
30. Sun J, Liao X, Yan Y, et al. Detection and staging of chronic obstructive pulmonary disease using a computed tomography-based weakly supervised deep learning approach. Eur Radiol. 2022;32(8):5319–5329. doi:10.1007/s00330-022-08632-7
31. Makimoto K, Au R, Moslemi A, et al. Comparison of feature selection methods and machine learning classifiers for predicting chronic obstructive pulmonary disease using texture-based CT lung radiomic features. Acad Radiol. 2023;30(5):900–910. doi:10.1016/j.acra.2022.07.016
32. Hussain A, Choi H-E, Kim H-J, Aich S, Saqlain M, Kim H-C. Forecast the exacerbation in patients of chronic obstructive pulmonary disease with clinical indicators using machine learning techniques. Diagnostics. 2021;11(5):829. doi:10.3390/diagnostics11050829
 © 2025 The Author(s). This work is published and licensed by Dove Medical Press Limited. The
full terms of this license are available at https://www.dovepress.com/terms
and incorporate the Creative Commons Attribution
- Non Commercial (unported, 4.0) License.
By accessing the work you hereby accept the Terms. Non-commercial uses of the work are permitted
without any further permission from Dove Medical Press Limited, provided the work is properly
attributed. For permission for commercial use of this work, please see paragraphs 4.2 and 5 of our Terms.
© 2025 The Author(s). This work is published and licensed by Dove Medical Press Limited. The
full terms of this license are available at https://www.dovepress.com/terms
and incorporate the Creative Commons Attribution
- Non Commercial (unported, 4.0) License.
By accessing the work you hereby accept the Terms. Non-commercial uses of the work are permitted
without any further permission from Dove Medical Press Limited, provided the work is properly
attributed. For permission for commercial use of this work, please see paragraphs 4.2 and 5 of our Terms.
Recommended articles

Predicting Superaverage Length of Stay in COPD Patients with Hypercapnic Respiratory Failure Using Machine Learning
Zuo B, Jin L, Sun Z, Hu H, Yin Y, Yang S, Liu Z
Journal of Inflammation Research 2025, 18:5993-6008
Published Date: 8 May 2025
Identifying Common Diagnostic Biomarkers and Therapeutic Targets between COPD and Sepsis: A Bioinformatics and Machine Learning Approach
Li X, Xiao Y, Yang M, Zhang X, Yuan Z, Zhang Z, Zhang H, Liu L, Zhao M
International Journal of Chronic Obstructive Pulmonary Disease 2025, 20:1761-1786
Published Date: 28 May 2025
ER Stress-Related Biomarkers in Chronic Obstructive Pulmonary Disease: A Comprehensive Transcriptome, Mendelian Randomization, and Machine-Learning Analysis
Li J, Li G, Liu J, Li L, Zhou H, Fei X, Wen Y, Zhao D
International Journal of Chronic Obstructive Pulmonary Disease 2025, 20:3803-3818
Published Date: 26 November 2025
The Predictive Value of the Combined FVC/DLCO Ratio and 1-Minute Heart Rate Recovery After Exercise in Stable Chronic Obstructive Pulmonary Disease with Pulmonary Hypertension
Wang N, Xing J, Zheng Y, Wang J, Liu L, Tian Y, Cui Z
International Journal of General Medicine 2026, 19:610100
Published Date: 30 June 2026