
Back to Journals » Journal of Multidisciplinary Healthcare » Volume 19
Multicenter Validation of an Integrated DCE-MRI Radiomics, Deep Learning, and S-II Model for Predicting Axillary Lymph Node Metastasis in Breast Cancer
Authors Lu X, Wang M, Liu X, Lyu D
Received 12 March 2026
Accepted for publication 12 June 2026
Published 9 July 2026 Volume 2026:19 608685
DOI https://doi.org/10.2147/JMDH.S608685
Checked for plagiarism Yes
Review by Single anonymous peer review
Peer reviewer comments 2
Editor who approved publication: Prof. Dr. Krzysztof Laudanski
Xinxin Lu,1 Mengshen Wang,2 Xiaohua Liu,3,* Di Lyu2,*
1Department of Oncology, Maternal and Child Hospital, Ganzhou, Jiangxi Province, 341000, People’s Republic of China; 2Department of Thyroid and Breast Surgery, The Affiliated Hospital of Medical University, Xuzhou, Jiangsu Province, 221004, China; 3Department of Medical Imaging, Affiliated Hospital of Medical University, Xuzhou, Jiangsu Province, 221004, China
*These authors contributed equally to this work
Correspondence: Di Lyu, Department of Thyroid and Breast Surgery, The Affiliated Hospital of Xuzhou Medical University, No. 99 Huaihai West Road, Xuzhou, Jiangsu, 221004, People’s Republic of China, Tel +8613592730645, Email [email protected]
Introduction/Background: This study developed and externally validated an integrated model combining clinical variables, systemic immune-inflammation index (SII), DCE-MRI radiomics score (RadScore), and deep learning score (DLScore) for preoperative prediction of axillary lymph node metastasis (ALNM) in breast cancer.
Materials and Methods: A retrospective dual-center cohort included 212 patients in the training cohort and 121 patients in the external validation cohort. Clinical data, inflammatory indices, and DCE-MRI images were analyzed. Radiomic and deep learning features were reduced to RadScore and DLScore, ten logistic regression models were compared using ROC analysis, calibration, and decision curve analysis.
Results: ALNM rates were comparable in training and validation cohorts (47.17% and 47.11%). The integrated model achieved the best discrimination, with AUC of 0.972 in the training cohort and 0.942 in the external validation cohort, and showed good calibration and superior net benefit across clinically relevant threshold. Combining local DCE-MRI phenotypes with systemic inflammatory status improved predictive performance and external generalizability compared with single-modality models. These findings support multimodal integration as a non-invasive adjunct for preoperative ALNM risk stratification.
Conclusion: The integrated model may assist individualized preoperative axillary assessment in breast cancer patients. Prospective multicenter validation, workflow evaluation, and further interpretability analysis are still required before routine clinical implementation.
Keywords: Breast cancer, axillary lymph node metastasis, dynamic contrast-enhanced magnetic resonance imaging, systemic immune-inflammation index, deep learning
Introduction
Breast cancer remains the most frequently diagnosed malignancy among women globally, imposing a substantial burden on public health systems worldwide.1 Axillary lymph node metastasis (ALNM) serves as a pivotal prognostic indicator and determines the therapeutic strategy, ranging from sentinel lymph node biopsy (SLNB) to axillary lymph node dissection (ALND).2 Accurate preoperative assessment of ALNM status is crucial for avoiding unnecessary surgical morbidity, such as lymphedema, while ensuring adequate oncological control.3 However, current conventional imaging modalities, including ultrasound and morphological MRI, rely heavily on size and shape criteria, which often fail to detect micrometastases or differentiate reactive hyperplasia from malignant infiltration, resulting in suboptimal sensitivity and specificity.4,5
In recent years, radiomics and deep learning (DL) have emerged as powerful tools for non-invasive tumor phenotyping. Radiomics extracts high-throughput quantitative descriptors from medical images and characterize intratumoral heterogeneity not visible on routine visual assessment.6 DL algorithms, particularly convolutional neural networks (CNNs), can automatically learn hierarchical imaging patterns related to metastatic behavior.7 Recent DCE-MRI radiomics and DL studies have shown promise for ALNM prediction,8–13 but most models remain imaging-centric, and may not fully capture systemic biological conditions that facilitate metastasis.
Tumor progression and metastasis are not solely determined by local tumor morphology but are also influenced by the systemic immune-inflammatory microenvironment.14 SII, calculated from peripheral neutrophil, lymphocyte, and platelet counts, reflects the balance among inflammation, immune surveillance, and platelet-mediated tumor dissemination.15 Elevated SII may indicate neutrophil-driven tumor invasion, platelet-facilitated adhesion and lymphatic spread, and lymphocyte-related impairment of antitumor immunity, thereby providing a mechanistic basis for its association with metastatic potential in breast cancer.16,17
Therefore, multimodal fusion may improve ALNM prediction by integrating complementary information from local imaging phenotypes and systemic host status. We hypothesize that an integrated model combining clinical characteristics, SII, DCE-MRI radiomics and DL features would outperform single-modality models and remain robust in an external center.
Accordingly, this two-center retrospective study aimed to develop and externally validate an integrated prediction model combining clinical features, SII, RadScore, and DLScore for preoperative ALNM prediction in breast cancer. Model discrimination, calibration, clinical utility, and feature contribution were evaluated to clarify both predictive performance and potential clinical applicability.
Materials and Methods
Study Design and Ethical Compliance
This study was a retrospective dual-center cohort study conducted in strict accordance with the Declaration of Helsinki. The study protocol was approved by the Ethics Committee of Ganzhou Maternal and Child Health Hospital (Approval No.: 2025-LunShenLin-111). Written informed consent from all participants was waived by the ethics committee due to the retrospective study design. All study data and analytical codes are available from the corresponding author upon reasonable request.
Study Participants
Study Cohort
According to predefined inclusion and exclusion criteria, 212 breast cancer patients admitted to Ganzhou Maternal and Child Health Hospital from January 2016 to August 2025 were retrospectively enrolled as the training cohort, and 121 patients admitted to The Affiliated Hospital of Xuzhou Medical University during the same period were enrolled as the external validation cohort. Because the study period was long, patient acquisition was restricted to cases with complete preoperative DCE-MRI, blood tests, and pathological confirmation, and image preprocessing and feature extraction were standardized across all included cases to reduce temporal and inter-center heterogeneity. Pathological diagnoses of all participants were independently confirmed by two senior pathologists with more than 10 years of experience; discrepant opinions were resolved by consensus.
Inclusion Criteria
① Pathologically confirmed breast malignant tumors (invasive ductal carcinoma, ductal carcinoma in situ) with definite axillary lymph node status confirmed by surgical pathology; ② Completion of DCE-MRI examination within 2 weeks before surgery; ③ Female patients aged over 18 years with complete clinical baseline data; ④ Completion of routine blood tests within 3 days before surgery; ⑤ Complete clinical data, imaging datasets and pathological results.
Exclusion Criteria
① A history of other malignant tumors; ② Receipt of neoadjuvant radiotherapy, chemotherapy, endocrine therapy or immunotherapy before surgery; ③ Abnormal routine blood test indicators caused by severe infection, hematological diseases or other factors; ④ Poor quality of MRI images (motion artifacts, low signal-to-noise ratio) that interfere with feature extraction; ⑤ Pregnant or lactating women.
Data Collection and Preprocessing
Clinical Baseline Data Collection
Clinical data were extracted from the hospital electronic medical record system, including age, maximum tumor diameter (MTD, confirmed by pathological reports), short-axis diameter of axillary lymph nodes (SAD_ALN, measured by preoperative ultrasonography), tumor location, pathological type, receptor status, Ki-67, and molecular subtype when available. Molecular subtype was assessed in baseline comparisons but was not retained in the final model because it was not significantly associated with ALNM in the training cohort and to preserve a parsimonious preoperative model. Lymphovascular invasion was not included because it is a postoperative pathological variable and was incompletely documented in the retrospective records. The outcome variable was defined as ALNM status: 1 for pathologically confirmed metastasis, 0 for no metastasis.11
Calculation of Inflammatory Indices
Preoperative routine blood test results (within 3 days before surgery) were collected, and neutrophil count (N), lymphocyte count (L), monocyte count, white blood cell count and platelet count (P) were extracted. The systemic immune-inflammation index (SII) and other inflammatory ratios were calculated with the following formula: SII = (N × P)/L; neutrophil-to-lymphocyte ratio (NLR) = N/L; platelet-to-lymphocyte ratio (PLR) = P/L; monocyte-to-lymphocyte ratio (MLR) = monocyte count/L; white blood cell-to-lymphocyte ratio (WLR) = white blood cell count/L.12
Examination and Feature Extraction Methods
Instrument and Equipment
Image acquisition was performed using a GE 3.0T MRI scanner with a 16-channel breast coil. All subjects were placed in a prone position with bilateral breasts naturally hanging down in the dedicated coil detection area. The scanning protocol included: ① Routine plain scan of bilateral breasts; ② Diffusion-weighted imaging (DWI); ③ Dynamic contrast-enhanced imaging (DCE-MRI). For DCE-MRI, gadopentetate dimeglumine (Gd-DTPA) was used as the contrast agent, administered via intravenous bolus injection at a dose of 0.2 mmol/kg body weight and an injection rate of 1.5 mL/s, followed by 20 mL normal saline flushing at the same flow rate. A total of 9 consecutive phase image datasets were acquired, with 30 seconds per phase.13
Image Preprocessing
The fourth phase of DCE-MRI images was exported in DICOM format and preprocessed using Python 3.9 and the Simple ITK library: the N4 bias correction algorithm was applied to eliminate magnetic field inhomogeneity, and voxels were resampled to an isotropic resolution of 1×1×1 mm3. Regions of interest (ROIs) were manually delineated slice by slice along the tumor lesion edge in a semi-automatic manner using ITK-SNAP 4.2.2 software by a deputy chief radiologist with more than 10 years of breast disease diagnosis experience. Necrotic and normal tissues were carefully excluded to construct the whole tumor volume of interest (VOI) (Figure 1).
 |
Figure 1 DCE-MRI image of a 52-year-old female patient with an irregular mass in the upper outer quadrant of the left breast, showing a washout enhancement curve in dynamic contrast-enhanced imaging. The blue arrow indicates the breast tumor lesion/region of interest delineated on DCE-MRI. |
Radiomics Feature Extraction
A total of 926 radiomic features were extracted from DCE-MRI image ROIs using the Pyradiomics package, classified into two primary categories: ① Shape features (n=16): surface area, volume, sphericity, among others; ② Non-shape features (n=910): comprising first-order statistics (n=18): mean, standard deviation, skewness, kurtosis, entropy, among others; texture features (n=73): gray-level co-occurrence matrix (GLCM, n=22), gray-level run length matrix (GLRLM, n=16), gray-level size zone matrix (GLSZM, n=16), gray-level dependence matrix (GLDM, n=14), gray-level difference matrix (GLDM, n=5); and derived image features (n=91): original images (n=91), Laplacian of Gaussian (LoG)-derived images (n=91), and wavelet transform-derived images (n=728; 8 transform types).
To validate the reliability of radiomic feature extraction, DCE-MRI data from 30 randomly selected participants were independently re-analyzed: ROIs were redelineated and radiomic features re-extracted by a second senior breast radiologist with more than 10 years of subspecialty experience. Inter-observer agreement was assessed using the intraclass correlation coefficient (ICC), and only features with an ICC > 0.75 (substantial agreement) were retained for subsequent statistical analyses.
Deep Learning Feature Extraction
First, a rectangular region encompassing the maximum tumor cross-section was cropped as the ROI on axial DCE-MRI images. Following cropping, images were resized to a standard resolution of 224×224 pixels via linear interpolation. To improve the generalizability of the deep learning model, data augmentation was performed by applying random rotation (±15°), horizontal/vertical flipping, and Gaussian noise (σ=0.01) to the images.
Using deep transfer learning with the ImageNet dataset, model parameters were updated via a global fine-tuning strategy to adapt the ResNet50-based CNN model to ALNM prediction. ResNet50 was selected as a widely used, stable backbone for transfer learning in relatively small medical imaging datasets, and data augmentation was used to reduce overfitting. ResNet50 model comprised Bottleneck modules with a layer configuration of,3,4,6 and a 1000-dimensional feature vector was generated from the final fully connected layer. Deep learning feature extraction was implemented using the PyTorch with GPU acceleration enabled, and 1000 deep learning features were extracted from the trained model. Comparative testing of alternative architectures was not performed and is acknowledged as a limitation.
Construction of RadScore and DLScore Models
Radiomic and deep learning feature selection was conducted via four sequential steps: ① Removal of redundant zero-variance features and non-informative features via the t-test or Mann–Whitney U-test; ② Elimination of highly correlated features (r>0.60) via Pearson correlation analysis; ③ Subsequent screening of ALNM-associated key features using the minimum redundancy maximum relevance (mRMR) algorithm; ④ Final feature selection via least absolute shrinkage and selection operator (LASSO) regression. A total of 14 radiomic features and 13 deep learning features were ultimately selected (Figures 2 and 3).
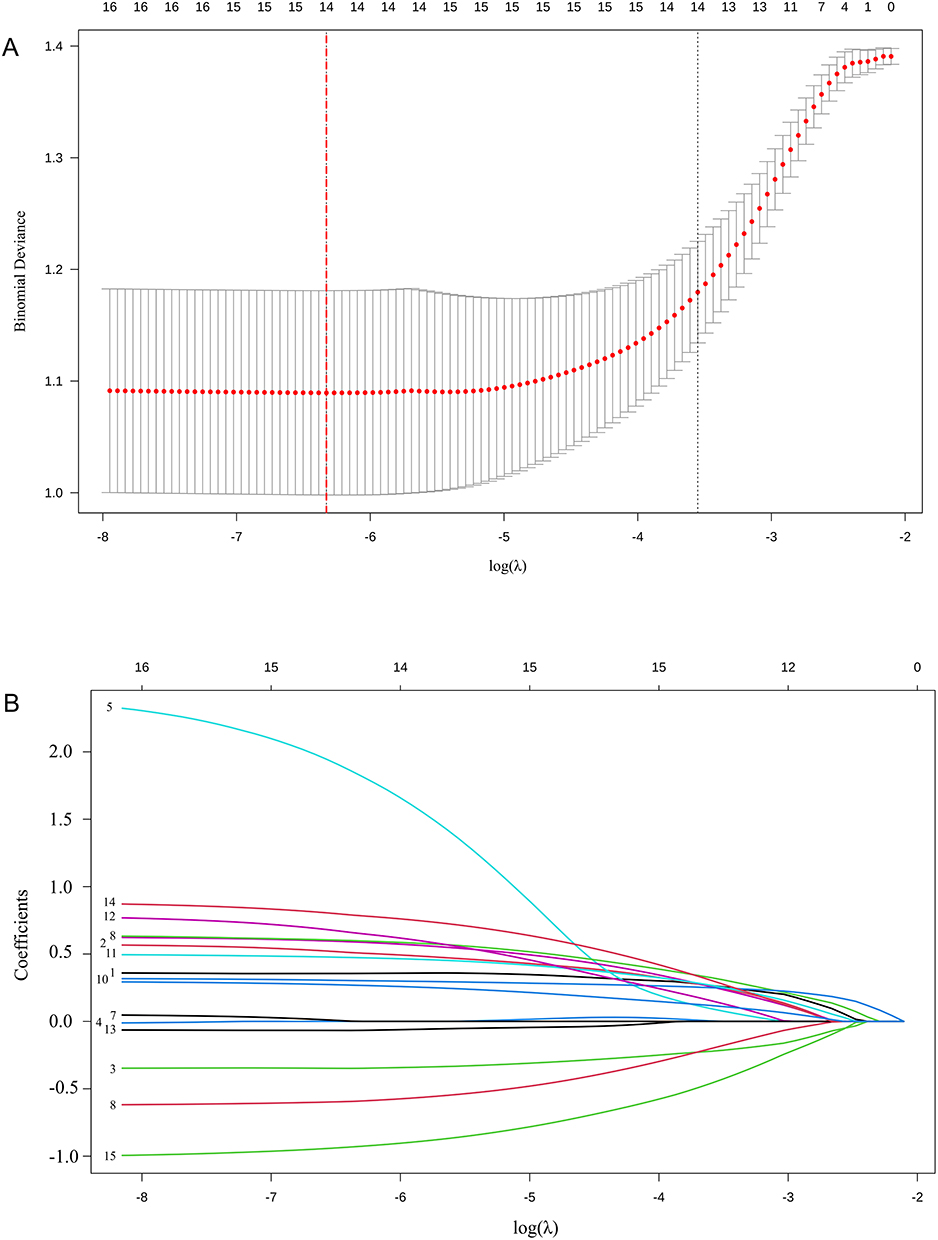 |
Figure 2 LASSO regression screening process of radiomic features for predicting axillary lymph node metastasis. (A) shows the cross-validation curve for selection of the tuning parameter λ, and the red dotted vertical line indicates the selected λ value. (B) shows the coefficient path diagram, in which each colored curve represents the coefficient trajectory of one radiomic feature as λ changes. |
 |
Figure 3 LASSO regression screening process of deep learning (DL) features for predicting axillary lymph node metastasis. (A) shows the cross-validation curve for selection of the tuning parameter λ, and the red dotted vertical line indicates the selected λ value. (B) shows the coefficient path diagram, in which each colored curve represents the coefficient trajectory of one DL feature as λ changes. |
The selected features were independently weighted and summed to generate the radiomic score (RadScore) and deep learning score (DLScore), which provided a quantitative foundation for the subsequent development of radiomic and deep learning prediction models.
Statistical Analysis
All statistical analyses were performed using R software (version 4.3.2). Continuous variables with a normal distribution were expressed as mean ± standard deviation ($$x\pm $$) and compared using the independent-samples t-test; non-normally distributed continuous variables were expressed as median (interquartile range) [M (Q1, Q3)] with the Mann–Whitney U-test for intergroup comparisons. Categorical variables were expressed as n (percentage) [n (%)], and the chi-square (χ2) test or Fisher’s exact test was used for intergroup comparisons as appropriate. A two-sided P < 0.05 was considered statistically significant.
Univariate logistic regression analysis was performed to screen potential predictive factors of ALNM. Ten predictive models were developed based on the selected optimal features and clinical applicability, all constructed using the logistic regression algorithm. R packages including dplyr, caret, glmnet and pROC were used for model building and validation.
The discriminatory ability of each model was evaluated using the ROC curve and area under the curve (AUC), with sensitivity, specificity, accuracy, positive predictive value (PPV), negative predictive value (NPV) and their 95% confidence intervals (95% CI) calculated as secondary metrics. Calibration curves and the Hosmer-Lemeshow test were applied to assess the consistency between predicted probabilities and actual ALNM rates. Decision curve analysis (DCA) was used to evaluate the clinical net benefit of each model within different threshold probability ranges.
No formal a priori sample size calculation was performed because of the retrospective cohort design. The training cohort comprised 212 patients with 100 ALNM events, providing an events-per-variable ratio greater than 10 for the 6 predictors in the final integrated model (RadScore, SAD_ALN, DLScore, MTD, SII, and age). To limit overfitting, feature dimensionality was reduced before model construction, cross-validation was used during feature subset selection, and final performance was tested in an independent external validation cohort. Nevertheless, the limited sample size and wide confidence intervals for some estimates were considered when interpreting the results.
Results
Baseline Characteristics of Study Participants
Among the 212 participants in the training cohort, 100 (47.17%) had pathologically confirmed ALNM positivity. The participants had a median age of 47.85 years (range, 28–79 years) with a mean ± SD of 47.85 ± 10.41 years; MTD ranged from 0.49 to 11.94 cm (mean ± SD, 2.98 ± 1.78 cm); SAD_ALN ranged from 0.15 to 4.39 cm (mean ± SD, 0.91 ± 0.77 cm).
Statistically significant differences were observed between the ALNM-positive and ALNM-negative cohorts for age, MTD, SAD_ALN, NLR, PLR, MLR, WLR, SII levels, as well as RadScore and DLScore (all P<0.05). Detailed demographic and clinical characteristics are summarized in Table 1.
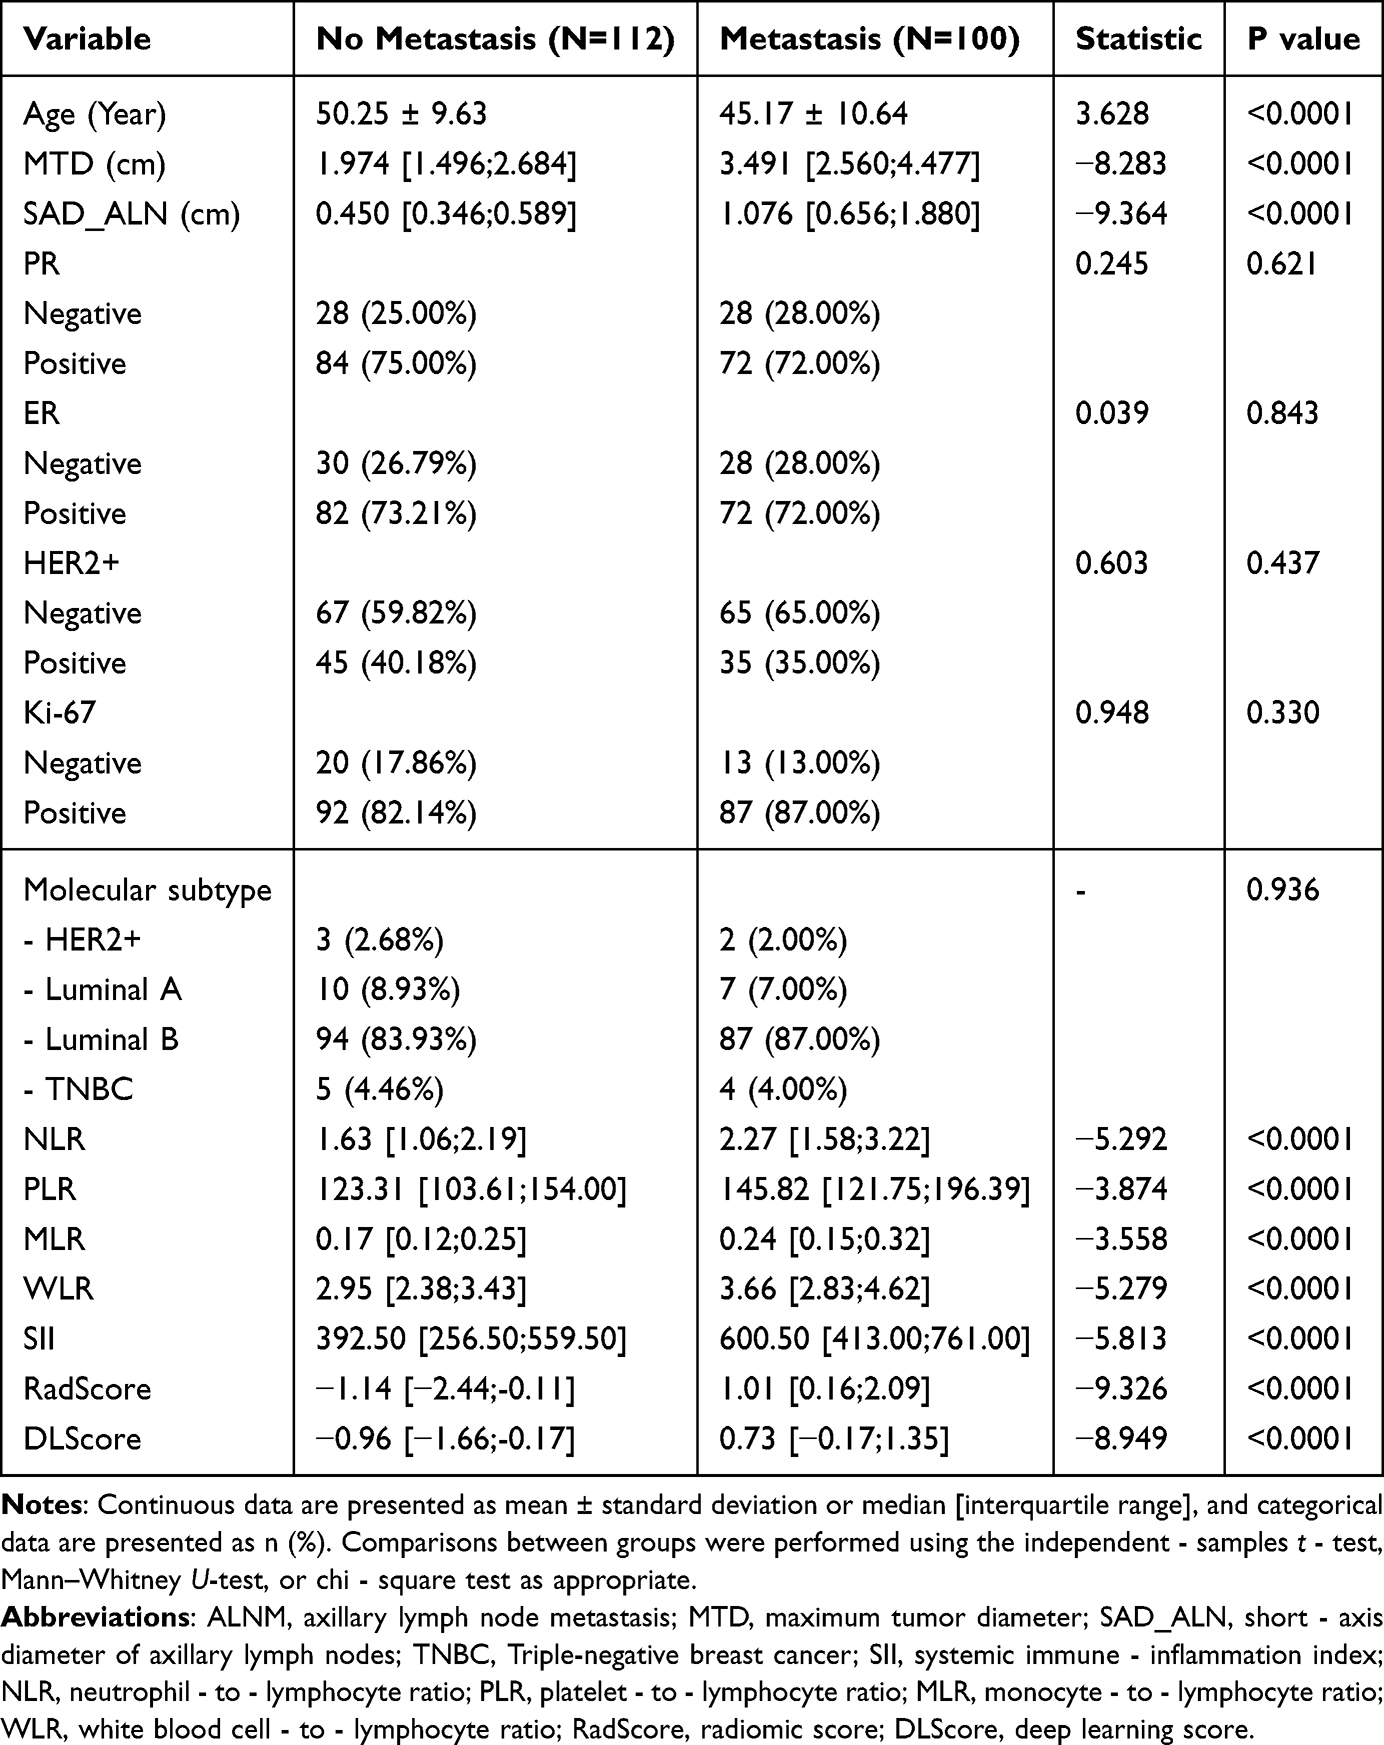 |
Table 1 Comparison of Baseline, Clinical and Pathological Characteristics of Patients in the Training Cohort |
Results of Univariate Logistic Regression Analysis
Univariate logistic regression analysis demonstrated that all 10 variables (age, MTD, SAD_ALN, NLR, PLR, MLR, WLR, SII, RadScore, DLScore) were significantly associated with ALNM in the training cohort (all P<0.01), and were therefore designated as potential predictive factors for ALNM (Table 2).
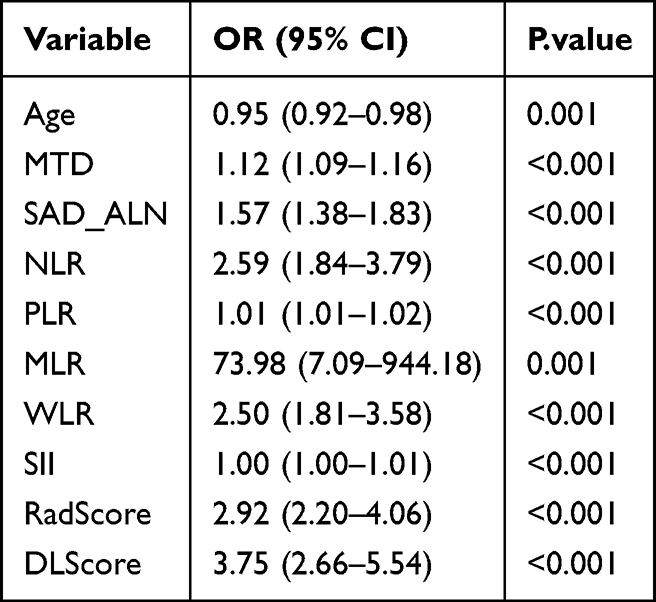 |
Table 2 Univariate Logistic Regression Analysis for Predicting Axillary Lymph Node Metastasis (ALNM) |
Among these variables, MLR had the highest odds ratio (OR) of 73.98 (95% CI: 7.09–944.18, P=0.001), indicative of the strongest association with ALNM positivity, while the wide 95% CI denoted relatively poor stability of this estimate. The OR values of DLScore [3.75 (95% CI: 2.66–5.54, P<0.001)], RadScore [2.92 (95% CI: 2.20–4.06, P<0.001)] and NLR [2.59 (95% CI: 1.84–3.79, P<0.001)] were all greater than 2.5, indicating a moderate-to-strong association with ALNM. Age was identified as a protective factor for ALNM (OR=0.95, 95% CI: 0.92–0.98, P=0.001), indicating that each 1-year increase in age was associated with a 5% reduction in the risk of developing ALNM. MTD, SAD_ALN, PLR, WLR and SII were all independent risk factors for ALNM, with corresponding OR values of 1.12, 1.57, 1.01, 2.50, and 1.00 (all P<0.001).
Feature Selection and Dimensionality Reduction
Subsequent feature selection was conducted on the candidate variables identified in the training cohort. The Light Gradient Boosting Machine (LightGBM) algorithm was used to quantify and rank variable importance as an interpretable feature-contribution analysis.18 Variables were sequentially added in ascending order of importance, and the mean AUC and 95% CI were derived via stratified 10-fold cross-validation.
The feature combination yielding the highest mean AUC was designated as the optimal feature set, comprising RadScore, SAD_ALN, DLScore, MTD, SII, and age (Figure 4). RadScore and SAD_ALN ranked as the two most important variables, followed by DLScore and MTD, suggesting that imaging-derived tumor and nodal phenotypes contributed most strongly to model performance, with SII and age providing complementary systemic and clinical information.
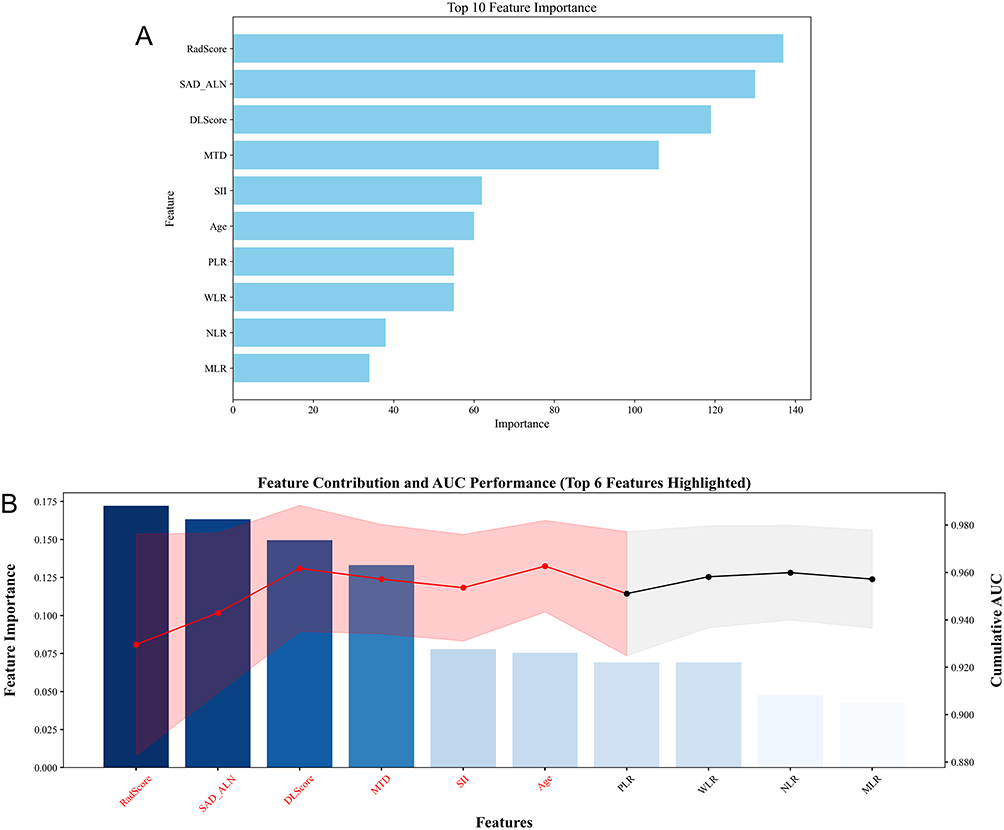 |
Figure 4 Feature selection results based on variable importance. (A) shows LightGBM variable-importance ranking; (B) shows cross-validation AUC of incrementally added feature subsets. Abbreviations: AUC, area under the receiver operating characteristic curve; LightGBM, Light Gradient Boosting Machine. |
Construction of Predictive Models
Based on the above-identified optimal features and in consideration of clinical applicability, a total of 10 predictive models were developed as follows: (1) Clinical model included only clinical features with P<0.05 on univariate logistic regression analysis (age, MTD, SAD_ALN); (1) Immune model (SII) included only the systemic immune-inflammation index (SII, the most predictive inflammatory biomarker); (3) Radiomic model (Rad) included only RadScore; (4) Deep learning model (DL) included only DLScore; (5) Clinical + SII model comprised clinical features + SII; (6) Clinical + Radiomic model included clinical features + RadScore; (7) Clinical + Deep learning model comprised clinical features + DLScore; (8) Radiomic + SII model included RadScore + SII; (9) Deep learning + SII model included DLScore + SII; (10) Integrated model comprised clinical features + SII + RadScore + DLScore.
Multiple Model Performance
Based on the selected optimal features, the 10 developed predictive models were trained and their performance was assessed. Detailed performance metrics for each model in the training and external validation cohorts are summarized in Table 3, and model performance was visualized via ROC curves (Figure 5A: training cohort; Figure 5B: external validation cohort).
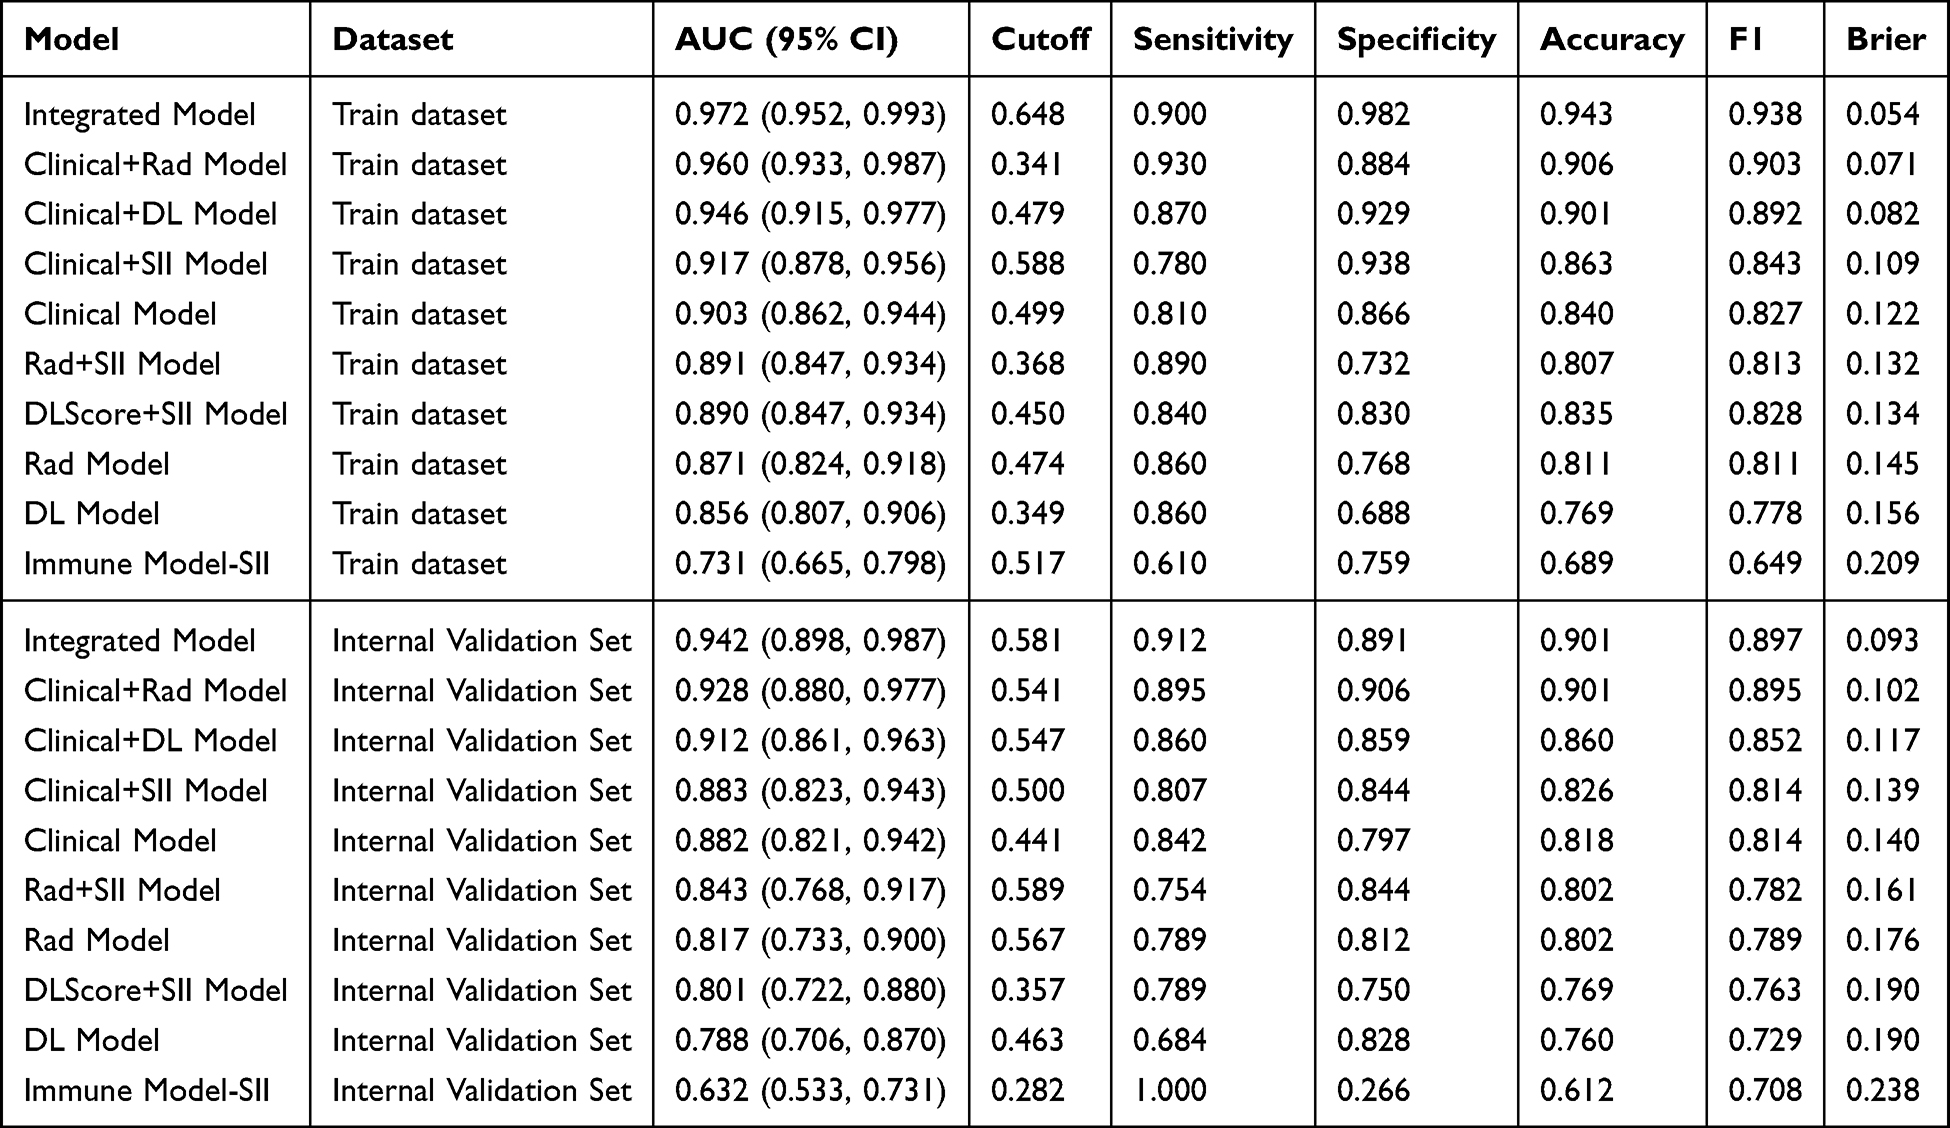 |
Table 3 Performance Evaluation Results of Different Predictive Models in the Training and External Validation Cohorts |
 |
Figure 5 ROC curve comparison of 10 predictive models in the training cohort (A) and external validation cohort (B). Abbreviations: ROC, receiver operating characteristic; AUC, area under the curve. |
In the training cohort, all models achieved AUC values ranging from 0.731 to 0.972, indicative of overall favorable predictive performance. The Integrated model exhibited superior performance, with an AUC of 0.972 (95% CI: 0.952–0.993), and was characterized by excellent discriminatory and calibration performance. At the optimal cutoff value of 0.648, the model yielded a sensitivity of 0.900, specificity of 0.982, accuracy of 0.943, and F1-score of 0.938, with a Brier score of 0.054 (the lowest across all models)—denoting the strongest agreement between predicted probabilities and actual clinical outcomes. This was closely followed by the Clinical + Radiomic (AUC: 0.960, 95% CI: 0.933–0.987) and Clinical + Deep learning (AUC: 0.946, 95% CI: 0.915–0.977) models; all their discriminatory metrics (sensitivity: 0.870–0.930; specificity: 0.884–0.929; accuracy: 0.901–0.906) were consistently high. Among single-modality models, the Radiomic and Deep learning models outperformed the Immune model (SII), which had the lowest AUC of 0.731 (95% CI: 0.665–0.798)—the poorest-performing model in the training cohort.
In the external validation cohort, model performance followed a consistent trend with the training cohort; the Integrated model still achieved superior performance (AUC=0.942, 95% CI: 0.898–0.987), representing only a modest reduction from the training cohort value, which demonstrates robust generalizability of the model. The model maintained stable discriminatory performance, with a sensitivity of 0.912, specificity of 0.891, accuracy of 0.901, and Brier score of 0.093—exhibiting superior calibration performance relative to all other models. The Clinical + Radiomic (AUC: 0.928, 95% CI: 0.880–0.977) and Clinical + Deep learning (AUC: 0.912, 95% CI: 0.861–0.963) models followed closely, with performance nearly comparable to that of the Integrated model. Notably, the Immune model (SII) exhibited further performance deterioration in the external validation cohort (AUC: 0.632, 95% CI: 0.533–0.731); while the model achieved a perfect sensitivity of 1.000, its specificity was only 0.266—indicating a marked overprediction bias and limited clinical utility.
Collectively, the Integrated model showed the highest AUC and balanced sensitivity, specificity, and accuracy in both cohorts, with good calibration and the lowest Brier score. Because the AUC was high relative to the sample size, these results should be interpreted in the context of the independent external validation cohort and the overfitting-control procedures described above.
Model Fitting and Clinical Utility Evaluation
Calibration Curve Analysis
Calibration curve analysis demonstrated that the predicted probabilities of the Integrated model were highly consistent with the actual rates of ALNM positivity in both the training and external validation cohorts, with the fitted curve closely aligned to the ideal 45° calibration line (Figure 6). Hosmer-Lemeshow test results yielded a P-value of 0.386 in the training cohort and 0.412 in the external validation cohort (both P>0.05), confirming robust calibration of the model.
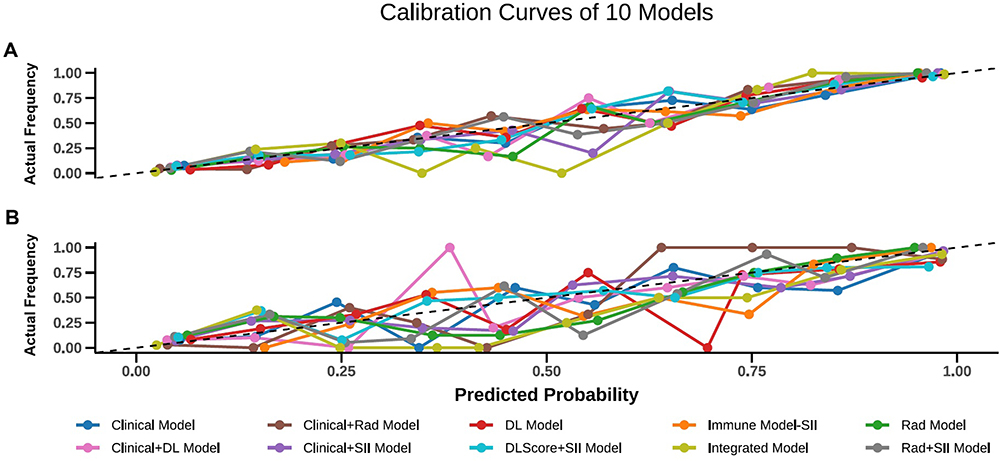 |
Figure 6 Calibration curves of the integrated model in the training cohort (A) and external validation cohort (B). The abscissa represents the model-predicted ALNM probability, the ordinate represents the observed ALNM positive rate. Points represent the group-level average predictions, colored curves represent calibration curves, and the diagonal dashed line represents ideal calibration. Abbreviation: ALNM, axillary lymph node metastasis. |
Decision Curve Analysis
DCA demonstrated that in both the internal and external validation cohorts, the combined models (Integrated and Clinical + Radiomic) yielded significantly higher net clinical benefits than the standalone Clinical and Clinical + Deep learning models across a critical decision threshold range of 0.1–0.5 (Figure 7). At the clinically relevant threshold of 0.3, the net clinical benefits of the Integrated and Clinical + Radiomic models were comparable (internal validation cohort: 0.405 vs 0.406; external validation cohort: 0.381 vs 0.366), and both were significantly higher than that of the standalone Clinical model (internal validation cohort: 0.357; external validation cohort: 0.329).
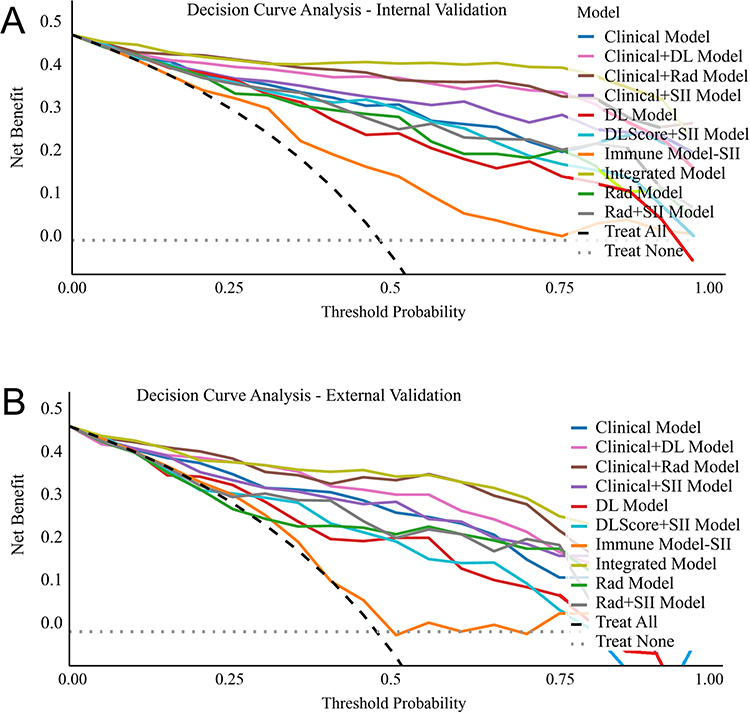 |
Figure 7 Decision curve analysis of 10 predictive models. (A) shows the training cohort, and (B) shows the external validation cohort. The abscissa represents the threshold probability, and the ordinate represents the clinical net benefit. Colored curves represent predictive models, the black dashed line represents the treat-all strategy, and the gray dashed line represents the treat-none strategy. |
The Integrated model exhibited the most stable net clinical benefit across the two cohorts, with the smallest reduction magnitude. This indicates that the combined models—particularly the Integrated model—can effectively balance the risks of missed diagnosis and overtreatment, and thus exhibit reliable clinical utility across diverse clinical decision-making scenarios.
Discussion
Accurate assessment of axillary lymph node metastasis (ALNM) status is a cornerstone of personalized treatment decision-making for patients with breast cancer. Using a dual-center retrospective cohort design, the present study systematically developed and validated 10 predictive models for stratifying ALNM risk in breast cancer patients. Study results demonstrated that the Integrated model—incorporating clinical features, SII, and DCE-MRI-derived multimodal features (RadScore and DLScore)—was significantly superior to single-modality and dual-factor combined models in terms of predictive performance, generalizability, and net clinical benefit, while also exhibiting excellent calibration and clinical utility. This model thus represents a novel, effective non-invasive tool for preoperative ALNM risk prediction, and provides robust empirical evidence for the clinical application of multi-dimensional data integration strategies in breast cancer diagnosis and management.
First, univariate logistic regression analysis was conducted to identify potential predictive factors for ALNM. Study results identified 10 variables—including age, MTD, SAD_ALN, NLR, PLR, MLR, WLR, SII, RadScore, and DLScore—that were significantly associated with ALNM (all P<0.05). These findings indicate that these variables may serve as robust predictive factors for ALNM, providing a valuable foundation for the subsequent simplification of clinical predictive models.19–21 During the feature selection phase, the optimal feature combination—comprising RadScore, SAD_ALN, DLScore, MTD, SII, and age—yielded the highest mean AUC in cross-validation, which further validates the critical importance of multi-dimensional feature complementarity in predictive model development.
Notably, both RadScore and DLScore are DCE-MRI-derived features: RadScore captures tumor morphological heterogeneity, angiogenic activity, and local invasive potential via high-throughput quantitative texture feature extraction, while DLScore achieves this through the autonomous recognition of complex imaging patterns via deep learning algorithms. This multi-modal imaging approach effectively mitigates the subjective limitations inherent to traditional visual image interpretation.20,22,23 As a key morphological index for routine clinical assessment of axillary lymph nodes, SAD_ALN directly reflects structural alterations in lymph nodes and serves as a simple surrogate marker for ALNM. While a short-axis diameter >1 cm is the clinically accepted threshold for malignant lymph node metastasis, its limited sensitivity and specificity predispose to risks of missed diagnosis and misdiagnosis—further underscoring the necessity of multi-parameter integration in ALNM risk assessment.24,25 In contrast, MTD is strongly correlated with tumor burden and invasive potential: a larger tumor size is associated with an increased risk of basement membrane invasion and subsequent lymphatic metastasis.26,27
Age emerged as a protective factor in the present study (OR=0.95), indicating that younger patients with breast cancer face an elevated risk of ALNM. This finding is consistent with existing clinical evidence that younger breast cancer patients typically exhibit more aggressive biological behavior, including higher pathological grade and increased invasiveness.28,29 Furthermore, SII—a comprehensive inflammatory biomarker that integrates peripheral blood neutrophil, lymphocyte, and platelet counts—reflects the systemic immune-inflammatory microenvironment. Elevated SII levels indicate a pro-inflammatory microenvironment predominance and concomitant suppression of anti-tumor immune function. Notably, chronic inflammation is a well-documented key driver of tumor metastasis,19,21,30 which supports the inclusion of SII in ALNM risk prediction models.
The main finding of this study is that multimodal integration improved ALNM prediction beyond any single information source. The Integrated model achieved AUCs of 0.972 and 0.942 in the training and external validation cohorts, respectively, with favorable calibration and clinical net benefit. This performance likely reflects the complementary value of macroscopic clinical assessment, systemic immune-inflammatory status, and quantitative DCE-MRI phenotypes. However, the high AUC should be interpreted cautiously because the sample size was modest; the external validation cohort supports generalizability but does not replace prospective validation.
In contrast, standalone clinical models are limited by subjective judgment and the crudeness of indicators, while single SII models fail to reflect local tumor invasive characteristics. Models relying solely on radiomics or deep learning overlook the influence of systemic immune-inflammatory background and patients’ baseline characteristics.5,24,31–33 Existing studies have also indicated that methods based solely on radiomics or deep learning have inherent limitations in ALNM prediction, and there is an urgent need to integrate clinical and systems biology information to optimize performance.23,24 The integrated model in this study makes up for the above deficiencies by fusing multi-source information, and its excellent performance verifies the feasibility and superiority of the multi-dimensional integration strategy.
Additionally, the incidence of ALNM was highly consistent between the training (47.17%) and external validation (47.11%) cohorts. Moreover, the validation cohort was derived from medical institutions of different levels across distinct geographic regions, which further validates the robustness and cross-center applicability of the model, laying a solid foundation for its clinical translation. During the construction of RadScore and DLScore, the reliability of imaging feature extraction was ensured by an ICC > 0.75. Furthermore, LASSO regression and mRMR algorithms were employed for feature dimensionality reduction, which effectively avoided multicollinearity issues and improved the stability and interpretability of the model.24,34,35 This workflow strictly adheres to standardized radiomics research protocols, which helps reduce biases caused by equipment differences or operational heterogeneity and enhances the translational value of the model in real-world clinical settings.24
Research Innovations and Advantages
Compared with existing similar studies, the main advantages of this study are as follows: Firstly, this study involved the establishment of a “clinical-inflammation-multimodal imaging” tripartite integrated framework. This study integrated clinical features, SII, and DCE-MRI-derived RadScore and DLScore within a single framework, enabling joint modeling from “patient baseline - systemic immune-inflammatory status - local imaging phenotype”9 This multi-dimensional information fusion significantly improves the accuracy of ALNM prediction and fully captures the biological characteristics of ALNM.
Second advantage is the adoption of a dual-center external validation design to ensure model generalization. The cohort design across different geographic regions and medical institutions effectively avoids single-center selection bias and validates the cross-center applicability of the model, making the research results more reliable and clinically promotable.
Thirdly, the systematic comparison of ten models improves clinical interpretability and flexibility. Institutions with limited imaging post-processing resources may use simpler clinical or clinical-plus-SII models for preliminary risk screening, whereas tertiary centers with radiomics/DL infrastructure may apply the integrated model for more precise preoperative assessment. In practice, the model could be embedded into a radiology workflow after DCE-MRI acquisition, with automated preprocessing, feature extraction, and risk reporting to support decisions regarding sentinel lymph node biopsy, axillary ultrasound-guided biopsy, and individualized surgical planning. Implementation will require standardized imaging protocols, software integration, cost evaluation, and prospective assessment of decision thresholds.
Study Limitations
Despite these strengths, this study has several limitations. First, the retrospective study design may introduce selection bias, and the 2016–2025 study period may introduce heterogeneity from changes in imaging practice, pathology workflow, and clinical guidelines. Standardized preprocessing and external validation partially reduce this concern but cannot eliminate it.
Second, the sample size of the training (n=212) and validation (n=121) cohorts were limited, resulting in wide 95% CI for some estimates, especially inflammatory markers such as MLR. Although the final model met the conventional events-per-variable requirement and was externally validated, larger prospective datasets are needed to confirm stability and generalizability.
Third, there remains room for optimization in imaging and model design. Semi-automatic ROI delineation may introduce observer variability. The DL component used ResNet50 only and was not compared with other classic models eg., VGG16 and ResNet101). Future work should compare multiple backbones, develop automatic tumor, and lymph node segmentation, and apply harmonization or domain-adaptation methods across scanners.
Fourth, potential confounding factors were not fully incorporated. Molecular subtypes was compared at baseline but did not enter the final model, and lymphovascular invasion was excluded because it is a postoperative pathological variable and was incompletely available. Model interpretability was partly addressed by feature-importance analysis, but SHAP or other explanation methods were not performed. Future studies should include more complete clinicopathological covariates and formal interpretability analyses to clarify the biological contribution of each feature.
Future Research Directions
To address the limitations of this study, future research will be conducted in three aspects: methodological optimization, mechanistic exploration, and clinical translation. First perspective is to conduct prospective, multi-center large-sample studies by expanding the sample size, including populations with different tumor stages, pathological subtypes and molecular types, and performing prospective validation to evaluate the long-term predictive efficacy and clinical benefits of the model.
Secondly, the imaging processing and modeling workflows could be optimized by exploring automatic ROI segmentation algorithms to eliminate subjective biases in manual delineation, comparing the performance of different deep learning architectures to select the optimal model, and developing cross-device domain adaptation and stricter feature standardization strategies to enhance the real-world applicability of the model across different MRI scanners and institutions.
Third perspective is to develop personalized predictive models and explore molecular mechanisms by constructing subtype-specific ALNM predictive models for different breast cancer molecular subtypes (Luminal A, Luminal B, HER2-positive, triple-negative) to improve the prediction accuracy for specific populations and combining multi-omics data (genomics, transcriptomics, proteomics) to investigate the molecular mechanisms underlying ALNM and clarify the biological significance of key features in the model. Additionally, we shall develop lightweight clinical tools (web-based versions/APPs) for the integrated model, conduct clinical controlled trials to confirm their application value, and extend the model to predict lymph node metastasis in other solid tumors.
Conclusion
In conclusion, this study developed and externally validated an integrated model combining clinical features, SII, and DCE-MRI-derived radiomics and DL features for preoperative ALNM prediction in breast cancer. The model showed strong discrimination, good calibration, and stable clinical net benefit in a two-center retrospective cohort, suggesting value as a non-invasive adjunct for preoperative axillary risk stratification. Its use should be considered within clearly defined clinical thresholds and patient populations, and prospective multicenter validation, interpretability assessment, and workflow/cost evaluation are required before routine clinical implementation.
Data Sharing Statement
All data generated and analyzed during this study are included in the present manuscript. Additional data requests may be directed to the corresponding author upon reasonable request.
Ethics Approval and Consent to Participate
This study was a retrospective dual-center cohort study conducted in strict accordance with the Declaration of Helsinki. The study protocol was approved by the Ethics Committee of Ganzhou Maternal and Child Health Hospital (Approval No.: 2025-LunShenLin-111). Written informed consent from all participants was waived by the ethics committee due to the retrospective study design.
Acknowledgments
The authors thank Peng He, Biostatistician, for his valuable guidance in the statistical analysis of this study and manuscript preparation.
Author Contributions
All authors made a significant contribution to the work reported, whether that is in the conception, study design, execution, acquisition of data, analysis and interpretation, or in all these areas; took part in drafting, revising or critically reviewing the article; gave final approval of the version to be published; have agreed on the journal to which the article has been submitted; and agree to be accountable for all aspects of the work.
Funding
This work was supported by the XZHMU-QL Joint Research Fund (Grant No.: QL-YB035) and the China International Medical Exchange Foundation (Grant No.: Z-2014-08-2309-6).
Disclosure
The authors declare that they have no known competing financial interests or personal relationships that could have appeared to influence the work reported in this paper.
References
1. Eldaly AS, Avila FR, Torres-Guzman RA, et al. Radiomics and artificial intelligence in predicting axillary lymph node metastasis in breast cancer: a systematic review. Curr Med Imaging. 2023;19(6):564–17. doi:10.2174/1573405618666220822093226
2. Zheng B, Chen Q. Novel model based on ultrasound predict axillary lymph node metastasis in breast cancer. BMC Med Imaging. 2023;23(1):135. doi:10.1186/s12880-023-01090-7
3. Chen J, Zhao M, Dong Z, et al. Integration of multi-imaging technique and immunohistochemistry for the development of a predictive nomogram for axillary lymph node metastasis in breast cancer. Front Endocrinol. 2025;16:1659639. doi:10.3389/fendo.2025.1659639
4. Wu T, Long Q, Zeng L, et al. Axillary lymph node metastasis in breast cancer: from historical axillary surgery to updated advances in the preoperative diagnosis and axillary management. BMC Surg. 2025;25(1):81. doi:10.1186/s12893-025-02802-2
5. Wang S, Wang D, Wen X, et al. Construction and validation of a nomogram prediction model for axillary lymph node metastasis of cT1 invasive breast cancer. Eur J Cancer Prev. 2024;33(4):309–320. doi:10.1097/CEJ.0000000000000860
6. Wang J, Ben Z, Gao S, et al. The role of ultrasound elastography and virtual touch tissue imaging in the personalized prediction of lymph node metastasis of breast cancer. Gland Surg. 2021;10(4):1460–1469. doi:10.21037/gs-21-199
7. Bai G, Zhong X, Wu Y, et al. Predicting axillary lymph node metastasis in breast cancer using ultrasound and machine learning with SHAP. Cancer Manag Res. 2025;17:2183–2197. doi:10.2147/CMAR.S542680
8. Zhang J, Shi X, Xiao Y, et al. Early SUV(max) is the best predictor of axillary lymph node metastasis in stage III breast cancers. Quant Imaging Med Surg. 2021;11(5):1680–1691. doi:10.21037/qims-20-423
9. Gunes A, Colapkulu-Akgul N, Akgul C, et al. Axillary staging with 18F-FDG PET/CT in early breast cancer: impact of tumor subtypes. Ann Saudi Med. 2025;45(3):145–153. doi:10.5144/0256-4947.2025.145
10. Shang Y, Wang Y, Guo Y, et al. The clinical study of intratumoral and peritumoral radiomics based on DCE-MRI for HER-2 positive and low expression prediction in breast cancer. Breast Cancer Targets Ther. 2024;16:957–972. doi:10.2147/BCTT.S497770
11. Song D, Yang F, Zhang Y, et al. Dynamic contrast-enhanced MRI radiomics nomogram for predicting axillary lymph node metastasis in breast cancer. Cancer Imaging. 2022;22(1):17. doi:10.1186/s40644-022-00450-w
12. Zhang D, Zhou W, Lu WW, et al. Ultrasound-based deep learning radiomics for enhanced axillary lymph node metastasis assessment: a multicenter study. Oncologist. 2025;30(5). doi:10.1093/oncolo/oyaf052
13. He X, Liao Y, Zhang S, et al. Predicting axillary lymph node metastasis in small breast cancers using convolutional neural networks for multiparametric magnetic resonance imaging (MRI). Clin Radiol. 2025;91:107026. doi:10.1016/j.crad.2025.107026
14. Cakan Demirel B, Tas S, Guclu Kantar T, et al. Prognostic value of systemic inflammatory markers in locally advanced or metastatic melanoma: a real-world analysis. Cancers. 2026;18(3):420. doi:10.3390/cancers18030420
15. Xiong J, Zhang D, Yuan Y, et al. Association between systemic immune-inflammation index and female breast cancer based on NHANES data (2001-2018): a cross-sectional study. PLoS One. 2025;20(9):e0330571. doi:10.1371/journal.pone.0330571
16. Pang J, Ding N, Yin N, et al. Systemic immune-inflammation index as a prognostic marker in HER2-positive breast cancer patients undergoing trastuzumab therapy. Sci Rep. 2024;14:6578. doi:10.1038/s41598-024-57343-0
17. Li Y, Fei Y. The predictive value of serum NLR, SII, and OPNI for lymph node metastasis in breast cancer patients with internal mammary lymph nodes after thoracoscopic surgery. Open Life Sci. 2024;19(1):20220763. doi:10.1515/biol-2022-0763
18. You J, Guo Y, Kang JJ, et al. Development of machine learning-based models to predict 10-year risk of cardiovascular disease: a prospective cohort study. Stroke Vasc Neurol. 2023;8(6):475–485. doi:10.1136/svn-2023-002332
19. Morkavuk SB, Kocaoz S, Korukluoglu B. Diagnostic value of Platelet/lymphocyte Ratio (PLR) for predicting sentinel axillary lymph node positivity in early-stage breast cancer compared with ultrasonography. Int J Clin Pract. 2021;75(12):e14939. doi:10.1111/ijcp.14939
20. Gao J, Zhong X, Li W, et al. Attention-based deep learning for the preoperative differentiation of axillary lymph node metastasis in breast cancer on DCE-MRI. J Magn Reson Imaging. 2023;57(6):1842–1853. doi:10.1002/jmri.28464
21. Wang H, Yu J, Shen W, et al. The ratio of lymphocyte/red blood cells and platelets/lymphocytes are predictive biomarkers for lymph node metastasis in patients with breast cancer. Cancer Biomark. 2023;38(4):595–602. doi:10.3233/CBM-220260
22. Tang Y, Che X, Wang W, et al. Radiomics model based on features of axillary lymphatic nodes to predict axillary lymphatic node metastasis in breast cancer. Med Phys. 2022;49(12):7555–7566. doi:10.1002/mp.15873
23. Wang YW, Chen X, Tian Y, et al. Decreased Expression of circ_0000160 in breast cancer with axillary lymph node metastasis. Front Mol Biosci. 2021;8:690826. doi:10.3389/fmolb.2021.690826
24. Zhao X, Wang M, Wei Y, et al. Overview of multimodal radiomics and deep learning in the prediction of axillary lymph node status in breast cancer. Acad Radiol. 2025;32(11):6623–6641. doi:10.1016/j.acra.2025.07.017
25. Toshima K, Shien T, Nishimura MF, et al. Ectopic breast cancer arising within an axillary lymph node. Acta Med Okayama. 2024;78(1):89–93. doi:10.18926/AMO/66676
26. Chatmongkonwat T, Phool W, Ruengwongroj P, et al. Prediction of axillary lymph node metastasis using tumor volume to breast volume ratio: retrospective cohort study. Ann Med Surg Lond. 2024;86(1):69–72. doi:10.1097/MS9.0000000000001481
27. Wang SR, Tian F, Zhu T, et al. Machine learning-driven ultrasound radiomics for assessing axillary lymph node burden in breast cancer. Front Endocrinol. 2025;16:1548888. doi:10.3389/fendo.2025.1548888
28. Shen Y, Huang R, Zhang Y, et al. Prediction of axillary lymph node metastasis in triple negative breast cancer using MRI radiomics and clinical features. Sci Rep. 2025;15:21923. doi:10.1038/s41598-025-08001-6
29. Choi HJ, Ryu JM, Chae BJ, et al. Is sentinel lymph node biopsy for breast cancer with cytology-proven axillary metastasis safe? A prospective single-arm study. J Clin Med. 2021;10(20):4754. doi:10.3390/jcm10204754
30. Zhang L, Jia Z, Leng X, et al. Artificial intelligence algorithm-based ultrasound image segmentation technology in the diagnosis of breast cancer axillary lymph node metastasis. J Healthc Eng. 2021;2021:8830260. doi:10.1155/2021/8830260
31. Ke Z, Shen L, Shao J. Early warning of axillary lymph node metastasis in breast cancer patients using multi-omics signature: a machine learning-based retrospective study. Int J Gen Med. 2024;17:6101–6114. doi:10.2147/IJGM.S499238
32. Qiu Y, Zhang X, Wu Z, et al. MRI-based radiomics nomogram: prediction of axillary non-sentinel lymph node metastasis in patients with sentinel lymph node-positive breast cancer. Front Oncol. 2022;12:811347. doi:10.3389/fonc.2022.811347
33. Cirocchi R, Amabile MI, De Luca A, et al. New classifications of axillary lymph nodes and their anatomical-clinical correlations in breast surgery. World J Surg Oncol. 2021;19(1):93. doi:10.1186/s12957-021-02209-2
34. Chen H, Meng X, Hao X, et al. Correlation analysis of pathological features and axillary lymph node metastasis in patients with invasive breast cancer. J Immunol Res. 2022;2022:7150304. doi:10.1155/2022/7150304
35. Hu J, Xia X, Yang H, et al. Dissection of level III axillary lymph nodes in breast cancer. Cancer Manag Res. 2021;13:2041–2046. doi:10.2147/CMAR.S290345
 © 2026 The Author(s). This work is published and licensed by Dove Medical Press Limited. The
full terms of this license are available at https://www.dovepress.com/terms
and incorporate the Creative Commons Attribution
- Non Commercial (unported, 4.0) License.
By accessing the work you hereby accept the Terms. Non-commercial uses of the work are permitted
without any further permission from Dove Medical Press Limited, provided the work is properly
attributed. For permission for commercial use of this work, please see paragraphs 4.2 and 5 of our Terms.
© 2026 The Author(s). This work is published and licensed by Dove Medical Press Limited. The
full terms of this license are available at https://www.dovepress.com/terms
and incorporate the Creative Commons Attribution
- Non Commercial (unported, 4.0) License.
By accessing the work you hereby accept the Terms. Non-commercial uses of the work are permitted
without any further permission from Dove Medical Press Limited, provided the work is properly
attributed. For permission for commercial use of this work, please see paragraphs 4.2 and 5 of our Terms.
Recommended articles
Early Warning of Axillary Lymph Node Metastasis in Breast Cancer Patients Using Multi-Omics Signature: A Machine Learning-Based Retrospective Study
Ke Z, Shen L, Shao J
International Journal of General Medicine 2024, 17:6101-6114
Published Date: 12 December 2024
Predicting Axillary Lymph Node Metastasis in Breast Cancer Using Ultrasound and Machine Learning with SHAP
Bai G, Zhong X, Wu Y, Lin W, Zhou S, Zhou P
Cancer Management and Research 2025, 17:2183-2197
Published Date: 26 September 2025
Artificial Intelligence in Breast Cancer Diagnosis and Surgical Decision-Making: An Updated and Comprehensive Overview of Precision and Personalization in Current Evidence
Alenezi AM
Cancer Management and Research 2025, 17:2261-2275
Published Date: 30 September 2025
Development and Validation of Machine Learning Models in Predicting Prognosis of Breast Cancer Patients with Lymph Nodes Metastasis Following Neoadjuvant Chemotherapy
Fan Y, Jin Y, Tian C, Zhang Y, Zhang C, Yu H, Liu S
Breast Cancer: Targets and Therapy 2025, 17:883-896
Published Date: 30 September 2025
Deep Learning Radiomics of Multiparametric MRI for Individualized Prediction of Axillary Lymph Node Response After Neoadjuvant Chemotherapy in Breast Cancer
Li S, Li R, Xu M, Liao J, Cao Z, Gong B, Yan F, Wang M, Tan H
Breast Cancer: Targets and Therapy 2026, 18:568337
Published Date: 21 January 2026