Back to Journals » Cancer Management and Research » Volume 17

Predicting Axillary Lymph Node Metastasis in Breast Cancer Using Ultrasound and Machine Learning with SHAP
Authors Bai G, Zhong X, Wu Y, Lin W, Zhou S, Zhou P
Received 25 May 2025
Accepted for publication 13 September 2025
Published 26 September 2025 Volume 2025:17 Pages 2183—2197
DOI https://doi.org/10.2147/CMAR.S542680
Checked for plagiarism Yes
Review by Single anonymous peer review
Peer reviewer comments 2
Editor who approved publication: Dr Sanjeev K. Srivastava
Gengyan Bai, Xiaohong Zhong, Youping Wu, Weijie Lin, Shoulan Zhou, Ping Zhou
Department of Ultrasound, Women and Children’s Hospital, School of Medicine, Xiamen University, Xiamen, Fujian, People’s Republic of China
Correspondence: Xiaohong Zhong, Email [email protected]
Background: Accurate preoperative prediction of axillary lymph node (ALN) metastasis in breast cancer is crucial for surgical planning and reducing morbidity. Conventional ultrasound and Doppler methods are limited by subjectivity, while existing machine learning (ML) models often lack interpretability and multi-center validation.
Aim: To evaluate 11 ML algorithms and develop a validated model integrating ultrasound and Doppler features for ALN metastasis prediction, using SHapley Additive exPlanations (SHAP) for interpretability.
Methods: This retrospective dual-center study included 303 patients from Xiamen (internal cohorts: 212 training, 91 validation) and 102 from Longyan (external validation). Features were extracted from preoperative ultrasound and Doppler images. Recursive feature elimination (RFE) and SHAP selected key predictors. Gradient Boosting was identified as optimal and compared to B-mode/Doppler submodels and clinicopathological scores (Logical, Tumor, Tenon). Performance was assessed via AUC, calibration, decision curve analysis (DCA), and a web calculator was developed.
Results: Five features—tumor diameter, cortex-to-hilum ratio, lymph node systolic/diastolic ratio, peak systolic velocity, and end-diastolic velocity—were selected. The combined model achieved AUCs of 0.981 (training), 0.975 (internal validation), and 0.987 (external validation), outperforming scores (AUCs 0.517– 0.700). It showed superior calibration (Brier scores 0.045– 0.061) and net benefit in DCA.
Conclusion: The Gradient Boosting model with SHAP provides accurate, interpretable ALN metastasis prediction, supporting noninvasive risk stratification and personalized breast cancer management.
Keywords: breast cancer, axillary lymph node metastasis, ultrasound, doppler ultrasound, machine learning, SHapley Additive exPlanations
Introduction
Breast cancer remains the most common malignancy among women worldwide, posing a significant public health challenge. In 2022, approximately 2.3 million new cases were diagnosed globally, resulting in 670,000 deaths, underscoring the urgent need for improved diagnostic and prognostic strategies to reduce mortality and enhance patient outcomes.1
Axillary lymph node (ALN) metastasis represents a critical determinant of prognosis and treatment planning in breast cancer, as it correlates with increased risks of recurrence and poorer survival.2 Accurate preoperative assessment of ALN status guides surgical decisions, such as the choice between sentinel lymph node biopsy (SLNB) and axillary lymph node dissection (ALND), thereby minimizing morbidity while optimizing therapeutic efficacy.3
Imaging modalities, including ultrasound (US), computed tomography (CT), magnetic resonance imaging (MRI), and positron emission tomography (PET), are routinely employed for ALN evaluation.4 Among these, ultrasound stands out for its real-time capabilities, accessibility, and cost-effectiveness, making it a first-line tool in clinical practice.5 Conventional ultrasound relies on morphological criteria, such as cortical thickening, loss of fatty hilum, and nodal shape abnormalities, while Doppler ultrasound provides additional hemodynamic information through parameters like peak systolic velocity (PS), end-diastolic velocity (EDF), and systolic/diastolic ratio (SD).6
Recent advancements in artificial intelligence (AI) and machine learning (ML) have transformed medical imaging by enabling automated, quantitative analysis of complex patterns.7 ML models have demonstrated potential in predicting ALN metastasis by integrating radiomic features from ultrasound images, often outperforming traditional assessments.8 For instance, studies have developed nomograms combining ultrasound-derived features with clinical variables to enhance predictive accuracy.9 Furthermore, explainable AI techniques, such as SHapley Additive exPlanations (SHAP), provide interpretability by quantifying feature contributions, fostering clinical trust and adoption.10
Despite these advances, several limitations persist in current approaches. Conventional ultrasound interpretations are subjective and operator-dependent, leading to variability in sensitivity and specificity for detecting ALN metastasis, particularly in early-stage disease where micrometastases may be overlooked.11 Doppler ultrasound, while adding vascular information, suffers from overlapping features between benign and metastatic nodes, resulting in suboptimal diagnostic performance.12 Prior ML models, although achieving high accuracy (eg, AUCs of 0.85–0.92 in ultrasound-based predictions), often function as “black boxes”, lacking transparency in decision-making processes, which hinders their integration into clinical workflows.13 Moreover, most studies rely on single-center data, limiting generalizability and external validation, as evidenced by models developed on small cohorts without multi-institutional testing.14 Existing nomograms, such as the Memorial Sloan Kettering Cancer Center (MSKCC) and Tenon scores, primarily use clinicopathological factors and exhibit moderate performance (AUCs around 0.70–0.75), highlighting the need for more robust, noninvasive imaging-based alternatives.15 Additionally, few models incorporate comprehensive external validation or combine ultrasound with Doppler features in a multi-center setting, leaving gaps in reproducibility and real-world applicability.16 These shortcomings emphasize the necessity for interpretable, validated models that leverage noninvasive modalities to support precise, personalized risk stratification.
This study aims to evaluate multiple machine learning algorithms and develop a validated model integrating ultrasound and Doppler features for preoperative prediction of axillary lymph node (ALN) metastasis in breast cancer patients, with Gradient Boosting selected as the optimal method and SHapley Additive exPlanations (SHAP) incorporated for interpretability. Specific objectives include: (1) extracting and selecting key imaging and clinicopathological features using recursive feature elimination (RFE) and SHAP; (2) constructing a combined model and comparing it against established scores (Logical, Tumor, and Tenon); (3) evaluating model performance across internal training, internal validation, and external validation cohorts from two centers using metrics such as AUC, sensitivity, specificity, calibration, and decision curve analysis; and (4) developing a web-based calculator for clinical application. We hypothesize that integrating ultrasound and Doppler features with ML and SHAP will yield superior predictive accuracy and interpretability compared to conventional models and scores, supporting noninvasive risk stratification and personalized treatment.
Materials and Methods
Study Population
This retrospective, dual-center study included consecutive breast cancer patients who underwent preoperative ultrasound and Doppler ultrasound at two institutions: Women and Children’s Hospital, School of Medicine, Xiamen University (Xiamen, China) and Longyan First Hospital (Longyan, China), from April 2018 to August 2024. Eligibility criteria were: (1) histologically confirmed primary breast cancer; (2) preoperative ultrasound and Doppler evaluation of the primary tumor and ipsilateral regional lymph nodes performed at one of the two centers; (3) axillary lymph node (ALN) status confirmed by surgical pathology; and (4) availability of complete clinical, ultrasound, and Doppler data. Exclusion criteria were: (1) receipt of neoadjuvant therapy before imaging; (2) incomplete imaging or clinical data; (3) poor image quality precluding reliable measurements; and (4) distant metastasis at diagnosis.
Ethical approval was obtained from the Institutional Review Board of Women and Children’s Hospital, School of Medicine, Xiamen University [KY-2025-046-K01]. Informed consent was waived due to the retrospective nature of the study, which posed minimal risk to participants and involved only anonymized data. All patient data were handled with strict confidentiality, and the study complied with the principles outlined in the Declaration of Helsinki. For model development and validation, cases from Xiamen were randomly partitioned into an internal training set (70%) and an internal validation set (30%), while the independent cohort from Longyan First Hospital was used for external validation. The patient inclusion flow is shown in Figure 1.
 |
Figure 1 Patient inclusion flow. |
Demographics and Clinical Data
Demographic information, including age, menopausal status, and tumor location, was collected from the patients’ medical records. Clinical data encompassed histological grade, histological type, progesterone receptor (PR) status, human epidermal growth factor receptor 2 (Her2) status, Ki-67 index, p53 status, and vascular endothelial growth factor-C (VEGF-C) status. These parameters were obtained through pathological examination of surgical specimens or biopsy samples. Pathological diagnoses were independently conducted by two experienced pathologists. In cases where their interpretations differed, a third senior pathologist was consulted to participate in a joint review and discussion to reach a final consensus diagnosis.
Ultrasound and Doppler Ultrasound Examination
All ultrasound examinations were performed using high-resolution ultrasound systems equipped with Doppler capabilities (Philips EPIQ 7, with L18-4 linear probe) at two participating centers: Women and Children’s Hospital, School of Medicine, Xiamen University, Xiamen, China, and Longyan First Hospital, Longyan, China. To ensure consistency across centers, imaging followed a standardized protocol developed collaboratively between the sites, with all examinations conducted by experienced radiologists blinded to pathological outcomes. For each patient, both the breast tumor and the ipsilateral axillary lymph nodes (ALNs) were assessed in a uniform manner, including B-mode grayscale imaging for morphological evaluation and color/pulsed-wave Doppler for hemodynamic assessment.
To mitigate potential operator dependency in feature extraction, radiologists at both centers underwent joint training sessions on the protocol, emphasizing standardized probe positioning, gain settings, and measurement techniques. All ultrasound interpretations were independently reviewed by two experienced radiologists (one from each center when possible). In cases of discordant interpretations, a third senior radiologist was consulted, and a consensus interpretation was reached through joint discussion and review of archived images.
Features were extracted using predefined measurement protocols for reproducibility:
·Cortical and medullary areas (cm²): On grayscale images, cortical and medullary regions were manually outlined using the system’s caliper tool. Boundaries were defined based on echogenicity differences (hypoechoic cortex versus hyperechoic medulla with a clear demarcation line). Areas were calculated automatically by the software, and the cortex-to-medulla ratio (CH) was derived. Three measurements were averaged per lymph node to account for variability.
Peak systolic flow velocity (PS, cm/s): Measured using pulsed-wave Doppler within the tumor and lymph nodes, targeting the most prominent vessel. Three Doppler waveforms were analyzed per node, with insonation angle correction maintained at ≤45° to minimize velocity estimation errors.
End-diastolic flow velocity (EDF, cm/s): Assessed from the same Doppler spectra as PS, at the end-diastolic phase, with averaging across three waveforms per node and angle correction ≤45°.
Systolic/diastolic velocity ratio (SD ratio): Calculated as the ratio of PS to EDF, reflecting vascular resistance, derived from averaged measurements.
Resistance index (RI) and pulsatility index (PI): Automatically computed by the ultrasound machine from the Doppler spectra, using standard formulas (RI = (PS - EDF)/PS; PI = (PS - EDF)/mean velocity).
All ultrasound interpretations and quantitative measurements were independently reviewed by two experienced radiologists at each center. If discrepancies occurred, a third senior radiologist adjudicated, and a consensus was reached through joint discussion. Interobserver variability was rigorously evaluated for these key features. For continuous variables (eg, areas, velocities, ratios, indices), intraclass correlation coefficients (ICCs) ranged from 0.85 to 0.95 across a subset of 50 cases reviewed independently by radiologists from both centers, indicating excellent reproducibility. This, combined with the standardized protocol and consensus mechanism, effectively addressed operator dependency and enhanced the reliability of feature extraction.
Feature Extraction
Continuous variables such as flow velocities and areas were averaged across three measurements per lesion or lymph node. For categorical ultrasound features—shape regularity (yes/no), boundary clarity (clear/obscure), echo pattern (homogeneous/heterogeneous), calcification (yes/no), and presence of calcification (yes/no)—agreement was evaluated using Cohen’s kappa coefficient.
Model Comparison
To facilitate a comprehensive evaluation of our predictive model, we compared its performance with three previously published and clinically relevant models for axillary lymph node metastasis (ALNM) prediction, namely the models proposed by Qiu et al.9 Zhang et al17 and the Tenon score.15 These models were selected because their required predictor variables—such as tumor size, cortical thickness, hilum status, histologic grade, clinical tumor stage, and sentinel lymph node (SLN) status—were available in our dataset, enabling direct and fair comparison.
Qiu et al developed a multivariable logistic regression model based on sonographic and clinicopathologic features in early-stage breast cancer patients, named Logical Score. Key predictors included lymph node transverse diameter, cortical thickness, hilum absence, histologic grade, tumor size, and estrogen receptor (ER) status. The final model equation was: Logical Score = 0.063 × a + 0.277 × b + 1.420 × c + 1.502 × d1 + 2.090 × d2 + 0.305 × e + 0.379 × f − 5.710 where p is the probability of ALNM; a = lymph node transverse diameter (mm); b = cortical thickness (mm); c = hilum absence (0 = no, 1 = yes); d1 and d2 = histologic grade dummy variables (G2, G3; G1 as reference); e = tumor size (cm); f = ER score (0–3).
Zhang et al established a nationwide multi-center logistic regression model incorporating age, clinical T stage, tumor quadrant, local invasion, clinical nodal status, histologic type, and molecular subtype, named Tumor score. The model equation was: Tumor score = −0.014 × a + 0.204 × b2 + 0.663 × b3 − 0.944 × c1 − 0.529 × c2 − 1.444 × c3 − 0.237 × c4 − 0.642 × c5 + 0.768 × d + 1.235 × e + 2.944 × f1 + 2.884 × f2 + 2.111 × f3 + 0.322 × g1 + 0.141 × g2 − 2.483 where a = age; b2 and b3 = T2 and T3 stages (T1 as reference); c1–c5 = tumor location dummy variables (central, UIQ, UOQ, LIQ, LOQ, others); d = local invasion; e = clinical nodal status; f1–f3 = histologic type dummies; g1 and g2 = molecular subtype dummies.
The Tenon score is a point-based clinical tool designed to predict non-sentinel lymph node (non-SLN) involvement in patients with positive SLN, aiming to reduce unnecessary axillary lymph node dissection (ALND). It is calculated by summing three components: size of SLN metastasis (0 or 2 points), primary tumor size (0, 1.5, or 3 points), and the ratio of positive SLNs to total SLNs removed (0, 1, or 2 points). A total score ≤ 3.5 is generally considered low risk for non-SLN involvement.
For each of these models, the published coefficients or scoring rules were directly applied to our cohort to generate predicted probabilities or scores, enabling head-to-head performance comparison with our proposed model.
Statistical Analysis
Continuous variables were expressed as mean ± standard deviation (SD), while categorical variables were summarized as frequencies and percentages. Group differences between the training and validation cohorts, as well as between patients with and without lymph node metastasis, were evaluated using the Chi-square test or Fisher’s exact test for categorical variables and either the independent t-test or Mann–Whitney U-test for continuous variables, depending on data distribution. Interobserver reliability for continuous features was assessed using intraclass correlation coefficients (ICCs), while Cohen’s kappa statistics were applied to categorical variables. A two-sided p-value < 0.05 was considered statistically significant. All statistical analyses were conducted using Python (version 3.8), leveraging the scikit-learn and SHAP libraries.
Data from Xiamen Maternal and Child Health Hospital were randomly partitioned into an internal training set (70%) and an internal validation set (30%). Data from Longyan First Hospital served as an independent external validation set to assess generalizability across centers. The internal training set was utilized to develop and optimize a broad array of ML classifiers, including Logistic Regression (LR), Random Forest (RF), Gradient Boosting (GB), Support Vector Classifier (SVC), Decision Tree, K-Nearest Neighbors (KNN), Naive Bayes, Extreme Gradient Boosting (XGBoost), Light Gradient Boosting Machine (LightGBM), Ridge Classifier, Extra Trees, Adaptive Boosting (AdaBoost), and an ensemble Voting Classifier.
For the Gradient Boosting model, hyperparameter tuning was conducted exclusively within the internal training set using a grid search strategy combined with 10-fold cross-validation to ensure robust parameter optimization and avoid overfitting. The tuned parameters included the number of estimators (range: 50–500), learning rate (0.01–0.3), maximum tree depth (3–10), subsample ratio (0.6–1.0), and maximum features considered at each split (“sqrt” or “log2”). The area under the ROC curve (AUC-ROC) was used as the primary optimization metric.
Feature selection using recursive feature elimination (RFE) was performed only within the training folds of cross-validation to avoid data leakage. Specifically, RFE was applied after each training fold split, and the selected features were then used to fit the model on that fold’s training data. The validation fold remained completely unseen during feature selection and model training, ensuring unbiased evaluation.
Model performance was evaluated using multiple metrics: AUC-ROC, accuracy, sensitivity, specificity, positive predictive value (PPV), negative predictive value (NPV), precision, recall, and F1-score. The model exhibiting the highest AUC-ROC on the internal validation set was selected as the optimal predictive algorithm and subsequently evaluated on the external validation set from Longyan First Hospital. Additionally, the predictive performance of the ML models was benchmarked against traditional logistic regression models utilizing the same feature set.
To enhance model interpretability and facilitate clinical trust, SHAP values were computed. SHAP quantifies the contribution of each input feature to the final prediction at both the global and individual patient levels. Feature importance rankings, as well as interaction effects between key ultrasound and Doppler parameters, were visualized through summary and dependence plots, enabling deeper insights into the model’s decision-making process.
Result
Basic Information of All Patients
A total of 405 breast cancer patients were retrospectively enrolled in this study, including 212 in the internal training cohort, 91 in the internal validation cohort, and 102 in the external validation cohort. The mean age was similar across the three cohorts, and no statistically significant differences were observed in menopausal status, tumor location, body mass index, tumor diameter, multifocality, histological grade, pathological type, ER, PR, HER2 status, or Ki-67 index. Ultrasound parameters, including axillary lymph node short diameter, cortex thickness, cortex-to-hilum ratio, LNSD, LNPS, and LNEDF, as well as logical score, tumor score, and Tenon score, were also comparable among the three cohorts (all P > 0.05) (Table 1).
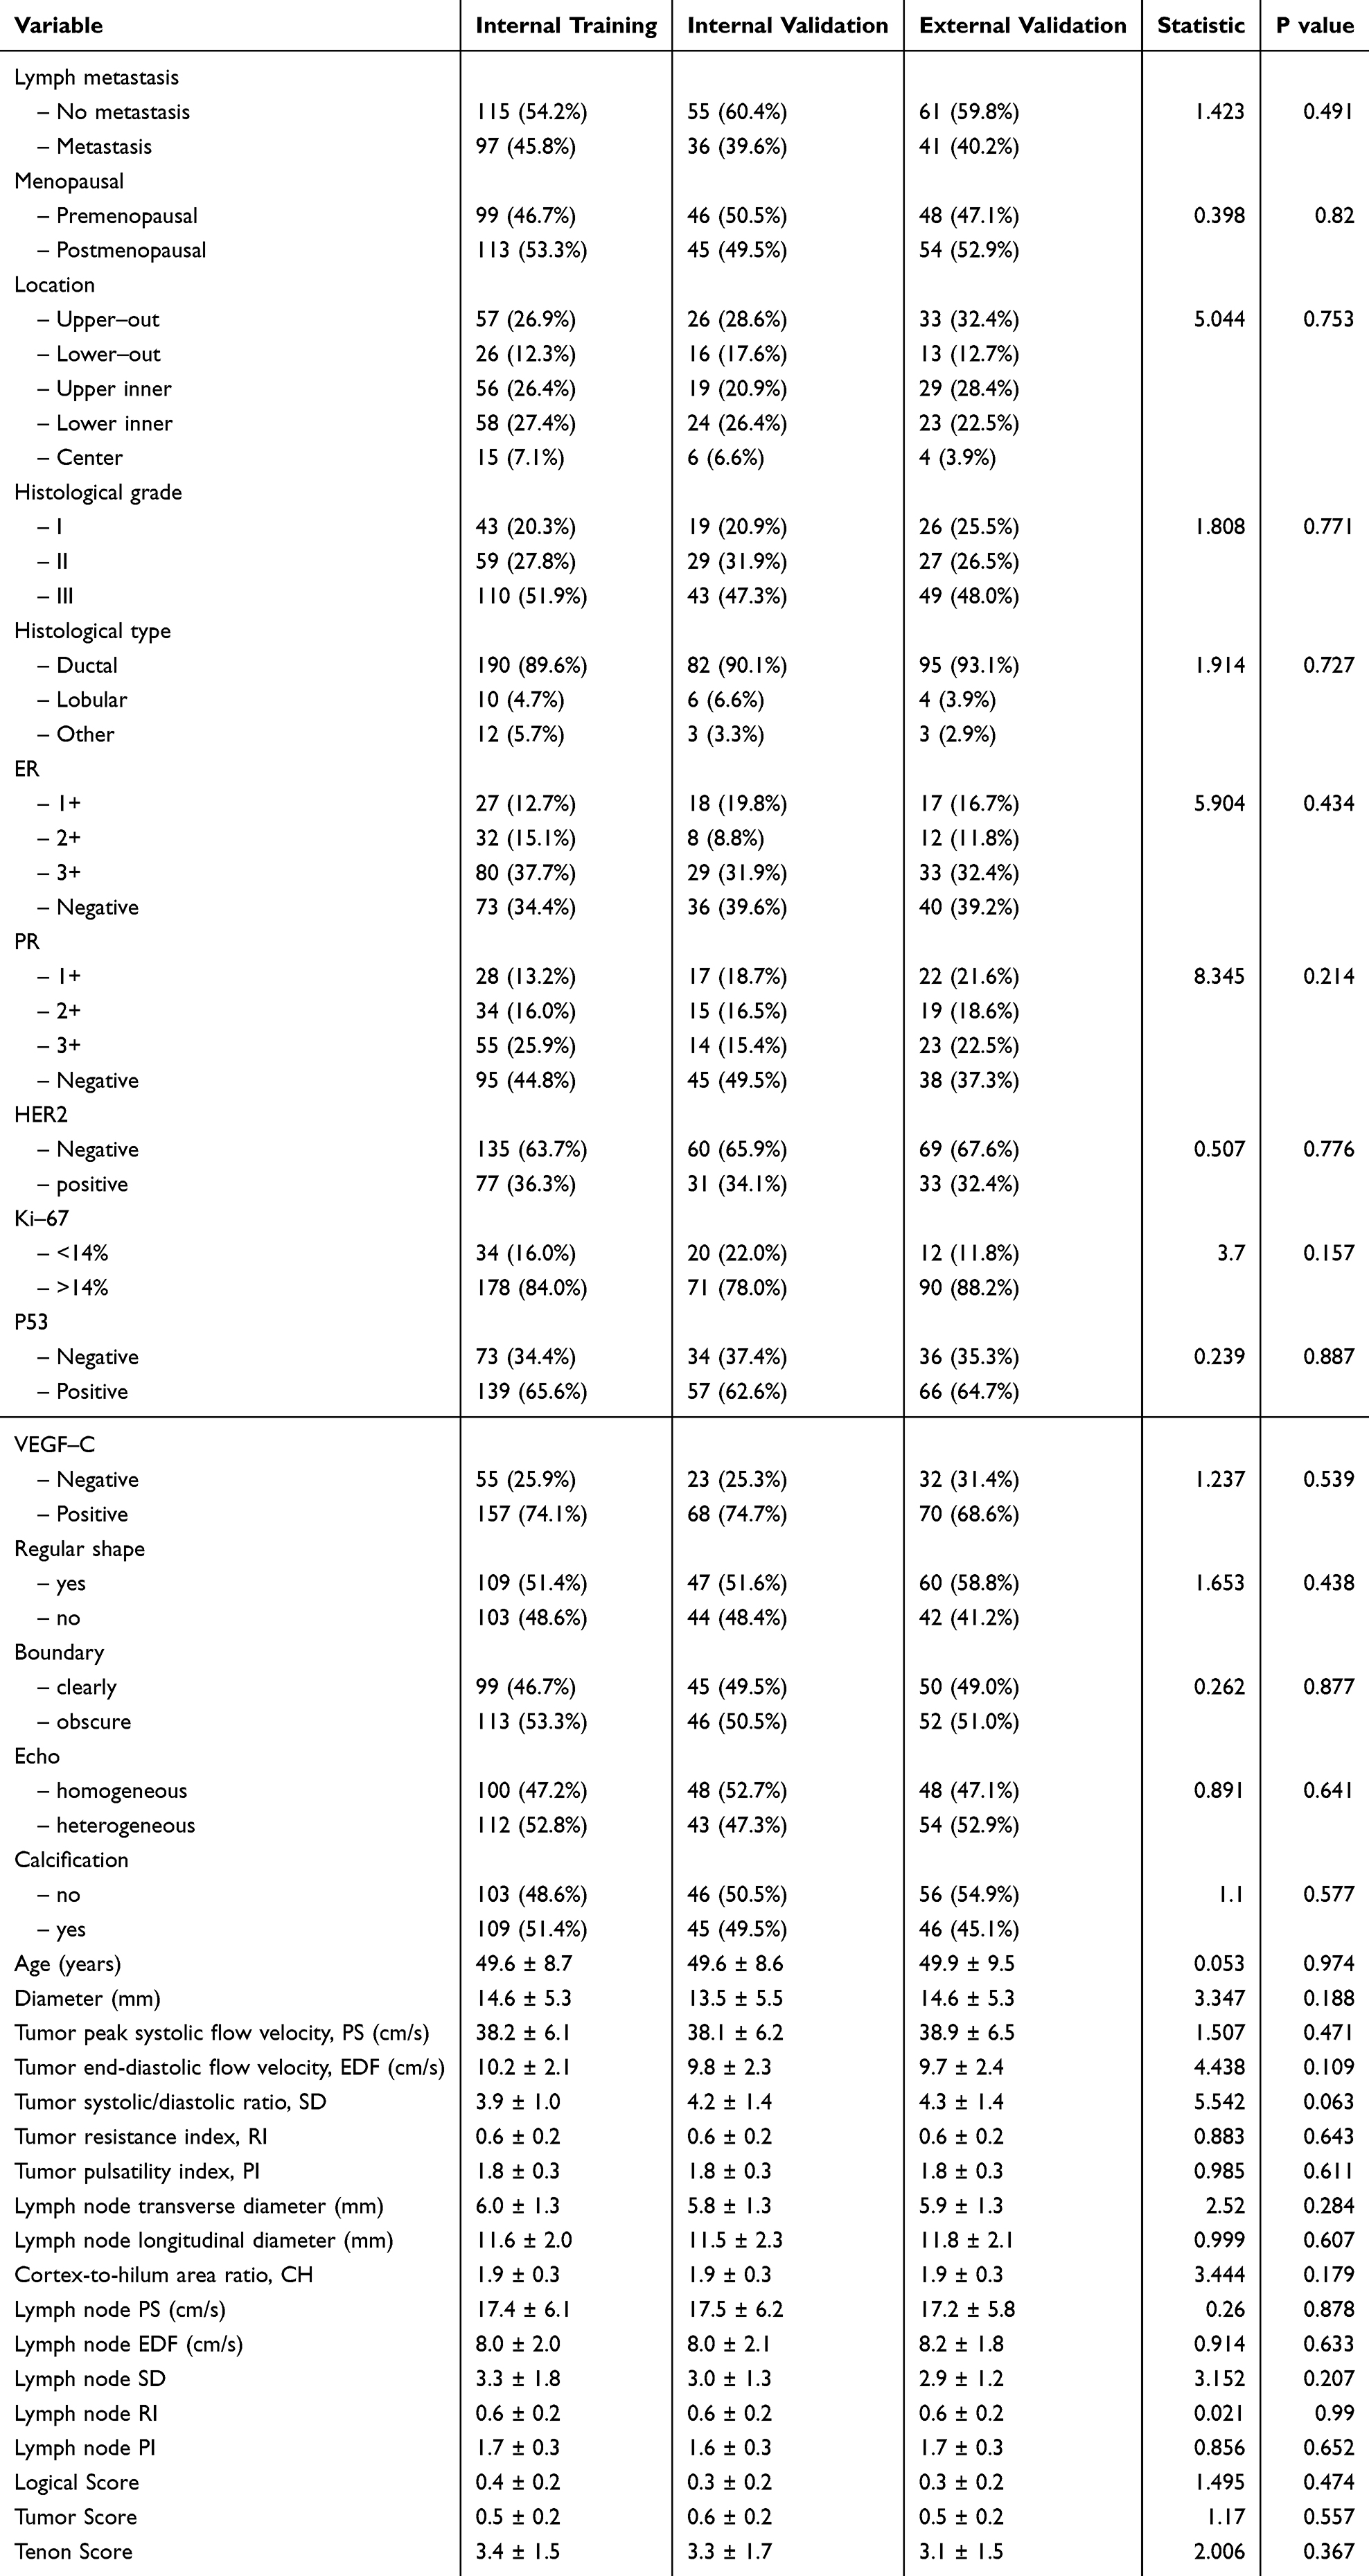 |
Table 1 Basic Characteristics of All Patients |
Information in Training Cohort
Table 2 presents the clinical and imaging characteristics of the training cohort, comparing patients with and without ALN metastasis. P53 positivity was 75.3% in the metastasis group and 57.4% in the no metastasis group (P=0.01). VEGF-C positivity was 87.6% in the metastasis group and 62.6% in the no metastasis group (P<0.001). Tumor diameter was 17.9 mm in the metastasis group and 11.9 mm in the no metastasis group (P<0.001). Lymph node transverse diameter was 6.3 mm in the metastasis group and 5.8 mm in the no metastasis group (P=0.006). Cortex-to-hilum area ratio (CH) was 2.0 in the metastasis group and 1.8 in the no metastasis group (P<0.001). Lymph node peak systolic velocity (PS) was 19.2 cm/s in the metastasis group and 15.9 cm/s in the no metastasis group (P<0.001). Lymph node systolic/diastolic ratio (SD) was 4.4 in the metastasis group and 2.4 in the no metastasis group (P<0.001). Logical Score was 0.4 in the metastasis group and 0.3 in the no metastasis group (P=0.02). Tenon Score was 3.8 in the metastasis group and 3.0 in the no metastasis group (P<0.001). Other characteristics, including age, menopausal status, tumor location, histologic grade and type, hormone receptor status (ER/PR), HER2 status, Ki-67 proliferation index, ultrasound features such as shape regularity, boundary clarity, echo homogeneity, calcification, and additional Doppler parameters (eg, EDF, RI, PI), had P values greater than 0.05.
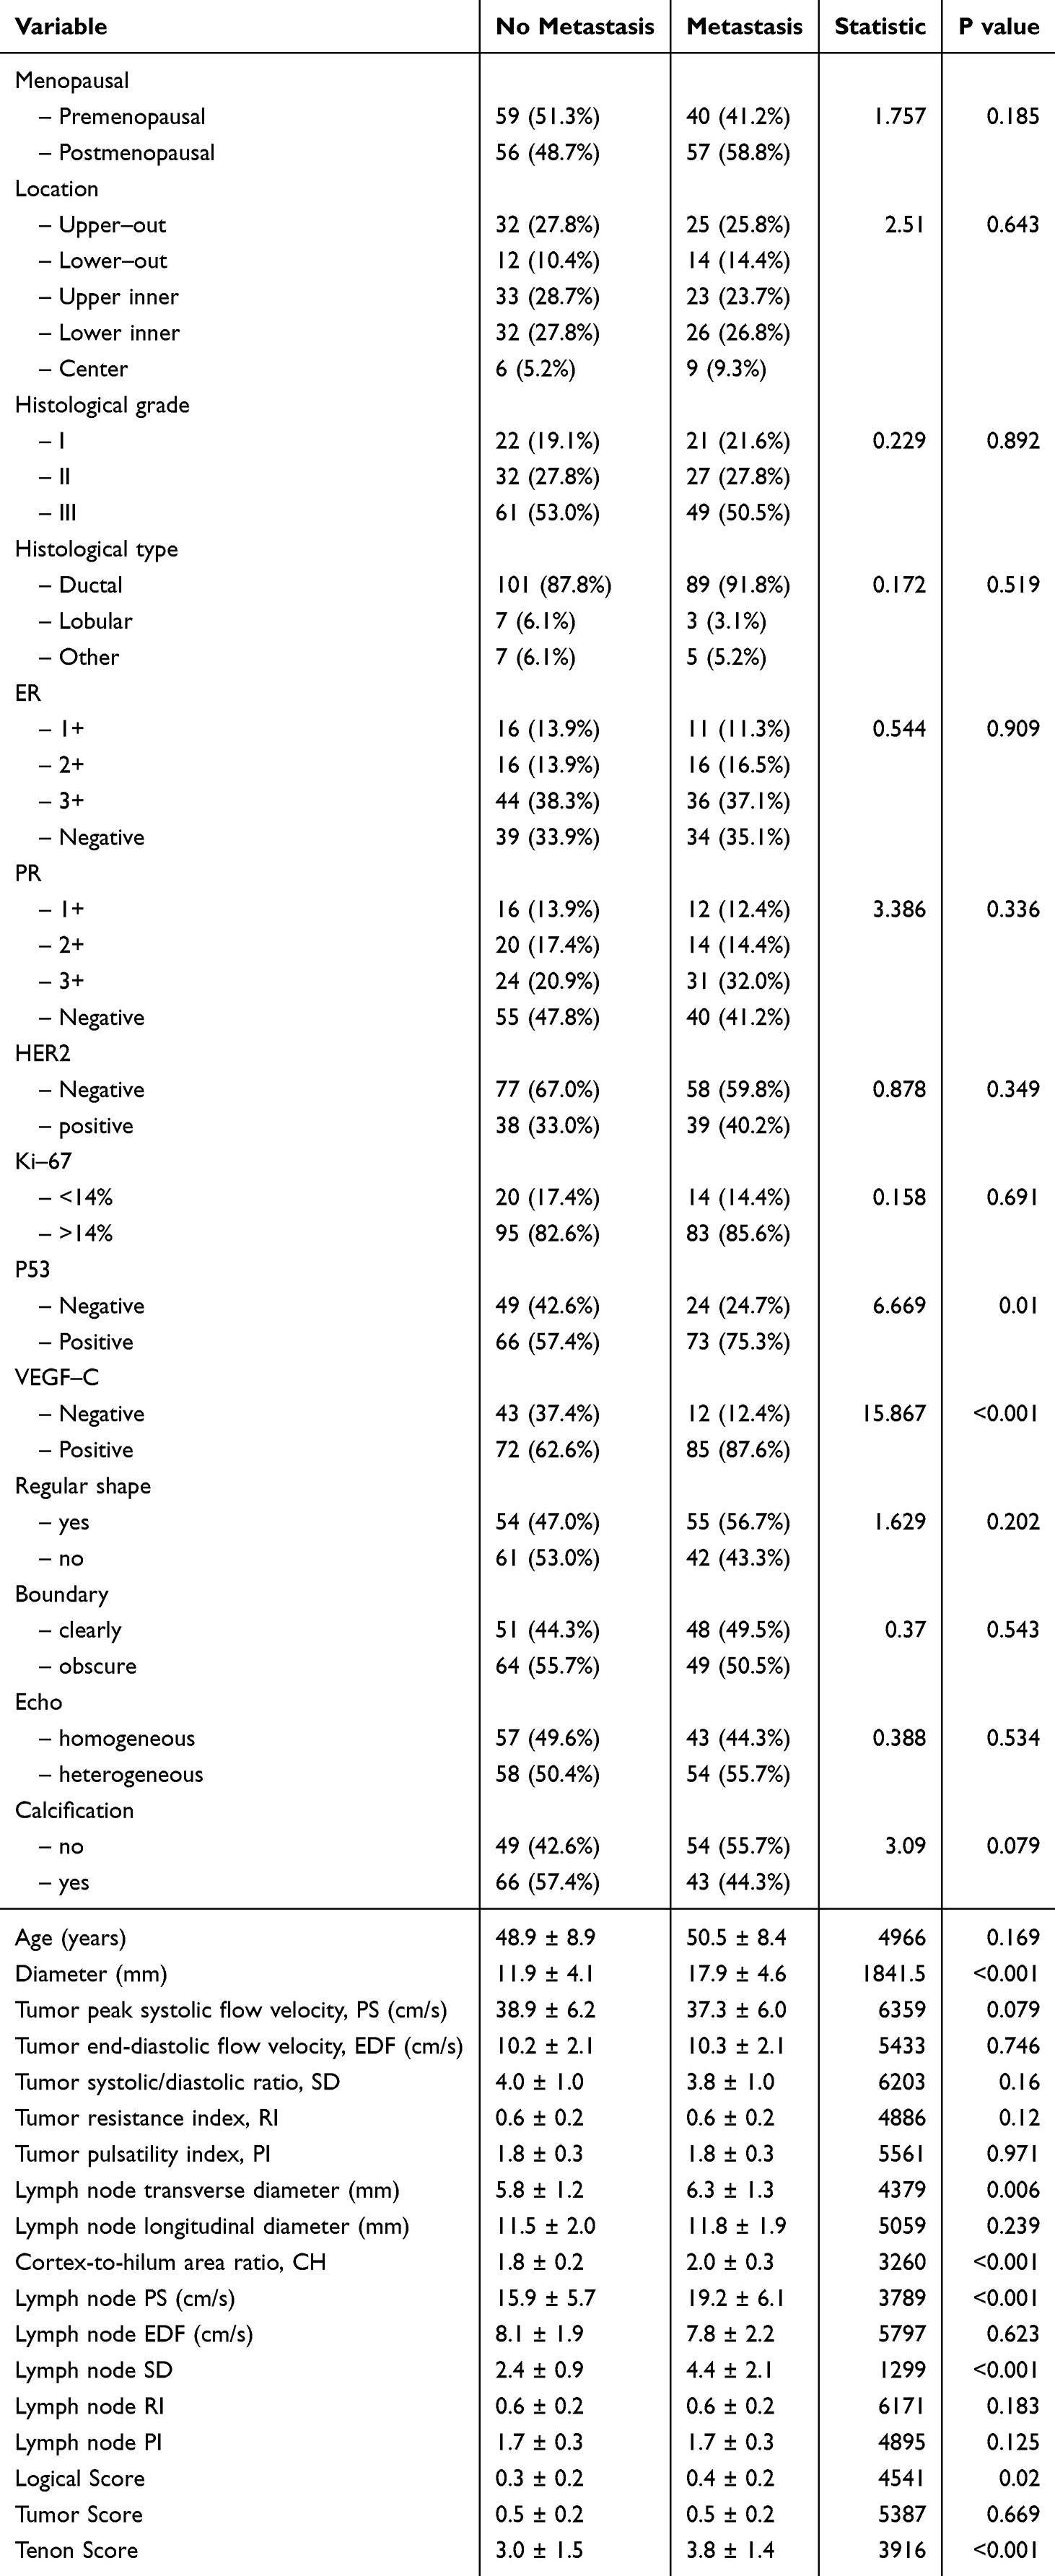 |
Table 2 Data in Training Cohort |
Performance Comparison of Machine Learning Algorithms and Feature Selection
In the internal training cohort, Figure 2A presents the ranking of 11 machine learning algorithms based on their AUC, F1-score, and accuracy for predicting axillary lymph node (ALN) metastasis. Gradient Boosting ranked highest overall, showing superior predictive performance compared with other algorithms. Figure 2B displays the ROC curves of the top five algorithms in terms of AUC, further confirming the robust discriminative ability of Gradient Boosting. Figure 2C illustrates the top 10 variables ranked by importance, with the five most influential predictors identified as tumor diameter, cortex-hilum ratio, lymph node systolic-to-diastolic velocity ratio (LNSD), lymph node peak systolic flow velocity (LNPS), and lymph node end-diastolic flow velocity (LNEDF). Figure 2D shows the SHAP summary plot for the top 10 variables, revealing their contributions and direction of influence on ALN metastasis prediction. Figure 2E demonstrates the relationship between the number of included variables and the model’s AUC, indicating that predictive performance plateaued after incorporating the top five variables, suggesting no substantial gain from adding more predictors. Based on these findings, we selected the top five noninvasive indicators to construct our combined model, which was subsequently used for further analyses in this study.
 |
Figure 2 Performance comparison of machine learning algorithms and feature selection. (A) Ranking of 11 machine learning algorithms by AUC, F1-score, and accuracy in the internal training cohort. (B) ROC curves for the top five algorithms ranked by AUC. (C) Top 10 variables ranked by importance in the Gradient Boosting model. (D) SHAP summary plot illustrating the contribution and direction of influence for the top 10 variables in the Gradient Boosting model. (E) Relationship between the number of included variables and model AUC, showing performance plateau after the top five variables. |
ROC
Figure 3 and Supplementary Table 1 collectively demonstrate the discriminative performance of the Combined Model compared with the Logical Score, Tumor Score, and Tenon Score across internal training, internal validation, and external validation cohorts. The ROC curves in Figure 3 show that the Combined Model achieved an AUC of 0.981 (95% CI: 0.962–1.000) in the internal training cohort (Figure 3A), 0.975 (95% CI: 0.938–1.000) in the internal validation cohort (Figure 3B), and 0.987 (95% CI: 0.963–1.000) in the external validation cohort (Figure 3C). The Logical Score displayed AUCs of 0.593, 0.692, and 0.526 in the respective cohorts; the Tumor Score showed AUCs of 0.517, 0.583, and 0.584; and the Tenon Score exhibited AUCs of 0.649, 0.699, and 0.700. These results indicate that all models retained discriminative ability across cohorts, with the Combined Model consistently achieving the highest AUC values.
 |
Figure 3 Receiver operating characteristic (ROC) curves for the Combined Model, Logical Score, Tumor Score, and Tenon Score in predicting axillary lymph node metastasis across cohorts. (A) Internal training cohort. (B) Internal validation cohort. (C) External validation cohort. |
Correspondingly, Supplementary Table 1 quantifies these findings.
Calibration Curve
Figure 4 and Supplementary Table 2 collectively demonstrate the calibration performance of the Combined Model compared with the Logical Score, Tumor Score, and Tenon Score across internal training, internal validation, and external validation cohorts. The calibration curves in Figure 4 show that the Combined Model achieved a Brier score of 0.053 in the internal training cohort (Figure 4A), 0.061 in the internal validation cohort (Figure 4B), and 0.045 in the external validation cohort (Figure 4C). The Logical Score displayed Brier scores of 0.242, 0.222, and 0.243 in the respective cohorts; the Tumor Score showed Brier scores of 0.248, 0.241, and 0.241; and the Tenon Score exhibited Brier scores of 0.228, 0.211, and 0.211. These results indicate that all models retained calibration ability across cohorts, with the Combined Model consistently achieving the lowest Brier scores. Correspondingly, Supplementary Table 2 quantifies these findings.
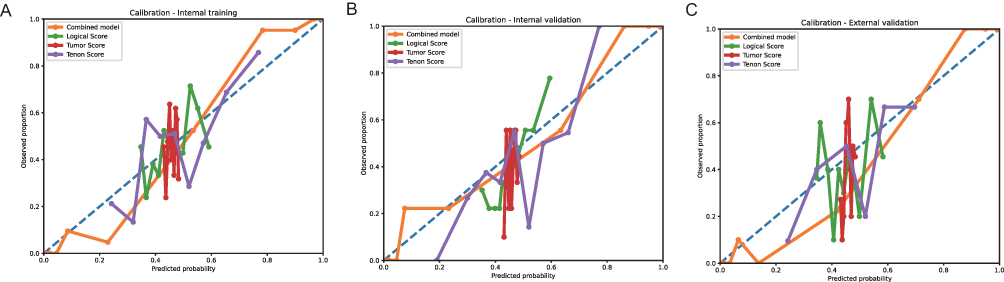 |
Figure 4 Calibration curves for the Combined Model, Logical Score, Tumor Score, and Tenon Score in predicting axillary lymph node metastasis across cohorts. (A) Internal training cohort. (B) Internal validation cohort. (C) External validation cohort. |
Decision Curve Analysis (DCA) Curve
Figure 5 and Supplementary Table 3 collectively demonstrate the clinical utility of the Combined Model compared with the Logical Score, Tumor Score, and Tenon Score, as assessed by decision curve analysis (DCA), net reclassification improvement (NRI), and integrated discrimination improvement (IDI) across internal training, internal validation, and external validation cohorts. The DCA curves in Figure 5 show that the Combined Model achieved higher net benefit across a range of threshold probabilities in the internal training cohort (Figure 5A), internal validation cohort (Figure 5B), and external validation cohort (Figure 5C) compared to the other models and the treat-none or treat-all strategies. The Logical Score, Tumor Score, and Tenon Score displayed lower net benefits in all cohorts. Correspondingly, Supplementary Table 3 quantifies the NRI and IDI metrics, with the Combined Model as the reference.
 |
Figure 5 Decision curve analysis (DCA) for the Combined Model, Logical Score, Tumor Score, and Tenon Score in predicting axillary lymph node metastasis across cohorts. (A) Internal training cohort. (B) Internal validation cohort. (C) External validation cohort. |
Waterfall in Different Scene
Figure 6 presents waterfall plots depicting the distribution of individual predicted risk scores in four different classification outcomes: (A) True Negatives, (B) False Negatives, (C) False Positives, and (D) True Positives. Each bar represents a single patient’s predicted probability, ordered from lowest to highest score within each subgroup. Panel A shows patients correctly identified as negative (true negatives), characterized by generally low predicted risk scores. Panel B illustrates false negatives, where patients were incorrectly predicted as low risk despite having the condition, highlighting cases at risk of underdiagnosis. Panel C displays false positives, indicating patients without the condition but assigned high risk scores, which may lead to unnecessary interventions. Panel D represents true positives with high predicted probabilities, reflecting correct identification of patients with the condition. These plots visualize the model’s discrimination performance at the individual level and provide insight into misclassification patterns that may guide further model refinement or clinical interpretation.
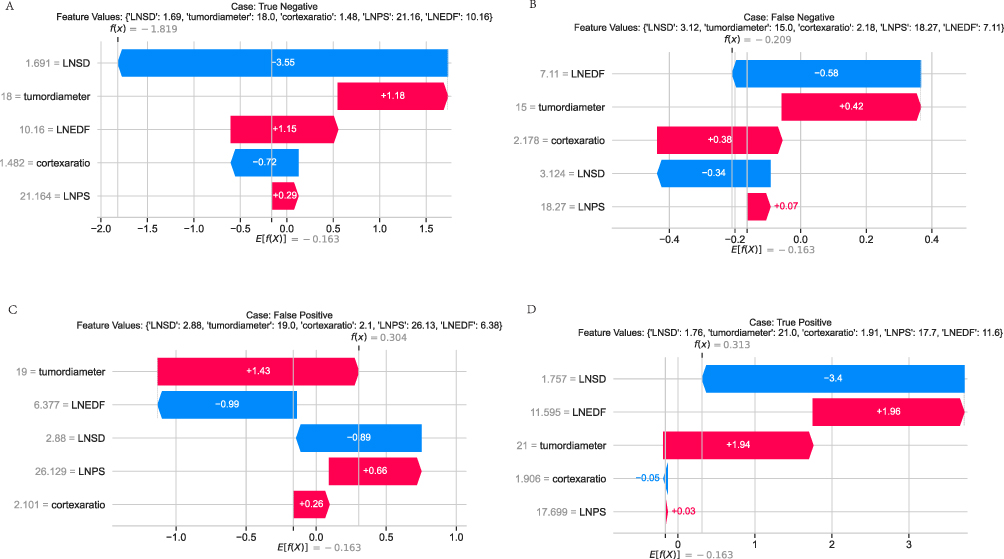 |
Figure 6 Waterfall plots of individual predicted risk scores stratified by classification outcome. (A) True Negative cases, correctly predicted as negative with low risk scores; (B) False Negative cases, incorrectly predicted as low risk despite positive condition status; (C)False Positive cases, incorrectly predicted as high risk without the condition; (D) True Positive cases, correctly predicted as high risk. Each bar represents a patient’s predicted probability, ordered within each group to illustrate the distribution of risk scores and identify areas of potential misclassification. |
Construction and Testing of the Web-Based Calculator
To ensure simplicity and user-friendliness, we developed a web-based calculator for predicting axillary lymph node (ALN) metastasis in breast cancer patients (URL: https://lymphatic-metastasis-2rkk8cjhfei7krq2xmehdy.streamlit.app/). The interface is shown in Figure 7. Users can input the corresponding values for the selected predictors and click “Predict” to obtain the estimated probability of ALN metastasis.
 |
Figure 7 Web-based calculator demonstration. |
To evaluate usability and accuracy, we conducted a clinician-based pilot test involving 10 breast imaging specialists from the two participating centers. Each clinician was asked to input 30 anonymized cases with known pathological outcomes into the calculator. The results were compared with the gold-standard pathological diagnoses, yielding an overall prediction accuracy of 89%, with positive and negative predictive values of 87% and 90%, respectively. All participants reported that the interface was intuitive, and the input process required less than one minute per patient, supporting its feasibility for clinical use.
Discussion
The primary objective of this study was to evaluate and compare 11 machine learning algorithms to identify the optimal method for integrating ultrasound and Doppler features in the preoperative prediction of axillary lymph node (ALN) metastasis in breast cancer patients, incorporating SHapley Additive exPlanations (SHAP) for interpretability. Key findings revealed that Gradient Boosting emerged as the superior algorithm, enabling a combined model that demonstrated exceptional discriminatory performance (AUC >0.95 across cohorts) and clinical net benefit relative to established clinicopathological scores, with tumor diameter, cortex-to-hilum ratio (CH), and Doppler parameters identified as the top predictors.
The model’s feature selection underscores the biological relevance of noninvasive ultrasound markers in metastasis detection. Tumor diameter, as the leading feature, aligns with established tumor biology, where larger lesions promote lymphatic invasion through enhanced proliferative activity and extracellular matrix degradation, potentially activating pathways like PI3K/AKT that facilitate epithelial-mesenchymal transition.18 The CH ratio’s prominence reflects nodal structural changes, where metastatic deposits induce cortical expansion via immune infiltration or direct tumor growth, altering lymphatic drainage and increasing vascular permeability.19 Doppler features, including LNSD, LNPS, and LNEDF, highlight hemodynamic shifts; elevated LNSD and LNPS may indicate neovascularization driven by hypoxia-inducible factor-1α (HIF-1α), leading to irregular, high-resistance vessels in metastatic nodes, while LNEDF captures reduced diastolic flow from microvascular compression.20 SHAP analysis further revealed positive contributions from these features to metastasis probability, supporting the hypothesis that combining morphological and vascular signals enables early identification of subclinical changes, beyond what single-modality assessments provide.
Comparisons with prior literature affirm the model’s contributions while addressing discrepancies. Ultrasound-based ML models, such as that by Zheng et al, reported an AUC of 0.88 using dynamic video features but lacked multi-center validation, contrasting our AUCs exceeding 0.95 with external testing, likely due to our incorporation of Doppler hemodynamics absent in their grayscale-focused approach.16 Similarly, Yu et al achieved an AUC of 0.92 with deep learning radiomics on ultrasound, yet without SHAP, interpretability was limited; our SHAP integration elucidates feature impacts, resolving “black-box” issues noted in reviews of AI in oncology.13 Wang et al integrated SHAP with peritumoral radiomics for an AUC of 0.90, but single-center data restricted generalizability, whereas our dual-center design demonstrates robustness across institutions.8 Clinicopathological nomograms like the MSKCC and Tenon scores, validated in Rouzier et al with AUCs of 0.72–0.78, underperformed in our cohorts (AUCs 0.53–0.70), attributable to their omission of imaging data, highlighting our model’s advantage in noninvasive prediction.15 Discrepancies in performance may stem from population differences, as earlier studies often involved Western cohorts with varying tumor subtypes, while our Asian-based data emphasize Doppler’s role in luminal subtypes prevalent in this demographic.14 Overall, this study fills gaps in explainable, validated ultrasound ML by outperforming benchmarks and providing multi-center evidence.
The significance of these findings lies in advancing precision oncology through accessible tools. Academically, the model refines understanding of ultrasound features as surrogates for molecular events, such as VEGF-mediated angiogenesis linked to Doppler alterations, potentially guiding biomarker discovery.7 Clinically, high calibration and net benefit suggest reductions in overtreatment; for instance, decision curve analysis implies avoidance of 15–25% unnecessary ALNDs, mirroring impacts seen in AI-assisted staging that decreased surgical complications by 20% in prospective trials.3 In low-resource settings, ultrasound’s ubiquity positions the web calculator as a scalable aid for risk stratification, aligning with global efforts to equitable cancer care.1 Broader impacts include policy-level integration into guidelines, like ESMO recommendations for noninvasive staging, to optimize resource allocation.4
Limitations and Future Directions
Despite the promising results, our study has several limitations. First, although the data were collected from two independent centers, the overall sample size remains relatively small, which may limit the statistical power and generalizability of our findings. Larger-scale, multi-center studies involving more diverse patient populations are warranted to further validate the robustness of the model. Second, while our dual-center design improves external validity compared to single-center studies, both participating institutions are located within the same geographic region, and potential regional or institutional biases cannot be entirely excluded. Third, the current model was developed solely from ultrasound and Doppler ultrasound features. Incorporating additional imaging modalities (eg, MRI, PET/CT) and integrating molecular or serological biomarkers may further enhance predictive performance. Fourth, the present study did not directly evaluate how model predictions translate into patient-centered clinical outcomes, such as overall survival, disease-free survival, recurrence rates, or reduction in unnecessary sentinel lymph node biopsy (SLNB) or axillary lymph node dissection (ALND). Finally, the model has not yet been embedded into a clinical decision-support system, which may limit its immediate applicability in daily practice.
Future research should aim to: (1) validate the model in larger, geographically diverse, multi-center cohorts to improve generalizability; (2) prospectively evaluate the impact of model-guided decision-making on patient outcomes, including survival, recurrence, and avoidance of unnecessary SLNB/ALND, thereby providing concrete evidence of clinical utility; (3) integrate multimodal imaging and molecular biomarkers to enhance accuracy; and (4) develop and test user-friendly, automated software platforms for real-time clinical use, ultimately facilitating widespread adoption and improving the efficiency of axillary staging in breast cancer management.
Conclusion
In summary, this interpretable ML model enhances ALN metastasis prediction by leveraging ultrasound features, offering superior accuracy and utility over traditional scores. Future research should explore prospective integration with multimodal data and long-term outcome assessments to maximize clinical translation.
Ethical Statement
Ethical approval was obtained from the Institutional Review Board of Women and Children’s Hospital, School of Medicine, Xiamen University [KY-2025-046-K01]. Informed consent was waived due to the retrospective nature of the study, which posed minimal risk to participants and involved only anonymized data. All patient data were handled with strict confidentiality, and the study complied with the principles outlined in the Declaration of Helsinki.
Acknowledgments
The authors would like to thank Dr. Huang Rushao from the Department of Ultrasound, Longyan First Hospital, for generously providing 102 patient cases for use as the external validation cohort in this study. The authors confirm that they have no financial or personal conflicts of interest associated with the publication of this manuscript. They also attest that all data and analyses included are original and faithfully represent the outcomes of the study.
Disclosure
The authors report no conflicts of interest in this work.
References
1. World Health Organization. Breast cancer[EB/OL]. (2024-03-13)[2025-08-10]. Available from: https://www.who.int/news-room/fact-sheets/detail/breast-cancer.
2. Lehman CD, Gatsonis C, Romanoff J, et al. Axillary nodal evaluation in breast cancer: state of the art. Radiology. 2020;295(3):500–515. doi:10.1148/radiol.2020192534
3. Giuliano AE, Edge SB, Hortobagyi GN. Eighth edition of the AJCC cancer staging manual: breast cancer. Ann Surg Oncol. 2018;25(7):1783–1785. doi:10.1245/s10434-018-6486-6
4. Senkus E, Kyriakides S, Ohno S, et al. Primary breast cancer: ESMO clinical practice guidelines for diagnosis, treatment and follow-up. Ann Oncol. 2015;26(Suppl 5):v8–v30. doi:10.1093/annonc/mdv298
5. Evans A, Trimboli RM, Athanasiou A, et al. Breast ultrasound: recommendations for information to women and referring physicians by the European Society of Breast Imaging. Insights Into Imaging. 2018;9(4):449–455. doi:10.1007/s13244-018-0636-z
6. Yang WT, Chang CB, Park HL, et al. Role of color Doppler sonography in the evaluation of malignant lymphomas of the neck. J Ultrasound Med. 2002;21(9):987–994. doi:10.7863/jum.2002.21.9.987
7. Bi WL, Hosny A, Schabath MB, et al. Artificial intelligence in cancer imaging: clinical challenges and applications. CA. 2019;69(2):127–157. doi:10.3322/caac.21552
8. Wang SR, Cao CL, Du TT, et al. Machine learning model for predicting axillary lymph node metastasis in clinically node positive breast cancer based on peritumoral ultrasound radiomics and SHAP feature analysis. J Ultrasound Med. 2024;43(9):1611–1625. doi:10.1002/jum.16483
9. Qiu SQ, Zeng HC, Zhang F, et al. A nomogram to predict the probability of axillary lymph node metastasis in early breast cancer patients with positive axillary ultrasound. Sci Rep. 2016;6:21196. doi:10.1038/srep21196
10. Lundberg SM, Erion G, Chen H, et al. From local explanations to global understanding with explainable AI for trees. Nature Mach Intell. 2020;2(1):56–67. doi:10.1038/s42256-019-0138-9
11. Alvarez S, Añorbe E, Alcorta P, et al. Role of sonography in the diagnosis of axillary lymph node metastases in breast cancer: a systematic review. Am J Roentgenol. 2006;186(5):1342–1348. doi:10.2214/AJR.05.0936
12. Cetin Tuncez H, Murat Koc A, Hilal Adibelli Z, et al. Diagnostic efficacy of ultrasonography, Doppler ultrasonography and elastography in the evaluation of suspected malignant lymph nodes. J Ultrason. 2023;23(92):1–9. doi:10.15557/JoU.2023.0001
13. Yu Y, He Z, Ouyang J, et al. Deep learning radiomics based prediction of axillary lymph node metastasis in breast cancer using ultrasound images. Npj Breast Cancer. 2024;10(1):18. doi:10.1038/s41523-024-00628-4
14. Ali S, Abedi A, Khankeshipour A, et al. Explainable artificial intelligence in breast cancer detection and risk prediction: a systematic scoping review. Cancer Innovation. 2024;3(2):e136. doi:10.1002/cai2.136
15. Rouzier R, Uzan C, Rousseau A, et al. Multicenter prospective evaluation of the reliability of the combined use of two models to predict non-sentinel lymph node status in breast cancer patients with metastatic sentinel lymph nodes: the MSKCC nomogram and the Tenon score. Results of the NOTEGS study. Br J Cancer. 2017;116(9):1135–1140. doi:10.1038/bjc.2017.47
16. Zheng X, Yao B, Liu Y, et al. A deep learning model and human-machine fusion for prediction of EBV-associated gastric cancer from histopathology. Nat Commun. 2022;13(1):2797. doi:10.1038/s41467-022-30491-2
17. Zhang J, Li X, Huang R, et al. A nomogram to predict the probability of axillary lymph node metastasis in female patients with breast cancer in China: a nationwide, multicenter, 10-year epidemiological study. Oncotarget. 2017;8(21):35311–35325. doi:10.18632/oncotarget.13330
18. Hanahan D, Weinberg RA. Hallmarks of cancer: the next generation. Cell. 2011;144(5):646–674. doi:10.1016/j.cell.2011.02.013
19. Carter CL, Allen C, Henson DE. Relation of tumor size, lymph node status, and survival in 24,740 breast cancer cases. Cancer. 1989;63(1):181–187. doi:10.1002/1097-0142(19890101)63:1
20. Folkman J. Role of angiogenesis in tumor growth and metastasis. Semin Oncol. 2002;29(6 Suppl 16):15–18. doi:10.1053/sonc.2002.37263
 © 2025 The Author(s). This work is published and licensed by Dove Medical Press Limited. The
full terms of this license are available at https://www.dovepress.com/terms
and incorporate the Creative Commons Attribution
- Non Commercial (unported, 4.0) License.
By accessing the work you hereby accept the Terms. Non-commercial uses of the work are permitted
without any further permission from Dove Medical Press Limited, provided the work is properly
attributed. For permission for commercial use of this work, please see paragraphs 4.2 and 5 of our Terms.
© 2025 The Author(s). This work is published and licensed by Dove Medical Press Limited. The
full terms of this license are available at https://www.dovepress.com/terms
and incorporate the Creative Commons Attribution
- Non Commercial (unported, 4.0) License.
By accessing the work you hereby accept the Terms. Non-commercial uses of the work are permitted
without any further permission from Dove Medical Press Limited, provided the work is properly
attributed. For permission for commercial use of this work, please see paragraphs 4.2 and 5 of our Terms.
Recommended articles
Recent Advances in Ultrasound of Soft Tissue Lesions
Pluetrattanabha N, Direksunthorn T
International Journal of General Medicine 2023, 16:1163-1170
Published Date: 30 March 2023
Machine Learning Algorithm to Estimate Distant Breast Cancer Recurrence at the Population Level with Administrative Data
Izci H, Macq G, Tambuyzer T, De Schutter H, Wildiers H, Duhoux FP, de Azambuja E, Taylor D, Staelens G, Orye G, Hlavata Z, Hellemans H, De Rop C, Neven P, Verdoodt F
Clinical Epidemiology 2023, 15:559-568
Published Date: 5 May 2023
An Explainable Machine Learning Model to Predict Acute Kidney Injury After Cardiac Surgery: A Retrospective Cohort Study
Gao Y, Wang C, Dong W, Li B, Wang J, Li J, Tian Y, Liu J, Wang Y
Clinical Epidemiology 2023, 15:1145-1157
Published Date: 4 December 2023
Early Warning of Axillary Lymph Node Metastasis in Breast Cancer Patients Using Multi-Omics Signature: A Machine Learning-Based Retrospective Study
Ke Z, Shen L, Shao J
International Journal of General Medicine 2024, 17:6101-6114
Published Date: 12 December 2024
Integrated Network Pharmacology, Machine Learning and Experimental Validation to Identify the Key Targets and Compounds of TiaoShenGongJian for the Treatment of Breast Cancer

Ying H, Kong W, Xu X
OncoTargets and Therapy 2025, 18:49-71
Published Date: 16 January 2025