Back to Journals » ImmunoTargets and Therapy » Volume 15
Macrophage-Derived Transcriptional Signatures Predict Prognosis and Drug Sensitivity in Thyroid Cancer: Integrative Analysis and Experimental Validation of SMYD3
Authors Xu S, Zhang X, Sun J, Qin M, Du H, Luo B
Received 13 September 2025
Accepted for publication 9 December 2025
Published 9 January 2026 Volume 2026:15 565624
DOI https://doi.org/10.2147/ITT.S565624
Checked for plagiarism Yes
Review by Single anonymous peer review
Peer reviewer comments 2
Editor who approved publication: Prof. Dr. Michael Shurin
Sufang Xu, Xin Zhang, Jingru Sun, Man Qin, Huarong Du, Bing Luo
Department of Medical Laboratory Center, Anhui No.2 Provincial People’s Hospital, Hefei, Anhui, People’s Republic of China
Correspondence: Bing Luo, Department of Medical Laboratory Center, Anhui No.2 Provincial People’s Hospital, 1868 Dangshan Road, North Second Ring, Yaohai District, Hefei, Anhui, People’s Republic of China, Email [email protected]
Background: Thyroid cancer is the most common malignancy of the endocrine system. Tumor-associated macrophages (TAMs) play a pivotal role in modulating the tumor microenvironment and promoting tumor progression. However, the prognostic implications of macrophage heterogeneity in thyroid cancer remain unclear.
Methods: Single-cell RNA-seq analysis was conducted to identify tumor-enriched macrophage subpopulations and hdWGCNA was used to define related gene modules. A prognostic model was built using 117 machine learning algorithm combinations and validated by Kaplan–Meier analysis. A nomogram combining clinical features and risk scores was established. Genomic alterations, immune profiles, and treatment responses were compared between risk groups using TCGA and GDSC2 datasets. In vitro experiments were performed to validate the role of SMYD3 in tumor progression and drug sensitivity.
Results: Single-cell analysis identified a tumor-enriched macrophage subset with distinct functional states. hdWGCNA revealed macrophage-related gene modules linked to poor prognosis, and a machine learning–based model effectively stratified patient risk. High-risk patients had worse survival, older age, advanced stage, and lower BRAF mutation frequency but more diverse oncogenic alterations. They also showed enhanced T-cell exclusion and altered immune infiltration. Drug prediction analysis indicated greater sensitivity to Rapamycin, BDP-00009066, AZD5363_1916, and Cediranib_1922 in the high-risk group. Functional assays confirmed that SMYD3 knockdown suppressed proliferation and migration, and reduced sensitivity to AZD5363_1916, highlighting its role in modulating therapeutic response.
Conclusion: This study identifies a tumor-enriched macrophage subpopulation with prognostic relevance and develops a robust machine learning–based model for risk stratification in thyroid cancer. SMYD3 is implicated in both tumor progression and drug sensitivity, offering a potential biomarker for precision treatment strategies.
Plain Language Summary: Thyroid cancer is the most common type of endocrine system cancer. Although many patients respond well to treatment, some experience poor outcomes, and the reasons for this are not fully understood. In this study, researchers aimed to improve how we predict the behavior of thyroid cancer and identify treatments that might work best for individual patients. They focused on a type of immune cell called macrophages, which are often found in tumors and can either help fight or promote cancer. Using advanced genetic analysis, the researchers discovered a special group of macrophages that are enriched in thyroid tumors and may contribute to cancer progression. They then built a risk prediction model using gene patterns from these macrophages. One gene, SMYD3, stood out as especially important. In lab experiments, reducing SMYD3 in thyroid cancer cells led to slower growth and less movement, suggesting that this gene helps cancer cells spread. The researchers also found that SMYD3 may influence how well cancer cells respond to certain drugs—particularly AZD5363, a drug that targets cancer cell growth pathways. Patients with high SMYD3 levels may be more sensitive to this treatment. These findings provide new insights into how the immune system and specific genes influence thyroid cancer and suggest that SMYD3 could be a useful marker for guiding treatment in the future.
Keywords: thyroid cancer, tumor-associated macrophages, single-cell RNA sequencing, machine learning, drug sensitivity, SMYD3
Introduction
Thyroid cancer (TC) is the most prevalent endocrine malignancy, with papillary thyroid carcinoma (PTC) accounting for more than 80% of all cases.1–3 Although the majority of PTC patients have an excellent prognosis with appropriate treatment, while most patients with papillary thyroid carcinoma have favorable outcomes, a subset faces a more challenging clinical course.4–6 These include patients with aggressive histological variants, advanced age, or radioiodine-refractory disease. Such individuals are more likely to experience recurrence, distant metastasis, or progression to poorly differentiated thyroid carcinoma (PDTC) and anaplastic thyroid carcinoma (ATC).7,8 In recent years, the global incidence of thyroid cancer has risen sharply, especially in industrialized countries,1,9 suggesting a potential contribution of environmental exposures alongside improved detection. Growing evidence suggests that environmental exposures may contribute to thyroid dysfunction and carcinogenesis. Cadmium and lead, in particular, act as endocrine-disrupting heavy metals that impair thyroid hormone synthesis, induce oxidative stress, and interfere with key metabolic and signaling pathways. Mechanistic studies show that cadmium can accumulate within the thyroid gland, while lead exposure disrupts hypothalamic–pituitary–thyroid (HPT) axis activity, collectively promoting hormonal imbalance and thyroid vulnerability.10 Population-based findings further reveal significant associations between elevated cadmium or lead levels and dysregulated thyroid hormone profiles, suggesting that these metals may serve as emerging environmental risk modifiers in thyroid cancer development.11 While conventional staging systems and histopathological features are useful, they often fail to reflect the molecular complexity and immunological diversity that influence clinical outcomes.
The tumor microenvironment (TME) plays a pivotal role in shaping thyroid cancer behavior, with immune cells—particularly macrophages—emerging as key modulators of tumor progression.12–15 Tumor-associated macrophages (TAMs) have been implicated in promoting tumor proliferation, angiogenesis, and immune evasion via cytokine secretion, extracellular matrix remodeling, and suppression of T cell activity.16,17 Several studies have reported an enrichment of M2-like macrophages in thyroid cancer, correlating with poor prognosis and aggressive clinical features.18,19 However, most of these findings are derived from bulk RNA-seq or limited immunohistochemistry, which obscure the cellular heterogeneity and fail to resolve distinct macrophage subpopulations with potentially divergent functions.
Advances in single-cell RNA sequencing (scRNA-seq) have revolutionized our capacity to deconstruct complex tissues at single-cell resolution. This technique enables precise identification of immune cell subsets, revealing transcriptional heterogeneity that was previously inaccessible.20,21 In thyroid cancer, scRNA-seq presents a powerful opportunity to delineate the landscape of tumor-infiltrating immune cells, including TAMs. Yet, a comprehensive, cell-type-resolved characterization of macrophage subsets and their functional states in thyroid cancer remains lacking. Moreover, it is still unclear whether specific TAM subpopulations are associated with patient prognosis or therapeutic response, underscoring the need for integrated single-cell and systems-level analyses to uncover novel biomarkers and actionable targets.
To address these gaps, we performed an integrative study leveraging scRNA-seq data from GEO and bulk RNA-seq data from The Cancer Genome Atlas (TCGA). We first characterized the immune cell landscape of thyroid cancer and identified a distinct tumor-enriched macrophage subpopulation. Using high-dimensional weighted gene co-expression network analysis (hdWGCNA), we uncovered gene modules specific to this macrophage cluster. These module genes were then incorporated into a robust prognostic model constructed using a comprehensive panel of 117 machine learning algorithms. Finally, we investigated the clinical, mutational, and immunological features associated with our risk model and predicted drug sensitivities in high-risk patients. Among the core risk-associated genes identified, SMYD3 was further validated in vitro for its role in thyroid cancer proliferation and drug response.
Materials and Methods
Single-Cell RNA Sequencing Data Processing
We obtained scRNA-seq data from the Gene Expression Omnibus (GEO) database (GSE184362),13 comprising thyroid tumor and adjacent normal tissue samples. Six tumors and six adjacent samples were selected for analysis. Batch effects among the 12 samples were corrected using canonical correlation analysis (CCA) followed by mutual nearest neighbor (MNN) matching via the IntegrateData function in the Seurat (v5.1.0) package22 in R (version 4.3.0). Data preprocessing—including quality control, normalization and clustering—was performed using the Seurat. Cell type annotation was conducted by identifying top 30 marker genes for each cluster using the FindAllMarkers function, followed by cross-validation in the ACT database. Intercellular communication was inferred using CellChat (v1.6.1), and pseudotime analysis was performed using Monocle (v2.28.0).23
Identification of Macrophage-Associated Modules via hdWGCNA
To identify gene co-expression modules associated with tumor-specific macrophages, macrophage populations were extracted and subclustered using Seurat. A tumor-enriched macrophage subset was identified for downstream analysis. High-dimensional weighted gene co-expression network analysis (hdWGCNA, v0.4.4)24 was applied, with soft-thresholding power determined via TestSoftPowers, followed by network construction using ConstructNetwork and module correlation assessment via ModuleCorrelogram. To evaluate module activity at the single-cell level, enrichment scores of module genes were calculated using the UCell algorithm (v2.2.0)25 based on ranked expression profiles.
Construction of a Prognostic Model Using 117 Machine Learning Algorithms
Transcriptomic and clinical data for 513 thyroid cancer patients were downloaded from TCGA. The samples were randomly split into training (70%) and validation (30%) sets. Prognostic models were developed using 117 algorithmic combinations provided in the Mime1 (v0.0.0.9000)26 R package. Risk scores were calculated, and Kaplan–Meier survival curves were plotted for both cohorts. The model showing the highest concordance index (C-index) was selected for further analysis.
Gene Set Enrichment and Functional Annotation
Differentially expressed genes (DEGs) between high- and low-risk groups were identified using DESeq2 (v1.42.1),27 with cutoffs set at p < 0.05 and |log2FC| > 1. Gene Set Enrichment Analysis (GSEA) was performed using clusterProfiler (v4.10.1),28 with functional enrichment conducted across Gene Ontology (GO) and Kyoto Encyclopedia of Genes and Genomes (KEGG) pathways.
Nomogram Construction and Evaluation
Univariate and multivariate Cox proportional hazard analyses were conducted to identify independent prognostic factors among age, tumor stage, and risk score. A nomogram was constructed using the rms package (v6.7.1), with calibration curves and time-dependent receiver operating characteristic (ROC) curves generated via the survivalROC package (v1.0.3.1).29
Somatic Mutation Analysis
Somatic mutation data for thyroid cancer patients were obtained from TCGA using the TCGAbiolinks package. Mutation profiling and visualization were carried out using the maftools package. Mutational differences between high- and low-risk groups were visualized via waterfall plots.
Immunotherapy and Chemotherapy Response Prediction
TIDE scores were calculated to predict immunotherapy response based on immune dysfunction and T-cell exclusion indicators. Correlation analyses were performed to evaluate associations with the model-derived risk score. Chemotherapeutic sensitivity was predicted using the oncoPredict package, with IC50 values inferred based on gene expression data and the GDSC2 database (805 cell lines, 198 compounds).
Cell Culture
The human papillary thyroid carcinoma cell line TPC-1 was purchased from STEM RECELL Biotechnology Co., Ltd. (Shanghai, China). Cells were cultured in RPMI-1640 medium (Gibco, cat# C11875500BT) supplemented with 10% fetal bovine serum (Oumarsi, cat# OMD-72502) and 1% penicillin-streptomycin (Gibco, cat# 15140122). All cells were maintained at 37°C in a humidified incubator with 5% CO2 and passaged every 2–3 days.
siRNA Transfection
Small interfering RNAs (siRNAs) targeting SMYD3 and a non-targeting control siRNA (si-NC) were synthesized by GenePharma (Shanghai, China). The siRNA sequences were as follows: #1 si-SMYD3 Sense: 5’- UCUCCUACUACGAGCUGAATT-3’, Antisense: 5’-UUCAGCUCGUAGUAGGAGATT-3’; #2 si-SMYD3 Sense: 5’-UGCAACCUGAAGAUCUUCATT-3’,Antisense: 5’- UGAAGAUCUUCAGGUUGCATT-3’; #3 si-SMYD3 Sense: GAUCUUCAACAACCAGGAATT, Antisense: 5’- UUCCUGGUUGUUGAAGAUCTT-3’; siNC: Sense: 5’-UUCUCCGAACGUGUCACG UTT-3’, Antisense:5’-ACGUGACACGUUCGGAGAATT-3’. Cells were seeded in 12-well plates or 96-well plates and transfected at approximately 60–70% confluence using Lipofectamine™ 3000 reagent (Invitrogen, Cat# L3000015) according to the manufacturer’s protocol. A final concentration of 50 nM siRNA was used per well. After 48 hours of transfection, cells were harvested for downstream assays including qPCR, Western blot, proliferation assays, and drug response analyses.
Quantitative Real-Time PCR (qPCR)
Total RNA was extracted using TRIzol reagent (Invitrogen, Cat# 15596026), and cDNA was synthesized using the PrimeScript™ RT reagent Kit (Takara, Cat# RR047A). qPCR was performed using SYBR® Premix Ex Taq™ II (Takara, Cat# RR820A) on a LightCycler® 480 System (Roche). Relative gene expression was calculated using the 2−ΔΔCt method, normalized to GAPDH.
Western Blotting
Total protein was extracted using RIPA lysis buffer (Beyotime, Cat# P0013B), and concentrations were determined using a BCA Protein Assay Kit (Thermo Fisher, Cat# 23227). Samples were separated by SDS-PAGE, transferred to PVDF membranes (Millipore, Cat# IPVH00010), and blocked with 5% BSA. Membranes were incubated with primary antibodies (anti-SMYD3 [1:3000, Cat# 12011-1-AP, Proteintech], anti-CDH1 [1:10000, Cat# 20874-1-AP, Proteintech], anti-CDH2 [1:5000, Cat# 22018-1-AP, Proteintech], and anti-GAPDH [1:5000, Cat# 60004-1-Ig, Proteintech]), followed by HRP-conjugated secondary antibodies. Protein bands were visualized using enhanced chemiluminescence (ECL) reagent (Thermo Fisher, Cat# 32106).
CCK-8 Cell Viability Assay
Cell viability was assessed using the Cell Counting Kit-8 (Beyotime, Cat# C0048S). Cells were seeded in 96-well plates and treated with the indicated drugs or siRNAs. After 48 h, 10 μL of CCK-8 reagent was added to each well and incubated for 2 h. Absorbance at 450 nm was measured using a microplate reader (Bio-Rad).
Wound Healing Assay
Cells were seeded into 6-well plates and grown to near confluence. A linear scratch was created using a sterile 200 μL pipette tip. After washing with PBS, cells were incubated in serum-free medium, and wound closure was imaged at 0 h and 24 h using a phase-contrast microscope (Olympus).
EdU Incorporation Assay
Cell proliferation was evaluated using the EdU Apollo567 In Vitro Imaging Kit (RiboBio, Cat# C10310-1). Cells were incubated with 50 μM EdU for 2 h, fixed with 4% paraformaldehyde, permeabilized with 0.5% Triton X-100, and stained with Apollo and DAPI according to the manufacturer’s instructions. Images were acquired using a fluorescence microscope (Olympus).
Drug Sensitivity and IC50 Determination
Cells transfected with si-SMYD3 or si-NC were treated with serial dilutions of Rapamycin (Selleck, Cat# S1039), BDP-00009066 (Aladdin, Cat# B651933), AZD5363_1916 (Selleck, Cat# S8019), or Cediranib_1922 (Aladdin, Cat# C125911). After 48 h, cell viability was assessed using CCK-8. Dose-response curves and IC50 values were generated using GraphPad Prism 10 with nonlinear regression analysis.
Statistical Analysis
All statistical analyses were conducted in R (v4.3.0). Continuous variables were compared using two-tailed Student’s t-tests, and correlation analyses were performed using Spearman’s rank correlation. For CCK-8, EdU, and Western blot assays, all experiments were performed with three independent biological replicates (n = 3), and quantitative data are presented as mean ± SD. Statistical significance was determined using a two-tailed Student’s t-test for two-group comparisons or one-way ANOVA for multiple groups. A p-value < 0.05 was considered statistically significant.
Results
Single-Cell Transcriptomic Profiling Identifies Macrophages as Key Regulators in Thyroid Cancer
Single-cell RNA sequencing enables high-resolution analysis of cellular heterogeneity and dynamics within complex tissues. To dissect the cellular landscape of thyroid cancer and uncover key cell populations involved in tumorigenesis, we analyzed the GSE184362 dataset from the GEO database. After stringent quality control and identification of the top 2,000 highly variable genes (Figure S1a–d), unsupervised clustering and marker-based annotation revealed ten distinct cell types, including fibroblasts, CD4 T cells, B cells, CD8 T cells, thyroid follicular cells, NK cells, macrophages, endothelial cells, monocytes, and dendritic cells (Figure 1a and Figure S2). Quantitative analysis of cell proportions across samples showed that macrophages were significantly enriched in tumor tissues compared to adjacent normal tissues (Figure 1b and Figure S1e), implicating them as potential drivers of thyroid cancer development.
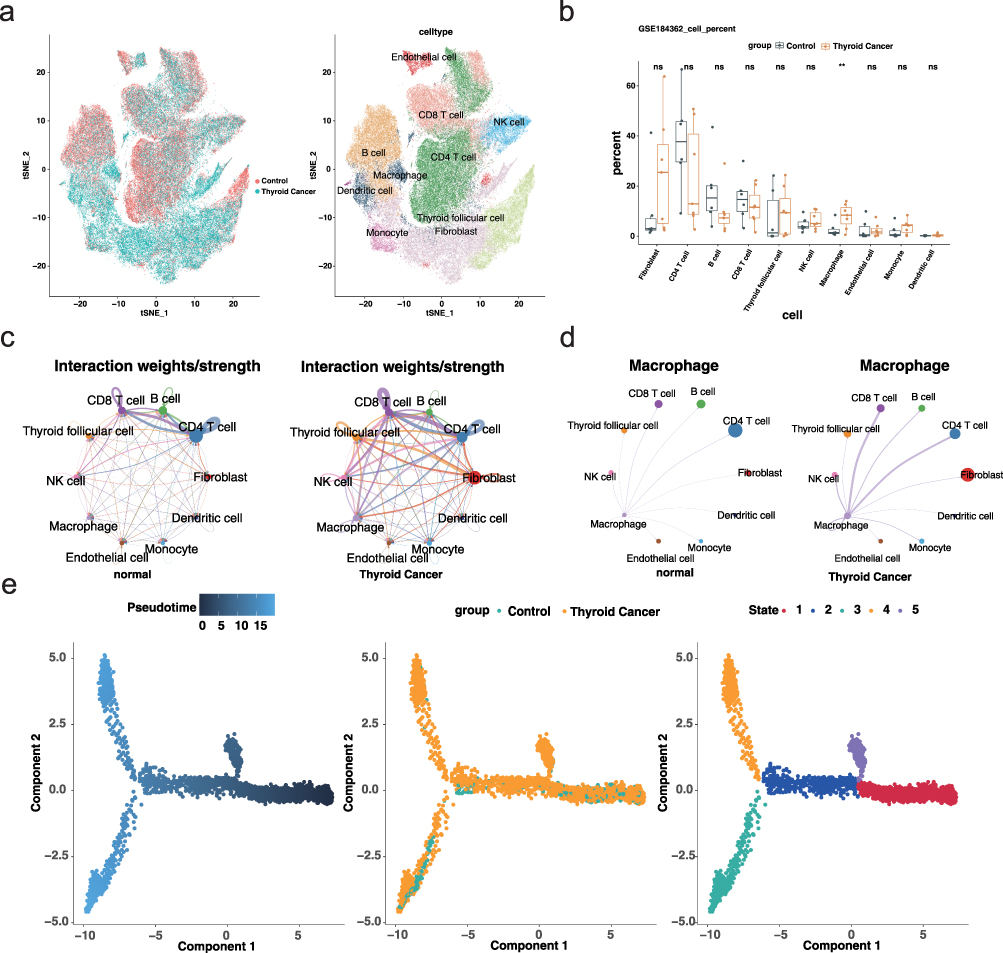 |
Figure 1 Single-cell analysis reveals immune cell landscape and macrophage dynamics in thyroid cancer (a) tSNE plot showing cell-type annotation across all samples. Left panel indicates sample groups (tumor vs adjacent), and right panel displays cell identities. (b) Boxplot illustrating the proportion of each cell type across samples. ns = no significance, **p<0.01. (c) Global cell–cell communication networks inferred by CellChat in adjacent (left) and tumor (right) tissues. Node size represents the number of cells; edge thickness indicates communication strength. (d) Macrophage-centered communication networks showing enhanced interactions with T cells in tumor tissues. (e) Pseudotime trajectory analysis of macrophages. |
To further characterize the role of macrophages, we performed intercellular communication analysis using CellChat and pseudotime trajectory analysis with Monocle. The tumor microenvironment displayed globally enhanced cell–cell interactions, particularly among immune cell subsets (Figure 1c). Specifically, macrophage–T cell communication was notably intensified in tumor tissues (Figure 1d). Additionally, pseudotime analysis revealed that macrophages in tumor and adjacent tissues followed distinct differentiation trajectories, suggesting divergent functional states (Figure 1e). These results collectively demonstrate that macrophages are not only enriched but also functionally and phenotypically distinct in the tumor microenvironment, highlighting their potential role as key modulators in thyroid cancer progression.
Identification of Thyroid Cancer-Associated Macrophage Subcluster and Module Genes via hdWGCNA
To further dissect macrophage heterogeneity in thyroid cancer, we isolated macrophage populations from single-cell data and conducted subclustering analysis, which identified 15 distinct macrophage subclusters (Figure 2a). The proportion of each subcluster was calculated across tumor and adjacent samples. One specific subcluster demonstrated a significantly higher abundance in tumor tissues, suggesting its tumor relevance (Figure 2b). This subpopulation was designated as the thyroid cancer-associated macrophage (THCA-related Macro) and was selected for downstream module analysis.
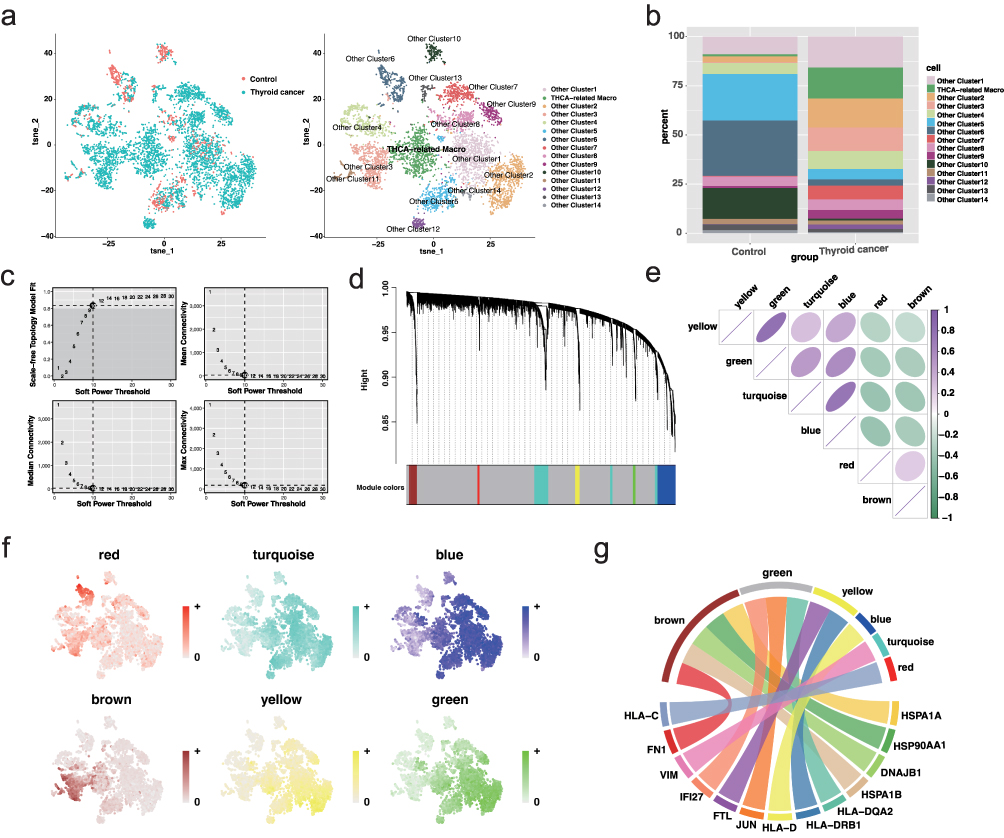 |
Figure 2 Identification of thyroid cancer-associated macrophage subcluster and co-expression modules (a) UMAP plot showing 15 macrophage subclusters across all samples. (b) Stacked bar plot displaying subcluster proportions in tumor and adjacent tissues; THCA-related macrophage subcluster is enriched in tumor samples. (c) Scale-free topology model fit and connectivity analysis identifying soft-threshold power of 10. (d) Dendrogram and module assignment of co-expressed genes using hdWGCNA. (e) Module correlation heatmap indicating positive relationships among green, turquoise, and blue modules. (f) UCell scoring plot showing expression activity of top module genes across macrophage subclusters. (g) Chord diagram showing distribution of THCA-related macrophage marker genes across modules, with the brown module enriched most prominently. |
To investigate the transcriptional programs underpinning this subcluster, we applied high-dimensional weighted gene co-expression network analysis (hdWGCNA). Using the TestSoftPowers function, a soft-thresholding power of 10 was determined to achieve scale-free topology (Figure 2c), allowing the construction of a co-expression network that yielded six distinct gene modules (Figure 2d). Module–module correlation analysis showed strong positive relationships among the green, turquoise, and blue modules (Figure 2e). UCell-based scoring of module-specific top genes revealed similar expression profiles among the green, turquoise, blue, and yellow modules, whereas the red and brown modules exhibited unique, inverse expression trends (Figure 2f). Visualization of the top hub genes in each module further confirmed dense intra-modular connectivity, indicating coordinated transcriptional regulation within these gene networks (Figure S3). Notably, analysis of marker gene distribution within modules indicated that the brown module was most enriched for marker genes of the THCA-related Macro population (Figure 2g), supporting its identity as the core transcriptional program associated with tumor-specific macrophages.
Construction of a Prognostic Model Using 117 Machine Learning Algorithms
Based on the previously identified key genes from the tumor-associated macrophage module, we constructed a prognostic model for thyroid cancer using data from TCGA. The dataset included complete survival information for 513 tumor samples. We applied 117 machine learning algorithm combinations to build and evaluate survival prediction models (Figure 3a). Among them, the combination of StepCox[both] and Random Survival Forest (RSF) demonstrated the best performance, with a concordance index (C-index) of 0.98 in the training cohort and 0.85 in the validation cohort.
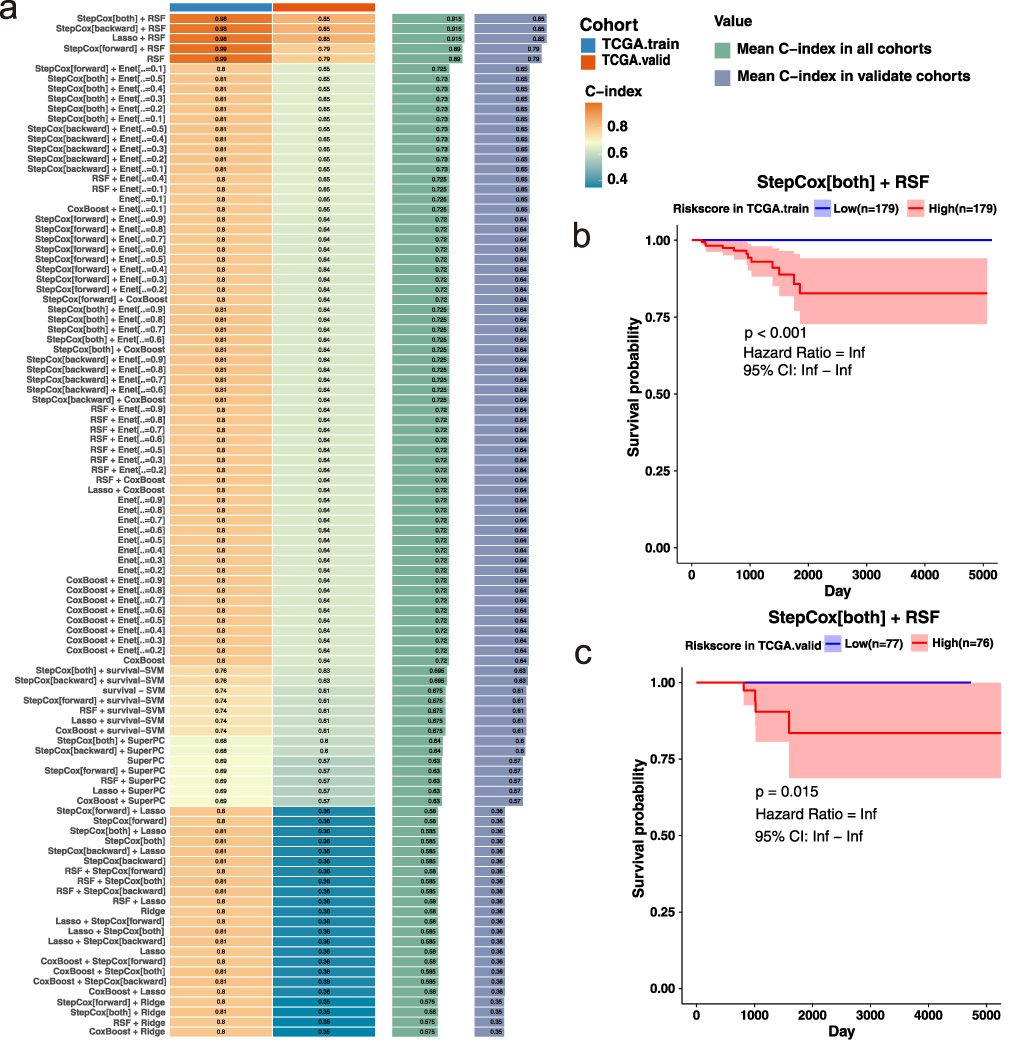 |
Figure 3 Construction and validation of a prognostic model using 117 machine learning algorithms (a) Heatmap of C-index values for all algorithm combinations across the training and validation cohorts. The StepCox[both] + RSF model achieved the highest performance (training: C-index = 0.98; validation: C-index = 0.85). (b) Kaplan–Meier survival curve for the training cohort stratified by risk score. Patients in the low-risk group exhibited significantly better survival outcomes. (c) Kaplan–Meier survival curve for the validation cohort, confirming the model’s predictive power in an independent dataset. |
To further assess the prognostic value of the model, we stratified patients into high- and low-risk groups based on the calculated risk scores and plotted Kaplan–Meier (KM) survival curves for both training and validation cohorts (Figure 3b and c). The results showed that the model effectively distinguished between patients with favorable and poor prognoses. Notably, in the low-risk group of the training cohort, no death events were observed, highlighting the robustness of the model’s predictive power.
Clinical Correlation and Functional Pathway Analysis of the Risk Score
To evaluate the clinical relevance of the prognostic model, we examined the distribution of risk scores across different clinical subgroups. As shown in boxplots, patients with advanced-stage thyroid cancer (Stage III & IV) exhibited significantly higher risk scores compared to those in early stages (Stage I & II), and individuals aged over 60 had higher risk scores than younger patients (Figure 4a and b). These findings indicate that the risk score generated by our model is consistent with established clinical prognostic factors. The GeneMANIA network (Figure 4c) depicts the interactions among genes included in the thyroid cancer risk model, highlighting three hub genes that occupy central positions with strong functional connectivity and potential regulatory roles in tumor pathogenesis. Consistently, SMYD3, DNAJB1, and HSPA6 were significantly upregulated in thyroid cancer tissues compared with normal controls (Figure 4d). Additionally, differential expression analysis between high- and low-risk groups identified 177 genes, with 164 upregulated and 13 downregulated in the high-risk group (Figure 4e and Figure S4). GSEA results based on GO and KEGG databases showed that the high-risk group was significantly enriched in focal adhesion and ECM–receptor interaction pathways (Figure 4f), suggesting that elevated extracellular matrix remodeling and cell adhesion signaling may underlie the poor prognosis observed in this group.
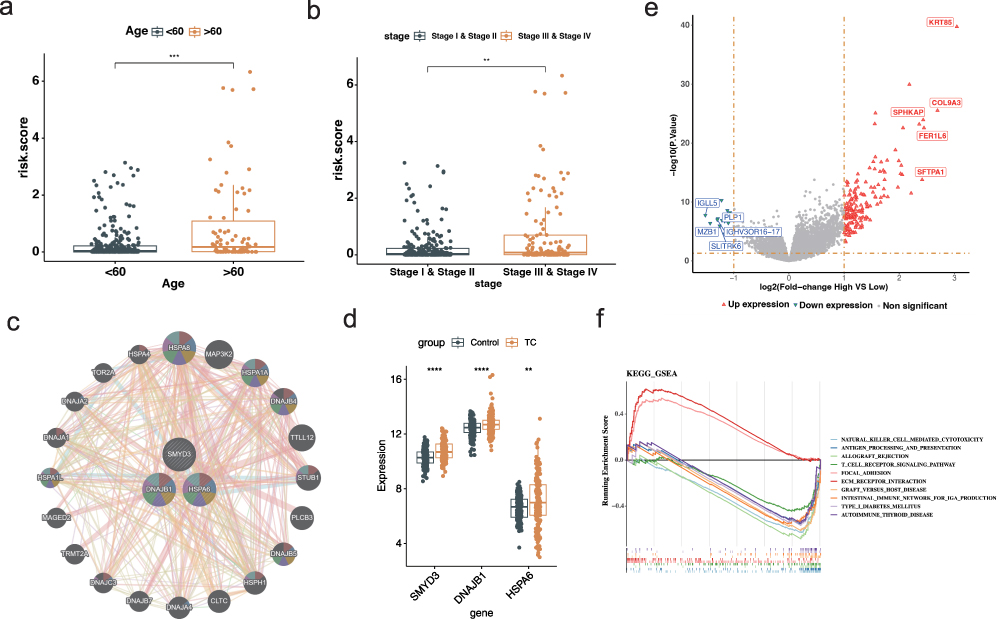 |
Figure 4 Clinical correlation and functional enrichment analysis based on the risk score (a) Boxplot of risk scores across clinical stages. ***p<0.001. (b) Boxplot of risk scores stratified by age. **p<0.01. (c) Gene–gene interaction network generated by GeneMANIA. (d) Boxplot showing differential expression levels of SMYD3, DNAJB1, and HSPA6 between normal and thyroid cancer tissues in the TCGA-THCA cohort. **p<0.01, ****p<0.0001. (e) Volcano plot illustrating differentially expressed genes between high- and low-risk groups. (f) Gene Set Enrichment Analysis showing that high-risk patients are significantly enriched in immune-related pathways. |
Nomogram Construction and Evaluation of Independent Prognostic Factors
Given the robustness of our risk model in stratifying thyroid cancer prognosis, we next assessed its potential for clinical application by integrating other key clinical variables. We first conducted univariate and multivariate Cox regression analyses to evaluate whether age, tumor stage, and the model-derived risk score serve as independent prognostic factors. Univariate analysis revealed that all three variables were significantly associated with patient survival (Figure 5a). However, in multivariate analysis, only age and risk score remained statistically significant, indicating their independent prognostic value (Figure 5a). Based on these findings, we constructed a nomogram combining age and risk score to predict 1-, 2-, and 3-year survival probabilities (Figure 5b). The calibration curves indicated good concordance between predicted and observed outcomes (Figure 5c), and decision curve analysis demonstrated the added net benefit of the nomogram model across clinical thresholds (Figure 5d). Additionally, ROC curve analysis yielded high AUC values across all time points, confirming the nomogram’s high accuracy and discriminative power (Figure 5e). These results support the clinical utility of the combined model for individualized prognosis assessment in thyroid cancer patients.
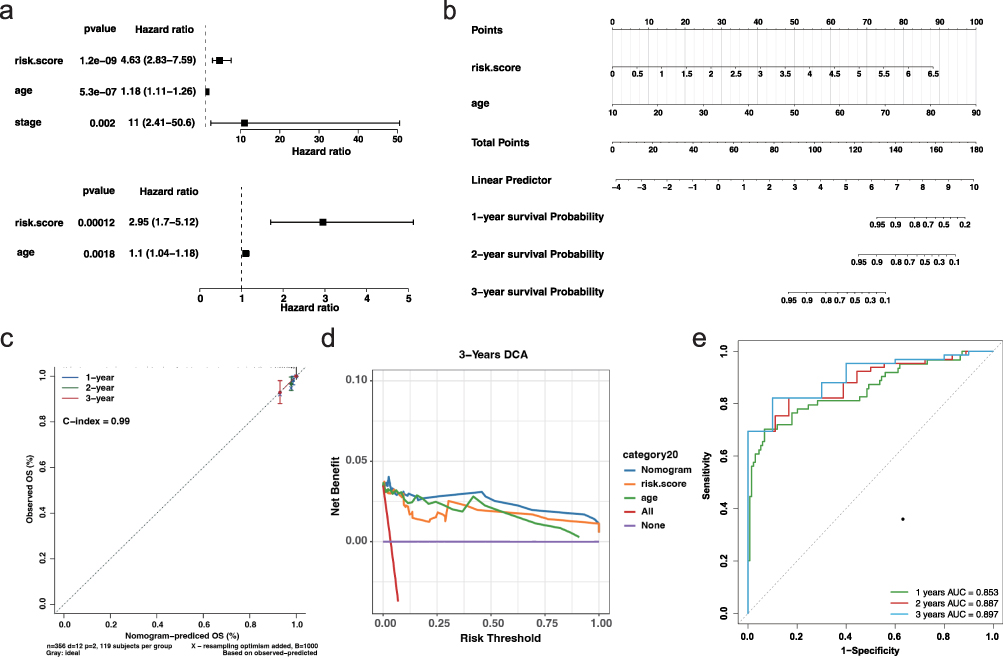 |
Figure 5 Nomogram construction and validation of independent prognostic factors (a) Univariate (top) and multivariate (bottom) Cox regression analyses for risk score, age, and tumor stage. (b) Nomogram incorporating age and risk score to predict 1-, 2-, and 3-year survival probabilities. (c) Calibration curves showing strong agreement between predicted and observed survival at 1, 2, and 3 years. (d) DCA for 3-year survival indicating net clinical benefit of the nomogram over individual predictors. (e) Time-dependent ROC curves for 1-, 2-, and 3-year survival prediction. |
Somatic Mutation Profiling Reveals Divergent Genomic Landscapes Between Risk Groups
To explore the mutational characteristics associated with different prognostic groups, we downloaded somatic mutation data for thyroid cancer patients from the TCGA database using the TCGAbiolinks package. Subsequent analysis using the “maftools” package revealed notable differences in mutational landscapes between low- and high-risk groups (Figure 6a and b). Interestingly, the BRAF gene, a well-established driver in thyroid cancer, was mutated in 65% of low-risk patients but only in 57% of those in the high-risk group, suggesting that classical BRAF-driven pathways may be less dominant in more aggressive tumors. In contrast, other genes such as TTN, NRAS, HRAS, and TG showed slightly elevated mutation frequencies in the high-risk group. Moreover, the proportion of patients harboring at least one somatic alteration was higher in the high-risk cohort (79.3%) than in the low-risk cohort (72.5%). These findings suggest that the high-risk group may possess a more complex mutational profile, potentially involving alternative oncogenic pathways that contribute to poorer prognosis and resistance to conventional treatment strategies.
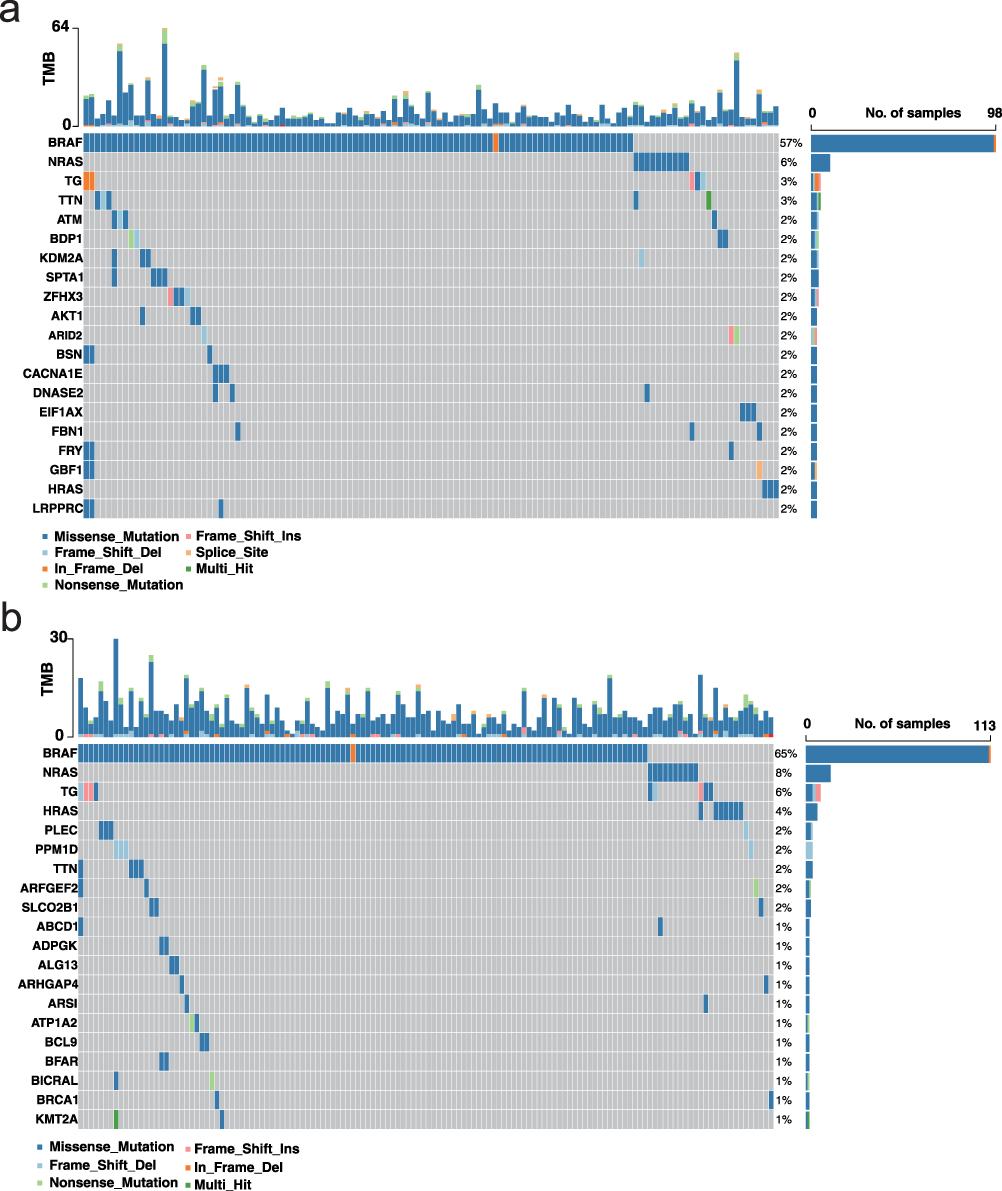 |
Figure 6 Somatic mutation landscape in low- and high-risk thyroid cancer groups (a) Waterfall plot of somatic mutations in the low-risk group. Alterations were detected in 124 of 171 samples (72.51%). The x-axis represents individual samples; the left y-axis shows the top mutated genes; and the right y-axis indicates the mutation frequency of each gene across the cohort. (b) Waterfall plot of somatic mutations in the high-risk group. Alterations were detected in 138 of 174 samples (79.31%). The plot structure is consistent with (a). |
Prediction of Immunotherapy Response and Chemotherapeutic Sensitivity in High-Risk Patients
To explore potential treatment strategies for high-risk thyroid cancer patients, we assessed their predicted responsiveness to immunotherapy and chemotherapy. First, immunotherapy sensitivity was evaluated using the Tumor Immune Dysfunction and Exclusion (TIDE) algorithm. Although most immune-related indicators showed no significant trends, high-risk patients demonstrated elevated T-cell exclusion scores, suggesting possible immune evasion via impaired T-cell infiltration (Figure 7a). Correlation analysis between the risk score and immune sensitivity metrics further confirmed this association (Figure 7b and Figure S5). Additionally, immune cell infiltration analysis revealed significant differences in B cell and CD4+ T cell infiltration between the two risk groups (Figure S6a and b), along with substantial variation in immune and stromal scores across groups (Figure S6c), reinforcing the hypothesis of distinct immune microenvironments.
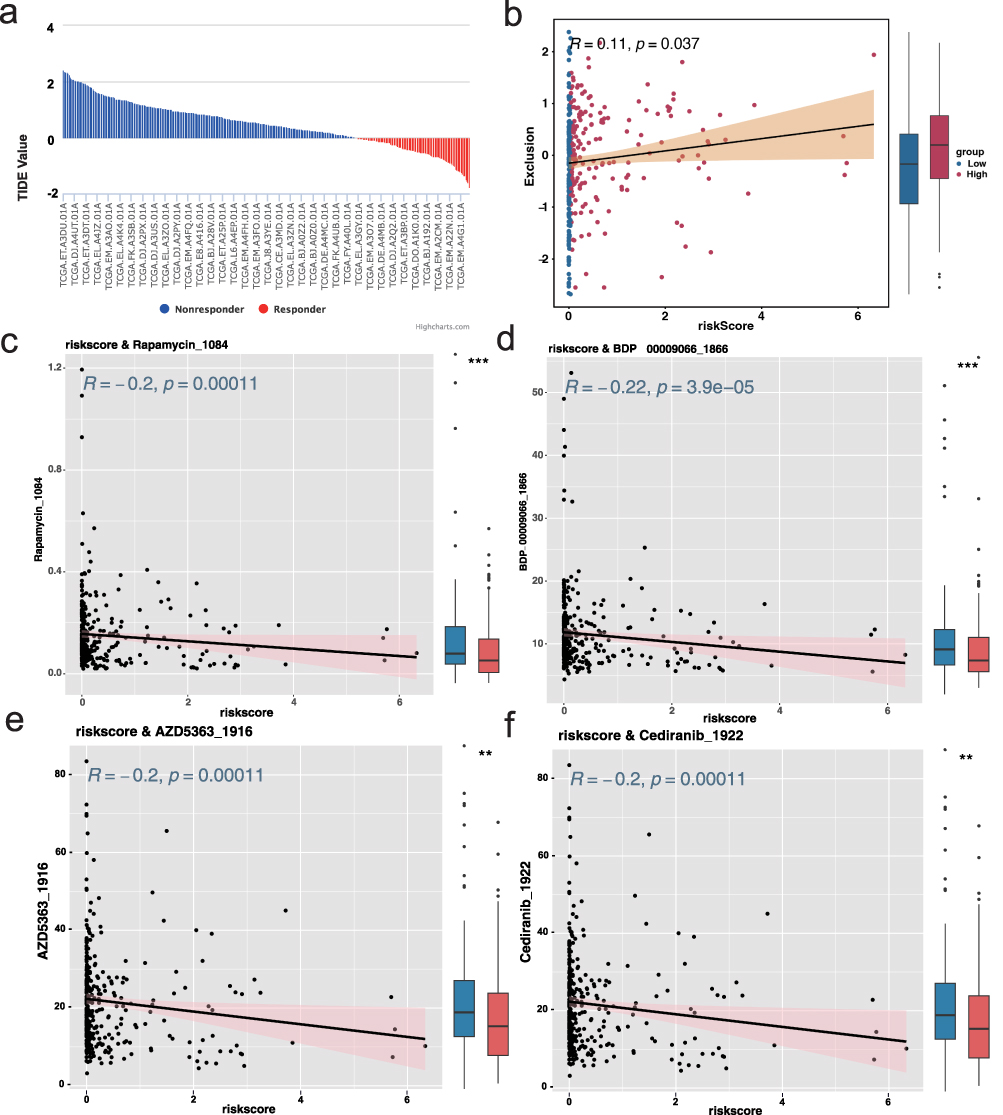 |
Figure 7 Prediction of immunotherapy response and chemotherapeutic sensitivity based on risk score (a) Bar plot showing predicted T-cell exclusion scores from the TIDE algorithm, indicating elevated immune evasion in the high-risk group. (b) Scatter plot showing a significant positive correlation between risk score and T-cell exclusion. (c–f) Scatter plots demonstrating predicted drug sensitivity (IC50) correlated with risk score for four compounds: Rapamycin, BDP-00009066, AZD5363_1916, and Cediranib_1922. All drugs showed higher predicted sensitivity in high-risk patients (R ≥ 0.2, p < 0.05). |
Next, we predicted chemotherapeutic response using the “oncoPredict” R package, leveraging version 2 of the Genomics of Drug Sensitivity in Cancer (GDSC) database. A predictive model was built using gene expression data from 805 cancer cell lines across 198 drugs and 17,419 genes. IC50 values for each drug were estimated in individual patient samples, and correlation analysis identified four candidate agents—Rapamycin, BDP-00009066, AZD5363_1916, and Cediranib_1922—that exhibited significantly increased predicted sensitivity in high-risk patients (correlation ≥ 0.2, p < 0.05; Figure 7c–f). When the selection threshold was relaxed (correlation ≥ 0.15, p < 0.05), 29 potentially effective compounds were identified (Figure S7), offering a broader therapeutic landscape for personalized treatment of high-risk thyroid cancer patients.
SMYD3 Knockdown Suppresses Proliferation and Migration of Thyroid Cancer Cells
Given that SMYD3 was identified as one of the most central risk genes (Figure 4c), and showed both elevated expression in high-risk thyroid cancer patients and strong association with poor prognosis (Figure S8), We next evaluated the impact of SMYD3 on thyroid cancer cell proliferation and migration, we first designed three siRNAs targeting SMYD3 and identified #1 siRNA as the most effective candidate (Figure 8a). Western blot analysis confirmed a significant reduction in SMYD3 protein expression in the si-SMYD3 group compared to the si-scramble control (Figure 8b). CCK-8 assays revealed that SMYD3 knockdown led to a significant decrease in cell viability at early time points (6 h and 12 h), although the difference was not sustained beyond 24 h (Figure 8c). In line with this observation, wound healing assays showed a marked reduction in cell migratory capacity upon SMYD3 silencing (Figure 8d). Colony formation assays further indicated that SMYD3 knockdown significantly impaired the clonogenic potential of thyroid cancer cells (Figure 8e). Consistently, EdU incorporation assays demonstrated a clear reduction in proliferating cells following SMYD3 knockdown (Figure 8f), supporting its role in promoting tumor cell proliferation. At the molecular level, qPCR analysis revealed that SMYD3 knockdown significantly upregulated the epithelial marker CDH1 and downregulated the mesenchymal markers CDH2 and TJP1 (Figure 8g). Western blot assays showed increased expression of E-cadherin and decreased expression of N-cadherin, further supporting the inhibition of epithelial–mesenchymal transition (EMT) upon SMYD3 suppression (Figure 8h). These findings collectively suggest that SMYD3 promotes thyroid cancer cell proliferation and migration, potentially by modulating EMT-related pathways.
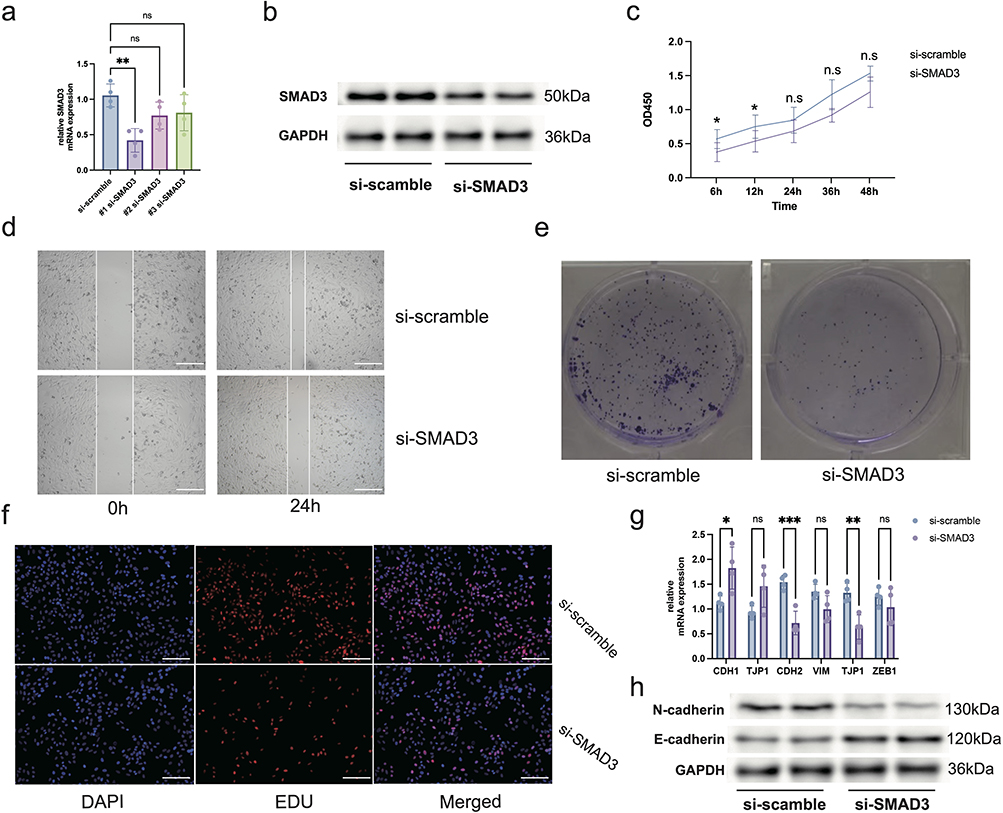 |
Figure 8 SMYD3 knockdown suppresses thyroid cancer cell proliferation and migration (a) qPCR results confirming efficient knockdown of SMYD3 expression in thyroid cancer cells using siRNA. n = 4, ns = no significance, **p<0.01. (b) Western blot of SMYD3 protein following siRNA transfection. (c) CCK-8 assay showing reduced cell viability upon SMYD3 knockdown. n = 6, ns = no significance, *p<0.05. (d) Wound healing assay demonstrating impaired migratory capacity in SMYD3-silenced cells. (e) Colony formation assay indicating decreased clonogenic potential after SMYD3 knockdown. (f) EdU incorporation assay confirming diminished cell proliferation in the si-SMYD3 group. (g) qPCR results of EMT markers. n = 3, ns = no significance, *p<0.05, **p<0.01, ***p<0.001. (h) Western blot of CDH1 and CDH2 protein levels. Scale bar: 50μm. |
SMYD3 Knockdown Reduces Sensitivity to Predicted Therapeutic Compounds in Thyroid Cancer Cells
To investigate whether SMYD3 contributes to the heightened drug sensitivity observed in the high-risk group identified by our prognostic model, we performed IC50 assays following SMYD3 knockdown. Based on the drug sensitivity prediction results from Figure 7, four candidate compounds—Rapamycin, BDP-00009066, AZD5363_1916, and Cediranib_1922—were selected for validation. As shown in Figure 9, knockdown of SMYD3 led to a significant increase in the IC50 value of AZD5363_1916 compared to control cells, indicating reduced sensitivity to this compound upon SMYD3 silencing. In contrast, the IC50 values of Rapamycin, BDP-00009066, and Cediranib_1922 showed no significant changes between the si-SMYD3 and si-NC groups. These results suggest that SMYD3 expression may selectively modulate the therapeutic efficacy of AZD5363_1916, potentially enhancing its cytotoxic effect in SMYD3-high thyroid cancer cells. This finding may partially explain the increased predicted sensitivity to AZD5363_1916 observed in high-risk patients characterized by elevated SMYD3 expression. Collectively, these results highlight the potential mechanistic link between SMYD3 and drug response in thyroid cancer, further reinforcing the clinical relevance of SMYD3 as both a prognostic and therapeutic marker.
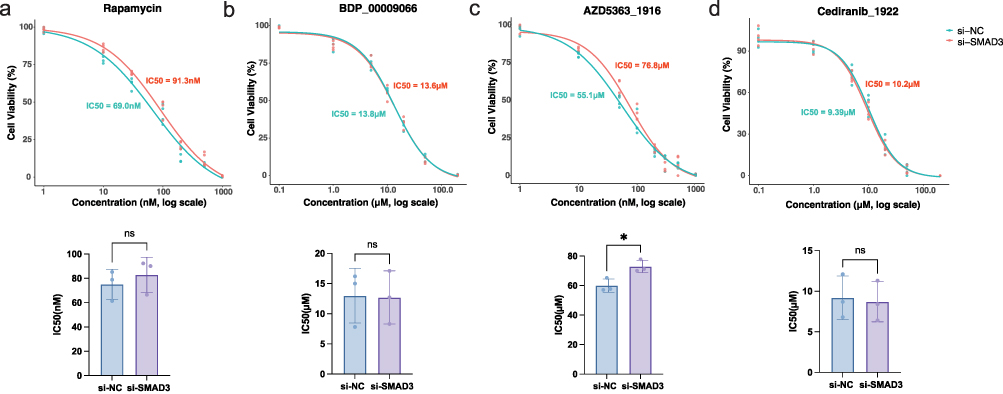 |
Figure 9 SMYD3 knockdown reduces sensitivity to high-risk-associated compounds in thyroid cancer cells (a–d) Bar plots showing IC50 values for Rapamycin, BDP-00009066, AZD5363_1916, and Cediranib_1922 in thyroid cancer cells with or without SMYD3 knockdown. n = 3. ns = no significance, *p<0.05. |
Discussion
Thyroid cancer is a heterogeneous endocrine malignancy whose pathogenesis remains incompletely understood. Increasing evidence suggests that immune cells, particularly macrophages, are not merely bystanders in the TME, but active participants in promoting tumor growth, progression, and immune escape.12,18 Understanding how tumor-associated macrophages contribute to thyroid cancer progression has become increasingly important for improving prognostic assessment and guiding therapy. In this study, using high-resolution single-cell transcriptomic profiling, we identified macrophages as a highly enriched immune population within thyroid cancer tissues compared to adjacent normal samples. Through subcluster analysis, we further defined a distinct tumor-associated macrophage (THCA-related Macro) subpopulation that appeared to be uniquely involved in the tumor context, and subsequently integrated its transcriptional features into a survival prediction model using 117 machine learning algorithms. This integrative framework enabled robust risk stratification of thyroid cancer patients, and provided a foundation for identifying SMYD3, DNAJB1, and HSPA6 as key risk-associated genes, among which SMYD3 was further functionally validated for its role in regulating tumor cell behavior and drug response.
Thyroid tumor progression is frequently accompanied by a phenotypic shift of macrophages toward a pro-tumoral M2-like state, consistent with prior studies demonstrating that human monocytes exposed to aged thyrocytes or tumor-conditioned medium acquire M2 characteristics and tumor-promoting functions.30 Thyroid cancer cells enhance lipid biosynthesis and cytokine secretion in macrophages to support tumor growth,31 and that macrophages undergo an M1-to-M2 transition during tumor evolution based on single-cell transcriptomic evidence.32 In our analysis, further examination of the brown module using canonical M1/M2 and TAM-related markers revealed that this module contains genes such as TGFB1 and ARG1, which are characteristic of M2-leaning or immunoregulatory macrophage states, whereas classical M1 markers including CXCL9 and CCR7 were not enriched. Moreover, the brown module showed strong co-expression with epithelial signaling and ECM-remodeling pathways, a transcriptional pattern frequently associated with immunosuppressive tumor-associated macrophages that facilitate matrix remodeling, invasion, and immune escape in solid tumors.33,34 Collectively, these features indicate that the brown module is more consistent with an M2-like, immunoregulatory TAM phenotype, supporting the presence of a tumor-enriched macrophage subset that may actively contribute to thyroid cancer progression.
Among the intersecting genes from the macrophage-related module and machine learning-based feature selection, three hub genes—SMYD3, DNAJB1, and HSPA6—were identified as core components of the prognostic model, then we conducted functional experiments focusing on SMYD3, the most prominently upregulated gene in high-risk patients. Knockdown of SMYD3 in TPC-1 thyroid cancer cells led to a significant reduction in cell proliferation, colony formation, and migratory ability, consistent with its proposed oncogenic role. SMYD3 knockdown led to increased expression of the epithelial marker E-cadherin and decreased expression of mesenchymal markers N-cadherin and TJP1, suggesting a reversal of EMT. These findings are consistent with previous studies implicating SMYD3 as an epigenetic regulator that promotes tumor progression by methylating histone H3 lysine 4 (H3K4me3), thereby activating oncogenic transcriptional programs.35 In other cancer types, such as hepatocellular carcinoma and medulloblastoma, SMYD3 has been shown to upregulate proliferation-associated genes including cyclin D1 and c-Myc.36,37 Although we did not investigate the direct transcriptional targets of SMYD3 in thyroid cancer, the observed EMT modulation suggests that SMYD3 may influence tumor aggressiveness by regulating gene networks involved in cell adhesion, cytoskeletal remodeling, and motility. Future chromatin immunoprecipitation (ChIP) studies are warranted to delineate the genome-wide binding profile of SMYD3 in thyroid cancer cells.
In addition to mechanistic insights, our study provides important translational implications. High-risk patients exhibited distinct immune characteristics, including elevated T-cell exclusion scores and altered immune cell infiltration, which may contribute to reduced responsiveness to immunotherapy. Drug sensitivity prediction further identified several compounds—such as Rapamycin and AZD5363_1916—that may offer increased therapeutic benefit in this subgroup. Notably, functional assays demonstrated that SMYD3 knockdown markedly decreased the sensitivity of thyroid cancer cells to AZD5363_1916, implying that SMYD3 may influence the therapeutic efficacy of AKT inhibitors. A plausible explanation, supported by prior studies, is that SMYD3—previously characterized as a histone methyltransferase—can transcriptionally activate components of the PI3K/AKT pathway, including AKT1 and downstream effectors such as CCND1,38,39 thereby enhancing cellular dependence on this signaling axis. Loss of SMYD3 may attenuate this pathway activity, diminish drug dependency, and lead to higher IC50 values. From a clinical perspective, SMYD3-related macrophage signatures identified in our study hold potential for practical application. The SMYD3-based risk score may refine patient stratification at diagnosis, particularly for individuals with intermediate clinical features. Moreover, given its strong association with TAM infiltration and macrophage-driven immunosuppressive remodeling of the tumor microenvironment, SMYD3 may serve as a biomarker to identify patients who could benefit from macrophage-targeted therapies such as CSF1R inhibitors, CD47/SIRPα blockade, or TAM-reprogramming agents.40–42 Additionally, the correlation between SMYD3 expression and predicted sensitivity to multiple targeted or immunomodulatory drugs suggests that SMYD3-guided drug selection may help optimize personalized treatment strategies. Collectively, these findings highlight the dual value of SMYD3—as both a prognostic indicator and a potential predictive marker for therapeutic decision-making and treatment response monitoring in thyroid cancer.
Limitation
While our study provides novel insights into the prognostic significance of tumor-associated macrophages and key macrophage-related genes in thyroid cancer, several limitations should be noted. First, all transcriptomic data used in this study were derived from publicly available databases such as TCGA and GEO, and lack validation in independent cohorts, especially in local clinical samples from our institution. This may limit the applicability of the findings to broader patient populations. Second, although macrophages were identified as the key immune subset contributing to the tumor microenvironment, our functional validation experiments were performed exclusively in the TPC-1 thyroid cancer cell line rather than in macrophages. As a result, we did not directly assess how manipulation of SMYD3 affects macrophage polarization, activity, or tumor infiltration. Future studies using primary TAMs or macrophage–tumor co-culture systems will be required to substantiate the macrophage-specific mechanisms implicated by our bioinformatic analyses. Third, while we demonstrated that SMYD3 influences tumor cell proliferation and drug sensitivity, the underlying molecular mechanisms—such as its downstream epigenetic targets or crosstalk with oncogenic pathways were not comprehensively explored.
Conclusion
In summary, our study integrates single-cell transcriptomic profiling, high-dimensional co-expression network analysis, and ensemble machine learning to identify a distinct tumor-associated macrophage subpopulation and its transcriptional programs in thyroid cancer. By embedding these macrophage-specific molecular signatures into a robust prognostic model, we significantly improve patient risk stratification and highlight therapeutic vulnerabilities in high-risk individuals. Among the key genes identified, SMYD3, DNAJB1, and HSPA6 emerged as central components of the macrophage-associated module, with SMYD3 further validated through in vitro experiments to promote tumor cell proliferation, migration, and epithelial–mesenchymal transition. These findings suggest that macrophage-driven gene expression programs may influence both tumor behavior and therapeutic response. Future work should focus on the mechanistic dissection of these genes in immune–tumor cell interactions and their potential as targets for macrophage-reprogramming or combinatorial therapies, paving the way for clinically actionable strategies in thyroid cancer management.
Data Sharing Statement
All datasets used in this study are publicly available. The single-cell RNA-seq dataset GSE184362 was downloaded from the GEO database (https://www.ncbi.nlm.nih.gov/geo/), and bulk transcriptomic and mutation data were obtained from The Cancer Genome Atlas (https://portal.gdc.cancer.gov/).
Ethics Approval and Consent to Participate
This study used only publicly available human transcriptomic datasets from GEO and TCGA. According to national legislation—Article 32, Items 1 and 2 of the Measures for Ethical Review of Life Science and Medical Research Involving Human Subjects (2023, China)—research that exclusively utilizes publicly accessible human data without involving identifiable private information may be exempt from institutional ethical review. In accordance with these regulations, the Ethics Committee of the Anhui No.2 Provincial People’s Hospital reviewed this study and granted an official exemption (Approval No. (R)2025-128-01).
Acknowledgments
The authors thank the contributors of GEO and TCGA for generating and publicly sharing the datasets used in this study.
Author Contributions
All authors made a significant contribution to the work reported, whether that is in the conception, study design, execution, acquisition of data, analysis and interpretation, or in all these areas; took part in drafting, revising or critically reviewing the article; gave final approval of the version to be published; have agreed on the journal to which the article has been submitted; and agree to be accountable for all aspects of the work.
Funding
This work was supported by the Health Commission of Anhui Province under Grant No. AHWJ2023BAa20108.
Disclosure
The authors declare that they have no known competing financial interests or personal relationships that could have appeared to influence the work reported in this paper.
References
1. Lim H, Devesa SS, Sosa JA, Check D, Kitahara CM. Trends in thyroid cancer incidence and mortality in the United States, 1974-2013. JAMA. 2017;317(13):1338–18. doi:10.1001/jama.2017.2719
2. Kitahara CM, Pfeiffer RM, Sosa JA, Shiels MS. Impact of overweight and obesity on us papillary thyroid cancer incidence trends (1995-2015). J Natl Cancer Inst. 2020;112(8):810–817. doi:10.1093/jnci/djz202
3. Boucai L, Zafereo M, Cabanillas ME. Thyroid cancer: a review. JAMA. 2024;331(5):425–435. doi:10.1001/jama.2023.26348
4. Hamzany Y, Soudry E, Strenov Y, et al. Early death from papillary thyroid carcinoma. Am J Otolaryngol. 2012;33(1):104–108. doi:10.1016/j.amjoto.2011.04.002
5. Chen K, Wang H, Ilyas I, Mahmood A, Hou L. Microglia and astrocytes dysfunction and key neuroinflammation-based biomarkers in parkinson’s disease. Brain Sci. 13(4). doi:10.3390/brainsci13040634
6. Bhattacharya S, Mahato RK, Singh S, Bhatti GK, Mastana SS, Bhatti JS. Advances and challenges in thyroid cancer: the interplay of genetic modulators, targeted therapies, and AI-driven approaches. Life Sci. 2023;332:122110. doi:10.1016/j.lfs.2023.122110
7. Boudina M, Zisimopoulou E, Xirou P, Chrisoulidou A. Aggressive types of malignant thyroid neoplasms. J Clin Med. 2024;13(20). doi:10.3390/jcm13206119
8. Liu H, Yang D, Li L, Tu Y, Chen C, Sun S. Appraisal of radioiodine refractory thyroid cancer: advances and challenges. Am J Cancer Res. 2020;10(7):1923–1936.
9. Lyu Z, Zhang Y, Sheng C, Huang Y, Zhang Q, Chen K. Global burden of thyroid cancer in 2022: incidence and mortality estimates from GLOBOCAN. Chin Med J. 2024;137(21):2567–2576. doi:10.1097/cm9.0000000000003284
10. Stojsavljevic A, Rovcanin B, Krstic D, et al. Evaluation of trace metals in thyroid tissues: comparative analysis with benign and malignant thyroid diseases. Ecotoxicol Environ Saf. 2019;183:109479. doi:10.1016/j.ecoenv.2019.109479
11. Brylinski L, Kostelecka K, Wolinski F, et al. Effects of trace elements on endocrine function and pathogenesis of thyroid diseases-a literature review. Nutrients. 2025;17(3). doi:10.3390/nu17030398
12. Jaume JC. Thyroid Cancer-The Tumor Immune Microenvironment (TIME) over Time and Space. Cancers. 2025;17(5). doi:10.3390/cancers17050794
13. Pu W, Shi X, Yu P, et al. Single-cell transcriptomic analysis of the tumor ecosystems underlying initiation and progression of papillary thyroid carcinoma. Nat Commun. 2021;12(1):6058. doi:10.1038/s41467-021-26343-3
14. Xiang X, Wang J, Lu D, Xu X. Targeting tumor-associated macrophages to synergize tumor immunotherapy. Signal Transduct Target Ther. 2021;6(1):75. doi:10.1038/s41392-021-00484-9
15. Vitale I, Manic G, Coussens LM, Kroemer G, Galluzzi L. Macrophages and metabolism in the tumor microenvironment. Cell Metab. 2019;30(1):36–50. doi:10.1016/j.cmet.2019.06.001
16. Kzhyshkowska J, Shen J, Larionova I. Targeting of TAMs: can we be more clever than cancer cells? Cell Mol Immunol. Cellular & Molecular Immunology. 2024;21(12):1376–1409. doi:10.1038/s41423-024-01232-z
17. Noy R, Pollard JW. Tumor-associated macrophages: from mechanisms to therapy. Immunity. 2014;41(1):49–61. doi:10.1016/j.immuni.2014.06.010
18. Zhu L, Li XJ, Gangadaran P, Jing X, Ahn BC. Tumor-associated macrophages as a potential therapeutic target in thyroid cancers. Cancer Immunol Immunother. 2023;72(12):3895–3917. doi:10.1007/s00262-023-03549-6
19. Liu J, Geng X, Hou J, Wu G. New insights into M1/M2 macrophages: key modulators in cancer progression. Cancer Cell Int. 2021;21(1):389. doi:10.1186/s12935-021-02089-2
20. de Sande B V, Lee JS, Mutasa-Gottgens E, et al. Applications of single-cell RNA sequencing in drug discovery and development. Nat Rev Drug Discov. 2023;22(6):496–520. doi:10.1038/s41573-023-00688-4
21. Zhang Y, Wang D, Peng M, et al. Single-cell RNA sequencing in cancer research. J Exp Clin Cancer Res. 2021;40(1):81. doi:10.1186/s13046-021-01874-1
22. Hao Y, Stuart T, Kowalski MH, et al. Dictionary learning for integrative, multimodal and scalable single-cell analysis. Nat Biotechnol. 2024;42(2):293–304. doi:10.1038/s41587-023-01767-y
23. Qiu X, Mao Q, Tang Y, et al. Reversed graph embedding resolves complex single-cell trajectories. Nat Methods. 2017;14(10):979–982. doi:10.1038/nmeth.4402
24. Morabito S, Reese F, Rahimzadeh N, Miyoshi E, Swarup V. hdWGCNA identifies co-expression networks in high-dimensional transcriptomics data. Cell Rep Methods. 2023;3(6):100498. doi:10.1016/j.crmeth.2023.100498
25. Andreatta M, Carmona SJ. UCell: robust and scalable single-cell gene signature scoring. Comput Struct Biotechnol J. 2021;19:3796–3798. doi:10.1016/j.csbj.2021.06.043
26. Liu H, Zhang W, Zhang Y, et al. Mime: a flexible machine-learning framework to construct and visualize models for clinical characteristics prediction and feature selection. Comput Struct Biotechnol J. 2024;23:2798–2810. doi:10.1016/j.csbj.2024.06.035
27. Love MI, Huber W, Anders S. Moderated estimation of fold change and dispersion for RNA-seq data with DESeq2. Genome Biol. 2014;15(12):550. doi:10.1186/s13059-014-0550-8
28. Xu S, Hu E, Cai Y, et al. Using clusterProfiler to characterize multiomics data. Nat Protoc. 2024;19(11):3292–3320. doi:10.1038/s41596-024-01020-z
29. Heagerty PJ, Lumley T, Pepe MS. Time-dependent ROC curves for censored survival data and a diagnostic marker. Biometrics. 2000;56(2):337–344. doi:10.1111/j.0006-341x.2000.00337.x
30. Mazzoni M, Mauro G, Erreni M, et al. Senescent thyrocytes and thyroid tumor cells induce M2-like macrophage polarization of human monocytes via a PGE2-dependent mechanism. J Exp Clin Cancer Res. 2019;38(1):208. doi:10.1186/s13046-019-1198-8
31. Rabold K, Aschenbrenner A, Thiele C, et al. Enhanced lipid biosynthesis in human tumor-induced macrophages contributes to their protumoral characteristics. J Immunother Cancer. 2020;8(2):e000638. doi:10.1136/jitc-2020-000638
32. Lu L, Wang JR, Henderson YC, et al. Anaplastic transformation in thyroid cancer revealed by single-cell transcriptomics. J Clin Invest. 133(11). doi:10.1172/jci169653
33. Yu S, Wang S, Wang X, Xu X. The axis of tumor-associated macrophages, extracellular matrix proteins, and cancer-associated fibroblasts in oncogenesis. Cancer Cell Int. 2024;24(1):335. doi:10.1186/s12935-024-03518-8
34. Yuan Z, Li Y, Zhang S, et al. Extracellular matrix remodeling in tumor progression and immune escape: from mechanisms to treatments. Mol Cancer. 2023;22(1):48. doi:10.1186/s12943-023-01744-8
35. Bernard BJ, Nigam N, Burkitt K, Saloura V. SMYD3: a regulator of epigenetic and signaling pathways in cancer. Clin Clin Epigenet. 2021;13(1):45. doi:10.1186/s13148-021-01021-9
36. Zhang H, Zheng Z, Zhang R, et al. SMYD3 promotes hepatocellular carcinoma progression by methylating S1PR1 promoters. Cell Death Dis. 2021;12(8):731. doi:10.1038/s41419-021-04009-8
37. Asuthkar S, Venkataraman S, Avilala J, et al. SMYD3 Promotes Cell Cycle Progression by Inducing Cyclin D3 Transcription and Stabilizing the Cyclin D1 Protein in Medulloblastoma. Cancers. 2022;14(7). doi:10.3390/cancers14071673
38. Sun J, Xiang Q, Ding D, Yan N. USP10 suppresses ABCG2-induced malignant characteristics of doxorubicin-resistant thyroid cancer by inhibiting PI3K/AKT pathway. J Bioenerg Biomembr. 2023;55(6):457–466. doi:10.1007/s10863-023-09986-3
39. Rascio F, Spadaccino F, Rocchetti MT, et al. The pathogenic role of PI3K/AKT pathway in cancer onset and drug resistance: an updated review. Cancers. 2021;13(16). doi:10.3390/cancers13163949
40. Lv Q, Zhang Y, Gao W, et al. CSF1R inhibition reprograms tumor-associated macrophages to potentiate anti-PD-1 therapy efficacy against colorectal cancer. Pharmacol Res. 2024;202:107126. doi:10.1016/j.phrs.2024.107126
41. Mirza W, Dadan S, Ahmad E, Junaid A, Satti TM. Clinical outcomes and safety of CD47-targeted immunotherapies across hematologic malignancies: a systematic review of monoclonal antibodies and fusion proteins in combination strategies. Clin Exp Med. 2025;25(1):360. doi:10.1007/s10238-025-01915-5
42. Rannikko JH, Hollmén M. Clinical landscape of macrophage-reprogramming cancer immunotherapies. Br J Cancer. 2024;131(4):627–640. doi:10.1038/s41416-024-02715-6
 © 2026 The Author(s). This work is published and licensed by Dove Medical Press Limited. The
full terms of this license are available at https://www.dovepress.com/terms
and incorporate the Creative Commons Attribution
- Non Commercial (unported, 4.0) License.
By accessing the work you hereby accept the Terms. Non-commercial uses of the work are permitted
without any further permission from Dove Medical Press Limited, provided the work is properly
attributed. For permission for commercial use of this work, please see paragraphs 4.2 and 5 of our Terms.
© 2026 The Author(s). This work is published and licensed by Dove Medical Press Limited. The
full terms of this license are available at https://www.dovepress.com/terms
and incorporate the Creative Commons Attribution
- Non Commercial (unported, 4.0) License.
By accessing the work you hereby accept the Terms. Non-commercial uses of the work are permitted
without any further permission from Dove Medical Press Limited, provided the work is properly
attributed. For permission for commercial use of this work, please see paragraphs 4.2 and 5 of our Terms.
Recommended articles
Identification and Evaluation of Lipocalin-2 in Sepsis-Associated Encephalopathy via Machine Learning Approaches
Hu J, Chen Z, Wang J, Xu A, Sun J, Xiao W, Yang M
Journal of Inflammation Research 2025, 18:3843-3858
Published Date: 14 March 2025
Copper Metabolism-Related Genes as Biomarkers in Colon Adenoma and Cancer
Zhang T, Fu Y
International Journal of General Medicine 2025, 18:3021-3043
Published Date: 10 June 2025
Unveiling PANoptosis in Acute Kidney Injury: An Integrative Multi-Dimensional Approach to Identify Key Biomarkers
Wang N, Zhang L, Xu Z, Xu Q, Lu Y, Niu P, Yan L, Wang L, Cao H, Shao F
Journal of Inflammation Research 2025, 18:8735-8754
Published Date: 2 July 2025
PI3 as a Common Hub Gene Linking Atopic Dermatitis and Ulcerative Colitis Through Immune Cell Recruitment Mechanisms
Jian D, Chen J, Yuan J, Namrata K, Su D, Bai B
Journal of Inflammation Research 2025, 18:11853-11868
Published Date: 27 August 2025
Development of a Prognostic Stratification Model and Identification of BDH1 as an Oncoprotein in Breast Cancer Based on Subcluster-Specific Markers of B-Cell Subsets
Kang S, Li Z, Lv C, Zhang F
Breast Cancer: Targets and Therapy 2026, 18:580906
Published Date: 10 March 2026