
Back to Journals » International Journal of Chronic Obstructive Pulmonary Disease » Volume 21
Machine Learning-Based Nomogram with Boruta and LASSO for 28-Day Mortality Prediction in Critical COPD Patients: Role of the Albumin-Corrected Anion Gap
Authors Zhao K  , Tao J, Ni Y , Yu Z, Liu Y, Chen C, Wang L
Received 14 April 2026
Accepted for publication 23 June 2026
Published 9 July 2026 Volume 2026:21 616965
DOI https://doi.org/10.2147/COPD.S616965
Checked for plagiarism Yes
Review by Single anonymous peer review
Peer reviewer comments 2
Editor who approved publication: Prof. Dr. Zijing Zhou
Kelan Zhao, Jieying Tao, Yeling Ni, Ziyu Yu, Yulin Liu, Cilong Chen, Lu Wang
Department of Pulmonary and Critical Care Medicine, The First Affiliated Hospital of Zhejiang Chinese Medical University (Zhejiang Provincial Hospital of Chinese Medicine), Hangzhou, Zhejiang, People’s Republic of China
Correspondence: Lu Wang, Department of Pulmonary and Critical Care Medicine, The First Affiliated Hospital of Zhejiang Chinese Medical University (Zhejiang Provincial Hospital of Chinese Medicine), Hangzhou, Zhejiang, People’s Republic of China, Email [email protected]
Background: Despite the known increased mortality of chronic obstructive pulmonary disease (COPD) patients in the intensive care unit (ICU), robust tools for early risk stratification are limited.
Methods: A total of 1817 patients with critical care COPD were retrospectively identified from the Medical Information Mart for Intensive Care IV (MIMIC-IV) database and randomly split into training and validation cohorts. Least absolute shrinkage and selection operator (LASSO) and Boruta algorithms were used for variable selection. Cox regression, restricted cubic splines (RCS), and Kaplan–Meier survival analyses with Log rank tests were performed, followed by construction of a nomogram. The nomogram was validated using the C-index, receiver operating characteristic (ROC) analysis, and calibration curves, and its clinical utility was assessed using decision curve analysis (DCA).
Results: RCS and Kaplan–Meier analysis substantiated that patients with high Albumin-Corrected Anion Gap (ACAG) levels had significantly higher 28-day mortality. A nomogram was constructed using 12 predictors identified by combining a statistical learning method (LASSO) and a machine learning algorithm (Boruta). The model demonstrated strong discrimination, with C-indices of 0.747 and 0.766, and area under the curve (AUC) values of 0.772 (95% CI: 0.742– 0.801) and 0.795 (95% CI: 0.752– 0.838) in the training and validation cohorts, respectively. Multivariable Cox regression confirmed the nomogram as a useful predictor of mortality both in the training cohort and the validation cohort.
Conclusion: This study established ACAG as an independent predictor of 28-day mortality in COPD patients from ICU. The presented nomogram demonstrated robust performance upon internal validation, offering a practical tool for risk stratification.
Keywords: chronic obstructive pulmonary disease, albumin-corrected anion gap, machine learning, nomogram
Introduction
Chronic obstructive pulmonary disease (COPD) is a common respiratory disease marked by persistent, typically progressive airflow limitation that results from an enhanced chronic inflammatory response in the lungs to inhaled noxious particles, such as tobacco smoke and pollutants.1,2 As a major public health concern, COPD affected an estimated 10.3% of the global population aged 30–79 in 2019, accounting for approximately 3.197 million fatalities.3,4 This substantial disease burden underpinned its recognition as the world’s fourth leading cause of death in 2021, and it continues to impose a severe socioeconomic burden worldwide.5,6 Evidence also indicates that comorbid COPD increases 28-day ICU mortality, a risk that is especially elevated in cardiac surgery recovery unit patients.7 Therefore, there is an urgent need for further research to elucidate the underlying mechanisms and establish a nomogram for improved mortality prediction.
Anion gap (AG), a widely used and economical indicator, is derived by subtracting the combined concentrations of chloride and bicarbonate from the sodium concentration in a routine electrolyte panel. It provides crucial clues for identifying acid-base disturbances, certain hematologic cancers, and intoxications.8 Albumin, a conventional indicator of malnutrition, is defined as a negative acute-phase protein that binds numerous inflammatory mediators, thereby regulating oxidative stress during inflammatory responses.9,10 Previous researches have revealed that AG is associated with a spectrum of conditions, including sepsis and various cardiovascular diseases.11–13 However, in critically ill patients, hypoalbuminemia is highly prevalent, which complicates the interpretation of acid-base data by masking the diagnosis of acidosis and potentially leading to false-negative results.14 Consequently, unlike the ordinary anion gap level which does not account for albumin, the albumin-corrected anion gap (ACAG) provides a more accurate reflection of the acid-base status and offers superior predictive performance for mortality in ICU patients with COPD. Although ACAG has been shown to predict mortality in ICU patients with COPD, no nomogram incorporating this index is currently available for clinical use.
To build a clinically interpretable yet robust model incorporating the ACAG, we adopted a hybrid machine learning and traditional regression approach. Specifically, Boruta and Least absolute shrinkage and selection operator (LASSO) were used for feature selection to handle high-dimensional data and reduce overfitting, while logistic regression was applied to construct a nomogram for clinical usability. This retrospective study enrolled 1817 intensive care unit (ICU) patients with COPD from the Medical Information Mart for Intensive Care IV (MIMIC-IV, version 2.2) database. The objectives of this study are to evaluate the ability of ACAG to predict mortality and to develop a prognostic nomogram that incorporates ACAG and other independent risk factors for estimating 28-day mortality.
Methods
Data Sources
The data for this analysis were sourced from the MIMIC-IV database, a publicly available, critical care database containing information for patients admitted to the Beth Israel Deaconess Medical Center from 2008 to 2019.15 Due to the de-identified nature of the patient data used in this retrospective study, the need for obtaining informed consent was waived by the institutional ethical review board. The first author (Kelan Zhao) completed and passed the Collaborative Institutional Training Initiative program (ID: 11773736) and obtained all data for this study.
Study Population
The initial patient pool with COPD was selected using the International Classification of Diseases, Ninth and Tenth Revisions (ICD-9 and ICD-10) (code = 49,120, 49,121, 49,122, 496, J44, J440, J441 and J449).16 This cohort was further refined by applying the following exclusion criteria: age < 18 years, ICU length of stay < 24 hours, and non-first ICU admissions. Subsequent exclusion of individuals with missing admission ACAG data resulted in a final study population of 1817 patients. (Figure 1).
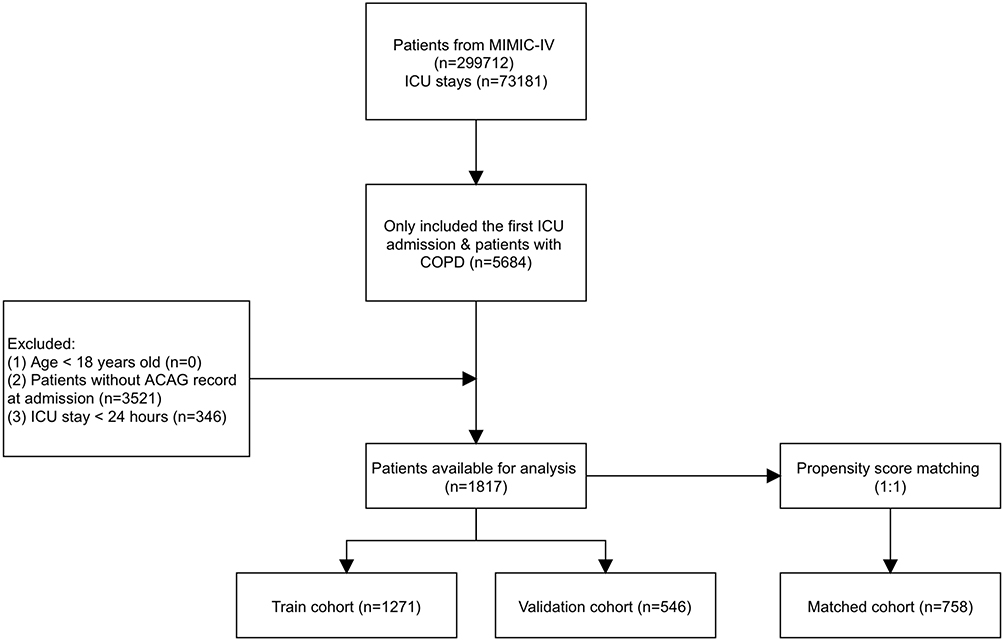 |
Figure 1 Flowchart of patient selection. Abbreviations: MIMIC-IV, Medical Information Mart for Intensive Care IV; ICU, intensive care unit; COPD, chronic obstructive pulmonary disease; ACAG, albumin-corrected anion gap. |
Data Extraction
Data extraction from the MIMIC-IV database was performed using PostgreSQL tool (version 15.3). ACAG was defined by the formula: ACAG = AG (mmol/L) + {4.4-[albumin(g/dL)]}×2.5.17 Only data collected within the initial 24-hour period following admission were included in the analysis. We also extracted the data of demographic information [age, gender, ethnicity], vital signs [heart rate (HR), mean blood pressure (MBP), respiratory rate (RR), temperature, pulse oximetry-derived oxygen saturation (SPO2)], laboratory data [albumin, anion gap, bicarbonate, blood urea nitrogen (BUN), calcium, chloride, creatinine, glucose, hematocrit, hemoglobin, platelet, white blood cell (WBC), partial pressure of arterial oxygen (PaO2), partial pressure of arterial carbon dioxide (PaCO2)], comorbidity diseases (congestive heart failure, diabetes, myocardial infarction, malignant cancer, renal disease), scoring systems [Sequential Organ Failure Assessment (SOFA) score, Oxford Acute Severity of Illness Score (OASIS)], and mechanical ventilation (MV) use during the ICU stay. We defined the primary endpoint as 28-day all-cause mortality following ICU admission in the COPD cohort.
Management of Missing Data and Outliers
Missing data were addressed by excluding variables with > 15% missing values. For retained variables, mean imputation (< 5% missing) or multiple imputation (5–15% missing) was performed. Continuous variables were then trimmed at the 1st and 99th percentiles using the “winsor2” function in STATA software (version 17.0) to limit the impact of outliers.
Statistical Analysis
The distribution of continuous variables was determined with the Kolmogorov–Smirnov test. Accordingly, normally distributed data were analyzed using the independent t-test and are presented as mean ± standard deviation, whereas non-normal data were analyzed with the Kruskal–Wallis test and are summarized as median and interquartile range. Categorical variables are expressed as numbers (%) and were compared using the chi-square test.
The optimal cut-off value for ACAG was determined using X-tile software (version 3.6.1), and patients were subsequently stratified into high-G and low-G groups. The overall cohort was randomly divided into a training cohort (70%) for model development and a validation cohort (30%) for testing. LASSO and Boruta algorithms were applied for feature selection. Independent prognostic factors were then incorporated into a Cox proportional hazards model, and non-linear relationships were assessed using restricted cubic splines (RCS) implemented with the rms package in R. The proportional hazards assumption was tested using Schoenfeld residuals and was satisfied (global P = 0.112). Kaplan–Meier survival analyses with Log rank tests were performed to compare outcomes between the high- and low-ACAG groups. A nomogram was subsequently developed, whose performance was assessed via the C-index, receiver operating characteristic (ROC) analysis, calibration curves, and decision curve analysis (DCA).
All statistical analyses were performed with a two-sided significance level of P < 0.05. The software utilized included X-tile, STATA, SPSS (version 22.0), R (version 2.15.3), and GraphPad Prism (version 10.0) for data analysis and figure generation.
Results
Baseline Characteristics
Based on the predefined criteria (Figure 1), 1817 patients from the MIMIC-IV database were deemed eligible for analysis. The prognostic cut-off for ACAG, established by X-tile software, was 20.8 (Figure 2). The overall cohort had a mean age of 70 years and was 54.43% male, and comprised 68.96% White patients. Patients were randomly stratified into a training cohort (n=1271) and a validation cohort (n=546) at a 7:3 ratio. The baseline characteristics were balanced between these cohorts (all P > 0.05) and are presented in Table 1.
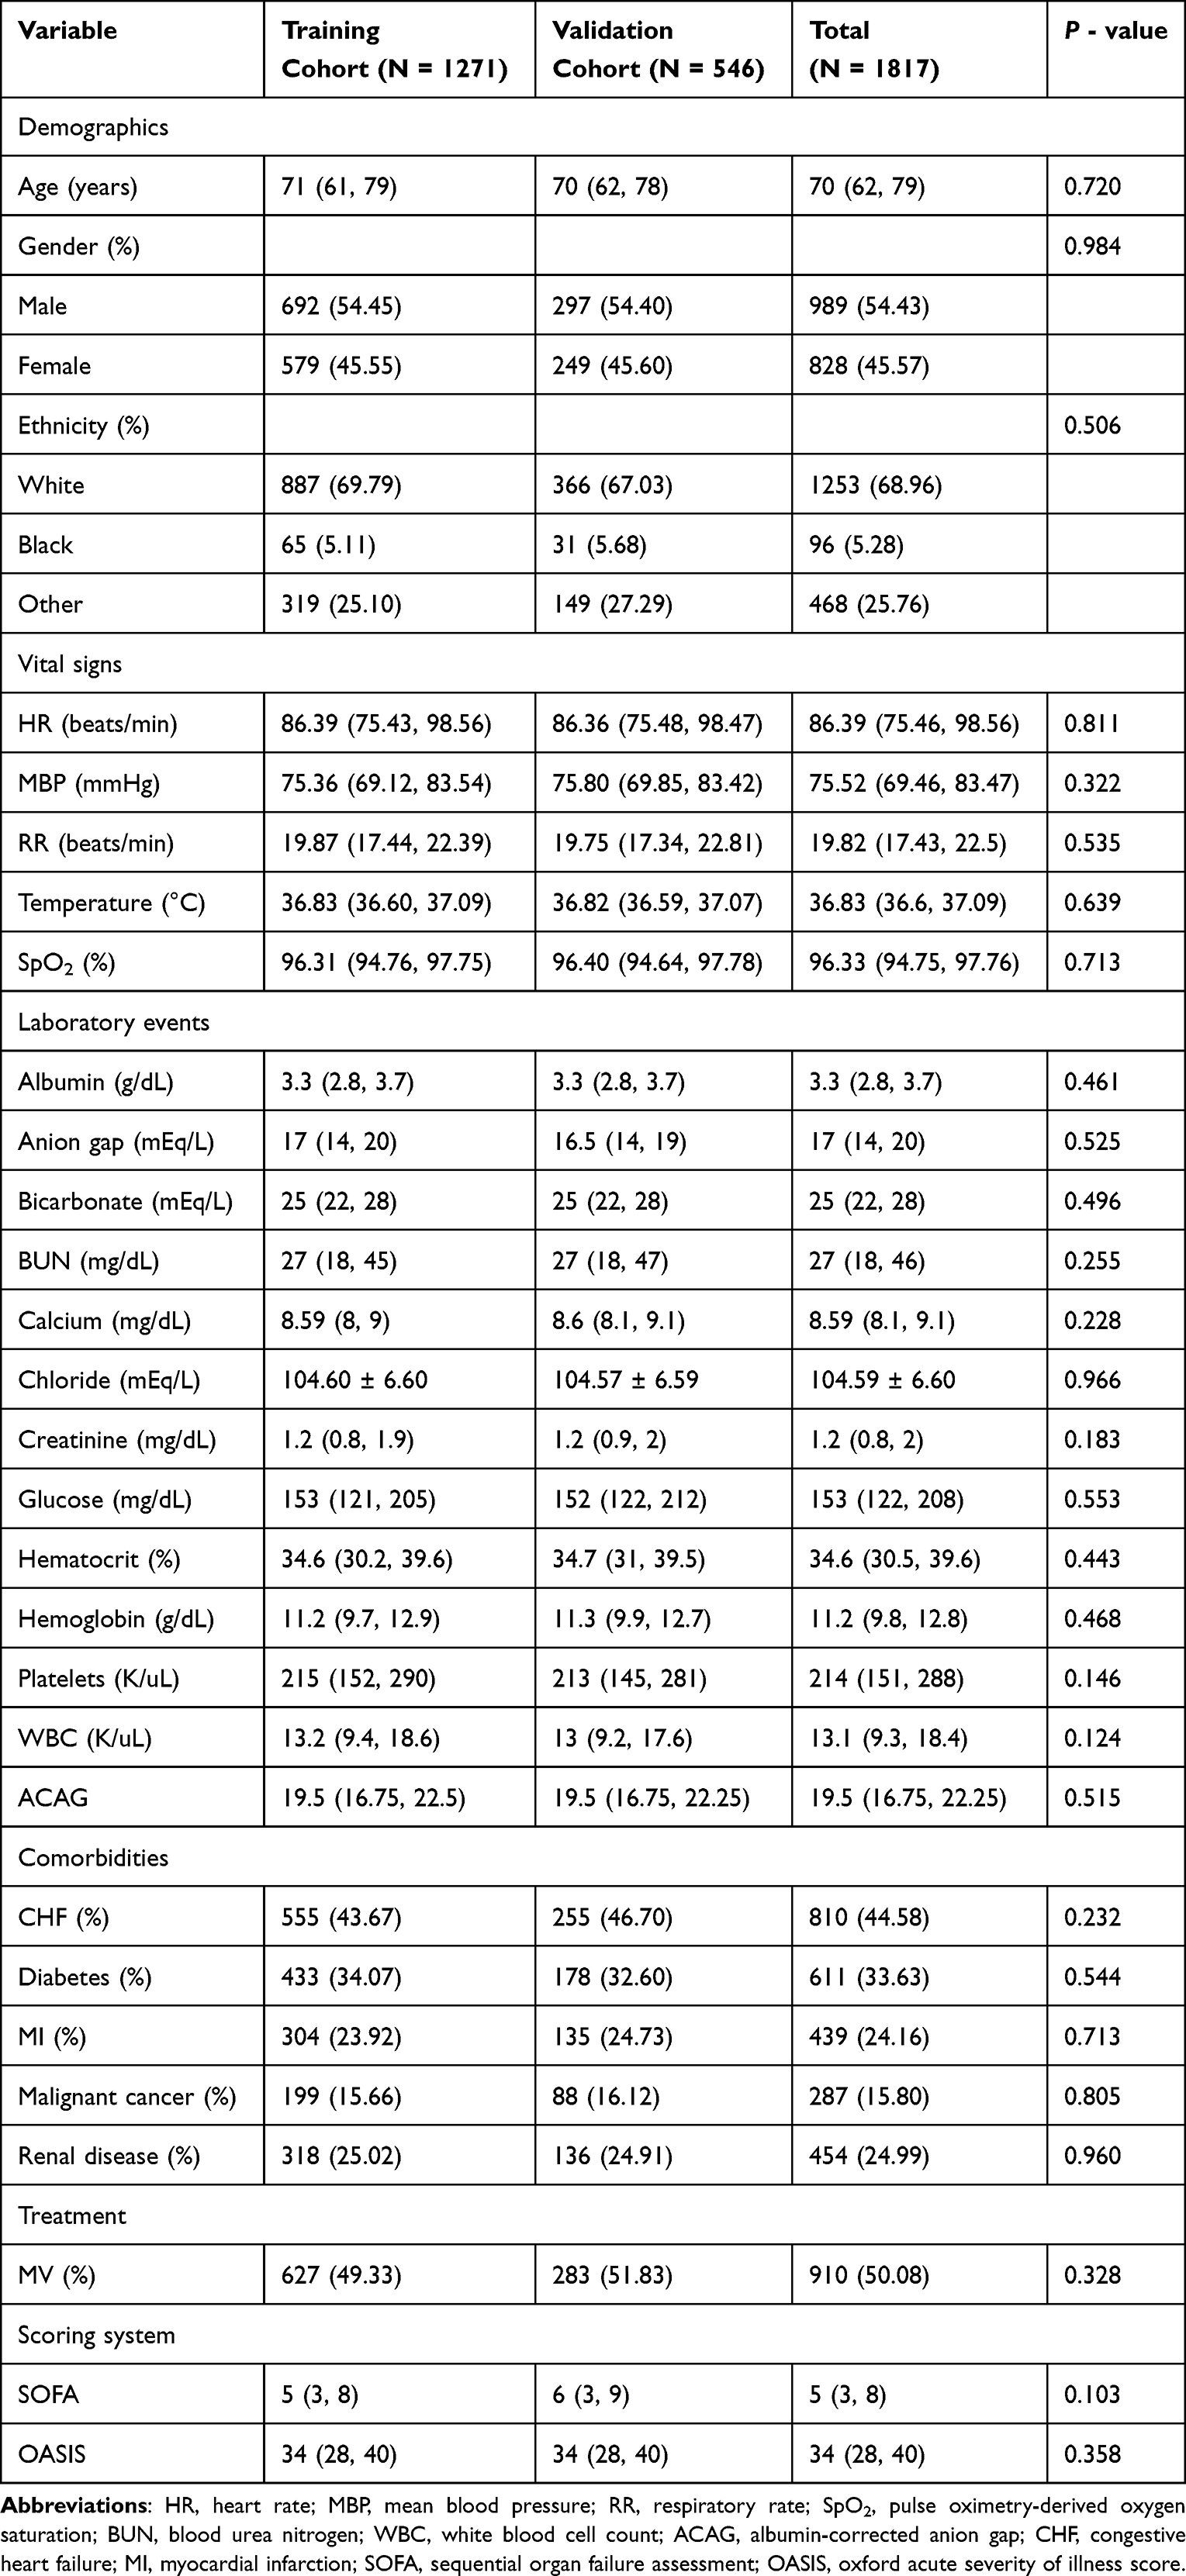 |
Table 1 Descriptions of the Characteristics of ICU Patients with COPD |
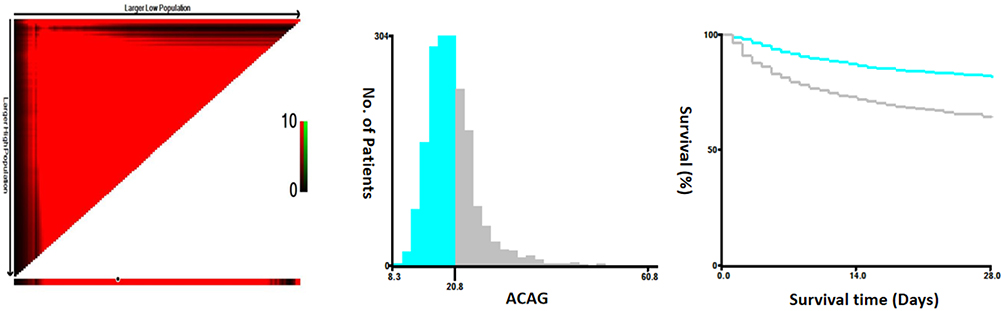 |
Figure 2 Cut-off value of ACAG for 28-day mortality in patients with COPD calculated using X-tile. Abbreviation: ACAG, albumin-corrected anion gap. |
LASSO Regression Analysis and Boruta Algorithm
Candidate predictors were screened using LASSO logistic regression. Applying the one-standard-error criterion for optimal regularization (λ = 0.032) selected 12 features with non-zero coefficients: ACAG, race, age, mechanical ventilation, malignant cancer, WBC, bicarbonate, BUN, HR, MBP, RR, and temperature (Figure 3A). Subsequently, these candidate variables were subjected to the Boruta algorithm for feature selection. The Boruta algorithm supported the importance of all 12 candidate variables (Figure 3B).
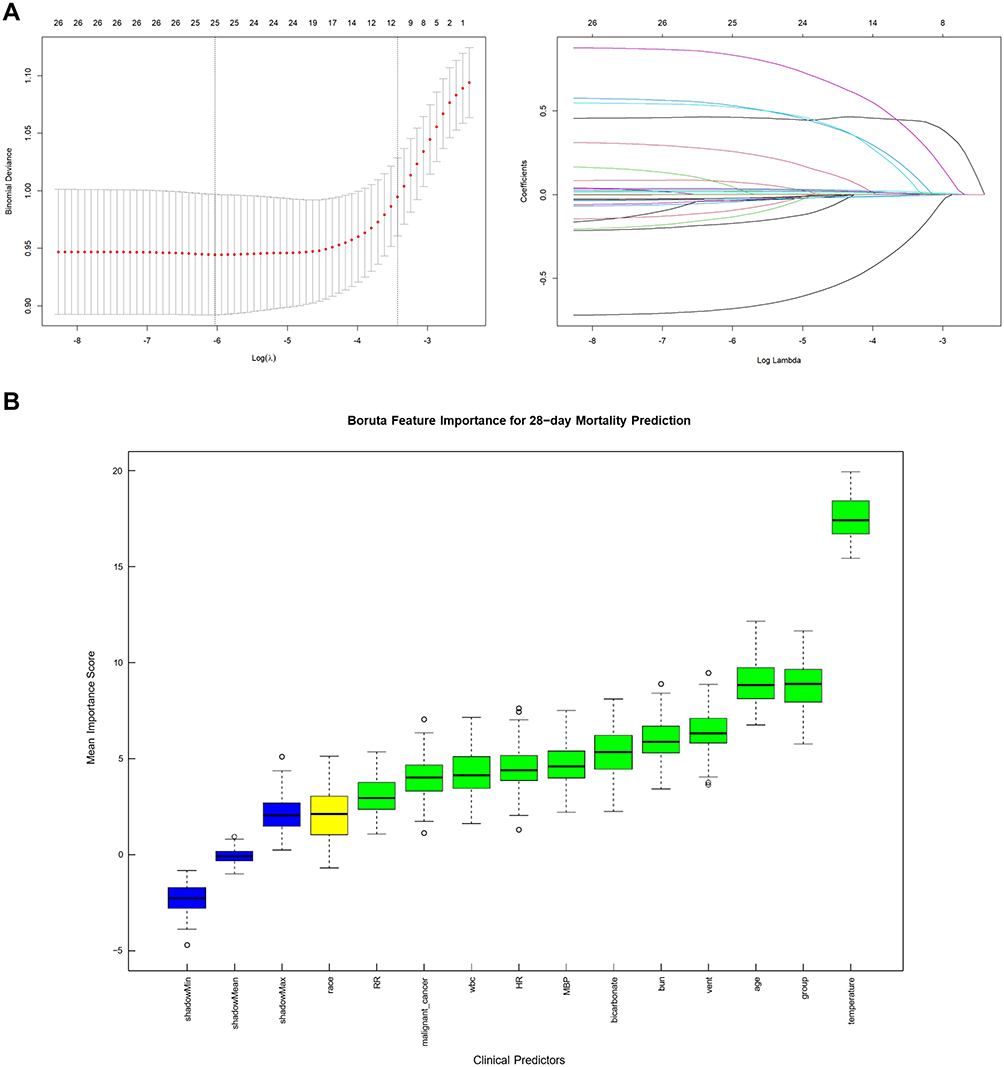 |
Figure 3 Feature selection by LASSO regression and Boruta algorithm. (A) LASSO regression. (B) Boruta algorithm: Green - confirmed variables; Red - rejected variables; Yellow - tentative variables; Blue - shadow variables used as reference. |
Cox Regression Analysis and RCS Analysis
ACAG was a consistent independent predictor of 28-day mortality across Cox regression analysis (Table 2). In the unadjusted Cox model, ACAG was associated with 28-day mortality of patients with COPD (training cohort: HR = 2.404, 95% CI: 1.915–3.019, P < 0.001; validation cohort: HR = 1.944, 95% CI: 1.407–2.687, P < 0.001). In Lasso-Boruta Model, after adjusting for race, age, mechanical ventilation, malignant cancer, WBC, bicarbonate, BUN, HR, MBP, RR, and temperature, ACAG remained significantly relating to the 28-day mortality (training cohort: HR = 1.536, 95% CI: 1.177–2.004, P = 0.002; validation cohort: HR = 1.642, 95% CI: 1.118,2.410, P = 0.011).
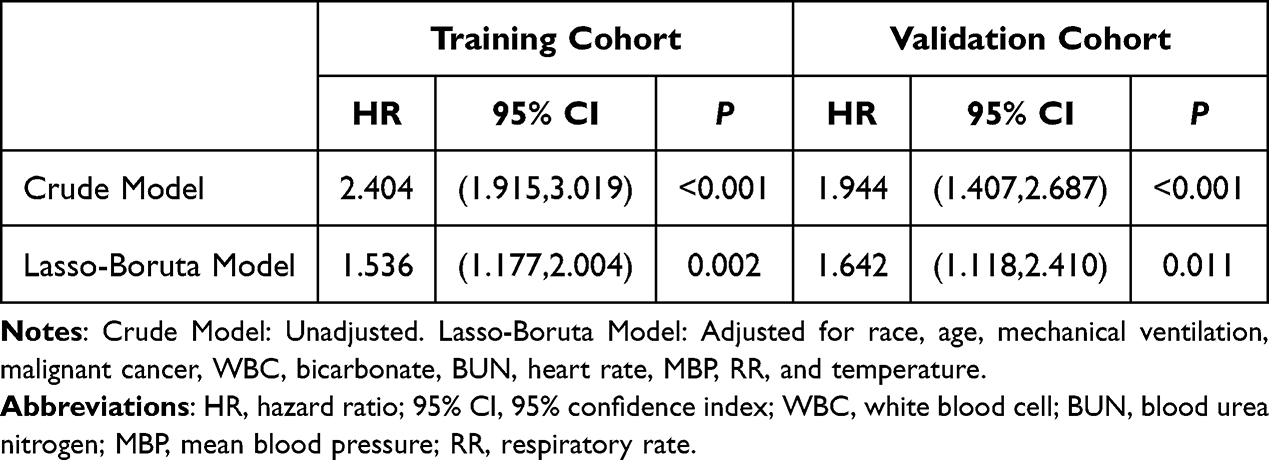 |
Table 2 Cox Regression Analysis of the Associations Between ACAG and 28-Day Mortality |
The RCS analysis revealed a statistically significant non-linear relationship between the G index and mortality risk (P < 0.001). The curve demonstrated a monotonically increasing pattern: using an ACAG level of 19.50 as the reference, the hazard ratio remained close to 1.00 at lower values and gradually reached 2.00 at an ACAG level of 27.08. The slope became slightly less steep after an ACAG level of approximately 25, but the risk continued to rise progressively without plateaus (Figure 4).
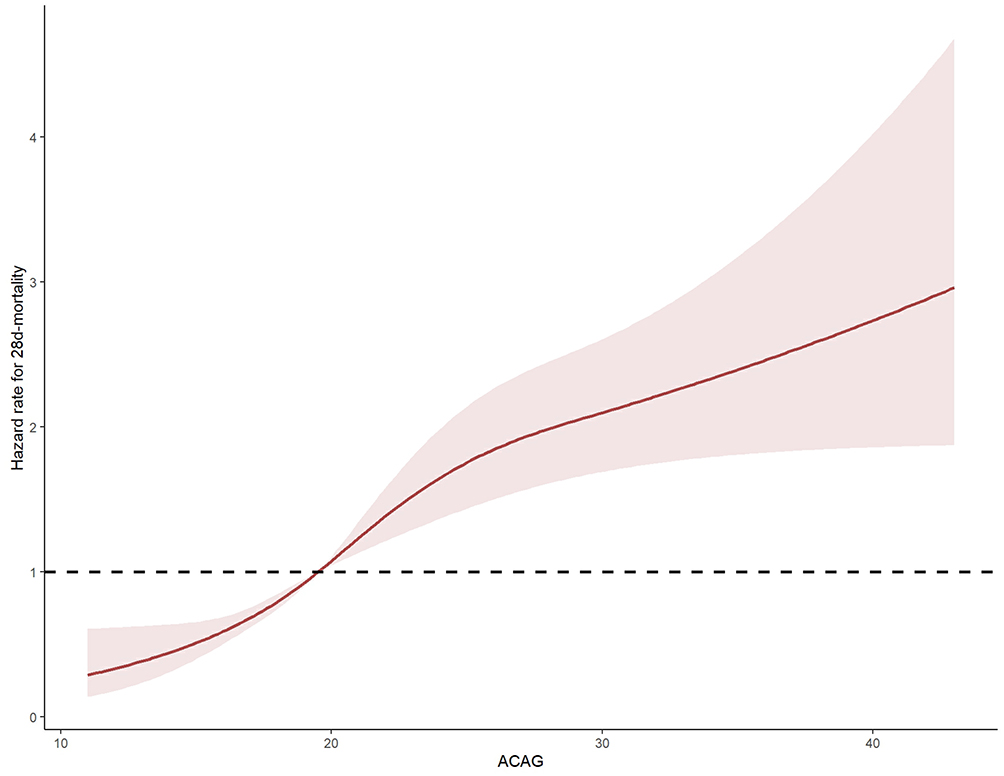 |
Figure 4 Restricted cubic spline (RCS) analysis of ACAG for 28-day mortality. Abbreviation: ACAG, albumin-corrected anion gap. |
Survival Analysis
Comparison of 28-day survival via the Kaplan–Meier method with Log rank test (Figure 5) revealed a significant association between elevated ACAG levels and increased mortality in the training cohort (P < 0.001). This significant association persisted in the validation cohort (P < 0.001).
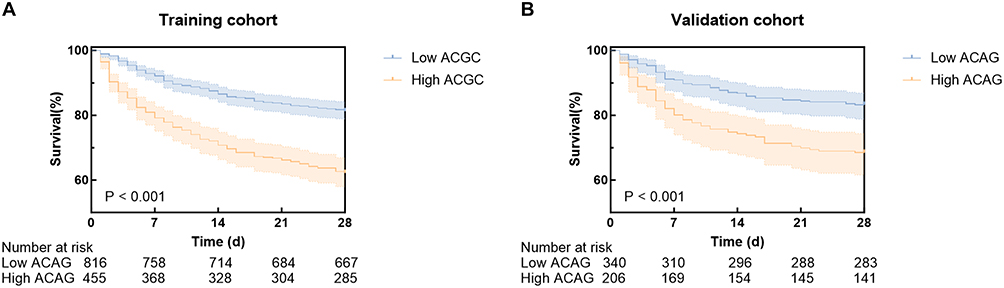 |
Figure 5 (A) Kaplan–Meier curve of high and low ACAG groups in training cohort (log-rank P < 0.001). (B) Kaplan–Meier curve of high and low ACAG groups in validation cohort (log-rank P < 0.001). Abbreviation: ACAG, albumin-corrected anion gap. |
Construction and Validation of Nomogram
Twelve predictors were jointly identified by LASSO regression and Boruta algorithm, and then incorporated into a nomogram to visualize the predictive model (Figure 6). By simply summing the points from each predictor axis and projecting the total to the bottom scale, clinicians can use this nomogram to estimate an individual’s 28-day mortality probability.
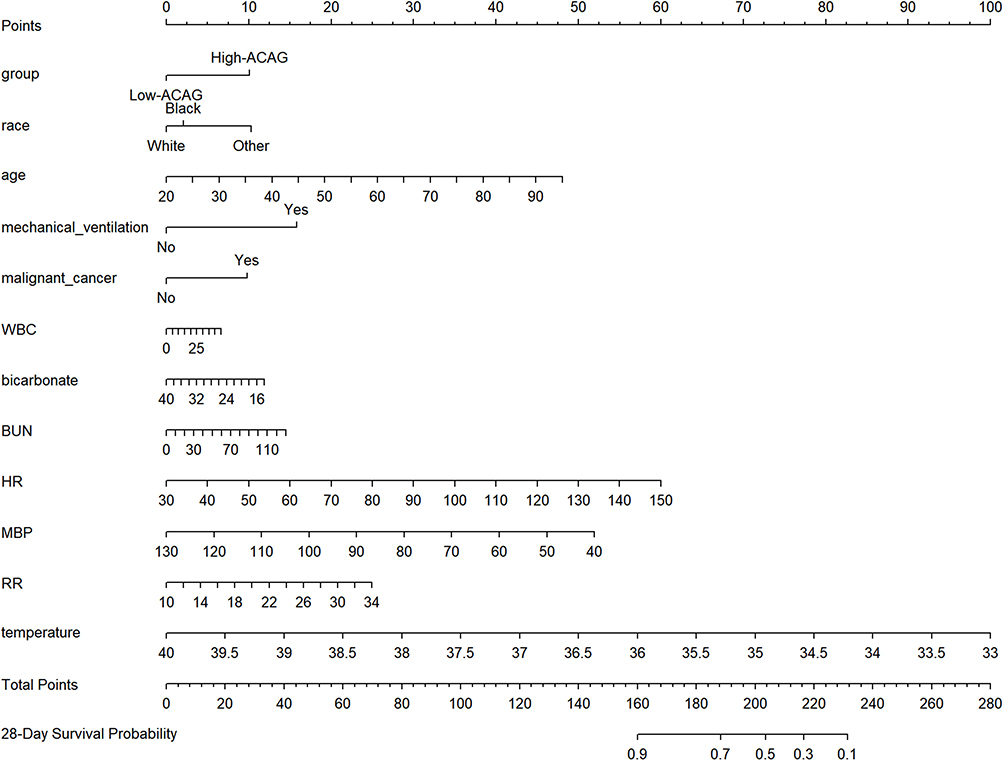 |
Figure 6 The nomogram for prediction of 28-day mortality in patients with COPD. Abbreviations: ACAG, albumin-corrected anion gap; WBC, white blood cell; BUN, blood urea nitrogen; HR, heart rate; MBP, mean blood pressure; RR, respiratory rate. |
The nomogram demonstrated robust predictive performance upon internal validation. In the training cohort, the model achieved a C-index of 0.747 (95% CI: 0.734–0.76) and an area under the curve (AUC) of 0.772 (95% CI: 0.742–0.801) for 28-day mortality, while in the validation cohort, it achieved a C-index of 0.766 (95% CI: 0.747–0.785) and an AUC of 0.795 (95% CI: 0.752–0.838), indicating good discriminative capacity (Figure 7A and B). Furthermore, calibration was evaluated using 1000 bootstrap resamples, with curves showing excellent agreement between predictions and observations, confirming the model’s clinical utility (Figure 7C and D). The clinical utility of the survival nomogram was further confirmed by DCA across both the training and validation cohorts (Figure 7E and F).
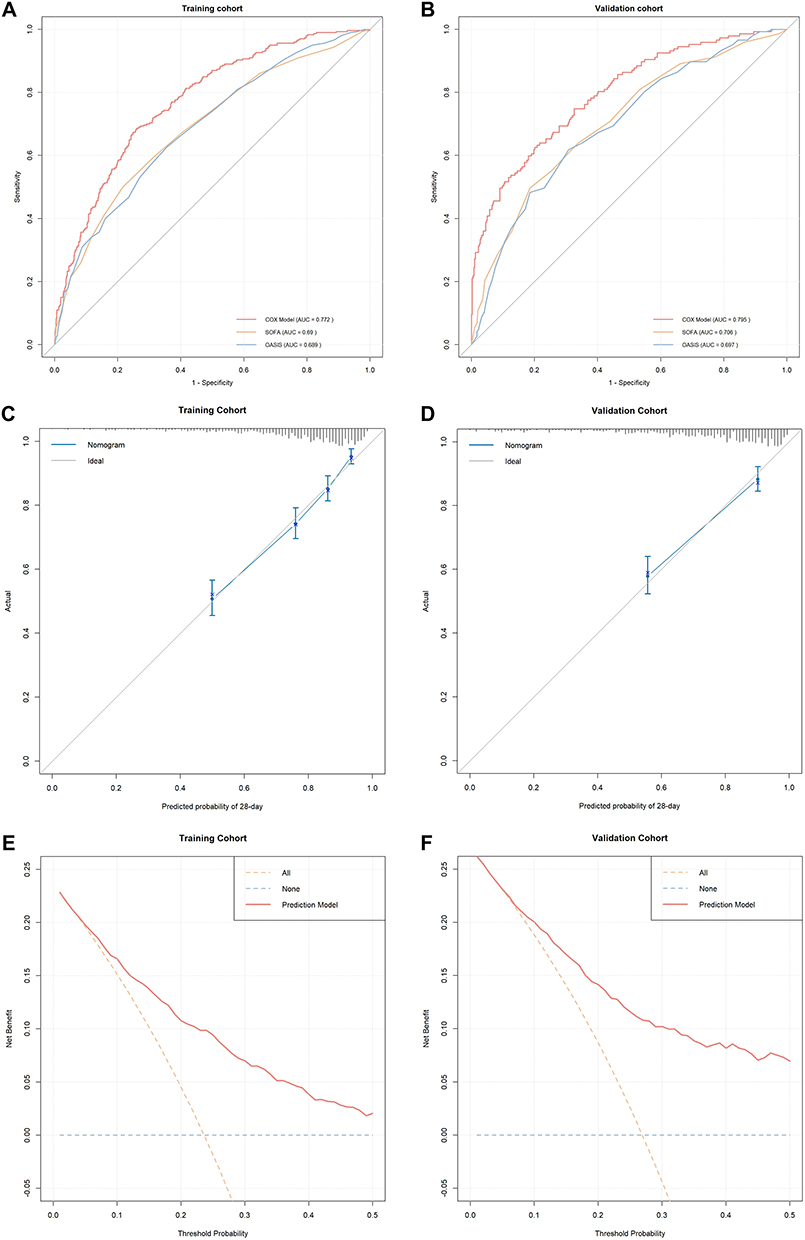 |
Figure 7 Validation of the predictive model and the decision curve analysis (DCA). (A and B) Receiver operating characteristic (ROC) curves in the training cohort and the validation cohort, demonstrating the superior performance of the predictive model compared to sequential organ failure assessment (SOFA) score and Oxford acute severity of illness score (OASIS). (C and D) Calibration curves of the predictive model for the training and validation cohorts, respectively. (E and F) DCA for the predictive model in the training and validation cohorts, respectively. Abbreviations: AUC, area under the curve; SOFA, sequential organ failure assessment; OASIS, oxford acute severity of illness score. |
Discussion
COPD is a prevalent respiratory disorder and a leading cause of death worldwide, posing a substantial clinical and economic burden.5,6 Patients with COPD are at increased risk of major adverse cardiac events (MACE) and experience higher 28-day mortality in the intensive care unit.7,18 These factors underscore the urgent need for reliable prognostic tools to guide clinical management and risk stratification.
Accumulating evidence supports the prognostic value of ACAG in diverse critically ill populations, such as cardiovascular diseases, acute kidney injury, and sepsis.19–22 The nomogram, as a user-friendly graphical tool, has been widely adopted for predicting disease outcomes.23,24 In this study, we integrated ACAG with other clinical indicators to develop a nomogram, which demonstrated excellent performance in predicting 28-day hospital mortality among ICU patients comorbid COPD.
Our analysis revealed that a high ACAG level was a significant predictor of 28-day mortality in ICU patients with COPD. Based on this finding, we developed and validated a prognostic nomogram that incorporated ACAG, race, age, mechanical ventilation, malignant cancer, WBC, bicarbonate, BUN, HR, MBP, RR, and temperature. The model held excellent accuracy for predicting 28-day mortality, showing stable and reliable performance upon validation in an independent cohort. Based on the RCS analysis, an ACAG level above 27.08 corresponded to a two-fold increase in mortality risk (HR = 2.00). Thus, we propose that patients with an ACAG level exceeding 27.08 may be considered a high-risk subgroup for clinical purposes, warranting more intensive monitoring and earlier intervention.
The relationship between high ACAG levels and adverse prognosis in COPD is multifaceted. A key component is its reflection of metabolic acidosis, frequently due to lactate accumulation.19 Our earlier research characterized critically ill COPD patients as commonly presenting with increased lactate levels in both arterial and venous systems, a metabolic disturbance that aligns with the prognostic role of ACAG observed in the present study.16 Notably, pulmonary-derived lactate is likely a primary contributor to systemic hyperlactatemia in this population. The level of this pulmonary lactate release is positively associated with the severity of lung injury.25,26 This pathological pathway can be further exacerbated by concurrent systemic inflammation and tissue hypoxia.27 This disturbance in acid-base homeostasis compromises fundamental cellular functions and metabolic processes, promoting progressive tissue damage. Furthermore, in the critical care setting, acid-base disorders in patients are commonly driven by relative hypoxia.28 Crucially, both compensated and uncompensated respiratory acidosis can lead to a decline in pulmonary function and confer a higher mortality risk, especially in COPD patients.29,30
However, the assessment of acid-base status is complex and influenced by numerous factors.31 Albumin, the major negatively charged plasma protein, exerts an alkalinizing effect. Consequently, hypoalbuminemia can mask true elevations in unmeasured anions, thereby obscuring metabolic disorders.14 ACAG corrects for this confounding variable, providing a more accurate reflection of the metabolic state. Furthermore, incorporating albumin also allows for a concurrent assessment of nutritional status, which enhances the practical utility and clinical relevance of the model.
Derived from routine laboratory data, ACAG provides an integrated assessment of acid-base homeostasis, inflammatory status, lung injury, and nutritional status. In contrast to complex scoring systems, the ACAG-based nomogram is easy to calculate. It enables the early and efficient identification of patients with high mortality risk and may potentially improve early intervention and ICU resource allocation.
This study has several limitations. Our use of a single ACAG value obtained early in the ICU admission does not account for its potential temporal variation, a factor that might influence the precision of mortality risk prediction. Patients with missing ACAG values were excluded without a formal comparison of included versus excluded patients. This nomogram was not compared with existing COPD-specific severity scores. The binary HR simplifies the non-linear relationship between ACAG and mortality risk demonstrated by the RCS analysis. Although chosen for clinical utility, this single HR should be interpreted with caution. In addition, we note that external validation in independent cohorts is required before clinical adoption of our model.
Conclusion
In conclusion, this study established ACAG as an independent predictor of 28-day mortality in ICU patients with COPD, defining an optimal cut-off value of 20.8; levels above this threshold signified a significantly higher risk of death. Moreover, we constructed a nomogram incorporating ACAG, race, age, mechanical ventilation, malignant cancer, WBC, bicarbonate, BUN, HR, MBP, RR, and temperature. This retrospective MIMIC-IV-based model demonstrated robust performance across both training and validation cohorts and exhibited promising clinical utility for risk stratification, pending external validation in independent cohorts before clinical adoption.
Data Sharing Statement
The dataset utilized in this study is accessible through the MIMIC-IV database (https://mimic.mit.edu/). The Methods section describes the study methods and software used. Further inquiries can be directed to the corresponding author.
Ethics Statement
This study was approved by the institutional review boards of the Massachusetts Institute of Technology and Beth Israel Deaconess Medical Center. The Ethics Committee of the First Affiliated Hospital of Zhejiang Chinese Medical University waived the requirement for informed consent due to the use of anonymized data and approved the study (2025-KLS-648-01).
Acknowledgments
We are grateful to the MIMIV-IV participants and staff. We appreciate all the reviewers who participated in the review.
Author Contributions
All authors made a significant contribution to the work reported, whether that is in the conception, study design, execution, acquisition of data, analysis and interpretation, or in all these areas; took part in drafting, revising or critically reviewing the article; gave final approval of the version to be published; have agreed on the journal to which the article has been submitted; and agree to be accountable for all aspects of the work.
Funding
The study was funded by the Zhejiang Province Traditional Chinese Medicine Science and Technology Plan Project (Project No. 2023ZR020).
Disclosure
The authors declare that they have no conflicts of interest.
References
1. Singh D, Agusti A, Anzueto A, et al. Global strategy for the diagnosis, management, and prevention of chronic obstructive lung disease: the GOLD science committee report 2019. Eur Respir J. 2019;53(5):1900164. doi:10.1183/13993003.00164-2019
2. Christenson SA, Smith BM, Bafadhel M, Putcha N. Chronic obstructive pulmonary disease. Lancet. 2022;399(10342):2227–13. doi:10.1016/S0140-6736(22)00470-6
3. Mei F, Dalmartello M, Bonifazi M, et al. Chronic obstructive pulmonary disease (COPD) mortality trends worldwide: an update to 2019. Respirology. 2022;27(11):941–950. doi:10.1111/resp.14328
4. Adeloye D, Song P, Zhu Y, Campbell H, Sheikh A, Rudan I. Global, regional, and national prevalence of, and risk factors for, chronic obstructive pulmonary disease (COPD) in 2019: a systematic review and modelling analysis. Lancet Respir Med. 2022;10(5):447–458. doi:10.1016/S2213-2600(21)00511-7
5. GBD 2021 Causes of Death Collaborators. Global burden of 288 causes of death and life expectancy decomposition in 204 countries and territories and 811 subnational locations, 1990-2021: a systematic analysis for the Global Burden of Disease Study 2021. Lancet. 2024;403(10440):2100–2132. doi:10.1016/S0140-6736(24)00367-2
6. Chen S, Kuhn M, Prettner K, et al. The global economic burden of chronic obstructive pulmonary disease for 204 countries and territories in 2020-50: a health-augmented macroeconomic modelling study. Lancet Glob Health. 2023;11(8):e1183–e1193. doi:10.1016/S2214-109X(23)00217-6
7. Huang W, Xie R, Hong Y, Chen Q. Association between comorbid chronic obstructive pulmonary disease and prognosis of patients admitted to the intensive care unit for Non-COPD reasons: a Retrospective Cohort Study. Int J Chron Obstruct Pulmon Dis. 2020;15:279–287. doi:10.2147/COPD.S244020
8. Kraut JA, Madias NE. Serum anion gap: its uses and limitations in clinical medicine. Clin J Am Soc Nephrol. 2007;2(1):162–174. doi:10.2215/CJN.03020906
9. Ward ES, Gelinas D, Dreesen E, et al. Clinical significance of serum albumin and implications of FcRn inhibitor treatment in IgG-Mediated autoimmune disorders. Front Immunol. 2022;13:892534. doi:10.3389/fimmu.2022.892534
10. Artigas A, Wernerman J, Arroyo V, Vincent JL, Levy M. Role of albumin in diseases associated with severe systemic inflammation: pathophysiologic and clinical evidence in sepsis and in decompensated cirrhosis. J Crit Care. 2016;33:62–70. doi:10.1016/j.jcrc.2015.12.019
11. Zhang L, Ye S, Hu J, et al. Group-based trajectory modeling of anion gap and mortality in patients with sepsis: a retrospective analysis of the MIMIC-IV database. Eur J Med Res. 2025;30(1):879. doi:10.1186/s40001-025-03146-6
12. Huang Z, Wang S, Yang S. Association between serum anion gap and risk of in-hospital mortality in patients with acute heart failure. Sci Rep. 2024;14(1):4858. doi:10.1038/s41598-024-55658-6
13. Zhang H, Tian W, Sun Y. The value of anion gap for predicting the short-term all-cause mortality of critically ill patients with cardiac diseases, based on MIMIC-III database. Heart Lung. 2022;55:59–67. doi:10.1016/j.hrtlng.2022.04.004
14. Fencl V, Jabor A, Kazda A, Figge J. Diagnosis of metabolic acid-base disturbances in critically ill patients. Am J Respir Crit Care Med. 2000;162(6):2246–2251. doi:10.1164/ajrccm.162.6.9904099
15. Johnson AEW, Bulgarelli L, Shen L, et al. MIMIC-IV, a freely accessible electronic health record dataset. Sci Data. 2023;10(1):1. doi:10.1038/s41597-022-01899-x
16. Zhao K, Zhou L, Ni Y, et al. Association between Lactate-to-Albumin Ratio and 28-Day all-cause mortality in critical care patients with COPD: can both arterial and peripheral venous lactate serve as predictors? Int J Chron Obstruct Pulmon Dis. 2025;20:1419–1434. doi:10.2147/COPD.S503625
17. Figge J, Jabor A, Kazda A, Fencl V. Anion gap and hypoalbuminemia. Crit Care Med. 1998;26(11):1807–1810. doi:10.1097/00003246-199811000-00019
18. Cho EE, Maclagan LC, Chu A, et al. Impact of COPD on cardiovascular risk factors and outcomes in people with established cardiovascular disease. Thorax. 2025;80(5):291–299. doi:10.1136/thorax-2023-220991
19. Jian L, Zhang Z, Zhou Q, Duan X, Xu H, Ge L. Association between albumin corrected anion gap and 30-day all-cause mortality of critically ill patients with acute myocardial infarction: a retrospective analysis based on the MIMIC-IV database. BMC Cardiovasc Disord. 2023;23(1):211. doi:10.1186/s12872-023-03200-3
20. Li N, Li J, Wang K. Independent prognostic importance of the albumin-corrected anion gap in critically ill patients with congestive heart failure: a retrospective study from MIMIC-IV database. BMC Cardiovasc Disord. 2024;24(1):735. doi:10.1186/s12872-024-04422-9
21. Gao P, Min J, Zhong L, Shao M. Association between albumin corrected anion gap and all-cause mortality in critically ill patients with acute kidney injury: a retrospective study based on MIMIC-IV database. Ren Fail. 2023;45(2):2282708. doi:10.1080/0886022X.2023.2282708
22. Hu T, Zhang Z, Jiang Y. Albumin corrected anion gap for predicting in-hospital mortality among intensive care patients with sepsis: a retrospective propensity score matching analysis. Clin Chim Acta. 2021;521:272–277. doi:10.1016/j.cca.2021.07.021
23. Wu J, Zhang H, Li L, et al. A nomogram for predicting overall survival in patients with low-grade endometrial stromal sarcoma: a population-based analysis. Cancer Commun. 2020;40(7):301–312. doi:10.1002/cac2.12067
24. Sakamoto Y, Yamauchi Y, Yasunaga H, et al. Development of a nomogram for predicting in-hospital mortality of patients with exacerbation of chronic obstructive pulmonary disease. Int J Chron Obstruct Pulmon Dis. 2017;12:1605–1611. doi:10.2147/COPD.S129714
25. Iscra F, Gullo A, Biolo G. Bench-to-bedside review: lactate and the lung. Crit Care. 2002;6(4):327–329. doi:10.1186/cc1519
26. Routsi C, Bardouniotou H, Delivoria-Ioannidou V, Kazi D, Roussos C, Zakynthinos S. Pulmonary lactate release in patients with acute lung injury is not attributable to lung tissue hypoxia. Crit Care Med. 1999;27(11):2469–2473. doi:10.1097/00003246-199911000-00024
27. Li X, Yang Y, Zhang B, et al. Lactate metabolism in human health and disease. Signal Transduct Target Ther. 2022;7(1):305. doi:10.1038/s41392-022-01151-3
28. Galley HF, Webster NR. Acidosis and tissue hypoxia in the critically ill: how to measure it and what does it mean. Crit Rev Clin Lab Sci. 1999;36(1):35–60. doi:10.1080/10408369991239178
29. Lun CT, Tsui MS, Cheng SL, et al. Differences in baseline factors and survival between normocapnia, compensated respiratory acidosis and decompensated respiratory acidosis in COPD exacerbation: a pilot study. Respirology. 2016;21(1):128–136. doi:10.1111/resp.12652
30. Trudzinski FC, Kahnert K, Vogelmeier CF, et al. Combined effects of lung function, blood gases and kidney function on the exacerbation risk in stable COPD: results from the COSYCONET cohort. Respir Med. 2019;154:18–26. doi:10.1016/j.rmed.2019.06.007
31. Palmer BF, Clegg DJ. Mixed Acid-Base disturbances: core curriculum 2025. Am J Kidney Dis. 2025;86(3):372–382. doi:10.1053/j.ajkd.2025.04.014
 © 2026 The Author(s). This work is published and licensed by Dove Medical Press Limited. The
full terms of this license are available at https://www.dovepress.com/terms
and incorporate the Creative Commons Attribution
- Non Commercial (unported, 4.0) License.
By accessing the work you hereby accept the Terms. Non-commercial uses of the work are permitted
without any further permission from Dove Medical Press Limited, provided the work is properly
attributed. For permission for commercial use of this work, please see paragraphs 4.2 and 5 of our Terms.
© 2026 The Author(s). This work is published and licensed by Dove Medical Press Limited. The
full terms of this license are available at https://www.dovepress.com/terms
and incorporate the Creative Commons Attribution
- Non Commercial (unported, 4.0) License.
By accessing the work you hereby accept the Terms. Non-commercial uses of the work are permitted
without any further permission from Dove Medical Press Limited, provided the work is properly
attributed. For permission for commercial use of this work, please see paragraphs 4.2 and 5 of our Terms.
Recommended articles

A Nomogram for Predicting the Risk of Pulmonary Hypertension for Patients with Chronic Obstructive Pulmonary Disease
Wang N, Guo Z, Gong X, Kang S, Cui Z, Yuan Y
International Journal of General Medicine 2022, 15:5751-5762
Published Date: 22 June 2022
Radiomics Nomogram Model Based on TOF-MRA Images: A New Effective Method for Predicting Microaneurysms
Kong D, Li J, Lv Y, Wang M, Li S, Qian B, Yu Y
International Journal of General Medicine 2023, 16:1091-1100
Published Date: 27 March 2023
Prediction of the Risk of Bone Mineral Density Decrease in Type 2 Diabetes Mellitus Patients Based on Traditional Multivariate Logistic Regression and Machine Learning: A Preliminary Study
Zhang J, Xu Z, Fu Y, Chen L
Diabetes, Metabolic Syndrome and Obesity 2023, 16:2885-2898
Published Date: 19 September 2023
Comprehensive Nomograms Using Routine Biomarkers Beyond Eosinophil Levels: Enhancing Predictability of Corticosteroid Treatment Outcomes in AECOPD
Feng L, Li J, Qian Z, Li C, Gao D, Wang Y, Xie W, Cai Y, Tong Z, Liang L
Journal of Inflammation Research 2024, 17:1511-1526
Published Date: 8 March 2024
Identifying Common Diagnostic Biomarkers and Therapeutic Targets between COPD and Sepsis: A Bioinformatics and Machine Learning Approach
Li X, Xiao Y, Yang M, Zhang X, Yuan Z, Zhang Z, Zhang H, Liu L, Zhao M
International Journal of Chronic Obstructive Pulmonary Disease 2025, 20:1761-1786
Published Date: 28 May 2025