Back to Journals » Neuropsychiatric Disease and Treatment » Volume 21
Leveraging TabTransformer Deep Learning on Conventional MRI Radiomics for Accessible and Interpretable Diagnosis of Autism Spectrum Disorder
Authors Chen Q, Liu H, Cao X, Qian B, Wang G ![]() , Wang Y
, Wang Y
Received 30 June 2025
Accepted for publication 26 November 2025
Published 9 December 2025 Volume 2025:21 Pages 2783—2793
DOI https://doi.org/10.2147/NDT.S550477
Checked for plagiarism Yes
Review by Single anonymous peer review
Peer reviewer comments 2
Editor who approved publication: Professor Taro Kishi
Qingling Chen,1,* Hongsheng Liu,2,* Xiaoling Cao,1,* Baoxin Qian,3 Guojie Wang,4 Ying Wang1
1Department of Nuclear Medicine, The Fifth Affiliated Hospital of Sun Yat-Sen University, Sun Yat-Sen University, Zhuhai, Guangdong, People’s Republic of China; 2Department of Radiology, Guangzhou Women and Children’s Medical Center, Guangzhou Medical University, Guangzhou, Guangdong, People’s Republic of China; 3Huiying Medical Technology, Beijing, People’s Republic of China; 4Department of Radiology, The Fifth Affiliated Hospital of Sun Yat-Sen University, Sun Yat-Sen University, Zhuhai, Guangdong, People’s Republic of China
*These authors contributed equally to this work
Correspondence: Guojie Wang, Department of Radiology, The Fifth Affiliated Hospital of Sun Yat-sen University, Sun Yat-sen University, Zhuhai, Guangdong, People’s Republic of China, Email [email protected] Ying Wang, Department of Nuclear Medicine, The Fifth Affiliated Hospital of Sun Yat-sen University, Sun Yat-sen University, Zhuhai, Guangdong, People’s Republic of China, Email [email protected]
Purpose: This study aims to assess the diagnostic efficacy of a multi-region radiomics analysis utilizing conventional MRI sequences (T1-weighted imaging [T1WI] and T2-weighted imaging [T2WI]) for autism spectrum disorder (ASD), and to investigate the correlations between radiomics features and the severity of clinical symptoms, thereby exploring potential imaging biomarkers.
Methods: This retrospective study included 207 pediatric participants (91 ASD, 116 typically developing controls). Radiomics features were extracted from manually segmented bilateral hippocampus, thalamus, caudate nucleus, and lenticular nucleus on T1WI and T2WI images. Three distinct classifiers (T1WI-only, T2WI-only, T1WI+T2WI combined) were developed using logistic regression (LR), support vector machine (SVM), and a TabTransformer deep learning (DL) model. Diagnostic performance was evaluated via five-fold cross-validation.
Results: The TabTransformer DL model utilizing combined T1WI+T2WI features demonstrated superior performance, achieving an area under the curve of 0.900, accuracy of 0.834, sensitivity of 0.843, and specificity of 0.823. Specific radiomic features, predominantly from the left lentiform nucleus and bilateral caudate nucleus, were significantly correlated with clinical severity scores (ABC, CARS).
Conclusion: Radiomics models leveraging routine MRI sequences demonstrate robust diagnostic utility for ASD. The identified subcortical features, correlating with core symptoms, may serve as viable imaging biomarkers. Future work requires external validation, exploration of automated segmentation, and investigation in larger, multi-center cohorts..
Keywords: autism spectrum disorders, magnetic resonance imaging, diagnosis, radiomics, clinical scales
Introduction
Autism Spectrum Disorder (ASD) is a neurodevelopmental pathology characterized by perturbations in communication, behavioral responses, and social interactions. This disorder manifests through a spectrum of symptoms, notably repetitive behaviors, heightened irritability, and challenges in maintaining concentration.1 Recent epidemiological data from the past two decades indicate an ascending trajectory in the prevalence of ASD, evidenced by an augmented annual diagnostic rate in pediatric populations.2 Contemporary diagnostic methodologies for ASD predominantly hinge upon standardized psychometric scales, which amalgamate structured interviews, observational behavioral analyses, and rigorous clinical evaluations.3 Standardized diagnostic tools for ASD include Autism Behavior Checklist (ABC), Childhood Autism Rating Scale(CARS), Autism Diagnostic Observation Schedule (ADOS), and Autism Diagnostic Interview (ADI-R).4,5 However, it is necessary to consider the intrinsic constraints of this approach, including potential subjective bias and reduced sensitivity.
Magnetic resonance imaging (MRI) is a commonly used auxiliary diagnostic tool for neuropsychiatric disorders.6 The utilization of structural MRI has become a customary examination protocol in clinical settings owing to its notable benefits, including high spatial resolution and short scanning time. Nevertheless, However, the main purpose of using MRI in clinical practice for ASD diagnosis is to exclude alternative organic brain disorders, as the absence of distinct brain lesions limits its diagnostic capabilities. In the realm of autism research, structural MRI investigations on autism focus on voxel-based morphological analysis and surface-based morphological analysis,7 which includes measuring whole-brain or lobar volume,8,9 cortical thickness,10 and surface area. Numerous studies have also explored possible connections between morphological findings and behavioral correlations in ASD.11,12 Analysis of symptom severity of ASD by Daan et al revealed that higher ADOS scores were linked to decreased volumes in the putamen, nucleus accumbens, thalamus, amygdala, and hippocampus.13 The practical implementation and replicability of such discoveries in clinical settings continue to be a subject of debate.
Radiomics is a data mining technique that uses automated algorithms to extract high-throughput features from digital medical images in the region of interest (ROI).14 Machine-learning and deep-learning methods are widely employed to discover the hidden patterns in the high dimensional radiomics features and utilize them to build a clinical classifier model that can be used to diagnose diseases.15 Early studies extracted radiomics features from two important brain regions, the hippocampus, and amygdala, and constructed SVM classification diagnostic models with an AUC of 76.8%. They also investigated subcortical regions in MRI images related to autism, gender, and age.16,17 However, these studies were limited in the scope of regions analyzed and the modeling techniques employed.
Neuropathological investigations have demonstrated that individuals with ASD exhibit atypical development of the brain’s microstructure, encompassing alterations in neuronal size and quantity, glial cell count, and axonal and dendritic structures, among others. These aberrations have the potential to impede typical brain functioning, thereby hindering social interaction, language communication, behavioral patterns, and interests in individuals with ASD.18–20 Notably, during the initial stages of disease onset and progression, deviations in brain microstructure manifest before morphological changes in the brain. Studies have revealed that the thalamus, basal ganglia, and hippocampus are involved in the pathogenesis of autism,18 according to postmortem analyses. Patients with autism exhibit three fundamental behaviors that are linked to specific brain regions. For instance, the basal ganglia which participate in the regulation of cognitive and motor functions is explicitly associated with the occurrence of repetitive and restricted behaviors in ASD.21 The hippocampus is one of the major brain regions linked to emotional behavior, cognition, and memory,22 whereas the thalamus is a crucial sensorimotor relay area involved in ASD.23 Research has shown that transverse relaxation time is believed to be related to myelin maturation and neuronal cell density, while longitudinal relaxation time is sensitive to changes in the micro-environment and metabolism.24
We hypothesize that radiomics can detect these subtle microstructural alterations on conventional MRI. Furthermore, we aim to explore the correlation between radiomic features and clinical symptom severity to enhance their biological interpretability and potential clinical relevance. This study aims to develop and validate diagnostic models for ASD using a comprehensive multi-region radiomics analysis of T1 weighted (T1W) and T2 weighted (T2W) images and to investigate the association between the derived features and core clinical symptoms.
Materials and Methods
Materials
This retrospective study was approved by the ethics review committee of the Fifth Affiliated Hospital of Sun Yat-sen University (ClinicalTrials.gov Identifier: NCT05439954). Given the retrospective design, the requirement for informed consent from participants was waived by the ethics committee. This study was conducted in accordance with the principles of the Declaration of Helsinki. All patient data were anonymized to ensure confidentiality.
Participants
A total of 207 pediatric participants, 91 diagnosed with ASD and 116 typical developing (TD) controls, were recruited from multi-center including Guangzhou Women and Children Medical Care Center and the Fifth Affiliated Hospital of Sun Yat-sen University in China between January 2020 and June 2022.
All participants underwent standard MRI scans, and structural T1W and T2W images were acquired. Behavioral assessments were conducted for all 91 ASD patients using the ABC and the CARS. The ABC is a diagnostic tool that uses an observer’s assessment of a child’s behavior to measure behaviors commonly linked with autism, while the CARS is a 15-item behavioral rating scale used to identify autistic children and to assess the severity of symptoms.4,25
Inclusion and Exclusion Criteria
The inclusion criteria for the ASD group were: (1) patients diagnosed with ASD for the first time based on the Diagnostic and Statistical Manual of Mental Disorders, 5th edition (DSM-V), and who had not yet received any therapeutic intervention; (2) patients within the age range of 0 to 6 years old. The inclusion criteria for TD controls were: (1) subjects with no history of neuropsychiatric conditions; (2) subjects without any current medical, developmental, or psychiatric diagnoses; (3) the age range of 0 to 6 years old.
MRI Acquisition
MRI scans were performed on all 207 participants using Siemens and GE 3.0T MRI scanner. Both axial T1W and T2W images were acquired. The parameters of Siemens MRI were: TR/TE = 2,000 ms/9 ms, matrix size = 280×320, layer thickness = 5 mm, interlayer spacing = 5 mm for T1WI; and TR/TE = 7,000 ms/81 ms, matrix size = 320×300, layer thickness = 4 mm, interlayer spacing = 5 mm for T2WI. While the parameters of GE MRI were: TR/TE = 1,731 ms/24 ms, matrix size = 512×512, layer thickness = 5 mm, interlayer spacing = 6 mm for T1WI; and TR/TE = 9,000 ms/98 ms, matrix size = 512×512, layer thickness = 5 mm, interlayer spacing = 6 mm for T2WI.
Radiomics Analysis
The radiomics analysis procedure includes regions of interest (ROI) segmentation, feature extraction, and selection, model construction, and evaluation. Our study workflow is displayed in Figure 1.
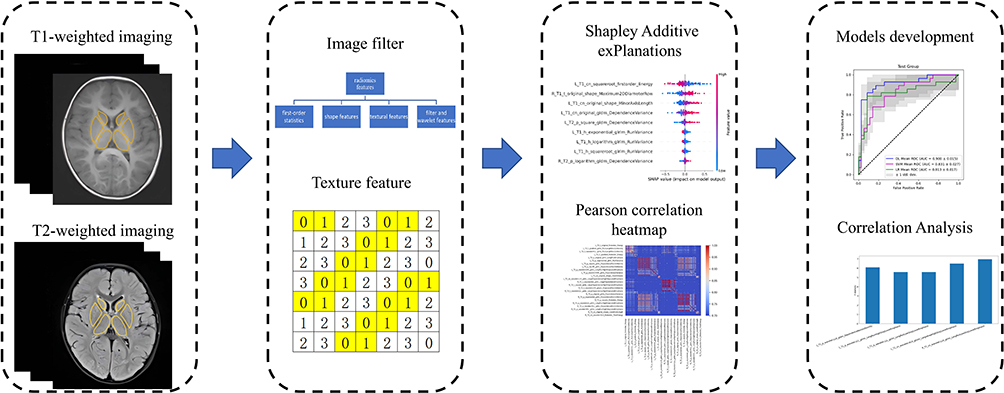 |
Figure 1 Workflow of the study. Initially, the schematic diagram of “ROI Segmentation” delineates the target regions of the bilateral thalamus, caudate nucleus, and lenticular nucleus (comprising the putamen and globus pallidus) on T1W and T2W images. Subsequently, radiomics features were extracted, encompassing first-order statistics, shape-based features, textural features, as well as features derived from filters and wavelets. The textural features include the Gray Level Co-occurrence Matrix (GLCM), Gray Level Run Length Matrix (GLRLM), and Gray Level Size Zone Matrix (GLSZM), with schematic diagrams of these matrices presented below the term “Texture feature.” Following this, various methods were employed for feature selection. The upper section of the figure illustrates the results obtained using t-distributed stochastic neighbor embedding (t-SNE), while the lower section displays the results of the Pearson correlation analysis among the features. Finally, radiomics models were constructed based on the features extracted from different sequence combinations, and a correlation analysis between the radiomics features and clinical scales was conducted. |
ROI Delineation and Feature Extraction
Eight specific brain ROIs potentially linked to ASD were manually delineated on both T1WI and T2WI images by two experienced radiologists, one with 5 years and the other with 10 years of expertise. The ROIs included bilateral hippocampus, thalamus, caudate nucleus, and lenticular nucleus which comprises putamen and globus pallidus.18,21–23 Both ROI delineation and radiomics feature extraction were conducted on the RadcloudTM platform (https://mics.huiyihuiying.com). The interclass correlation coefficient (ICC) was calculated to assess the consistency of ROI delineations. In cases of discrepancy between the two radiologists, a consensus was reached through discussion to finalize the contours for feature extraction.
Radiomics Feature Selection and Model Development
A total of 11,272 features were extracted. To reduce dimensionality and mitigate overfitting, a two-step feature selection was applied. First, low-variance features (variance < 0.8) were removed using the Variance Threshold method. Second, the SelectKBest algorithm (ANOVA F-test, p < 0.01) selected the features most statistically associated with the class label (ASD vs TD). As a result, a robust set of 1393 T1WI features and 278 T2WI features remained for subsequent radiomics model development.
Two classic machine learning algorithms, support vector machine (SVM) with polynomial kernel and logistic regression (LR), and one tabular-based deep learning (DL) algorithm were used to train the classification models for differentiating ASD from TD. These classification models comprised 3 categories based on the modality: T1WI classifier, T2WI classifier, and T1WI+T2WI multimodal classifier. All subjects of ASD and TD groups were randomly divided into a training set and test set in a ratio of 7:3. All models were evaluated with five-fold cross-validation. During each training, all features were normalized using the Z-score normalization algorithm. For SVM and LR model training, feature selection was performed sequentially using the gradient boosting decision tree (GBDT) and the least absolute shrinkage and selection operator (LASSO) before model training. For the tabular-based deep learning model training, the TabTransformer Model network provided by Pytorch Tabular framework (v1.0.2, https://pytorch-tabular.readthedocs.io) was used and all features were included for deep learning model training, in which the loss function and optimizer selected the cross entropy and adaptive moment estimation (Adam), and the training epoch and batch size was 400 and 128, respectively. Furthermore, we used the t-distributed stochastic neighbor embedding (t-SNE) to visualize the T1WI, T2WI, and T1WI+T2WI data distribution. All feature selection and machine learning algorithms were implemented by scikit-learn (v1.3.2, https://scikit-learn.org).
The performance of each model was assessed utilizing the area under the receiver operating characteristic (ROC) curve (AUC), accuracy, sensitivity, and specificity as evaluation metrics. A five-fold cross-validation approach was employed for both training and evaluation processes. Additionally, t-distributed stochastic neighbor embedding (t-SNE) was applied to visualize the distribution of radiomic features.
Correlation Analysis Between Radiomics Features and Clinical Scale
To deepen the comprehension of radiomic features extracted from the selected regions of interest (ROIs) within the brain, this study examined the relationship between these features and autism spectrum disorder (ASD) symptoms, as assessed by clinical diagnostic scales. The analysis employed the F-regression test, a univariate linear regression method that provides F-statistic scores and p-values, utilizing scikit-learn version 1.3.2.
Statistical Analysis
The normally distributed continuous variables were compared using an independent samples t-test. The chi-square test was used to compare categorical variables. A threshold P value of less than 0.05 was defined as significant in the two-tailed analysis. All statistical data were analyzed by SPSS (version 25.0).
Results
Demographic Characteristics
A total of 207 subjects were examined in this study. The dataset comprised 91 ASD patients (female: male = 20: 71; mean ± standard deviation age 3.00 ± 0.96 years) and 116 TD children (female: male = 46: 70; mean ± standard deviation age 3.02 ± 1.77 years). A significant gender difference was observed (P = 0.007) and there was no statistically significant difference in age between the groups (P = 0.277). There is a difference in the proportion of men and women in the dataset included in this study, which is consistent with the trend of the sex ratio of ASD incidence rate.2 Detailed demographic information for both groups was provided in Table 1.
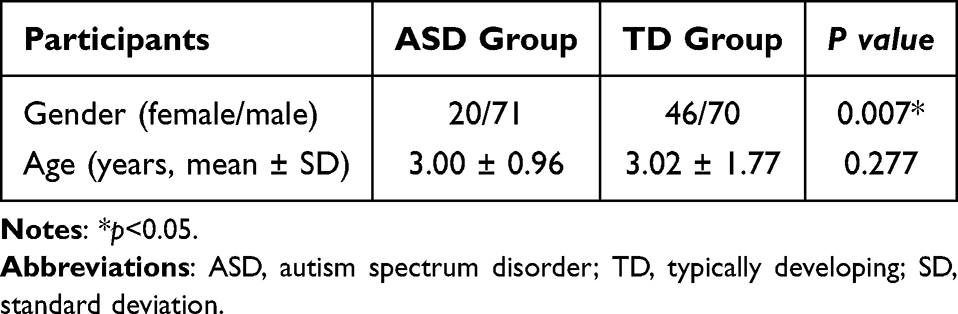 |
Table 1 Clinical Characteristics of the Participants |
Radiomics Features Selection
The interclass correlation coefficient (ICC) between two different radiologists showed excellent agreement (ICC = 0.82). The Pearson correlation coefficients between the radiomics features of T1WI and T2WI were calculated for the ASD and TD groups, respectively. The correlation heatmaps (correlation > 0.7) were illustrated in Figure 2A and B), Figure 3A and B). It showed that the TD group had stronger feature correlations among 8 brain ROIs than the ASD group in both T1WI and T2WI.
 |
Figure 2 Pearson correlation heatmap for T1WI radiomics features comparison. (A) ASD group; (B) TD group. |
 |
Figure 3 Pearson correlation heatmap for T2WI radiomics features comparison. (A) ASD group; (B) TD group. |
Diagnostic Performance
All three classifier categories performed well. The T1WI + T2WI multimodal classifier surpassed the single-modal T1WI and T2WI classifiers. Among the algorithms, the TabTransformer outperformed SVM and LR, due to its use of more features. SVM with a polynomial kernel performed better than LR on the T1WI classifier and similarly on the T2WI classifier. Detailed performance metrics are in Table 2. Figure 4A–F) presents the mean AUC of three algorithms for both single- and multi-modal classifiers. Figure 5 illustrates the SHAP summary plot for the best SVM model trained on the T1WI + T2WI multimodal classifier, highlighting the impact of top features on the model’s output. Notably, the Square Root first-order Energy feature from the left caudate nucleus ROI in the T1WI image was crucial in SVM modeling. This feature was voxel-wise calculated and visualized for one ASD and one TD subject, as shown in Figure 5. Figure 6A and B) reveals significant differences in data range, demonstrating how radiomics features help differentiate ASD from TD.
 |
Table 2 Performance of Radiomics Classifiers |
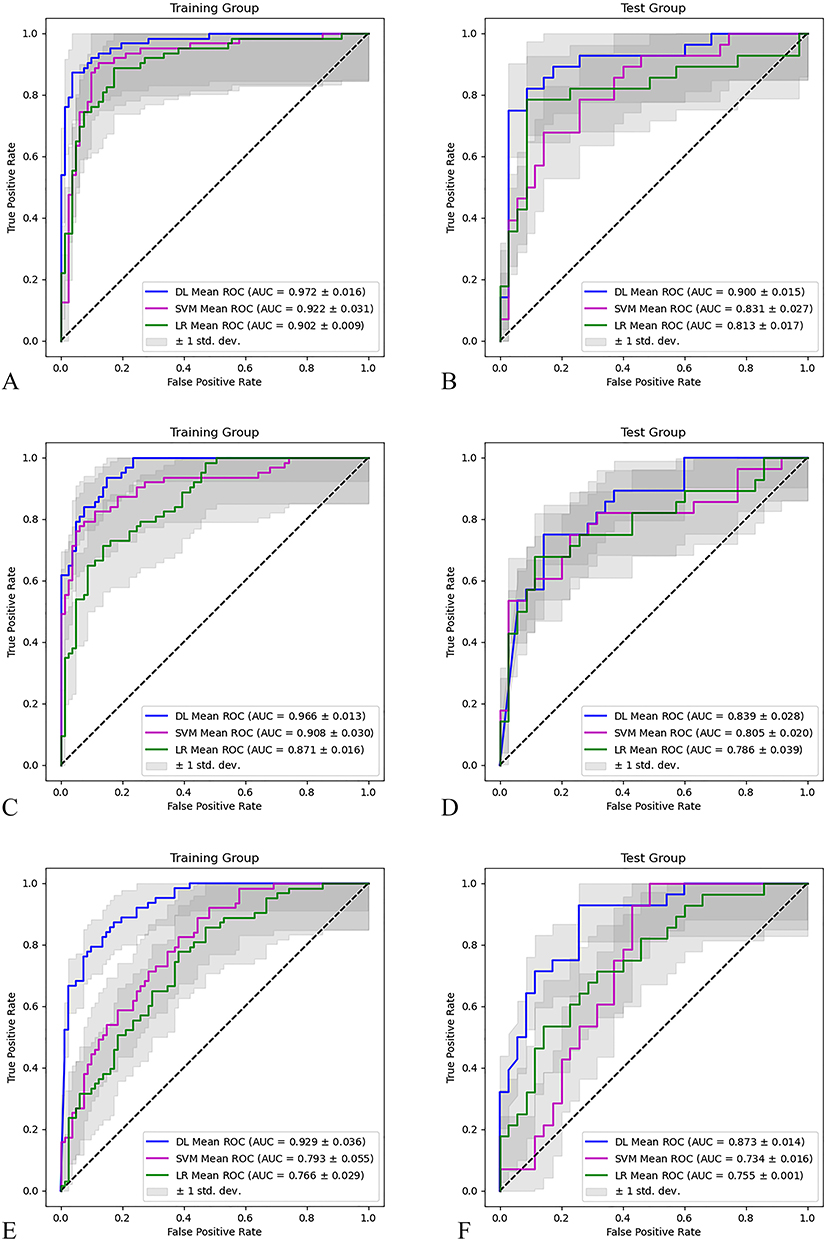 |
Figure 4 Mean ROC and AUC for 3 categories classifiers. (A and B) T1WI+T2WI; (C and D) T1WI; (E and F) T2WI. |
 |
Figure 5 Radiomics features SHAP summary plot of the best SVM model for T1WI+T2WI classifiers. The “cn”, “p”, “t”, and “h” in the left legend mean caudate nucleus, lentiform nucleus, thalamus, and hippocampus respectively, L and R mean left and right side, T1 and T2 mean T1WI and T2WI. |
 |
Figure 6 Radiomics feature voxel-wise visualization for the L_T1_cn_squareroot_firstorder_Energy feature for the TIWI+T2WI classifier. (A) ASD patient, (B) TD patient. |
Radiomics Model Visualization
The t-SNE visualization (Figure 7) demonstrated clear separation between ASD and TD groups for the T1WI and combined T1WI + T2WI models, but not for the T2WI model. This visually corroborates the superior classification performance of models incorporating T1WI features.
 |
Figure 7 The t-SNE visualizations depict the distribution of radiomic features across three distinct classifier categories: (A) the T1WI+T2WI classifier, (B) the T1WI classifier, and (C) the T2WI classifier. Notably, the features derived from T1WI demonstrate a clear separation between the typically developing (TD) and autism spectrum disorder (ASD) samples, a distinction not observed with the T2WI features. Class 0: TD group; Class 1: ASD group. |
Correlation Analysis Between Radiomics Features and Clinical Scales
Significant correlations were found between specific radiomic features and clinical scores (ABC, CARS). The top correlated features (Tables 3 and 4) primarily belonged to texture classes (GLSZM, GLDM, GLRLM) and were located in the left lentiform nucleus and bilateral caudate nucleus.
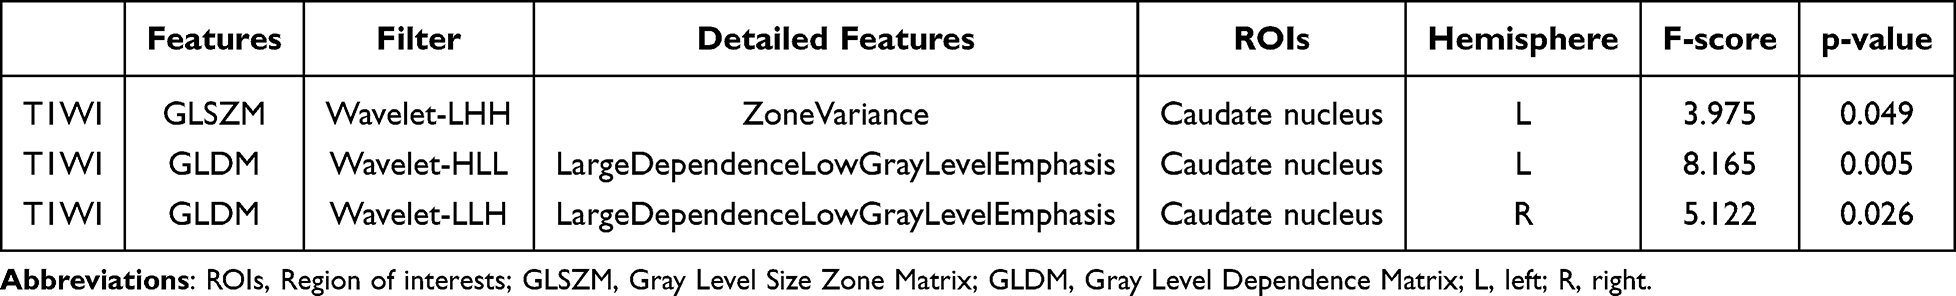 |
Table 3 Top Radiomics Features Correlated to Autism Behavior Checklist |
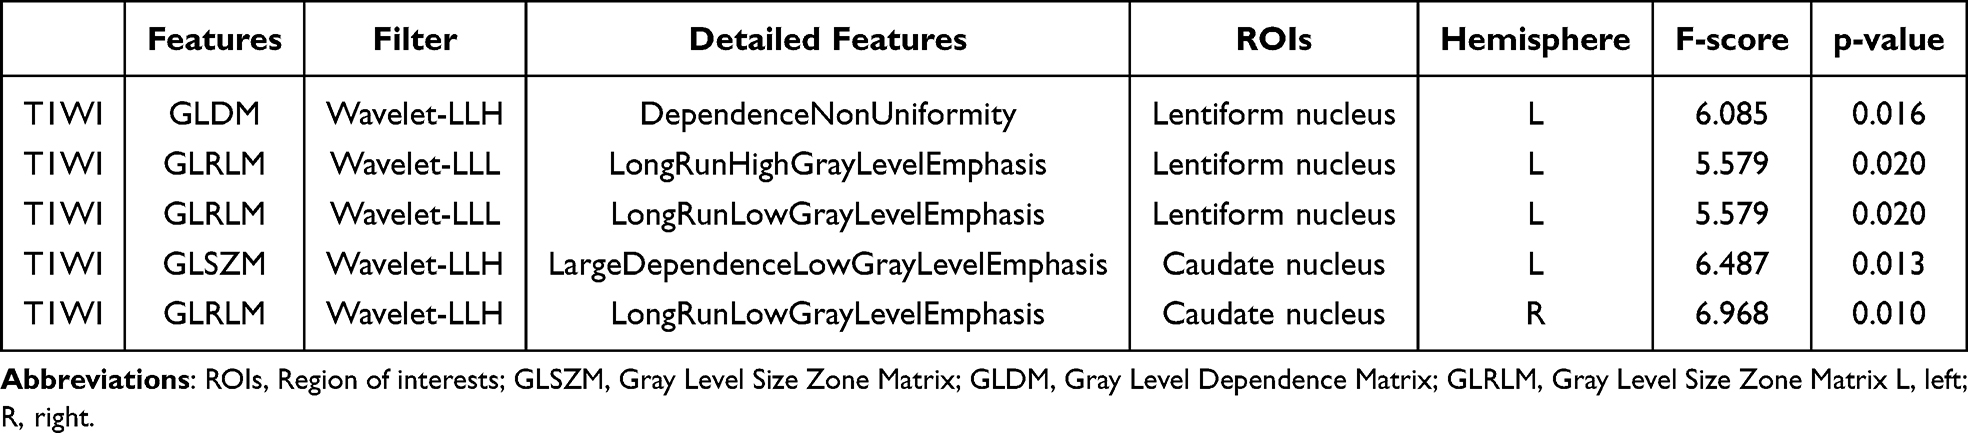 |
Table 4 Top Radiomics Features Correlated to Childhood Autism Rating Scale |
Discussion
Utilizing radiomics features derived from T1WI and T2WI, diagnostic models employing traditional LR, SVM and the novel DL TabTransformer were developed and assessed for their efficacy in distinguishing ASD from TD. Notably, the DL TabTransformer model, which integrated both T1WI and T2WI data, demonstrated exceptional diagnostic performance, achieving a mean AUC of 90.0%, accuracy of 83.4%, sensitivity of 84.3%, and specificity of 82.3%. The traditional machine learning models based on T1WI and T2WI also produced commendable results, with an AUC of 0.831 for SVM and 0.813 for LR.
Chaddad et al conducted two notable radiomics investigations focusing on ASD.16,17 In one study, radiomics analysis was applied to T1W images from a cohort consisting of 539 ASD patients and 573 healthy controls. This study identified significant textural alterations, which were asymmetrically located in the right hippocampus, left choroid plexus, and corpus callosum, as well as symmetrically in the cerebellar white matter.16 The subsequent study employed a support vector machine model and demonstrated that radiomics features of the hippocampus and amygdala could effectively differentiate ASD patients from healthy controls, achieving an AUC of 76.8%, sensitivity of 62.5%, and specificity of 71.4%.17 Our study evaluated a more comprehensive set of radiomics features from eight gray matter brain nuclei, all of which have been previously reported to exhibit alterations associated with core symptoms in ASD patients. Furthermore, deep learning techniques have demonstrated the ability to extract complex, latent correlations from data, yielding promising results when compared to traditional machine learning methods. The performance of most convolutional neural networks is suboptimal when applied to heterogeneous tabular data. The TabTransformer, a deep learning model specifically designed for tabular data, leverages contextual embedding and is grounded in the self-attention mechanism. Consequently, in addition to employing traditional machine learning algorithms, we utilized the deep learning-based TabTransformer algorithm to comprehensively harness all selected radiomic features.
In addition, the study further investigated the potential correlation between T1WI radiomics features and ASD clinical scale scores, CARS, and ABC, using the F-regression test. Our findings suggest that the features correlated with clinical scale scores are located in the left lentiform nucleus and the bilateral caudate nucleus. Previous research has demonstrated that the caudate nucleus volume in children with ASD exhibits atypical development, with developmental changes being associated with restricted repetitive behaviors and cognitive performance.26,27 The putamen and globus pallidus form the lentiform nucleus, which is a component of the basal ganglia complex.28,29 According to Shafritz et al, the pallidum, putamen, and nucleus accumbens play a pivotal role in the socio-motivational, cognitive, and motor systems within the neurobiology of ASD.30 Considering the documented asymmetry in inter-hemispheric development among individuals with autism, it is imperative for future research to include a comprehensive comparison of the behaviors, functions, and structures of the brain between the left and right hemispheres.31 Our study implies that early neuronal damage, preceding volume atrophy, may occur in certain brain regions associated with clinical symptoms of autism. Such damage could potentially lead to language disorders, social impairments, and repetitive stereotyped interests, among other symptoms.
Despite the innovative nature and strengths of this study, several limitations were identified. Firstly, the study was a bi-centric retrospective analysis lacking external validation. This limitation impacts the generalizability of our findings, and the potential for overfitting remains a concern, particularly for the deep learning model, despite the use of cross-validation techniques. Future efforts will focus on collaborating with multiple centers or utilizing public datasets to validate the model’s robustness and generalizability. Secondly, this study exclusively utilized conventional MRI sequences, specifically T1WI and T2WI. Contemporary neuroimaging techniques now provide a wealth of valuable and complementary information that was not incorporated in this study. Third, although manual segmentation of ROI is conducted by experienced radiologists with high inter-rater reliability, it remains a time-intensive process that introduces subjectivity, thereby limiting its scalability in clinical settings. Consequently, the development and validation of automated segmentation pipelines for critical regions, such as the lentiform and caudate nuclei, are essential future endeavors. Furthermore, the gender imbalance within our ASD cohort constrained our capacity to explore gender-specific radiomic signatures, highlighting the need for future research with more balanced datasets. Additionally, advancements in nuclear medicine and molecular imaging technology enable the acquisition of molecular-level metabolic information. Future research should aim to integrate multimodal imaging data to enhance diagnostic accuracy. Finally, this study exclusively examined MRI imaging data. Incorporating non-radiological data from other diagnostic methods, such as electroencephalograms, laboratory findings, and clinical scale scores, to develop a multimodal model could be a promising strategy to improve prognosis and treatment efficacy, which will be the focus of subsequent research.
Conclusion
In conclusion, this study provides evidence supporting the value of multi-region, multi-sequence radiomics analysis of conventional MRI for ASD diagnosis. The integration of a deep learning approach (TabTransformer) improved classification performance. Furthermore, the correlation between specific radiomics features from the lentiform and caudate nuclei and clinical symptom severity offers promising insights into potential imaging biomarkers with biological plausibility. However, the clinical translation of these findings requires addressing key limitations, notably through external validation in larger, prospective, and multi-center cohorts, exploration of automated segmentation techniques, and investigation of gender effects.
Data Sharing Statement
The data that support the findings of this study are available from the corresponding author Guojie Wang upon reasonable request.
Informed Consent Statement
Patient consent was waived due to the retrospective nature of this study.
Acknowledgments
We thank Hui Liao for his writing guidance on this article.
Funding
The Key Project of Guangdong Province (2018B030335001) funded this research.
Disclosure
The authors declare no conflict of interest.
References
1. Maenner MJ, Shaw KA, Baio J, et al. Prevalence of autism spectrum disorder among children aged 8 years — autism and developmental disabilities monitoring network, 11 sites, United States, 2016. MMWR Surveill Summ. 2020;69(4):1–12. doi:10.15585/mmwr.ss6904a1
2. Maenner MJ, Warren Z, Williams AR, et al. Prevalence and characteristics of autism spectrum disorder among children aged 8 years - autism and developmental disabilities monitoring network, 11 sites, United States, 2020. MMWR Surveill Summ. 2023;72(2):1–14. doi:10.15585/mmwr.ss7202a1
3. Lord C, Elsabbagh M, Baird G, et al. Autism spectrum disorder. Lancet. 2018;392(10146):508–520. doi:10.1016/S0140-6736(18)31129-2
4. Schopler E, Reichler RJ, DeVellis RF, et al. Toward objective classification of childhood autism: childhood autism rating scale (CARS). J Autism Dev Disord. 1980;10(1):91–103. doi:10.1007/BF02408436
5. Lord C, Rutter M, Le Couteur A. Autism diagnostic interview-revised: a revised version of a diagnostic interview for caregivers of individuals with possible pervasive developmental disorders. J Autism Dev Disord. 1994;24(5):659–685. doi:10.1007/BF02172145
6. Rafiee F, Rezvani Habibabadi R, Motaghi M, et al. Brain MRI in autism spectrum disorder: narrative review and recent advances. J Magn Reson Imaging. 2022;55(6):1613–1624. doi:10.1002/jmri.27949
7. Libero LE, DeRamus TP, Deshpande HD, et al. Surface-based morphometry of the cortical architecture of autism spectrum disorders: volume, thickness, area, and gyrification. Neuropsychologia. 2014;62:1–10. doi:10.1016/j.neuropsychologia.2014.07.001
8. Liu J, Yao L, Zhang W, et al. Gray matter abnormalities in pediatric autism spectrum disorder: a meta-analysis with signed differential mapping. Eur Child Adolesc Psychiatry. 2017;26(8):933–945. doi:10.1007/s00787-017-0964-4
9. Retico A, Giuliano A, Tancredi R, et al. The effect of gender on the neuroanatomy of children with autism spectrum disorders: a support vector machine case-control study. Mol Autism. 2016;7:5. doi:10.1186/s13229-015-0067-3
10. Khundrakpam BS, Lewis JD, Kostopoulos P, et al. Cortical thickness abnormalities in autism spectrum disorders through late childhood, adolescence, and adulthood: a large-scale MRI study. Cereb Cortex. 2017;27(3):1721–1731. doi:10.1093/cercor/bhx038
11. Sussman D, Leung RC, Vogan VM, et al. The autism puzzle: diffuse but not pervasive neuroanatomical abnormalities in children with ASD. Neuroimage Clin. 2015;8:170–179. doi:10.1016/j.nicl.2015.04.008
12. Swanson MR, Shen MD, Wolff JJ, et al. Subcortical brain and behavior phenotypes differentiate infants with autism versus language delay. Biol Psychiatry Cogn Neurosci Neuroimaging. 2017;2(8):664–672. doi:10.1016/j.bpsc.2017.07.007
13. van Rooij D, Anagnostou E, Arango C, et al. Cortical and subcortical brain morphometry differences between patients with autism spectrum disorder and healthy individuals across the lifespan: results from the ENIGMA ASD working group. Am J Psychiatry. 2018;175(4):359–369. doi:10.1176/appi.ajp.2017.17010100
14. Kumar V, Gu Y, Basu S, et al. Radiomics: the process and the challenges. Magn Reson Imaging. 2012;30(9):1234–1248. doi:10.1016/j.mri.2012.06.010
15. Tupe-Waghmare P, Rajan A, Prasad S, et al. Radiomics on routine T1-weighted MRI can delineate Parkinson’s disease from multiple system atrophy and progressive supranuclear palsy. Eur Radiol. 2021;31(11):8218–8227. doi:10.1007/s00330-021-07979-7
16. Chaddad A, Desrosiers C, Hassan L, et al. Hippocampus and amygdala radiomic biomarkers for the study of autism spectrum disorder. BMC Neurosci. 2017;18(1):52. doi:10.1186/s12868-017-0373-0
17. Chaddad A, Desrosiers C, Toews M. Multi-scale radiomic analysis of sub-cortical regions in MRI related to autism, gender and age. Sci Rep. 2017;7:45639. doi:10.1038/srep45639
18. Amaral DG, Schumann CM, Nordahl CW. Neuroanatomy of autism. Trends Neurosci. 2008;31(3):137–145. doi:10.1016/j.tins.2007.12.005
19. Varghese M, Keshav N, Jacot-Descombes S, et al. Autism spectrum disorder: neuropathology and animal models. Acta Neuropathol. 2017;134(4):537–566. doi:10.1007/s00401-017-1736-4
20. Courchesne E, Pramparo T, Gazestani VH, et al. The ASD living biology: from cell proliferation to clinical phenotype. Mol Psychiatry. 2019;24(1):88–107. doi:10.1038/s41380-018-0056-y
21. Schuetze M, Park MT, Cho IY, et al. Morphological alterations in the thalamus, striatum, and pallidum in autism spectrum disorder. Neuropsychopharmacology. 2016;41(11):2627–2637. doi:10.1038/npp.2016.64
22. Kocovski P, Tabassum-Sheikh N, Marinis S, et al. Immunomodulation eliminates inflammation in the hippocampus in experimental autoimmune encephalomyelitis, but does not ameliorate anxiety-like behavior. Front Immunol. 2021;12. 639650. doi:10.3389/fimmu.2021.639650
23. McLaughlin K, Travers BG, Dadalko OI, et al. Longitudinal development of thalamic and internal capsule microstructure in autism spectrum disorder. Autism Res. 2018;11(3):450–462. doi:10.1002/aur.1909
24. Abdolmohammadi J, Faeghi F, Arefan D, et al. The role of single voxel MR spectroscopy, T2 relaxation time and apparent diffusion coefficient in determining the cellularity of brain tumors by MATLAB software. Asian Pac J Cancer Prev. 2018;19(10):2891–2895. doi:10.22034/APJCP.2018.19.10.2891
25. Eaves RC, Milner B. The criterion-related validity of the childhood autism rating scale and the autism behavior checklist. J Abnorm Child Psychol. 1993;21(5):481–491. doi:10.1007/BF00916315
26. Qiu T, Chang C, Li Y, et al. Two years changes in the development of caudate nucleus are involved in restricted repetitive behaviors in 2-5-year-old children with autism spectrum disorder. Dev Cogn Neurosci. 2016;19:137–143. doi:10.1016/j.dcn.2016.02.010
27. Voelbel GT, Bates ME, Buckman JF, et al. Caudate nucleus volume and cognitive performance: are they related in childhood psychopathology? Biol Psychiatry. 2006;60(9):942–950. doi:10.1016/j.biopsych.2006.03.071
28. Green E, Jacobson A, Haase L, et al. Can age-related CNS taste differences be detected as early as middle age? Evidence from fMRI. Neuroscience. 2013;232:194–203. doi:10.1016/j.neuroscience.2012.11.027;.
29. Ghandili M, Munakomi S. In StatPearls. StatPearls Publishing LLC; 2024.
30. Shafritz KM, Bregman JD, Ikuta T, et al. Neural systems mediating decision-making and response inhibition for social and nonsocial stimuli in autism. Prog Neuropsychopharmacol Biol Psychiatry. 2015;60:112–120. doi:10.1016/j.pnpbp.2015.03.001
31. Postema MC, van Rooij D, Anagnostou E, et al. Altered structural brain asymmetry in autism spectrum disorder in a study of 54 datasets. Nat Commun. 2019;10(1):4958. doi:10.1038/s41467-019-13005-8
 © 2025 The Author(s). This work is published and licensed by Dove Medical Press Limited. The
full terms of this license are available at https://www.dovepress.com/terms
and incorporate the Creative Commons Attribution
- Non Commercial (unported, 4.0) License.
By accessing the work you hereby accept the Terms. Non-commercial uses of the work are permitted
without any further permission from Dove Medical Press Limited, provided the work is properly
attributed. For permission for commercial use of this work, please see paragraphs 4.2 and 5 of our Terms.
© 2025 The Author(s). This work is published and licensed by Dove Medical Press Limited. The
full terms of this license are available at https://www.dovepress.com/terms
and incorporate the Creative Commons Attribution
- Non Commercial (unported, 4.0) License.
By accessing the work you hereby accept the Terms. Non-commercial uses of the work are permitted
without any further permission from Dove Medical Press Limited, provided the work is properly
attributed. For permission for commercial use of this work, please see paragraphs 4.2 and 5 of our Terms.
Recommended articles
Autism Spectrum Disorder Diagnoses: A Comparison of Countries with Different Income Levels
Matos MB, Bara TS, Cordeiro ML
Clinical Epidemiology 2022, 14:959-969
Published Date: 13 August 2022
Development and Validation of an MRI Radiomics-Based Signature to Predict Histological Grade in Patients with Invasive Breast Cancer
Wang S, Wei Y, Li Z, Xu J, Zhou Y
Breast Cancer: Targets and Therapy 2022, 14:335-342
Published Date: 14 October 2022
Comparison of Magnetic Resonance Imaging-Based Radiomics Features with Nomogram for Prediction of Prostate Cancer Invasion
Liu Y
International Journal of General Medicine 2023, 16:3043-3051
Published Date: 17 July 2023
A Comprehensive Model Based on Dynamic Contrast-Enhanced Magnetic Resonance Imaging Can Better Predict the Preoperative Histological Grade of Breast Cancer Than a Radiomics Model
Wu Y, Pan W, Wang L, Pan W, Zhang H, Jin S, Wu X, Liu A, Xin E, Ji W
Breast Cancer: Targets and Therapy 2023, 15:709-720
Published Date: 18 October 2023
Support Vector Machine for Stratification of Cognitive Impairment Using 3D T1WI in Patients with Type 2 Diabetes Mellitus
Xu Z, Zhao L, Yin L, Cao M, Liu Y, Gu F, Liu X, Zhang G
Diabetes, Metabolic Syndrome and Obesity 2025, 18:435-451
Published Date: 13 February 2025