Back to Journals » International Journal of General Medicine » Volume 16
Comparison of Magnetic Resonance Imaging-Based Radiomics Features with Nomogram for Prediction of Prostate Cancer Invasion
Authors Liu Y
Received 27 April 2023
Accepted for publication 10 July 2023
Published 17 July 2023 Volume 2023:16 Pages 3043—3051
DOI https://doi.org/10.2147/IJGM.S419039
Checked for plagiarism Yes
Review by Single anonymous peer review
Peer reviewer comments 2
Editor who approved publication: Dr Scott Fraser
Yang Liu
X-Ray Department, The No.1 People’s Hospital of Huzhou, Huzhou, Zhejiang, 313000, People’s Republic of China
Correspondence: Yang Liu, X-ray department, The No.1 People’s hospital of Huzhou, No. 158, Square Hou Road, Wuxing District, Huzhou, Zhejiang, 313000, People’s Republic of China, Email [email protected]
Objective: To explore the value of the magnetic resonance imaging (MRI) radiomics model in predicting prostate cancer (PCa) invasion.
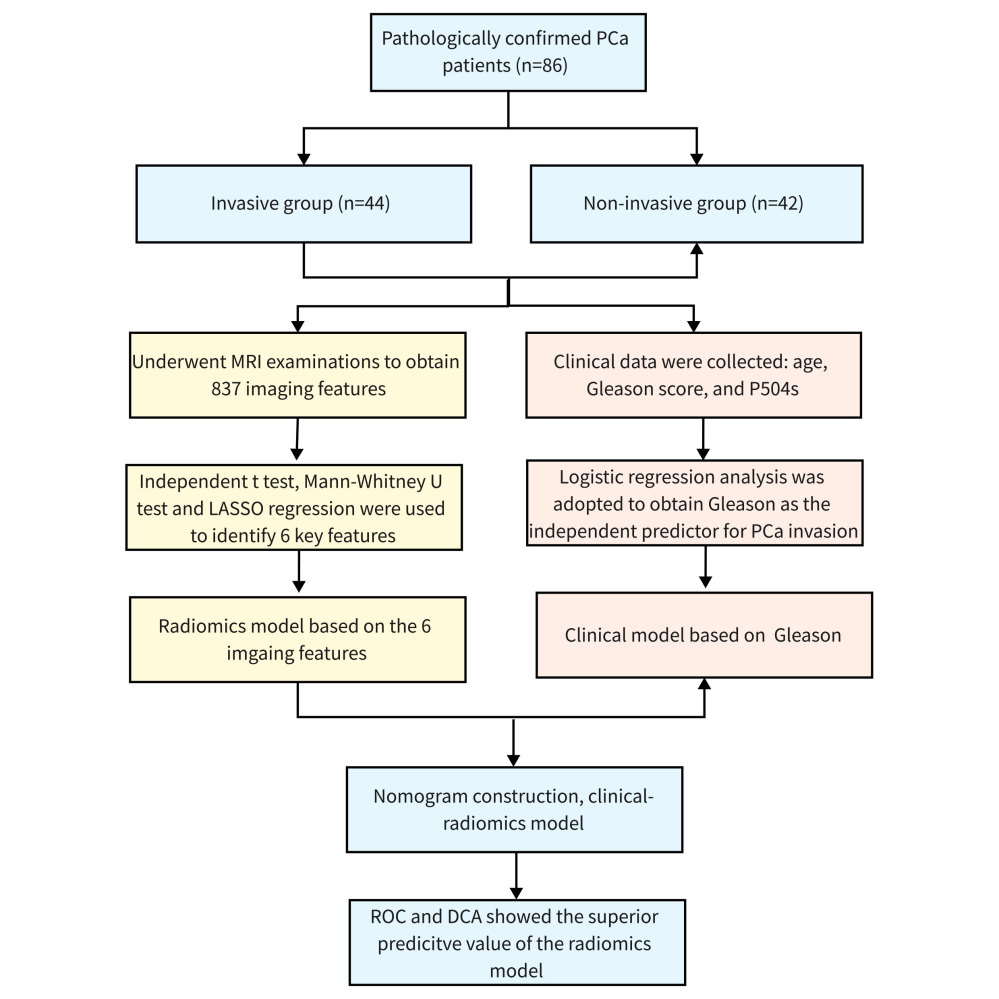
Methods: Clinical data of 86 pathologically confirmed PCa patients in our hospital were collected, including 44 cases in the invasive group and 42 cases in the non-invasive group. All patients underwent MRI examinations, and the same parameters were used. The lesion area was manually delineated and the radiomics features were extracted from T2WI. The radiomics signature based on LASSO regression was established. Besides, logistic regression was used to identify independent clinical predictors, and a combined model incorporating the radiomics signature and independent clinical risk factor was constructed. Finally, the receiver operating characteristic curve (ROC) analysis and decision curve analysis (DCA) was performed to compare the prediction efficiency and clinical benefit of each model.
Results: A total of 867 radiomics features were obtained, and six of them were incorporated into the radiomics model. Multivariate logistic regression analysis exhibited the Gleason score as an independent clinical risk factor for PCa invasion. ROC results showed that the performance of the radiomics model was comparable to that of the clinical-radiomics model in predicting PCa invasion, and it was better than that of the single Gleason score. DCA also confirmed the considerable clinical application value of the radiomics and the clinical-radiomics models.
Conclusion: As a simple, non-invasive, and efficient method, the radiomics model has important predictive value for PCa invasion.
Keywords: prostate cancer, invasion, magnetic resonance imaging, radiomics, machine learning
Graphical Abstract:
Introduction
Prostate cancer (PCa) is one of the most common malignant tumors and the second leading cause of death among men worldwide, threatening human life and health safety.1,2 The morbidity of PCa is 60.3/100,000 in China, which is lower than 80.7/100,000 in European and American countries. With the change in diet structure, living environment, and the aggravation of population aging, its incidence has increased rapidly in China as well.3 PCa screening through serum prostate-specific antigen testing and prostate biopsy has reduced mortality from advanced PCa over the past decade.4 In a population of 3171 men who underwent prostate biopsy, 36.9% of them suffered from PCa: their PSA levels were <4 ng/mL in 8.8% of cases and <10 ng/mL in 51.8%.5 However, in men over 70 years or in any men with less than a 10–15 year life expectancy, prostate-specific antigen was not recommended according to the American Urological Association due to unexpected overdiagnosis and overtreatment of low-risk and indolent prostate cancers.6 In addition, the Gleason score serves as a key factor in predicting PCa invasion, which has become one of the main reference indicators for treatment decisions and prognosis evaluation.7 Nevertheless, the Gleason score of PCa is qualitative and subjective, which requires invasive procedures to obtain tissue specimens, such as puncture, resection, or radical surgery, carrying the risk of infection and bleeding and may underestimate aggressiveness.8 Therefore, it is of great significance to explore a simple, non-invasive, and efficient evaluation method for PCa invasion, guide treatment and improve the prognosis of patients.
Magnetic resonance imaging (MRI) has been widely used to evaluate the heterogeneity of tumors and achieved high diagnostic efficiency.9 Quantitative measurements based on MRI and PET/CT results including lymph node volume, primary tumor volume, and standard uptake values were closely related to clinical outcomes.10,11 To achieve a more quantitative prediction approach, many studies have assessed the role of quantitative analysis of medical images, triggering the development of radiomics. Radiomics is a high-throughput extraction of a large number of medical image features from medical examination images and then conversion into minable high-dimensional data.12 Radiomics features quantify properties related to tumor shape, texture, and image intensity, which may be predictive of the clinical outcomes and tumor characteristics.13 Despite the evidence of the benefit of radiomics in predicting significant PCa,14,15 few studies combine radiomics features with clinical factors to assess invasion risk.
This study constructed models based on radiomics features, clinical features, and clinical-radiomics, and compared their efficacy as well as clinical benefit in predicting PCa invasion.
Materials and Methods
Study Population
This study retrospectively analyzed 86 patients with PCa admitted to our hospital from April 2020 to March 2022, with an average age of (73.709±7.198) years old. Patients were divided into invasion (n=44) and non-invasion (n=42) groups. Gleason scores of tumor cases were as follows: 9 patients with 3+3 points, 11 patients with 3+4 points, 25 patients with 4+3 points, 23 patients with 4+4 points, 14 patients with 4+5 points, 2 patients with 5+4 points, and 2 patients with 5+5 points. P504s indicators: - in 2 cases, + in 58 cases, ++ in 15 cases, and +++ in 11 cases. Inclusion criteria: 1) Patients with confirmed pathological diagnosis after prostate biopsy or total resection; 2) Preoperative MRI examination was performed with the same equipment and consistent sequence; 3) There was no history of biopsy, surgery, or endocrine therapy before MRI examination. Exclusion criteria: 1) Incomplete clinical data or imaging data; 2) There were artifacts in MRI images, which affected lesion segmentation; 3) Prior to MRI examination, patients had a history of biopsy, surgery, and endocrine therapy.
MRI Image Acquisition
The MRI scan was performed using a GE Discovery 750w 3.0T magnetic resonance scanner with a 16-channel abdominal coil. Scanning parameters: T2WI: repetition time (TR): 3000 ms, echo time (TE): 95 ms, field of view (FOV): 252 mm ×224 mm, matrix: 400 ×400, layer thickness: 3 mm, layer spacing: 0.
Image Segmentation and Feature Extraction
The “Segment Editor” module in 3D slicer (Version 4.10.2 r28257) was used to manually delineate the region of interest (ROI) of the suspicious lesion on the MRI image by two radiologists with 10 years of clinical experience. Then, Pyradiomics was used to extract radiomics features in ROIs on T2WI sequence images through the extension package “SlicerRadiomics” (Revision 3b2c531) in a 3D slicer (Version 4.10.2 r28257).
Feature Selection and Model Construction
Firstly, an independent student-t test or Mann–Whitney U-test was adopted to evaluate the differences in all radiomics features between the invasive and the non-invasive groups, and the radiomics features without significant correlation with invasion were excluded. Then, the identified significant radiomics features were included in the least absolute shrinkage and selection operator (LASSO) regression analysis, and the optimal λ value was selected by 10-fold cross-validation to identify the optimal subset and the coefficients of the corresponding radiomics features. The weighted linear combination of the coefficients of the selected features was performed to calculate the radiomics score (Radscore) for each patient, and the difference in Radscore between the two groups was analyzed. The optimized feature subset was selected to construct the final Radiomics model.
Screening of Clinical Variables and Construction of a Clinical-Radiomics Model
Univariate and multivariate logistic regression analyses were used to screen the clinically independent risk factors of PCa invasion. Based on the clinically significant features and Radscore, a clinical-radiomics model was established considering the radiomics features and the weight of clinical risk factors, which was expressed in the form of a nomogram. The total point of the nomogram was classified by quartile, and the patients in the first group of points were used as the reference group to evaluate the correlation between the total score and the risk of PCa invasion.
Evaluation of Predictive Models
The receiver operating characteristic (ROC) curve was drawn and the area under the curve (AUC) values were calculated to analyze the performance of the Radiomics model, clinical features, and clinical-radiomics in predicting PCa invasion. Delong test was used to compare AUC values. The clinical decision curve analysis (DCA) was used to evaluate the practicability of the three models. P <0.05 was considered statistically significant.
Statistical Analysis
SPSS 23.0 software and R 4.1.0 software were used for data analyses. Count data were expressed as numbers and the chi-square test was used for the comparisons between the two groups. The Kolmogorov–Smirnov test was employed for examining the distribution normality. Normally distributed continuous variables were represented as mean ± SD and non-normally distributed continuous variables as quartile [M (P25, P75)]. The independent student-t test or Mann–Whitney U-test was adopted to compare the differences between the two groups, respectively. P <0.05 was considered statistically significant.
Results
Patient Characteristics
A total of 86 patients were enrolled, with 44 patients in the invasive group and 42 patients in the non-invasion group. According to the Gleason score, the patients were divided into the Gleason score ≤3+4 group (n = 20) and the Gleason score ≥ 4+3 group (n = 66). There were no significant differences in age and P504s between the two groups (P >0.05), but a significant difference was observed in the Gleason score (P <0.05) (Table 1).
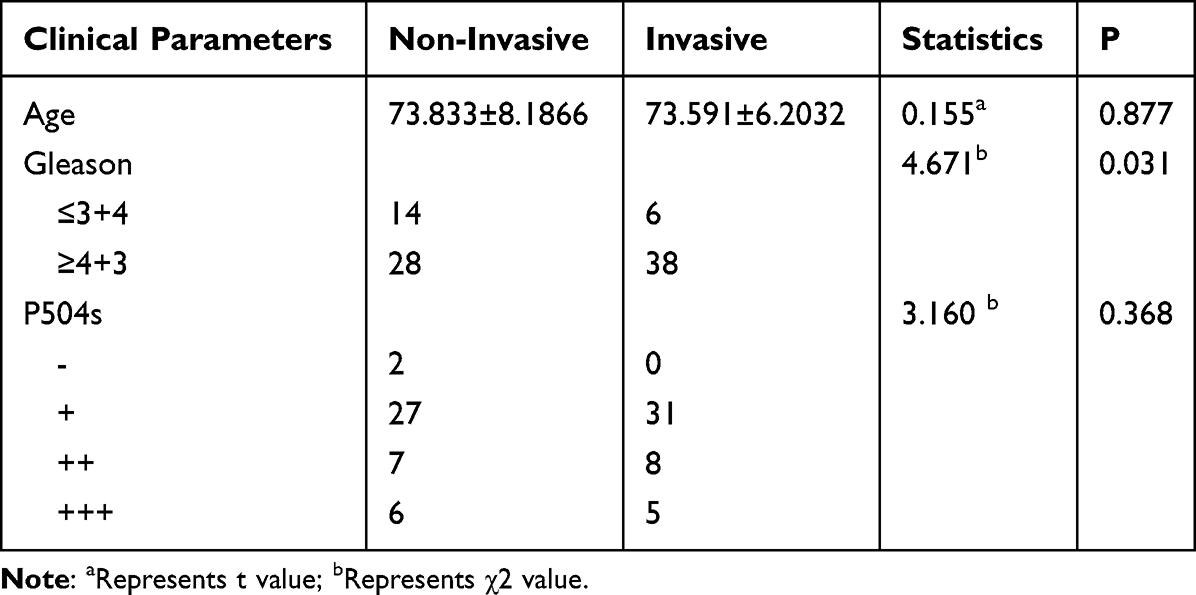 |
Table 1 Patient Characteristics |
Radiomics Feature Selection and Model Construction
A total of 837 imaging features were extracted from the ROI region. The types of features extracted included first-order features, gray-level co-occurrence matrix (glcm), gray-level dependence matrix (gldm), gray-level run-length matrix (glrlm), gray-level size zone matrix (glzm), neighborhood gray-tone different matrix (glzm) and other texture features and wavelet features. Independent student-t test or Mann–Whitney U-test was used to obtain 27 features with a P <0.05. Then, the LASSO algorithm and 10-fold cross-validation were used to screen out 6 potential predictors, which were applied to establish the Radiomics model (Figure 1A and B). The features used in the model and their coefficients were shown in Table 2.
 |
Table 2 Selected Radiomics Features and Coefficients |
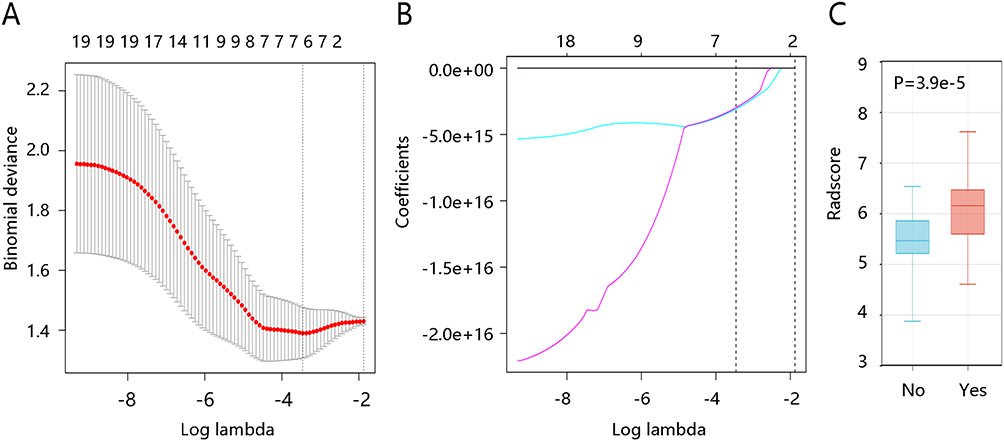 |
Figure 1 Feature selection and comparison of Radscore. (A) The curve of binomial deviation versus parameter lambda of MRI radiomics model. The vertical axis is the binomial deviation, the horizontal axis represents the log(λ) value, the upper number represents the number of screened features, and the λ at the minimum binomial deviation of the model is the optimal value (vertical dashed line). (B) Graph of the variation of radiomics feature coefficient with λ. (C) Comparison of Radscores between invasive and non-invasive groups. |
The Radscore was calculated as the following formula: Radscore=0.01058×Original_firstorder_InterquartileRange + 2.07843×Wavelet-LHL_glcm_MCC + 3.078+15E×Wavelet-LHL_firstorder_MeanAbsoluteDeviation + 2.977+15E×Wavelet-LHL_firstorder_Mean + 10.86855×Wavelet-LHH_glcm_Autocorrelation + 0.05854×Wavelet-LHH_ glrlm_ LongRunHighGrayLevelEmphasis - 5.64769113301032. The Radscore of the invasive group was significantly higher than that of the non-invasive group (P <0.05) (Figure 1C).
Screening of Clinical Variables and Construction of a Clinical-Radiomics Model
In terms of clinical factors, univariate and multivariate logistic regression analysis showed that age and P504s had no statistical significance in predicting PCa invasion (P >0.05), while Gleason score had statistical significance in predicting PCa invasion (P <0.05), which could be used as an independent predictor (Table 3).
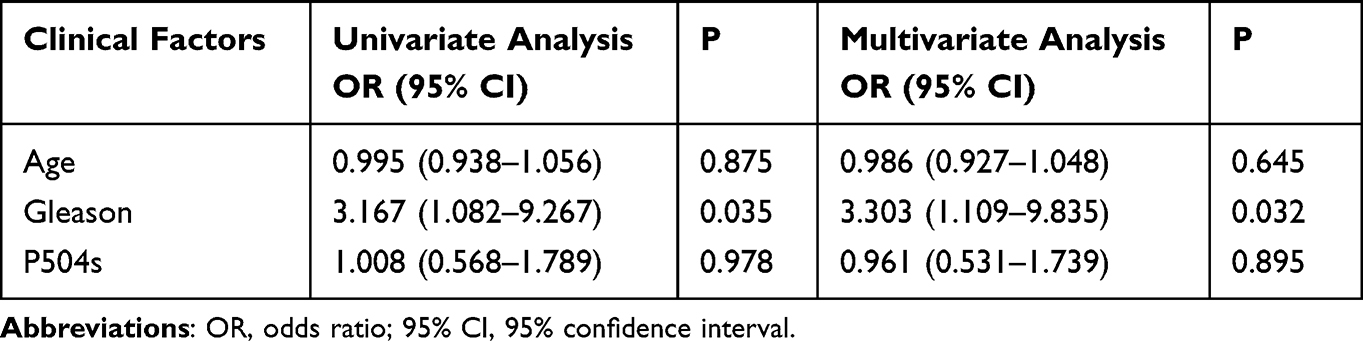 |
Table 3 Logistic Regression Analyses of Clinical Factors |
Based on the Gleason score and Radscore, the clinical-radiomics model was established and presented in a nomogram (Figure 2A), which showed that Radscore had a greater contribution to the risk of PCa invasion than the Gleason score. In addition, we divided patients into four groups by quartiles of the total nomogram score. The results showed that the risk of PCa invasion increased with the increase of the total score. The risk of PCa invasion was significantly higher in patients with a total score of 72.439–105.551 than in patients with the first group of scores (odds ratio [OR]: 26.667, 95% confidence interval [CI]: 4.727–150.428) (Figure 2B).
 |
Figure 2 Construction of the nomogram. (A) Nomogram to predict the risk of prostate cancer invasion. The value of each variable was scored on a scale of 0 to 100, and the scores for each variable were then added together. The sum is located on the total score number line, allowing us to predict the probability of prostate cancer invasion. Gleason classification: 0 for ≤3+4, 1 for ≥4+3. (B) Correlation between total score of the nomogram and risk of prostate cancer invasion. The “total score” is the same as ‘Total points’. |
Evaluation of Model Efficacy
To evaluate the predictive performance of the model, ROC analysis was performed. The AUC values of the Gleason score, Radiomics model, and clinical-radiomics model were 0.598, 0.739, and 0.763, respectively (Figure 3A) (Table 4). Delong test results showed that the predictive value of the Radiomics model was comparable to that of the clinical-radiomics model (P >0.05) and significantly better than that of the Gleason score (P <0.05) (Table 5). In DCA, the net clinical benefit of using the clinical-Radiomics model to predict the risk of PCa invasion was comparable to that of the radiomics model but higher than the Gleason score (Figure 3B).
 |
Table 4 The Predictive Values of Three Models for Prostate Cancer Invasion |
 |
Table 5 Comparisons of AUC Values Using the Delong Test |
 |
Figure 3 Evaluation of model efficacy. (A) Comparison of receiver operating characteristics curves of different models. (B) Decision curve comparison of different models. |
Discussion
In this study, a large number of radiomic features were extracted from MRI images, and these features were effectively screened to establish a Radiomics model based on LASSO regression analysis. Then, Radscore and significant Gleason score were used to construct the combined clinical-radiomics model. Our results showed that the Radiomics model and the combined clinical-radiomics model were comparable in terms of AUC and net clinical benefit in predicting PCa invasion, which was better than the single Gleason score. It suggests the unique value of radiomics features as a simple, non-invasive method for predicting PCa invasion.
The diagnosis of PCa has significantly improved following the development of various approaches. Compared with lung-abdomen CT combined with a bone scan, PSMA PET/CT scan presented better accuracy in the diagnosis of nodes and bone metastases, and might be a standard imaging method for high-risk PCa staging.16 Besides, the map of the apparent diffusion coefficient is a biomarker in distinguishing men with clinically insignificant PCa from those with the aggressiveness of PCa under-staged by prostate biopsy, helping clinicians to stratify patients through tumor aggressiveness.17 Radiomics is a non-invasive, efficient, and reliable method, which adopts advanced image processing technology to extract various quantitative features from imaging data.9 This approach is mainly used in the field of oncology, such as lung cancer, cerebral astrocytoma, and breast cancer, for tumor staging, efficacy, prognosis assessment, and genetic analysis.18–20 Many studies have shown that radiomics features can be used for the diagnosis and risk classification of PCa. Li et al constructed a radiomics nomogram that incorporated the MRI-based radiomics signature and serum PSA density level to predict clinically significant PCa, but lacked model comparison.14 In the study of Jing et al, lesion and complete prostate segmentation methods on T2WI and DWI were established to acquire the radiomics signature. The nomogram combining radiomics features and PI-RADS exhibited improved performance in predicting clinically significant PCa.15 Min et al studied an MRI-based radiomics feature to predict clinically significant PCa, and demonstrated that radiomics features had the value of distinguishing clinically significant from non-significant PCa with a satisfactory diagnostic efficiency (AUC = 0.823).21 Similarly, Zhang et al constructed a nomogram containing radiomics features and apparent diffusion coefficient values as a clinical-radiomics model to distinguish clinically significant and non-significant PCa. ROC curve and DCA curve results showed that this model played a potential role in predicting and diagnosing clinically significant/non-significant PCa.22 Sidhu et al showed that texture features could distinguish significant transitional band PCa, and the AUC of these parameter combinations was 0.86.23 Nketiah et al demonstrated that T2WI-based radiomics texture features were significantly correlated with the Gleason score of PCa and could enhance the performance of tumor characteristics.24 Our results indicated that the efficacy of the Radiomics model based on T2WI was comparable to that of the nomogram but better than the Gleason score.
Radiomic features include first-order features, shape features, texture features, and wavelet features.25 The radiomics method can transform the traditional image into a large number of digitizing features that can be mined to reveal the inherent biological characteristics.26 Previous studies have revealed that radiomics features were remarkably associated with the biological behavior of tumors and can be an imaging biomarker for predicting therapeutic efficacy and patient prognosis.27 In this study, a total of 837 radiomics features were obtained from T2WI images, and 5 of the 6 features included in the model after screening were wavelet features: MCC, MeanAbsoluteDeviation, Mean, Autocorrelation, and LongRunHighGrayLevelEmphasis. MCC represents the complexity of the texture, and the lower the value, the more complex the texture.28 MeanAbsoluteDeviation can describe the intensity distribution and reflect the heterogeneity of the tumor.29 Mean is correlated with the gray value of pixel, which indirectly reflects the blood supply of the primary focus. Autocorrelation measures texture fineness and roughness. LongRunHighGrayLevelEmphasis can measure long-running and high gray-level values of the joint distribution.30 Based on the coefficients of these five wavelet features and one original image feature, the Radscore was calculated and compared between the two groups. The results showed that the Radscore of the invasive group was significantly higher than that of the non-invasive group, suggesting a strong correlation between the radiomics features and invasion.
Although the radiomics model is quantitative and relatively objective and exhibited satisfactory performance, it still needs to be verified against subjective methods such as the PI-RADS score, which is our future research direction. Since the relevance of findings is hindered by the cross-validation nature of the study and the radiomics features were explored based on T2WI sequence, the preliminary results should be validated and radiomics features from other sequences should be included in multi-center and large-sample studies in the future.
In conclusion, we develop a Radiomics model to predict PCa invasion with high diagnostic efficacy and net clinical benefit. Further, radiomics model has a comparable ability for predicting PCa invasion to the clinical-radiomics model, which provides radiologists with a quantitative and intuitive method to predict the risk of PCa invasion. However, the relevance of the findings is hindered by the cross-validation nature of the study, and hence the preliminary results should be verified in a greater number of patients.
Data Sharing Statement
The datasets generated during and/or analyzed during the current study are available from the corresponding author on reasonable request.
Ethics Approval
The Ethics Committee of The No.1 People’s Hospital of Huzhou waived the need for ethics approval. Our research conforms to patient data confidentiality and compliance with the Declaration of Helsinki.
Acknowledgment
Thanks to Shi-yong Wu and Jia-chen Wang for their help and guidance during the image segmentation process.
Funding
There is no funding to report.
Disclosure
The author reports no conflicts of interest in this work.
References
1. Li M, Chen T, Zhao W, et al. Radiomics prediction model for the improved diagnosis of clinically significant prostate cancer on biparametric MRI. Quant Imaging Med Surg. 2020;10(2):368–379. doi:10.21037/qims.2019.12.06
2. Culp MB, Soerjomataram I, Efstathiou JA, Bray F, Jemal A. Recent global patterns in prostate cancer incidence and mortality rates. Eur Urol. 2020;77(1):38–52. doi:10.1016/j.eururo.2019.08.005
3. Feng RM, Zong YN, Cao SM, Xu RH. Current cancer situation in China: good or bad news from the 2018 global cancer statistics? Cancer Commun. 2019;39(1):22. doi:10.1186/s40880-019-0368-6
4. Caverly TJ, Hayward RA, Reamer E, et al. Presentation of benefits and harms in us cancer screening and prevention guidelines: systematic review. J Natl Cancer Inst. 2016;108(6):djv436. doi:10.1093/jnci/djv436
5. Aragona F, Pepe P, Motta M, et al. Incidence of prostate cancer in Sicily: results of a multicenter case-findings protocol. Eur Urol. 2005;47(5):569–574. doi:10.1016/j.eururo.2004.11.007
6. Chen YT, Tsai CH, Chen CL, Yu JS, Chang YH. Development of biomarkers of genitourinary cancer using mass spectrometry-based clinical proteomics. J Food Drug Anal. 2019;27(2):387–403. doi:10.1016/j.jfda.2018.09.005
7. Epstein JI, Egevad L, Amin MB, et al. The 2014 International Society of Urological Pathology (ISUP) consensus conference on gleason grading of prostatic carcinoma: definition of grading patterns and proposal for a new grading system. Am J Surg Pathol. 2016;40(2):244–252. doi:10.1097/PAS.0000000000000530
8. Neuhaus J, Schiffer E, von Wilcke P, et al. Seminal plasma as a source of prostate cancer peptide biomarker candidates for detection of indolent and advanced disease. PLoS One. 2013;8(6):e67514. doi:10.1371/journal.pone.0067514
9. Gillies RJ, Kinahan PE, Hricak H. Radiomics: images are more than pictures, they are data. Radiology. 2016;278(2):563–577. doi:10.1148/radiol.2015151169
10. Liu LT, Chen QY, Tang LQ, et al. Advanced-stage nasopharyngeal carcinoma: restaging system after neoadjuvant chemotherapy on the basis of MR imaging determines survival. Radiology. 2017;282(1):171–181. doi:10.1148/radiol.2016152540
11. Lin J, Xie G, Liao G, et al. Prognostic value of 18F-FDG-PET/CT in patients with nasopharyngeal carcinoma: a systematic review and meta-analysis. Oncotarget. 2017;8(20):33884–33896. doi:10.18632/oncotarget.13934
12. Mayerhoefer ME, Materka A, Langs G, et al. Introduction to Radiomics. J Nucl Med. 2020;61(4):488–495. doi:10.2967/jnumed.118.222893
13. Huynh E, Coroller TP, Narayan V, et al. Associations of radiomic data extracted from static and respiratory-gated CT scans with disease recurrence in lung cancer patients treated with SBRT. PLoS One. 2017;12(1):e0169172. doi:10.1371/journal.pone.0169172
14. Li T, Sun L, Li Q, et al. Development and validation of a radiomics nomogram for predicting clinically significant prostate cancer in PI-RADS 3 lesions. Front Oncol. 2021;11:825429. doi:10.3389/fonc.2021.825429
15. Jing G, Xing P, Li Z, et al. Prediction of clinically significant prostate cancer with a multimodal MRI-based radiomics nomogram. Front Oncol. 2022;12:918830. doi:10.3389/fonc.2022.918830
16. Pepe P, Pennisi M. Should 68Ga-PSMA PET/CT Replace CT and bone scan in clinical staging of high-risk prostate cancer? Anticancer Res. 2022;42(3):1495–1498. doi:10.21873/anticanres.15621
17. Pepe P, D’Urso D, Garufi A, et al. Multiparametric MRI Apparent Diffusion Coefficient (ADC) accuracy in diagnosing clinically significant prostate cancer. Vivo. 2017;31(3):415–418. doi:10.21873/invivo.11075
18. Huang YQ, Liang CH, He L, et al. Development and validation of a radiomics nomogram for preoperative prediction of lymph node metastasis in colorectal cancer. J Clin Oncol. 2016;34(18):2157–2164. doi:10.1200/JCO.2015.65.9128
19. Li H, Zhu Y, Burnside ES, et al. MR imaging radiomics signatures for predicting the risk of breast cancer recurrence as given by research versions of mammaprint, oncotype DX, and PAM50 gene assays. Radiology. 2016;281(2):382–391. doi:10.1148/radiol.2016152110
20. Dong D, Tang L, Li ZY, et al. Development and validation of an individualized nomogram to identify occult peritoneal metastasis in patients with advanced gastric cancer. Ann Oncol. 2019;30(3):431–438. doi:10.1093/annonc/mdz001
21. Min X, Li M, Dong D, et al. Multi-parametric MRI-based radiomics signature for discriminating between clinically significant and insignificant prostate cancer: cross-validation of a machine learning method. Eur J Radiol. 2019;115:16–21. doi:10.1016/j.ejrad.2019.03.010
22. Zhang Y, Chen W, Yue X, et al. Development of a novel, multi-parametric, MRI-based radiomic nomogram for differentiating between clinically significant and insignificant prostate cancer. Front Oncol. 2020;10:888. doi:10.3389/fonc.2020.00888
23. Niu XK, Chen ZF, Chen L, Li J, Peng T, Li X. Clinical application of biparametric MRI texture analysis for detection and evaluation of high-grade prostate cancer in zone-specific regions. AJR Am J Roentgenol. 2018;210(3):549–556. doi:10.2214/AJR.17.18494
24. Nketiah G, Elschot M, Kim E, et al. T2-weighted MRI-derived textural features reflect prostate cancer aggressiveness: preliminary results. Eur Radiol. 2017;27(7):3050–3059. doi:10.1007/s00330-016-4663-1
25. Fan Y, Hua M, Mou A, et al. Preoperative noninvasive radiomics approach predicts tumor consistency in patients with acromegaly: development and multicenter prospective validation. Front Endocrinol. 2019;10:403. doi:10.3389/fendo.2019.00403
26. Yip SSF, Liu Y, Parmar C, et al. Associations between radiologist-defined semantic and automatically computed radiomic features in non-small cell lung cancer. Sci Rep. 2017;7(1):3519. doi:10.1038/s41598-017-02425-5
27. Jiang W, Wang S, Wan J, et al. Association of the collagen signature with pathological complete response in rectal cancer patients. Cancer Sci. 2022;113(7):2409–2424. doi:10.1111/cas.15385
28. Su Y, Lu C, Zheng S, et al. Precise prediction of the sensitivity of platinum chemotherapy in SCLC: establishing and verifying the feasibility of a CT-based radiomics nomogram. Front Oncol. 2023;13:1006172. doi:10.3389/fonc.2023.1006172
29. Du R, Lee VH, Yuan H, et al. Radiomics model to predict early progression of nonmetastatic nasopharyngeal carcinoma after intensity modulation radiation therapy: a multicenter study. Radiol Artif Intell. 2019;1(4):e180075. doi:10.1148/ryai.2019180075
30. Molina-Garcia D, Garcia-Vicente AM, Perez-Beteta J, et al. Intratumoral heterogeneity in (18)F-FDG PET/CT by textural analysis in breast cancer as a predictive and prognostic subrogate. Ann Nucl Med. 2018;32(6):379–388. doi:10.1007/s12149-018-1253-0
 © 2023 The Author(s). This work is published and licensed by Dove Medical Press Limited. The
full terms of this license are available at https://www.dovepress.com/terms
and incorporate the Creative Commons Attribution
- Non Commercial (unported, 3.0) License.
By accessing the work you hereby accept the Terms. Non-commercial uses of the work are permitted
without any further permission from Dove Medical Press Limited, provided the work is properly
attributed. For permission for commercial use of this work, please see paragraphs 4.2 and 5 of our Terms.
© 2023 The Author(s). This work is published and licensed by Dove Medical Press Limited. The
full terms of this license are available at https://www.dovepress.com/terms
and incorporate the Creative Commons Attribution
- Non Commercial (unported, 3.0) License.
By accessing the work you hereby accept the Terms. Non-commercial uses of the work are permitted
without any further permission from Dove Medical Press Limited, provided the work is properly
attributed. For permission for commercial use of this work, please see paragraphs 4.2 and 5 of our Terms.
Recommended articles
Development and Validation of an MRI Radiomics-Based Signature to Predict Histological Grade in Patients with Invasive Breast Cancer
Wang S, Wei Y, Li Z, Xu J, Zhou Y
Breast Cancer: Targets and Therapy 2022, 14:335-342
Published Date: 14 October 2022
Radiomics Nomogram Model Based on TOF-MRA Images: A New Effective Method for Predicting Microaneurysms
Kong D, Li J, Lv Y, Wang M, Li S, Qian B, Yu Y
International Journal of General Medicine 2023, 16:1091-1100
Published Date: 27 March 2023
A Comprehensive Model Based on Dynamic Contrast-Enhanced Magnetic Resonance Imaging Can Better Predict the Preoperative Histological Grade of Breast Cancer Than a Radiomics Model
Wu Y, Pan W, Wang L, Pan W, Zhang H, Jin S, Wu X, Liu A, Xin E, Ji W
Breast Cancer: Targets and Therapy 2023, 15:709-720
Published Date: 18 October 2023
Nomogram Based on Super-Resolution Ultrasound Images Outperforms in Predicting Benign and Malignant Breast Lesions
Yang L, Ma Z
Breast Cancer: Targets and Therapy 2023, 15:867-878
Published Date: 2 December 2023
Application of Interpretable Machine Learning Models Based on Ultrasonic Radiomics for Predicting the Risk of Fibrosis Progression in Diabetic Patients with Nonalcoholic Fatty Liver Disease
Meng F, Wu Q, Zhang W, Hou S
Diabetes, Metabolic Syndrome and Obesity 2023, 16:3901-3913
Published Date: 2 December 2023