Back to Journals » Journal of Inflammation Research » Volume 19
Lactate-Modified Prognostic Nutritional Index (LPNI) and Its Association with ICU Mortality in Patients with Sepsis: A Retrospective Cohort Study
Authors Li X, Qian S, Chen H, Yuan X, Xia X, Gao X, Chen G ![]()
Received 23 February 2026
Accepted for publication 13 May 2026
Published 28 May 2026 Volume 2026:19 604786
DOI https://doi.org/10.2147/JIR.S604786
Checked for plagiarism Yes
Review by Single anonymous peer review
Peer reviewer comments 2
Editor who approved publication: Dr Xin Du
Xiaoqing Li, Shuyuan Qian, Hui Chen, Xueyan Yuan, Xinyu Xia, Xiaohui Gao, Guanjie Chen
Jiangsu Provincial Key Laboratory of Critical Care Medicine, Zhongda Hospital, Southeast University, Nanjing, Jiangsu, 210009, People’s Republic of China
Correspondence: Guanjie Chen, Jiangsu Provincial Key Laboratory of Critical Care Medicine, Zhongda Hospital, Southeast University, 87 Dingjiaqiao, Gulou District, Nanjing, Jiangsu, 210009, People’s Republic of China, Email [email protected]
Background: Systemic inflammation and the resulting hypercatabolism in sepsis critically drive malnutrition and metabolic dysregulation, significantly worsening clinical outcomes. However, existing nutritional assessment tools are not sepsis-specific, and their comparative prognostic performance in this population remains unclear. This study aimed to compare current tools and develop a novel, sepsis-specific biomarker that integrates inflammatory, nutritional, and metabolic dimensions to optimise risk stratification.
Methods: In this retrospective cohort study, data from 1915 sepsis patients admitted to a tertiary ICU between January 2021 and May 2025 were analysed. Nutritional risk was assessed using the modified nutrition risk in critically ill (mNUTRIC) score, prognostic nutritional index (PNI), nutritional risk index (NRI), and controlling nutritional status (CONUT) score. Prognostic performance for ICU mortality was evaluated using receiver operating characteristic (ROC) curves, Kaplan–Meier survival analysis, and Cox regression. Leveraging machine learning (LASSO regression), key variables were screened to modify the PNI, resulting in the development of the Lactate-Modified Prognostic Nutritional Index (LPNI).
Results: Among conventional indices, mNUTRIC demonstrated the highest prognostic accuracy (AUC = 0.725, 95% CI 0.699– 0.751), followed by PNI (AUC = 0.687, 95% CI 0.660– 0.713). The novel LPNI, superior discriminative ability (AUC = 0.754, 95% CI 0.729– 0.780) and served as a robust independent risk factor for ICU mortality in the total cohort (HR = 3.25, 95% CI 2.36– 4.48, p < 0.001), as well as in septic shock (HR = 2.40, 95% CI 1.85– 3.10, p < 0.001) and non-shock subgroups (HR = 2.60, 95% CI 1.49– 4.51, p < 0.001). Distinct from the broad risk classification of traditional tools, the LPNI identified a specific high-risk inflammatory-metabolic-nutritional phenotype in 18.8% of patients. This severe phenotype was significantly more prevalent in patients with septic shock compared to those without (24.3% vs 9.0%, p < 0.001). Sensitivity analysis and internal validation confirmed the stability of these findings.
Conclusion: The LPNI is an objective composite biomarker that integrates inflammatory, nutritional, and metabolic dimensions. It is independently associated with ICU mortality in sepsis patients, including those with or without septic shock. A newly developed online calculator based on the LPNI is provided to facilitate its potential bedside application; however, further prospective validation of its clinical utility is warranted.
Keywords: sepsis, systemic inflammation, inflammatory-metabolic-nutritional phenotype, lactate-modified prognostic nutritional index, risk stratification, biomarker
Introduction
Sepsis is life-threatening organ dysfunction caused by a dysregulated host response to infection.1 It progresses rapidly, is difficult to diagnose, and lacks specific therapies, leading to high mortality.2,3 In 2021, sepsis contributed to 31.5% of global deaths.4 Nutritional status critically determines outcomes, with malnutrition affecting up to 75% of critically ill patients.5,6 In sepsis, intense systemic inflammation drives a hypercatabolic state, causing severe protein depletion and negative nitrogen balance. These inflammatory and metabolic disturbances impair immune defence, exacerbate organ damage, and increase mortality.7–9 Thus, accurate assessment of nutritional and metabolic risk is essential for guiding precise, individualised nutrition support.10
Several nutritional assessment tools have been applied to predict prognosis in critically ill patients, including the nutrition risk in critically ill (NUTRIC) score, modified NUTRIC (mNUTRIC) score, prognostic nutritional index (PNI), nutritional risk index (NRI), and controlling nutritional status (CONUT) score.11 Recent head-to-head comparisons in patients with sepsis have shown that the mNUTRIC score generally exhibits superior predictive stability for ICU mortality compared with the PNI and CONUT; however, this advantage is attenuated and no longer statistically significant after limited multivariable adjustment.12 Nevertheless, each of these tools has significant limitations when applied specifically to the septic population. The mNUTRIC score incorporates illness severity measures rather than direct nutritional parameters and relies on subjectively reported comorbidity data (the original version additionally requires interleukin-6, which is not routinely measured in clinical practice).13–15 The PNI is based on serum albumin and lymphocyte count, but both components are acute-phase reactants; in sepsis, abnormalities in the PNI largely reflect inflammatory burden rather than true nutritional depletion.16,17 The NRI depends on current weight relative to ideal body weight, yet weight is often distorted by fluid resuscitation-induced oedema in septic patients.18 The CONUT score adds total cholesterol, which can be disrupted by systemic inflammation, potentially reducing its specificity for malnutrition in hyperinflammatory states.19,20
In summary, existing tools not only commonly conflate nutritional status with illness severity or acute inflammation but, more importantly, fail to incorporate the metabolic features of sepsis, particularly tissue hypoperfusion and hyperlactatemia. These are hallmark features of septic shock and strong independent predictors of mortality.21 This omission represents a critical drawback: patients with septic shock experience a fundamentally different metabolic stress response compared to those without shock, and an assessment tool that ignores this distinction cannot achieve accurate risk stratification across the sepsis spectrum.22 We hypothesised that a modified nutritional index incorporating a metabolic marker would show superior discriminative ability for mortality in sepsis compared to conventional indices.
In light of this, we investigated the association between various nutritional risk assessment indices and mortality in patients with sepsis and compared their prognostic performance. Based on the specific inflammatory, nutritional, and metabolic characteristics of sepsis, we screened for key modification variables to refine existing nutritional indices. Furthermore, given the disease’s pathophysiological heterogeneity, we evaluated the efficacy of these indicators in both septic shock and non-shock populations. By addressing the current knowledge gap, this study aims to provide a more precise and clinically practical tool for risk stratification and nutritional management in sepsis.
Materials and Methods
Study Design and Participants
This retrospective cohort study enrolled patients with sepsis who were admitted to the general intensive care unit of a tertiary teaching hospital in Nanjing between January 2021 and May 2025. The inclusion criteria were: (1) age ≥ 18 years; (2) fulfilment of the Sepsis-3.0 diagnostic criteria;23 and (3) availability of complete medical and follow-up records. Exclusion criteria comprised an ICU stay ≤ 24 hours or pregnancy/lactation status. A flowchart detailing patient screening is provided in Additional file 1: Figure S1.
The study was approved by the Ethics Committee of Zhongda Hospital, Southeast University, and conducted in accordance with the Declaration of Helsinki. The requirement for written informed consent was waived due to the retrospective use of anonymised clinical data. All patient information was maintained under strict confidentiality. This paper was reported in accordance with the RECORD reporting guidelines.
Patient Characteristics and Outcomes
Baseline data were extracted from electronic medical records within the first 24 hours following sepsis diagnosis. Collected variables included demographic characteristics, severity-of-illness scores (acute physiology and chronic health evaluation II [APACHE II] and sequential organ failure assessment [SOFA]), comorbidities quantified by the charlson comorbidity index(CCI), initial treatment interventions (eg, mechanical ventilation, extracorporeal membrane oxygenation [ECMO], continuous renal replacement therapy [CRRT]), and routine laboratory parameters. Patients were stratified according to Sepsis-3.0 criteria into septic shock and sepsis without shock.
The primary outcome was ICU mortality, defined as death from any cause before discharge from the intensive care unit. Secondary outcomes recorded were ICU length of stay and 28-d ICU-free days; the latter was calculated as the number of days alive and outside the ICU within the 28 days following admission. All data were anonymised and processed in compliance with the approved ethical protocol.
Malnutrition Assessment
Nutritional risk was assessed retrospectively using four validated tools. The mNUTRIC score was extracted directly from medical records; this score incorporates age, APACHE II score, SOFA score, number of comorbidities, and days of hospital stay before ICU admission, with a score ≥ 5 indicating high nutritional risk.15 The PNI was calculated as: albumin (g/L)+5×lymphocyte count (×109/L). The NRI was computed as: 1.519 × albumin (g/L) + 41.7×(current weight/ideal body weight), where ideal body weight (kg) was estimated as: [height (cm) – 80] × 0.7 for men and [height (cm) – 70] × 0.6 for women. The CONUT score was based on the albumin, total cholesterol, and lymphocyte count. Albumin levels (g/L) were scored as follows: ≥35 (0), 30–34 (2), 25–29 (4), and <25(6); total cholesterol (mmol/L) was scored as: >4.65 (0), 3.62–4.65 (1), 2.59–3.61 (2), and <2.59 (3); lymphocyte count (×109/L) was scored as: ≥1.60 (0), 1.20–1.59 (1), 0.80–1.19 (2), and <0.80 (3). The scores for albumin, lymphocyte, and total cholesterol are then combined.24
Statistical Analysis
Continuous variables were expressed as mean±standard deviation (±SD) or median (interquartile range). Continuous variables with normal distribution were evaluated using Student’s t-test, while continuous variables with non-normal distribution were tested using the Mann–Whitney U-test. Categorical variables were presented as frequencies or percentages, and χ2 tests or Fisher’s exact tests were applied. Continuous nutritional indicators were dichotomised using optimal cut-offs determined by maximally selected rank statistics to ensure the highest statistical discrimination for mortality risk. The discriminative ability of different nutritional assessment indices for ICU mortality was evaluated using receiver operating characteristic (ROC) curves and the area under the curve (AUC). Formal comparisons of ROC curves were performed using the DeLong test. The least absolute shrinkage and selection operator (LASSO) regression was employed to screen variables. A nomogram was further constructed based on the screened variables, and a newly modified indicator was finally developed by combining the nomogram’s mathematical calculations with its weighted scores. The sample size was justified by the event-per-variable (EPV) criterion. With 423 ICU deaths and 11 candidate variables in the full model, the EPV was approximately 38.5, which met the rigorous statistical requirement of EPV ≥ 10 and guaranteed stable model performance.25 Restricted cubic spline (RCS) plots were used to explore the associations between the modified malnutrition indicators and ICU mortality. Kaplan–Meier curves and Log rank tests were used to compare survival between the groups. Univariate and multivariate Cox regression analyses were conducted to analyse the independent prognostic value of nutritional indicators for ICU mortality in sepsis patients. Collinearity diagnostics were performed to ensure the stability of the model. The entire dataset was randomly split into training (70%) and test (30%) subsets to conduct internal validation of the model. Statistical significance was established as a two-sided p-value < 0.05. All statistical analyses were performed using R version 4.5.2.
Results
Patient Baseline Characteristics and Performance of Conventional Nutritional Indices
A total of 1915 patients with sepsis were included. The mean age was 65.70 ± 16.44 years, with a predominance of male patients (65.69%). The respiratory tract was the most common infection source (52.53%). The overall ICU mortality rate was 22.09%. Patients with septic shock (n = 1225) had significantly higher mortality than those without shock (26.04% vs 15.07%, p < 0.001), along with higher APACHE II and SOFA scores, lower albumin and total cholesterol levels, and higher lactate levels (all p < 0.001). Detailed baseline characteristics are shown in Table 1.
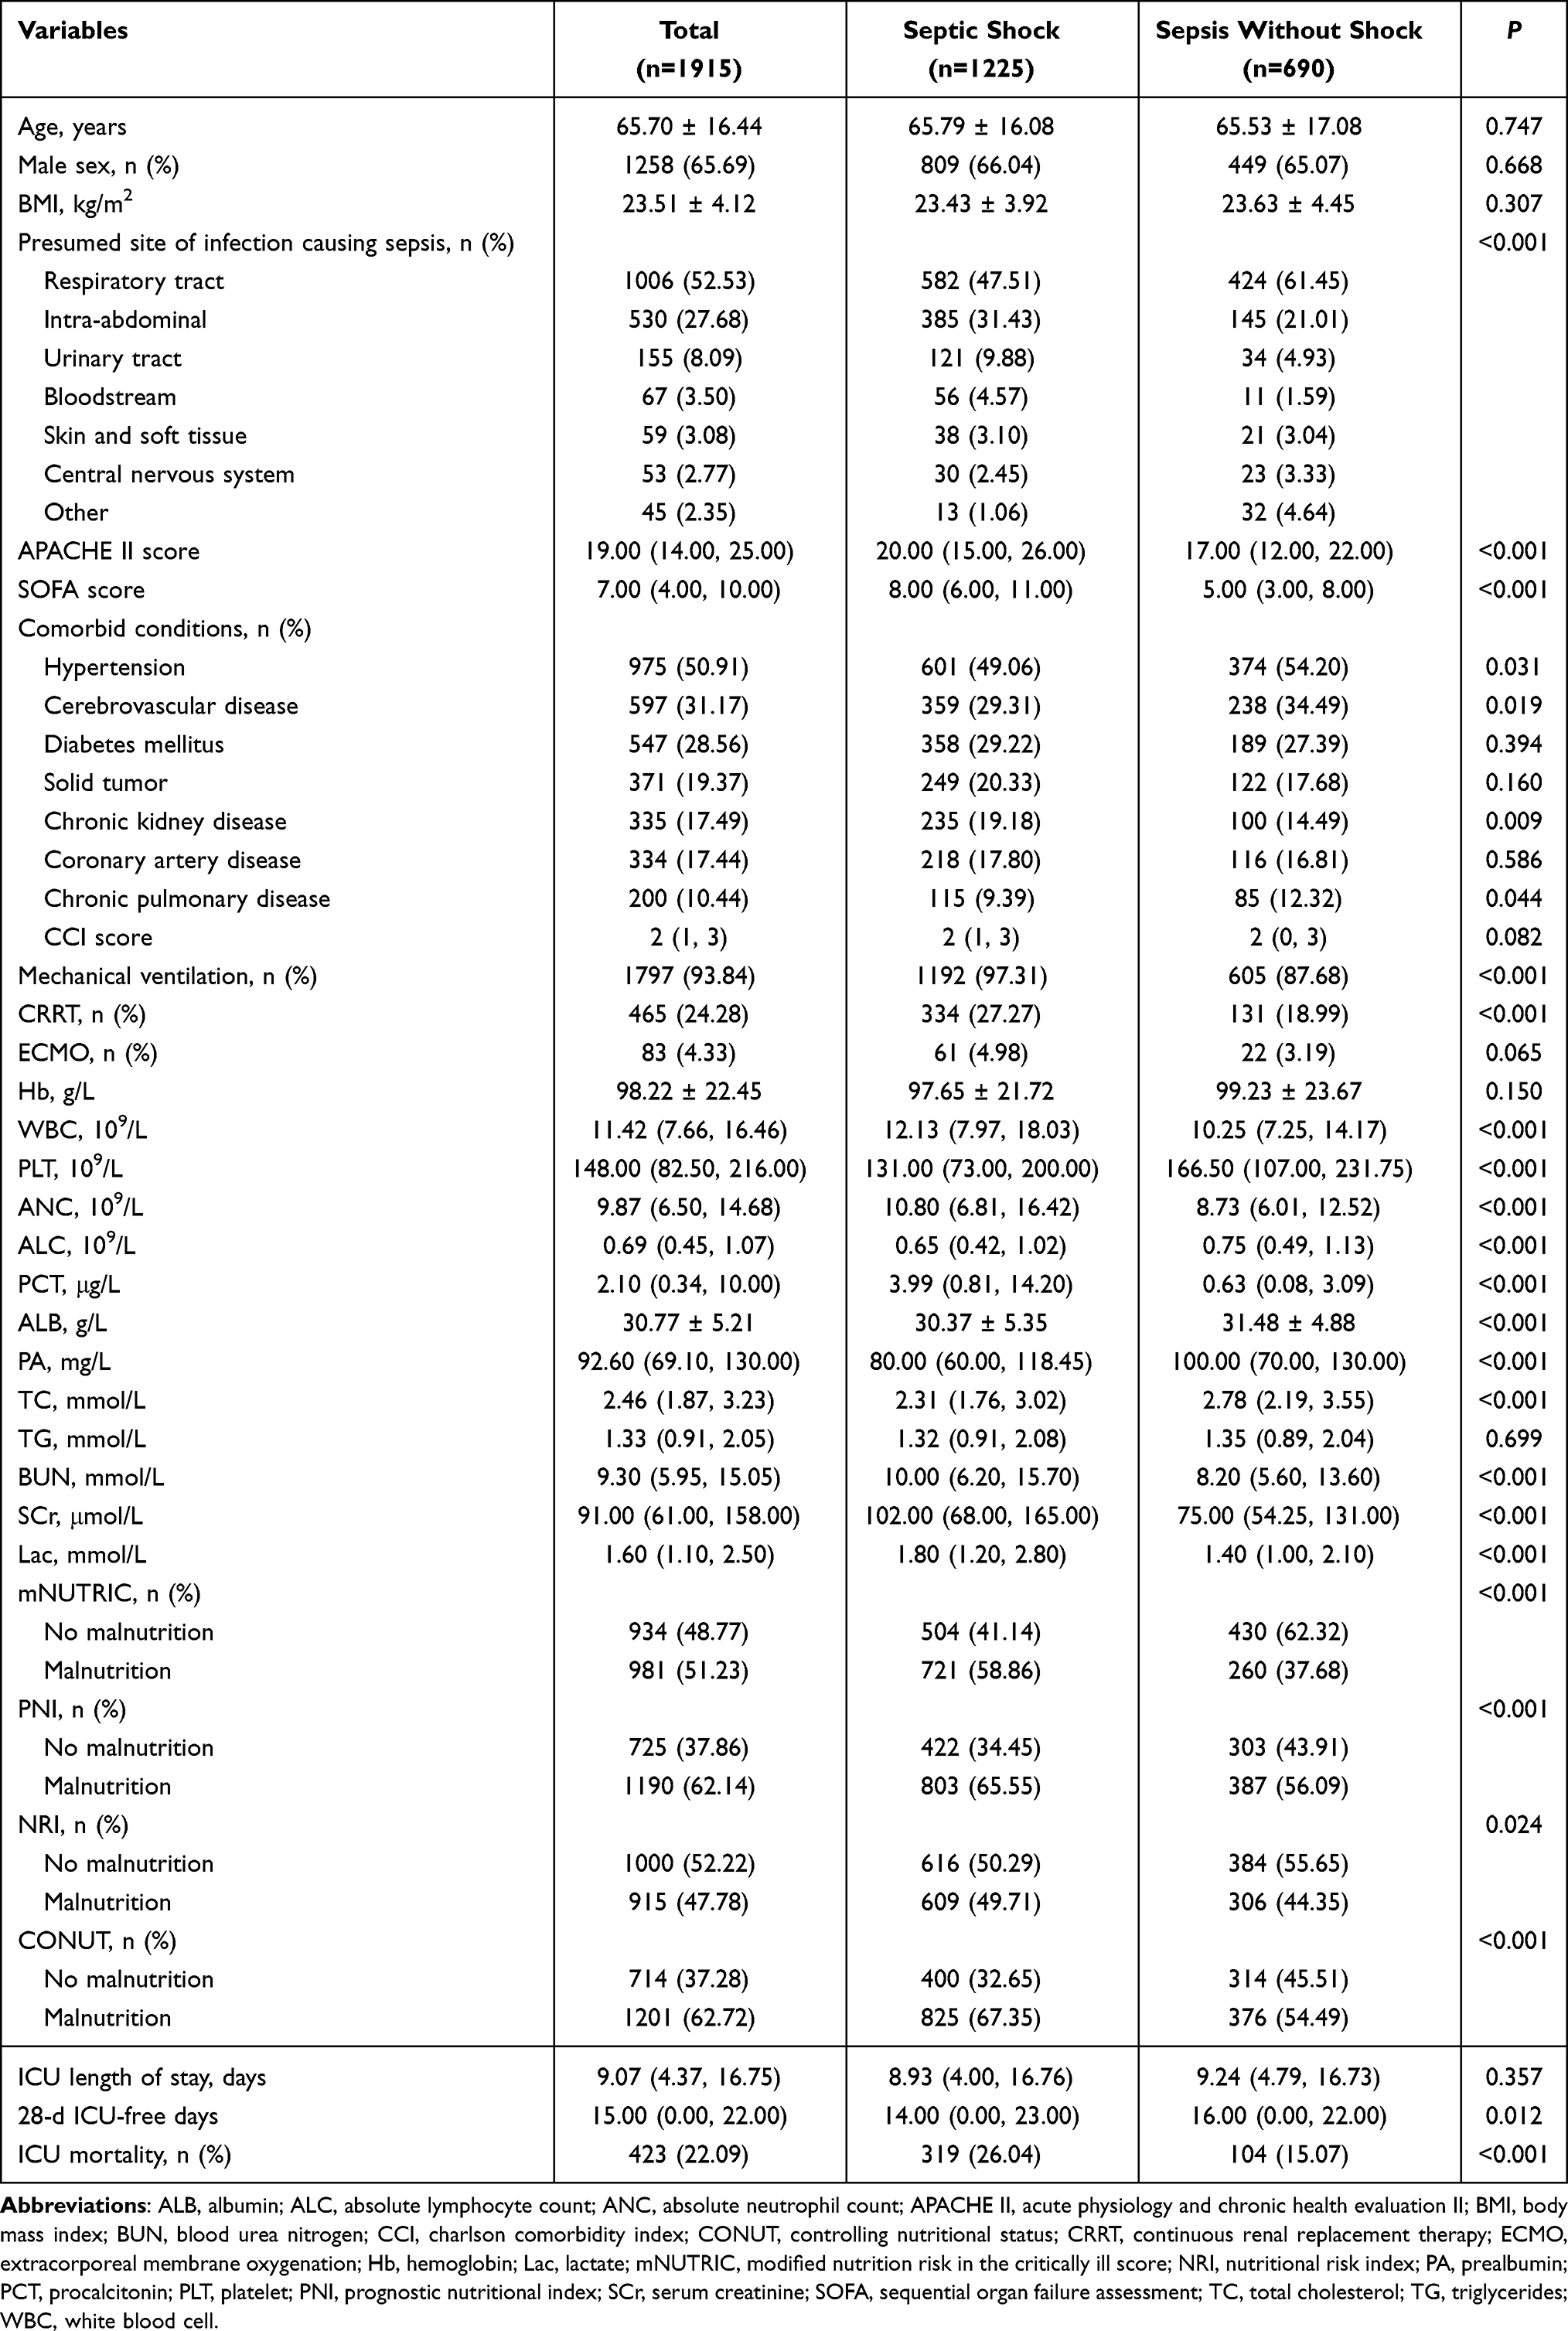 |
Table 1 The Baseline Characteristics of the Study Population |
The RCS analysis of the relationship between nutritional indicators (PNI, NRI, CONUT) and ICU mortality is shown in Additional file 1: Figure S2. Based on the maximally selected rank statistics, the optimal cut-off values for identifying high-risk malnutrition were determined as 36.65 for PNI, 91.38 for NRI, and 6 for CONUT (Additional file 1: Figure S3). The prevalence of malnutrition varied substantially across tools: 51.23% for mNUTRIC, 62.14% for PNI, 47.78% for NRI, and 62.72% for CONUT. The Venn diagram (Additional file 1: Figure S4) illustrates the overlap of malnutrition diagnoses among the four indices, revealing that only 421 patients (21.98%) were concurrently identified as malnourished by all criteria. The mNUTRIC score demonstrated the highest AUC among conventional indices for discriminating ICU mortality (AUC = 0.725, 95% CI 0.699–0.751), followed by PNI (0.687), NRI (0.649), and CONUT (0.611) (Figure 1). Kaplan‑Meier analyses showed that patients identified as malnourished by any of these four tools had significantly lower survival probabilities in the total cohort and in both septic shock and non‑shock subgroups (all p < 0.001, Additional file 1: Figures S5–S8).
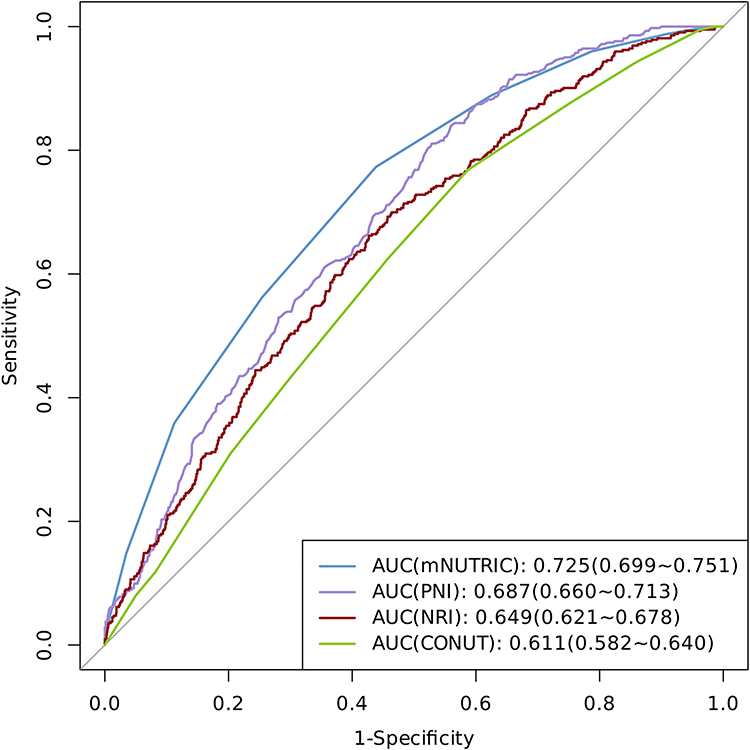 |
Figure 1 ROC analysis of nutrition-related indicators for discriminating ICU mortality in patients with sepsis. |
Construction of LPNI Based on PNI
Although mNUTRIC exhibited the highest prognostic accuracy, its clinical utility is often limited by its complexity and reliance on subjective parameters. Conversely, while PNI is objective and ranked second in prognostic performance. To further improve the prognostic performance of the PNI, we employed LASSO regression to screen for additional critical laboratory markers related to inflammation, nutrition, and metabolism from 11 candidate variables, including haemoglobin, white blood cell, platelet, absolute neutrophil count, procalcitonin, prealbumin, total cholesterol, triglyceride, lactate, blood urea nitrogen, and serum creatinine. Lactate was identified as the variable with the highest positive coefficient (0.323), indicating a strong association with mortality (Additional file 1: Figure S9).
Consequently, we constructed a novel index, the Lactate-modified PNI (LPNI), by integrating lactate into the PNI framework. The quantitative formula was mathematically derived from the weighted scores assigned to the core variables in the prognostic nomogram (Figure 2A). Specifically, for the PNI component, a value of 70 corresponded to 0 points, while a value of 5 corresponded to 65 points, implying a linear relationship where a 1-unit decrease in PNI resulted in a 1-point increase (PNIpoints=70-PNI). Regarding the lactate component, a level of 0 mmol/L corresponded to 0 points, while 35 mmol/L corresponded to 100 points. Thus, each 1 mmol/L increase in lactate contributed approximately 2.86 points (Lacpoints=2.86*Lac). The final LPNI index was established by summing these linear equations: LPNI = 70–Albumin (g/L)–5 *Lymphocyte (109/L) + 2.86* Lactate (mmol/L). To facilitate its application in clinical settings, we have developed an online calculator based on the nomogram model. By entering the necessary data, users can instantly obtain an LPNI score from the calculator, which also assesses the presence or absence of malnutrition and stratifies mortality risk (Figure 2B: https://tomietang.github.io/lpni-calculator/).
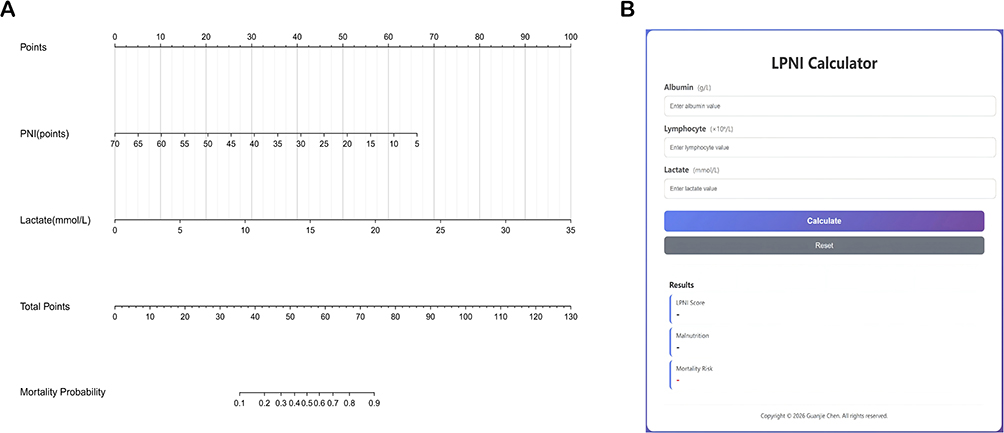 |
Figure 2 Nomogram and calculator for discriminating ICU mortality of patients with sepsis. Notes: (A) Nomogram; (B) LPNI calculator. |
Prognostic Performance and Validation of LPNI
Using an optimal cut‑off value of 46.98 determined by maximally selected rank statistics (Figure 3), the overall prevalence of malnutrition diagnosed by LPNI was 18.8% (360/1915). Notably, the prevalence was significantly higher in the septic shock group than in the non‑shock sepsis group (24.3% [298/1225] vs 9.0% [62/690]; χ2 = 68.05, p < 0.001). Patients classified as malnourished by LPNI had higher APACHE II and SOFA scores and a higher proportion of septic shock (all p < 0.001, Additional file 1: Table S1).
 |
Figure 3 Association of LPNI with ICU mortality and its prognostic cutoff analysis in patients with sepsis. Notes: (A) Restricted cubic spline curve depicting the dose-response relationship between LPNI and ICU mortality risk; (B) Maximally selected rank statistics identifying the optimal LPNI cutoff. |
The LPNI achieved an area under the ROC curve (AUC) of 0.754 (95% CI: 0.729–0.780) for discriminating ICU mortality, significantly outperforming the original PNI, lactate, absolute lymphocyte count, albumin, and the conventional SOFA and APACHE II severity scores (Figure 4). As shown in Table 2, the DeLong test confirmed that the improvement in prognostic performance over all these markers was statistically significant (all p < 0.001), except for APACHE II score (p=0.124), for which the difference did not reach significance. Kaplan‑Meier survival curves demonstrated that, in the total population as well as in the septic shock and non‑shock subgroups, patients with a high LPNI score (≥46.98) had significantly worse survival (all p < 0.001, Figure 5).
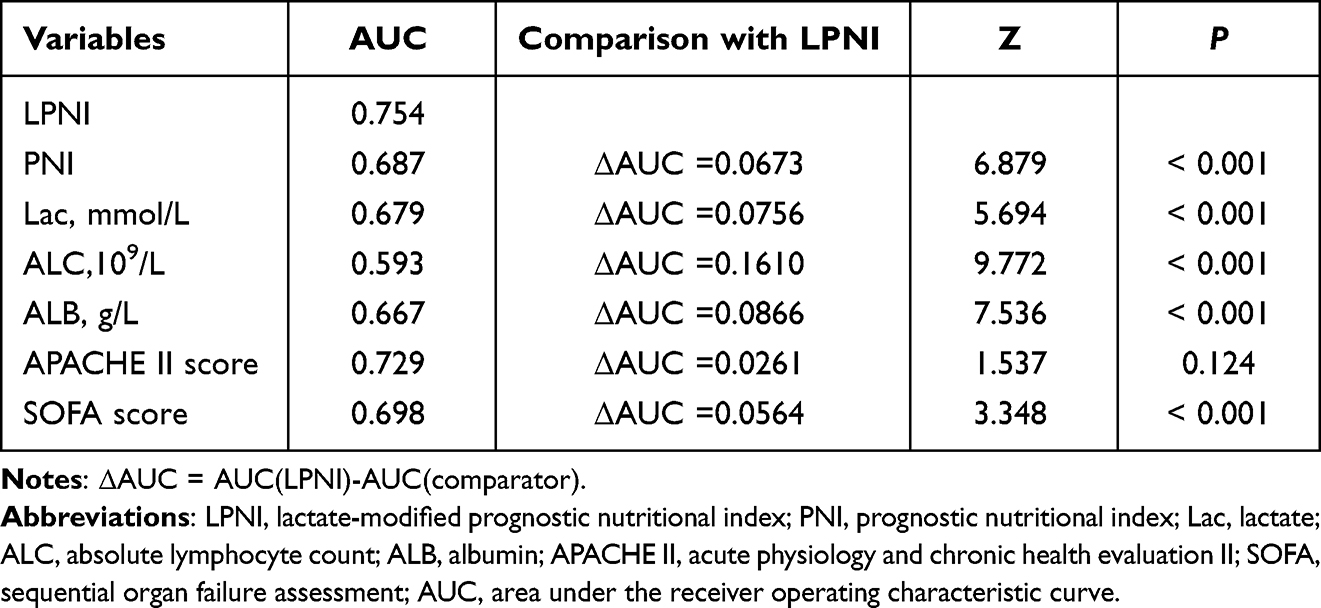 |
Table 2 Comparison of Prognostic Performance of Different Indicators with LPNI (DeLong Test) |
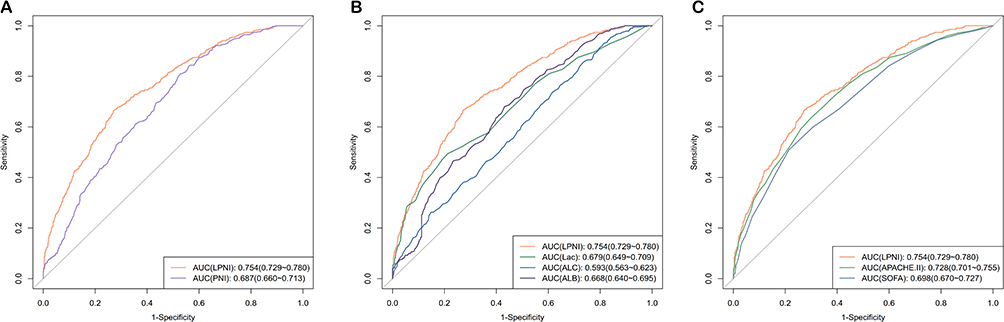 |
Figure 4 ROC analysis of LPNI and PNI for discriminating ICU mortality in patients with sepsis. Notes: (A) Comparison of LPNI with PNI; (B) Comparison of LPNI with Lac, ALB, and ALC; (C) Comparison of LPNI with APACHE II and SOFA scores. |
 |
Figure 5 The Kaplan–Meier curves of sepsis patients with malnutrition and no malnutrition based on the LPNI index. Notes: (A) total population; (B) patients with septic shock; (C) patients with sepsis without shock. |
Sensitivity analysis excluding patients who died within 72 h of admission confirmed that LPNI remained the most effective discriminator (AUC = 0.726), outperforming all other indices (Additional file 1: Figure S10). Internal validation by randomly splitting the dataset into a training cohort (70%) and a test cohort (30%) yielded consistent results: LPNI showed the highest AUC in both the training (0.751) and test (0.763) cohorts, supporting good model stability (Additional file 1: Figure S11).
Relationship Between Nutritional Indicators and Mortality
In univariate Cox regression (Model a, unadjusted), all five indices were significantly associated with ICU mortality in the total population and in both subgroups (all p < 0.001). After multivariable adjustment (Model c), mNUTRIC lost its independent significance in the total cohort (HR = 1.42, 95% CI 0.97–2.07, p = 0.073) and in both subgroups. NRI and CONUT were also not independently prognostic in the shock subgroups. By comparison, LPNI and PNI remained statistically significant independent risk factors for ICU mortality after full covariate adjustment. Of particular note, LPNI consistently served as an independent risk factor for ICU mortality in the total population (HR = 3.25, 95% CI 2.36–4.48, p < 0.001), septic shock patients (HR = 2.40, 95% CI 1.85–3.10, p < 0.001), and non‑shock patients (HR = 2.60, 95% CI 1.49–4.51, p < 0.001) (Table 3).
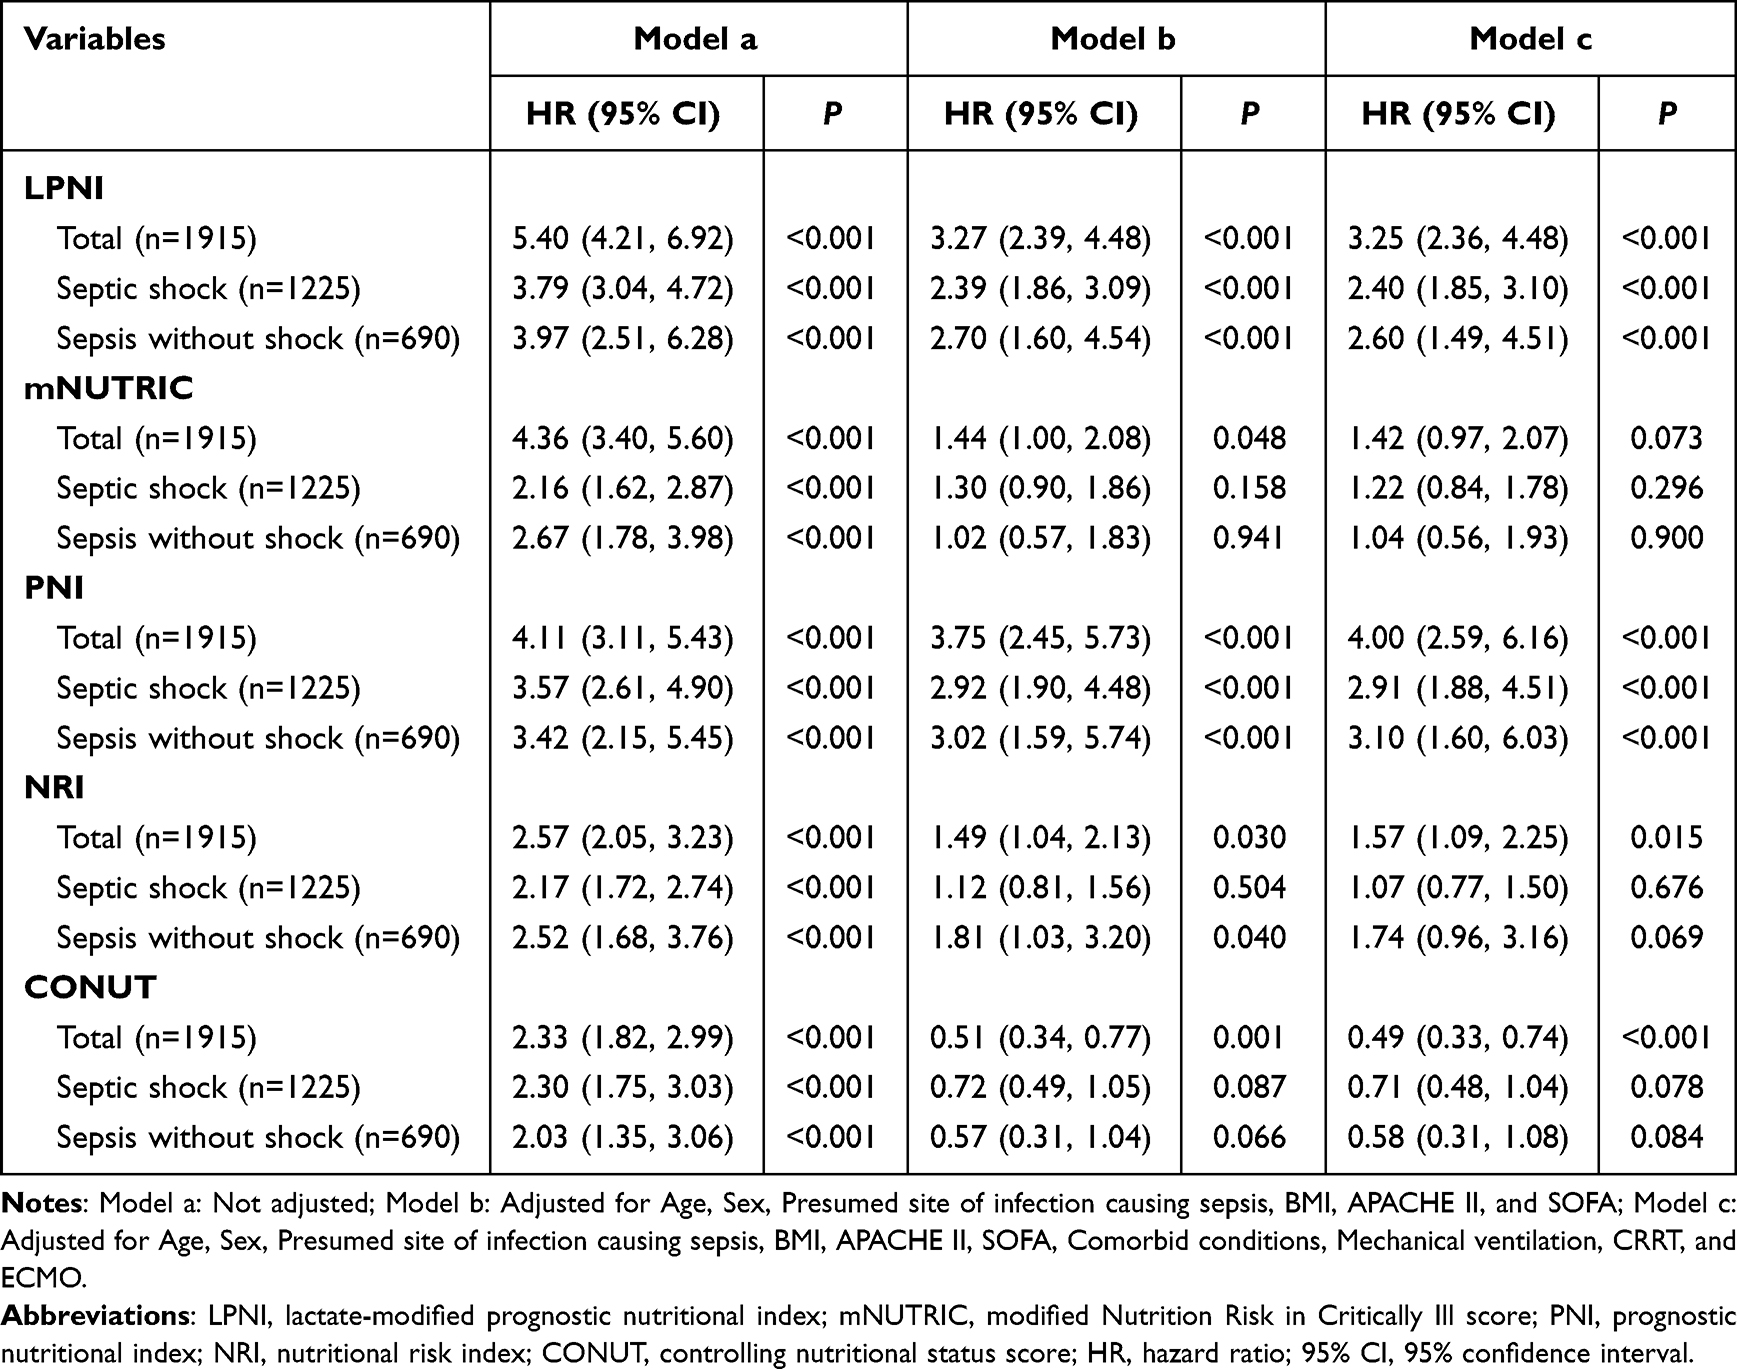 |
Table 3 The Univariate and Multivariate Cox Analysis for the Associations Between 5 Nutrition-Related Indicators and ICU Mortality in Patients with Sepsis |
Discussion
In this study, we developed a novel modified index, LPNI, based on the PNI, which integrates. The results showed that LPNI significantly outperformed all conventional nutritional indices in discriminating ICU mortality (AUC = 0.754). However, it is important to note that the prognostic performance of LPNI did not reach statistical significance when compared with the classic critical illness severity score APACHE II (DeLong test, p = 0.124). Nevertheless, LPNI offers distinct practical advantages: it is derived entirely from routine laboratory tests and can be rapidly calculated at the bedside. Unlike traditional disease severity scores, LPNI directly reflects clinically actionable nutritional and metabolic abnormalities, making it an effective complementary tool for nutritional assessment and management. Furthermore, LPNI was an independent risk factor for mortality in both septic shock and non‑shock sepsis patients, representing a robust, stable, objective, and convenient prognostic indicator for clinical evaluation.
A striking finding was the marked variation in malnutrition prevalence, ranging from >60% with PNI/CONUT to only 18.8% with LPNI. This discrepancy highlights a fundamental difference in construct validity. This discrepancy reflects fundamental differences in tool construction. The PNI and CONUT are heavily influenced by acute inflammation, and weight‑based indicators like the NRI (47.78%) are confounded by oedema. These structural flaws lead to overestimation of malnutrition in sepsis. In contrast, although LPNI also incorporates albumin and lymphocyte count, its malnutrition prevalence is only 18.8%. This seemingly paradoxical phenomenon can be explained by the unique modulating role of lactate.26 Even if the PNI is low, a normal lactate level may keep the LPNI below the diagnostic threshold. Only when nutritional‑immunological deficits are accompanied by concurrent metabolic stress or tissue hypoperfusion (elevated lactate) does the LPNI exceed the cut‑off. Thus, LPNI identifies patients who suffer from both baseline physiological vulnerability and acute metabolic derangement, rather than those with isolated nutritional abnormalities or inflammation alone. Consequently, LPNI serves as a precision‑based assessment tool that accurately screens the high‑risk subgroup with the greatest mortality risk, rather than a non‑specific screening instrument, thereby facilitating stratified management of critically ill patients and prioritisation of healthcare resources. Nevertheless, the consistently higher malnutrition rates observed in septic shock patients across all assessment metrics, which align with prior studies, underscore the synergistic impact of cytokine-driven hypercatabolism and circulatory failure-induced intestinal hypoperfusion on host nutrient reserves.27,28
After incorporating lactate into the PNI framework, the AUC of the model significantly increased from 0.687 to 0.754. In sepsis, lactate is not merely a byproduct of hypoxia—it is a comprehensive indicator integrating tissue hypoperfusion, cytokine-driven aerobic glycolysis, and impaired hepatic clearance.29 Elevated lactate signals an acute metabolic crisis accompanied by severe cellular energy stress, which in turn exacerbates protein catabolism and immune dysfunction.30 Mechanistically, lactate functions as a signalling molecule via histone lactylation, an epigenetic modification that reprograms immune cells toward an immunosuppressive phenotype.31 This mechanism synergises with hypoalbuminemia and lymphopenia to create a multilayered biological foundation, which directly endows LPNI with robust and reliable statistical performance. Multivariate analysis revealed that the prognostic value of mNUTRIC was substantially attenuated due to conceptual overlap with critical illness severity scores. By contrast, LPNI remained an independent prognostic factor, offering unique incremental prognostic value and providing a scientifically grounded reference for clinical decision-making.
Beyond its value in risk stratification, the integrated inflammatory‑metabolic‑nutritional phenotype captured by LPNI may offer guidance for individualised nutritional therapy in patients with sepsis. An elevated LPNI score could alert clinicians to differentiate the primary driver of hyperlactatemia—whether it originates from tissue hypoperfusion or stress‑induced aerobic glycolysis—a distinction that may inform the timing and intensity of nutrition support.32 In patients with overt tissue hypoperfusion, enteral feeding should be cautiously withheld to prioritise hemodynamic stabilisation. Once initial hemodynamic stability is achieved, minimal trophic feeding may be considered to preserve gut barrier integrity, with close monitoring for signs of feeding intolerance.33 For patients presenting predominantly with catabolic stress without overt hypoperfusion, a strategy of permissive underfeeding (≤70% of energy targets) may be adopted to mitigate metabolic load while supporting the basal energy requirements for tissue repair.34 However, these clinical suggestions remain speculative at this stage, and their clinical utility should be interpreted with caution. Implementation of LPNI in clinical practice will require prospective, multi‑center external validation, followed by interventional trials to confirm its value.
This study has several limitations. First, its single-center, retrospective design in a Chinese population necessitates validation in independent, multi‑center, and ethnically diverse cohorts to confirm generalizability. Second, the lack of a universally accepted gold standard for diagnosing malnutrition in critically ill patients poses a fundamental challenge for comparative validation. Third, lactate levels in sepsis can be influenced by multiple factors, which we could not fully adjust for, potentially introducing confounding. Fourth, the reliance on a single baseline assessment within 24 h of ICU admission limits insight into the dynamic evolution of nutritional‑metabolic status; future studies with serial measurements are needed to evaluate LPNI trajectories. Finally, the observational design precludes causal inference, although internal validation supports model robustness, prospective external validation is essential before clinical adoption.
Conclusion
This study demonstrates that the LPNI is an integrative tool for risk stratification and prognosis in sepsis. By integrating the crosstalk among inflammatory, nutritional, and metabolic pathways, the LPNI overcomes the limitations of conventional indices and provides enhanced specificity for mortality discrimination. However, the findings are exploratory, and prospective validation in external cohorts is necessary before considering clinical application. If validated, LPNI may offer a simple, objective tool for metabolic‑nutritional risk stratification and for generating hypotheses for future interventional trials.
Abbreviations
ALB, albumin; ALC, absolute lymphocyte count; ANC, absolute neutrophil count; APACHE-II, acute physiology and chronic health evaluation II; AUC, area under the curve; BMI, body mass index; BUN, blood urea nitrogen; CCI, charlson comorbidity index; CI, confidence interval; CONUT, controlling nutritional status; CRRT, continuous renal replacement therapy; ECMO, extracorporeal membrane oxygenation; GBD, Global Burden of Diseases, Injuries, and Risk Factors Study; Hb, hemoglobin; HR, hazard ratio; ICU, intensive care unit; IL-6, interleukin-6; LASSO, least absolute shrinkage and selection operator; LPNI, lactate-modified prognostic nutritional index; mNUTRIC, modified nutrition risk in the critically ill score; NRI, nutritional risk index; NUTRIC, nutrition risk in critically ill; PA, prealbumin; PCT, procalcitonin; PLT, platelet; PNI, prognostic nutritional index; RCS, restricted cubic spline; ROC, receiver operating characteristic curve; SCr, serum creatinine; SD, standard deviation; SOFA, sequential organ failure assessment; TC, total cholesterol; TG, triglycerides; WBC, white blood cell.
Data Sharing Statement
The datasets generated and analyzed during the current study are not publicly available due to patient privacy restrictions, but are available from the corresponding author on reasonable request.
Ethics Approval and Consent to Participate
This study was approved by the Ethics Committee of Zhongda Hospital, Southeast University (Approval Number: 2025ZDSYLL192-P01). The requirement for written informed consent was waived due to the retrospective use of anonymized clinical data. All patient information was maintained under strict confidentiality. This study was conducted in accordance with the Declaration of Helsinki.
Acknowledgments
We appreciate the clinical team for their contributions to data management and the patients involved in this research.
Author Contributions
Xiao Qing Li: Conceptualization, Formal analysis, Investigation, Methodology, Project administration, Funding acquisition, Writing-original draft, Writing-review & editing; Shu Yuan Qian: Data Curation, Software, Validation, Visualization, Funding acquisition, Writing-review & editing; Hui Chen: Data Curation, Software, Validation, Visualization, Writing-review & editing; Xue Yan Yuan: Conceptualization, Data curation, Resources, Supervision, Writing-review & editing; Xin Yu Xia: Conceptualization, Formal analysis, Supervision, Validation, Writing-review & editing; Xiao Hui Gao: Conceptualization, Data curation, Resources, Supervision, Writing-review & editing; Guan Jie Chen: Conceptualization, Formal analysis, Supervision, Validation, Project administration, Funding acquisition, Writing-original draft, Writing-review & editing. All authors took part in drafting, revising or critically reviewing the article; gave final approval of the version to be published; have agreed on the journal to which the article has been submitted; and agree to be accountable for all aspects of the work.
Funding
This study was supported by Chinese Nursing Association Research Project (project number: ZHKYQ202415, Guanjie Chen); Jiangsu Province Cadre Healthcare Research Project (project number: BJ24015, Xiaoqing Li); Jiangsu Provincial Young Scientific and Technological Talents Support Program (project number: JSTJ-2025-380, Guanjie Chen); Jiangsu Province Traditional Chinese Medicine Science and Technology Development Plan Project (project number: MS2025130, Shuyuan Qian).
Disclosure
The authors declare that they have no competing interests.
References
1. Evans L, Rhodes A, Alhazzani W, et al. Surviving sepsis campaign: international guidelines for management of sepsis and septic shock 2021. Crit Care Med. 2021;49:e1063–12. doi:10.1097/CCM.0000000000005337
2. Ge S, Zha L, Tanaka A, et al. Post-discharge functional outcomes in older patients with sepsis. Crit Care. 2024;28:281. doi:10.1186/s13054-024-05080-1
3. Dale CR, Chiu ST, Schoepflin Sanders S, et al. Sepsis order set use associated with increased care value. Chest. 2024;166:1046–1055. doi:10.1016/j.chest.2024.05.032
4. GBD 2021 Global Sepsis Collaborators. Global, regional, and national sepsis incidence and mortality, 1990–2021: a systematic analysis. Lancet Glob Health. 2025;13:e2013–e2026. doi:10.1016/S2214-109X(25)00356-0
5. De Waele E, Malbrain MLNG, Spapen H. Nutrition in sepsis: a bench-to-bedside review. Nutrients. 2020;12:395. doi:10.3390/nu12020395
6. Díaz G, Correia MITD, Gonzalez MC, Reyes M. The global leadership initiative on malnutrition criteria for the diagnosis of malnutrition in patients admitted to the intensive care unit: a systematic review and meta-analysis. Clin Nutr. 2023;42:182–189. doi:10.1016/j.clnu.2022.12.007
7. Collins K, Huen SC. Metabolism and nutrition in sepsis: in need of a paradigm shift. Nephron. 2023;147:733–736. doi:10.1159/000534074
8. Abugroun A, Nayyar A, Abdel-Rahman M, Patel P. Impact of malnutrition on hospitalization outcomes for older adults admitted for sepsis. Am J Med. 2021;134:221–226.e1. doi:10.1016/j.amjmed.2020.06.044
9. Arvaniti K, Dimopoulos G, Antonelli M, et al. Epidemiology and age-related mortality in critically ill patients with intra-abdominal infection or sepsis: an international cohort study. Int J Antimicrob Agents. 2022;60:106591. doi:10.1016/j.ijantimicag.2022.106591
10. Fukushima R, Compher CW, Correia MITD, et al. Recognizing malnutrition in adults with critical illness: guidance statements from the global leadership initiative on malnutrition. Clin Nutr. 2025;49:202–208. doi:10.1016/j.clnu.2025.03.011
11. Baek MS, Kwon YS, Kang SS, Shim D, Yoon Y, Kim JH. Association of malnutrition status with 30-day mortality in patients with sepsis using objective nutritional indices: a multicenter retrospective study in South Korea. Acute Crit Care. 2024;39:127–137. doi:10.4266/acc.2023.01613
12. Novac MB, Gorecki GP, Pătru A, et al. Prognostic value of nutritional risk scores in septic ICU patients: a survival analysis using mNUTRIC, PNI, and CONUT. Diagnostics. 2026;16(8):1193. doi:10.3390/diagnostics16081193
13. Kondrup J. Nutrition risk screening in the ICU. Curr Opin Clin Nutr Metab Care. 2019;22:159–161. doi:10.1097/MCO.0000000000000551
14. Heyland DK, Dhaliwal R, Jiang X, Day AG. Identifying critically ill patients who benefit the most from nutrition therapy: the development and initial validation of a novel risk assessment tool. Crit Care. 2011;15:R268. doi:10.1186/cc10546
15. Rahman A, Hasan RM, Agarwala R, Martin C, Day AG, Heyland DK. Identifying critically-ill patients who will benefit most from nutritional therapy: further validation of the “modified NUTRIC” nutritional risk assessment tool. Clin Nutr. 2016;35:158–162. doi:10.1016/j.clnu.2015.01.015
16. Xie M, Huang L, Li L, et al. Association between prognostic nutritional index and 90-day mortality in septic patients: a retrospective cohort study. BMC Nutr. 2025;11(1):232. doi:10.1186/s40795-025-01212-0
17. Singer M, Angus DC, Annane D, et al. Sepsis. Lancet. 2026;407(10535):1276–1288. doi:10.1016/S0140-6736(25)02422-5
18. Pfortmueller CA, Dabrowski W, Wise R, et al. Fluid accumulation syndrome in sepsis and septic shock: pathophysiology, relevance and treatment-a comprehensive review. Ann Intensive Care. 2024;14(1):115. doi:10.1186/s13613-024-01336-9
19. Xiao J, Wang S, Jin M, et al. Cholesterol metabolism regulates macrophage function and inflammation-related diseases. Trends Cell Biol. 2025. doi:10.1016/j.tcb.2025.10.003
20. Zhang T, Tong S, Wu MY, et al. Rethinking the obesity paradox in sepsis: metabolic pharmacotherapy explains survival benefits of obesity. Clin Nutr. 2025;50:229–239. doi:10.1016/j.clnu.2025.05.021
21. Payen D, Velho TR, Moita LF, et al. Beyond inflammation: the role of metabolic dysregulation in sepsis diagnosis and treatment. Intensive Care Med. 2025;51(7):1359–1362. doi:10.1007/s00134-025-07948-4
22. Angus DC, van der Poll T. Severe sepsis and septic shock. N Engl J Med. 2013;369:840–851. doi:10.1056/NEJMra1208623
23. Singer M, Deutschman CS, Seymour CW, et al. The third international consensus definitions for sepsis and septic shock (Sepsis-3). JAMA. 2016;315:801–810. doi:10.1001/jama.2016.0287
24. Li SY, Wan LL, Liu YF, Li YW, Huang X, Liu RJ. Prognostic value of three clinical nutrition scoring system (NRI, PNI, and CONUT) in elderly patients with prostate cancer. Front Nutr. 2024;11:1436063. doi:10.3389/fnut.2024.1436063
25. Riley RD, Ensor J, Snell KIE, et al. Calculating the sample size required for developing a clinical prediction model. BMJ. 2020;368:m441. doi:10.1136/bmj.m441
26. Karampela I, Kounatidis D, Vallianou NG, Panagopoulos F, Tsilingiris D, Dalamaga M. Kinetics of the lactate to albumin ratio in new onset sepsis: prognostic implications. Diagnostics. 2024;14:1988. doi:10.3390/diagnostics14171988
27. Bachmann KF, Cotoia A, Reintam Blaser A. Gastrointestinal function and nutritional interventions in septic shock. Curr Opin Crit Care. 2025;31:599–607. doi:10.1097/MCC.0000000000001302
28. Patel JJ, Shukla A, Heyland DK. Enteral nutrition in septic shock: a pathophysiologic conundrum. JPEN. 2021;45:74–78. doi:10.1002/jpen.2246
29. Castro R, Hernández G, Kattan E, et al. What every intensivist should know about the biphasic kinetics of lactate in septic shock. J Crit Care. 2026;91:155286. doi:10.1016/j.jcrc.2025.155286
30. Levy B, Hernandez G, Taccone F. Lactate dynamics as a marker of perfusion: physiological interpretation and pitfalls. Intensive Care Med. 2025;51:2145–2148. doi:10.1007/s00134-025-08140-4
31. Lian C, Xu Q, Shi H, et al. Hexokinase 3 promoted cytokine production of monocytes by targeting metabolic reprogramming and histone lactylation in sepsis. Clin Clin Epigenet. 2026. doi:10.1186/s13148-026-02129-6
32. Reignier J, Gaillard-Le Roux B, Dequin PF, et al. Expert consensus-based clinical practice guidelines for nutritional support in the intensive care unit: the French Intensive Care Society (SRLF) and the French-Speaking Group of Pediatric Emergency Physicians and Intensivists (GFRUP). Ann Intensive Care. 2025;15:99. doi:10.1186/s13613-025-01509-0
33. Chinese Abdominal Critical Care Working Group, Asian Association of Critical Care Medicine. Expert consensus on enteral nutrition for gastrointestinal dysfunction in critically ill patients (2021 edition). Chin J Dig Surg. 2021;20:1123–1136. doi:10.3760/cma.j.cn115610-20211012-00497
34. Chinese Society for Parenteral and Enteral Nutrition. Guidelines for medical nutrition therapy in adult sepsis patients (2025 edition). Nat Med J China. 2025;105:510–528. doi:10.3760/cma.j.cn112137-20240813-01859
 © 2026 The Author(s). This work is published and licensed by Dove Medical Press Limited. The
full terms of this license are available at https://www.dovepress.com/terms
and incorporate the Creative Commons Attribution
- Non Commercial (unported, 4.0) License.
By accessing the work you hereby accept the Terms. Non-commercial uses of the work are permitted
without any further permission from Dove Medical Press Limited, provided the work is properly
attributed. For permission for commercial use of this work, please see paragraphs 4.2 and 5 of our Terms.
© 2026 The Author(s). This work is published and licensed by Dove Medical Press Limited. The
full terms of this license are available at https://www.dovepress.com/terms
and incorporate the Creative Commons Attribution
- Non Commercial (unported, 4.0) License.
By accessing the work you hereby accept the Terms. Non-commercial uses of the work are permitted
without any further permission from Dove Medical Press Limited, provided the work is properly
attributed. For permission for commercial use of this work, please see paragraphs 4.2 and 5 of our Terms.
Recommended articles
Identifying Potential Effective Diagnostic and Prognostic Biomarkers in Sepsis by Bioinformatics Analysis and Validation
Huang X, Tan J, Chen X, Zhao L
International Journal of General Medicine 2022, 15:6055-6071
Published Date: 6 July 2022
Impaired Circulating Antibody-Secreting Cells Generation Predicts the Dismal Outcome in the Elderly Septic Shock Patients
Xu H, Li T, Zhang X, Li H, Lv D, Wang Y, Huo F, Bai J, Wang C
Journal of Inflammation Research 2022, 15:5293-5308
Published Date: 13 September 2022
Integrated Analysis Identified TGFBI as a Biomarker of Disease Severity and Prognosis Correlated with Immune Infiltrates in Patients with Sepsis
Shi M, Wei Y, Guo R, Luo F
Journal of Inflammation Research 2024, 17:2285-2298
Published Date: 15 April 2024
Impact of High Troponin Level on the Outcome in COVID-19 Positive Patients
Abohamr SI, Kattea MO, Abazid RM, Aldossari MA, Al Asiri N, Alhussini AU, Al Hussaini KI, Alasiri GA, Ali A, Elsheikh E
Journal of Multidisciplinary Healthcare 2024, 17:4989-5000
Published Date: 1 November 2024
A Novel Composite Bioscore Integrating Biomarkers, Clinical Scores, and Comorbidity Indices for Prognostic Stratification in Sepsis
Țocu G, Mihailov R, Luțenco V, Dimofte F, Ștefănescu BI, Niculeț E, Mihailov OM, Țocu L, Stavăr Matei L
Journal of Inflammation Research 2026, 19:579172
Published Date: 23 February 2026