
Back to Journals » Journal of Multidisciplinary Healthcare » Volume 19
Interpretable Dynamic MRI-ITH Model for Predicting Neoadjuvant Chemotherapy Response in Breast Cancer: A Multicenter Study
Authors Wang M, Liu X, Ding W, Xu K, Feng J, Lyu D
Received 13 April 2026
Accepted for publication 18 June 2026
Published 3 July 2026 Volume 2026:19 616424
DOI https://doi.org/10.2147/JMDH.S616424
Checked for plagiarism Yes
Review by Single anonymous peer review
Peer reviewer comments 2
Editor who approved publication: Professor Veronica Swallow
Mengshen Wang,1 Xiaohua Liu,2 Wei Ding,1 Kai Xu,3 Jingyan Feng,4 Di Lyu,1
1Department of Thyroid and Breast Surgery, The Affiliated Hospital of Xuzhou Medical University, Xuzhou, Jiangsu, 221004, People’s Republic of China; 2Department of Radiology, The Affiliated Hospital of Xuzhou Medical University, Xuzhou, Jiangsu, 221000, People’s Republic of China; 3Department of Thyroid and Breast Surgery, Xuzhou First People’s Hospital, Xuzhou, Jiangsu, 221000, People’s Republic of China; 4Department of Mammary Gland, Xuzhou Cancer Hospital, Xuzhou, Jiangsu, 221005, People’s Republic of China
Correspondence: Di Lyu, Department of Thyroid and Breast Surgery, The Affiliated Hospital of Xuzhou Medical University, No. 99 Huaihai West Road, Xuzhou, Jiangsu, 221004, People’s Republic of China, Tel +86 18205211781, Email [email protected]
Objective: This study aimed to develop an interpretable model integrating dynamic MRI intratumoral heterogeneity (ITH) scores for early assessment of pathological complete response (pCR) in breast cancer patients receiving neoadjuvant chemotherapy (NAC).
Methods: A total of 400 breast cancer patients from three centers were prospectively enrolled. Among them, 300 patients from the Affiliated Hospital of Xuzhou Medical University were randomly assigned in a 7:3 ratio to a training set (n = 210) and an internal validation set (n = 90), while 50 patients from Xuzhou Cancer Hospital and 50 patients from Xuzhou First People’s Hospital constituted the external validation set. Clinicopathological characteristics and dynamic contrast-enhanced magnetic resonance imaging (DCE-MRI) data were collected. The baseline MRI-ITH score (ITH0) and dynamic changes at 2 weeks (MRI-Delta-ITH1) and 4 weeks (MRI-Delta-ITH2) after treatment initiation were calculated. Seven predictive models were constructed using logistic regression, and SHAP analysis was used to interpret feature contributions.
Results: The model integrating clinical features and MRI-ΔITH2 yielded the best performance, with area under the receiver operating characteristic curve (AUC) values of 0.940, 0.873, and 0.917 in the training, internal validation, and external validation sets, respectively. SHAP analysis revealed that MRI-ΔITH2 (31.7%), PR status (24.3%), and HER-2 status (18.8%) were the core predictive factors.
Conclusion: A predictive model integrating dynamic MRI-ITH scores with clinicopathological features demonstrated favorable performance for early assessment of pCR after NAC in breast cancer patients. Further multicenter validation is warranted before clinical translation.
Keywords: breast cancer, neoadjuvant chemotherapy, magnetic resonance imaging, intratumoral heterogeneity, SHapley Additive exPlanations, prediction model
Introduction
Breast cancer is one of the most common cancers affecting women worldwide.1 Neoadjuvant chemotherapy (NAC) is an indispensable component of integrated therapy for the treatment of locally advanced and progressive breast cancer. Achievement of pathological complete response (pCR) after NAC is considered an important indicator for predicting a patient’s future survival prognosis.2 However, NAC is not always effective in these cases. Patients with poor treatment results, besides encountering side effects from chemotherapy, also have a worse prognosis and reduced eligibility for surgery.3 Therefore, prediction of the effects of NAC on breast cancer is urgently needed.
Radiomics provides the ability to derive higher-order omics-based parameters from the ROI of tumors, which describes the intrinsic biology and chemotherapy sensitivity of tumors and has shown considerable promise in predicting the response to NAC in breast cancer patients.4 The use of dynamic contrast enhanced magnetic resonance imaging (DCE-MRI) is one of the most common imaging modalities used to evaluate the efficacy of NAC in breast cancers. However, conventional DCE-MRI metrics alone have certain shortcomings as early predictors of pCR.5
Intratumor heterogeneity (ITH) in breast cancer is significantly high, and its influence on treatment outcomes and disease relapse is considerably negative.6 At present, there are two methods for estimating ITH, genomics and histopathology, which suffer from sampling bias. By combining radiomics, MRI provides quantitative information on the entire tumor area without being invasive and minimizing the sampling bias. Moreover, it allows for dynamic observations and provides real-time data that can be used to assess treatment efficacy.7 Recently, with the development of radiomics and quantitative MRI analysis, MRI-based prediction studies for NAC response have become an active research area. In this context, the present study aimed to construct an interpretable model based on dynamic MRI-ITH scores for early assessment of treatment response in breast cancer.
Materials and Methods
Study Design and Population
This study adopted a multicenter prospective cohort design. A total of 400 patients with breast cancer who underwent NAC and had complete dynamic MRI data were enrolled from three centers, including the Affiliated Hospital of Xuzhou Medical University, Xuzhou Cancer Hospital, and Xuzhou First People’s Hospital. Of these, 300 patients from the Affiliated Hospital of Xuzhou Medical University recruited between January 2015 and June 2025 were randomly divided in a 7:3 ratio into a training cohort (n = 210) and an internal validation cohort (n = 90). Fifty patients from Xuzhou Cancer Hospital and fifty patients from Xuzhou First People’s Hospital during the same period formed the external validation cohort.
Inclusion Criteria
① Female patients aged > 18 years with complete clinical demographic data and other pertinent information; ② Breast MRI plain scan and contrast-enhanced imaging performed 1 week prior to NAC initiation and following the completion of treatment; ③ patients with pathologically confirmed invasive breast cancer following surgical resection; ④ Unilateral breast lesions; ⑤ patients who provided written informed consent to participate in the study.
Exclusion Criteria
① Patients without any data from MRI scans that would allow defining their ROIs clearly; ② Patients who have no evidence of histopathological evaluation; ③ Patients with a history of breast tumor surgery, radiation, and/or chemotherapeutic treatment; ④ Patients for whom information about their age, ER, PR, HER-2, Ki-67, and other biomarkers is not comprehensive enough; ⑤ Patients with a history of other cancers besides breast tumors.
Sample Size Calculation
Based on relevant literature, we assumed an area under the receiver operating characteristic curve (AUC) of 0.80 for a single MRI radiomics model (AUC0), and a minimum AUC of 0.90 for the combined MRI radiomics model (AUC1), with a ratio of NAC-responsive to non-responsive patients of 2:1. The sample size for the study was determined using PASS 15.0, which requires a minimum of 200 patients to develop a dynamic predictive model for NAC efficacy. To ensure the validity of the model in terms of its generalizability, 300 patients were randomly recruited from the main institution between January 2015 and June 2025 into a training cohort (n=210) and an internal validation cohort (n=90). Additionally, 50 patients from each of the other two collaborating institutions during this period formed the external validation cohort, totaling 400 patients.
Data Collection
Clinicopathological Data
Patient age at diagnosis and the expression levels of tumor biomarkers detected via immunohistochemistry, including ER, PR, HER-2, and Ki-67, were collected.
Breast MRI Examination, Image Analysis, and Feature Extraction
MRI Examination
MRI examinations were performed using a 3.0-T scanner (MAGNETOM Skyra, Siemens Healthineers, Erlangen, Germany) with a dedicated 16-channel bilateral breast phased-array coil. Patients were scanned in the prone position with both breasts naturally pendant, and the scanning range covered both breasts and the axillary regions. The MRI protocol included the following sequences: (1) axial gradient-echo T1-weighted imaging (T1WI): repetition time (TR), 5.4 ms; echo time (TE), 2.46 ms; field of view (FOV), 350×350 mm; slice thickness, 2.2 mm; interslice gap, 0.4 mm; matrix, 448 x 403; number of slices, 80; acquisition time, 50s; (2) axial fat-suppressed fast spin-echo T2-weighted imaging (T2WI): TR, 3570 ms; TE, 69 ms; FOV, 350×350 mm; slice thickness, 5 mm; interslice gap, 0.6 mm; matrix, 384 x 269; number of slices, 34; acquisition time, 79s; and (3) dynamic contrast-enhanced MRI (DCE-MRI) using a 3D fat-suppressed T1-weighted gradient-echo sequence: TR, 4.5 ms; TE, 1.6 ms; FOV, 340×340 mm; slice thickness, 1.5 mm; interslice gap, 0 mm; matrix, 384 x 384; number of slices, 80; acquisition time, 360s. After one precontrast acquisition, gadopentetate dimeglumine (Gd-DTPA; Bayer, Germany) was injected intravenously at a dose of 0.1 mmol/kg and a rate of 2 mL/s, followed immediately by a 15-mL saline flush. Five consecutive postcontrast DCE-MRI phases were then acquired.
Image Analysis
Two radiologists with more than 12 years of experience in breast imaging diagnosis analyzed the images in a manner blinded to the pathological results. In case of discrepancies, consultations with senior radiologists were conducted to reach a consensus regarding the extraction of traditional MRI features.
MRI Image Segmentation and Feature Extraction
The acquired images were processed using ITK-SNAP 4.2.2. An experienced radiologist with 12 years of experience in diagnosing diseases in the breasts marked the ROIs layer by layer along the tumor border covering the whole tumor to create the VOI (Figure 1). Subsequently, MRI-ITH scores were calculated using an ITHscore-based whole-tumor volumetric analysis pipeline. Briefly, MRI images and the corresponding three-dimensional tumor segmentation masks were loaded for each patient, and the segmented tumor volume of interest (VOI) was used for intratumoral heterogeneity analysis. Voxel-level radiomic features were extracted within the tumor VOI. To characterize intratumoral heterogeneity more adaptively, an adaptive clustering strategy was applied to the extracted feature matrix, with the optimal cluster number selected within a predefined range according to multiple clustering evaluation criteria, including the silhouette method, elbow method, and Calinski-Harabasz index. The final clustering map was then used to calculate the ITHscore. Based on serial MRI examinations, the baseline ITH score (ITH0) and the dynamic change-derived indices at 2 weeks (MRI-Delta-ITH1) and 4 weeks (MRI-Delta-ITH2) after treatment initiation were used for downstream model construction.
 |
Figure 1 Representative DCE-MRI images of a breast cancer patient before and during neoadjuvant chemotherapy (NAC). (A) Baseline MRI before treatment initiation. (B) MRI obtained 2 weeks after NAC initiation. (C) MRI obtained 4 weeks after NAC initiation. The red-highlighted regions indicate the tumor lesion, and the arrows indicate the corresponding lesion location. Abbreviations: DCE-MRI, dynamic contrast-enhanced magnetic resonance imaging; NAC, neoadjuvant chemotherapy. |
Reproducibility
To assess VOI segmentation reproducibility, a randomly selected subset of cases underwent interobserver and/or intraobserver repeated segmentation, and intraclass correlation coefficients (ICCs) were calculated to assess the stability of MRI-ITH-related heterogeneity features. Only reproducible features were retained for subsequent analysis. The extracted heterogeneity features showed good reproducibility, with ICC values ranging from 0.87 to 0.95.
Model Construction and Evaluation
Development of the MRI-ITH Score Model
The primary endpoint was pathological complete response (pCR), determined on the basis of postoperative surgical pathology after NAC. pCR was defined as the absence of residual invasive disease in the breast and axillary lymph nodes (ypT0/is ypN0). Using the pCR status as the dependent variable and MRI-ITH scores (ITH0, ΔITH1, and ΔITH2) as the independent variables, a predictive model based on MRI-ITH scores was developed.
Screening of Clinical Predictors and Model Development
The clinical predictive factors related to NAC effectiveness were determined using univariate and multivariate logistic regression analyses, and a clinical predictive model was constructed.
Development of the Integrated Model
Seven predictive models were developed using logistic regression, a supervised classification algorithm widely used in both statistical prediction modeling and machine-learning-based clinical research. A clinical model, three MRI-ITH-based models, and three integrated models combining clinicopathological variables with MRI-ITH-derived indices were constructed. SHAP (SHapley Additive exPlanations) analysis was subsequently performed to explain the contribution of individual predictors to the final model outputs.
Statistical Analysis
Normally distributed continuous data variables are presented in this study, and descriptive statistics are presented as mean ± standard deviation (SD). However, when non-normally distributed, the mean of the continuous variable data was presented as median (IQR, P25–P75). Categorical data are presented as frequencies (%). An independent samples t-test was adopted when two normally distributed variables were compared and variances were homogeneous. In contrast, when two normally distributed variables were compared and variances were heterogeneous, Welch’s t-test was used. When comparing three normally distributed variables, one-way analysis of variance (ANOVA, F-test) was conducted. However, the Kruskal–Wallis H-test was used to compare the three variables that were not normally distributed. The Pearson’s χ 2 test was performed for the two categories of categorically distributed variables.
Logistic regression models were developed to identify the clinicopathological characteristics that could lead to the success of NAC in patients with breast cancer, and several predictive models with the inclusion of MRI-ITH scores were established. Model performance was evaluated using ROC curves, AUC values with 95% confidence intervals, sensitivity, specificity, accuracy, and F1-score. DeLong tests were additionally used to compare ROC performance between models. Calibration was assessed using calibration curves together with the Hosmer-Lemeshow test. Decision curve analysis (DCA) was performed to evaluate the potential clinical net benefit of the seven predictive models.
All calculations and graphs were performed using Python 3.9.2. Statistical significance was set at P < 0.05.
Results
Baseline Characteristics of Patients
A total of 400 patients with breast cancer were included in this study, with a mean age of 48.83 ± 16.84 years. Among the entire study population, 120 patients (30.0%) achieved pCR after NAC, whereas 280 patients (70.0%) did not. There were no significant differences in baseline clinicopathological characteristics, including age, menopausal status, histological grade, ER status, PR status, HER-2 status, and Ki-67 expression, among the training, internal validation, and external validation cohorts (all P > 0.05), indicating good comparability across the three datasets (Table 1).
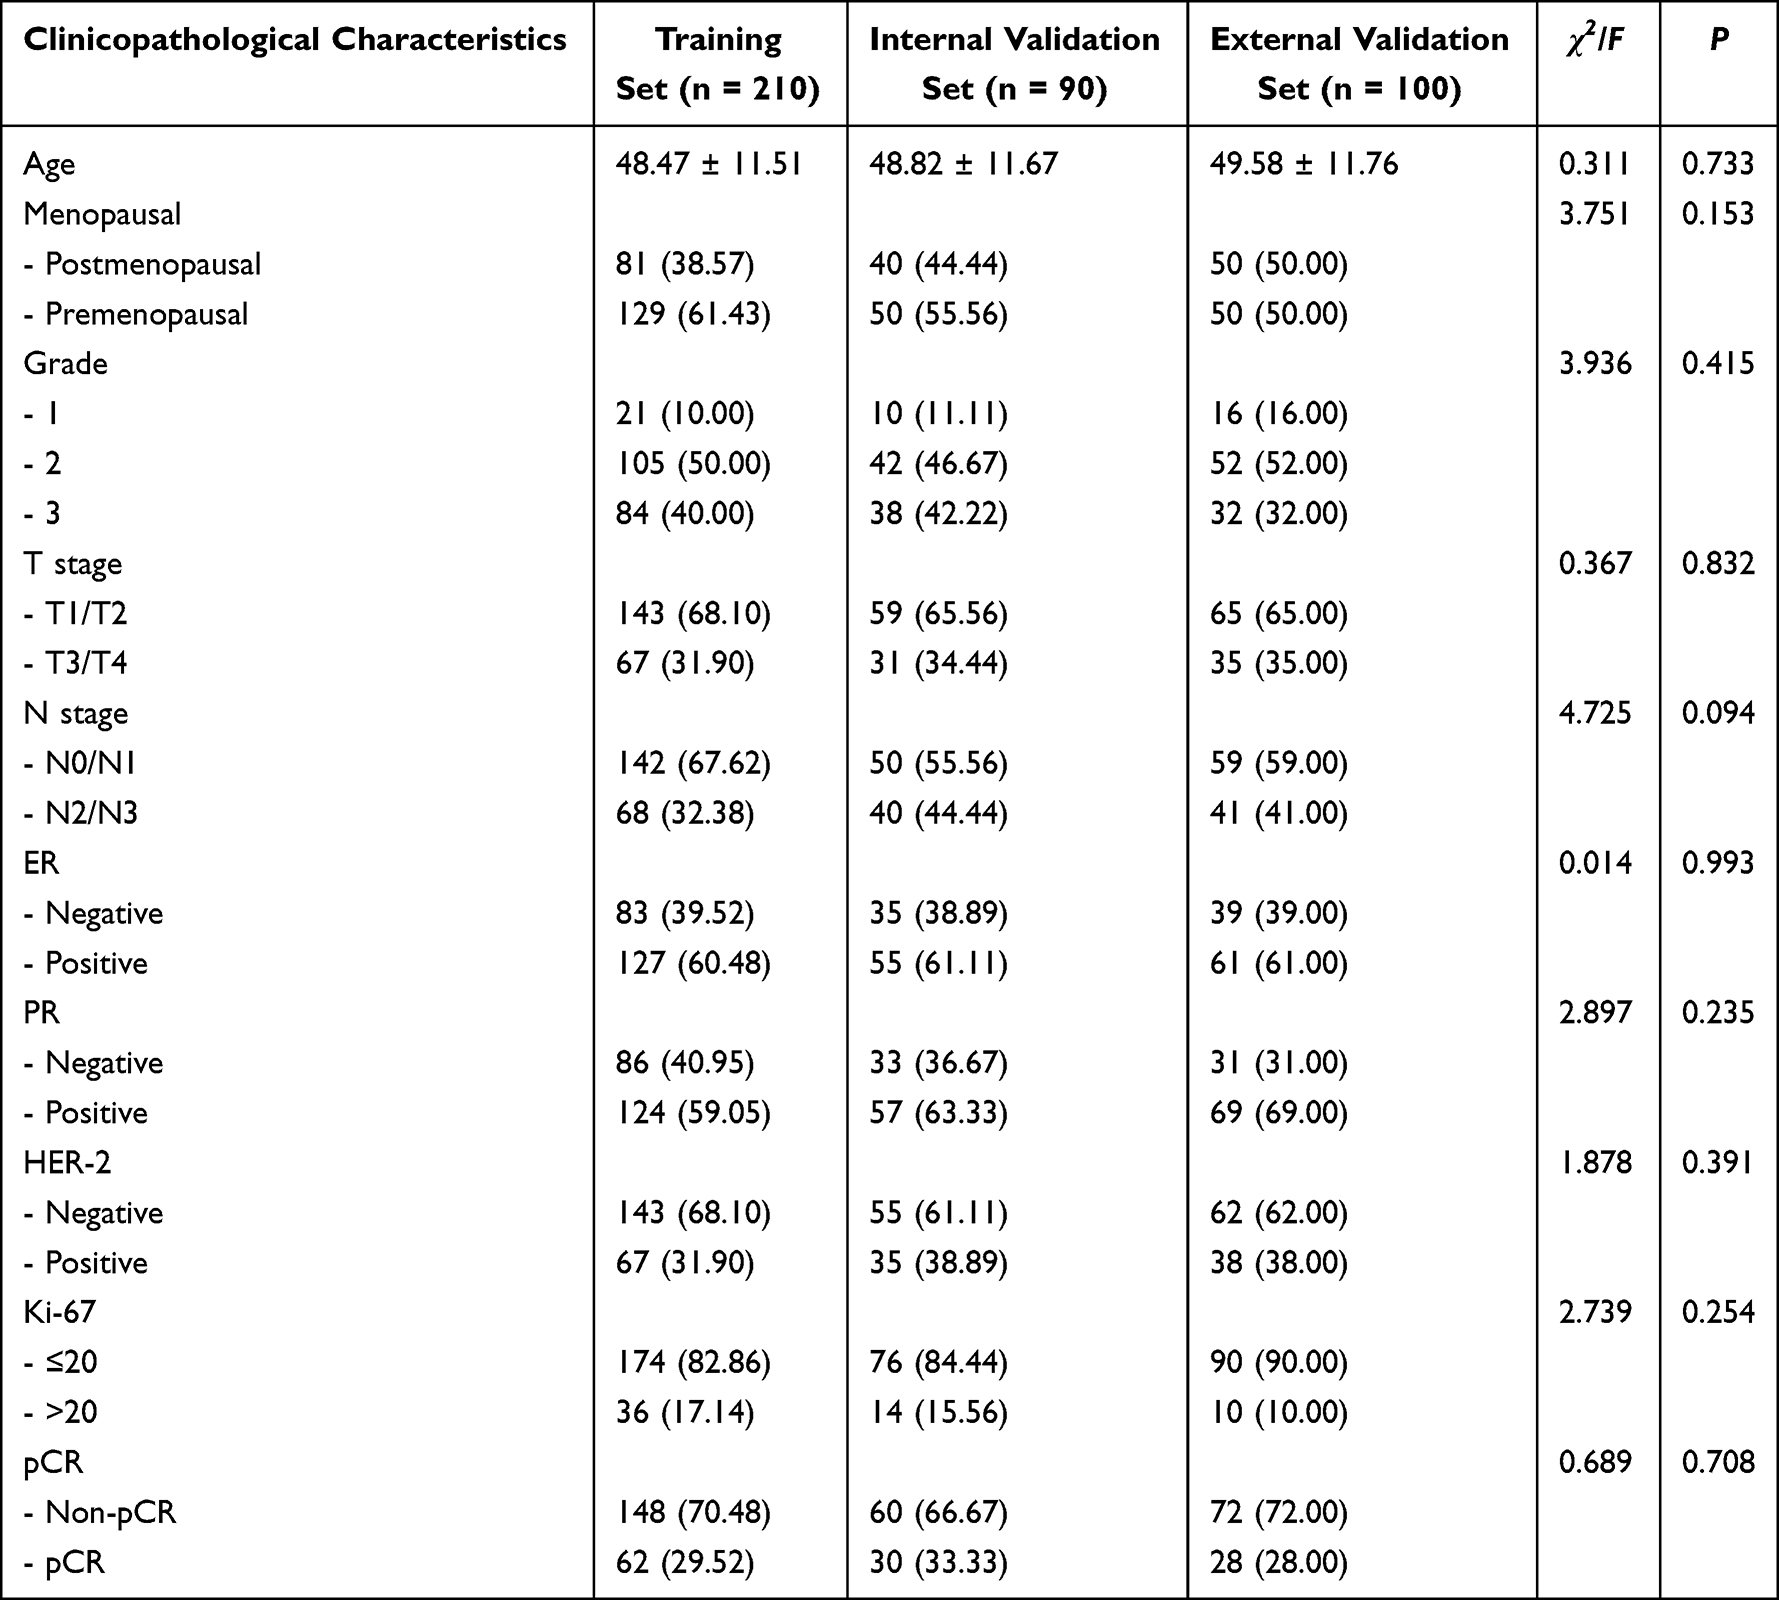 |
Table 1 Comparison of Clinicopathological Characteristics of Patients in Different Datasets |
Reproducibility of MRI-ITH-Related Features
The MRI-ITH-related heterogeneity features demonstrated good reproducibility, with ICC values ranging from 0.87 to 0.95.
Comparison of Clinicopathological and Imaging Features Between pCR and Non-pCR Patients in the Training Set
The training set comprised 210 patients, 148 in the non-pCR group and 62 in the pCR group. The results demonstrated that compared with the non-pCR group, the pCR group had a higher proportion of postmenopausal patients (33.78% vs 50.00%, P=0.028), a higher proportion of histological grade 1 (6.08% vs 19.35%), a lower proportion of grade 3 (44.59% vs 29.03%, P=0.005), a higher proportion of ER-negative cases (29.73% vs 62.90%, P<0.001), a higher proportion of PR-negative cases (26.35% vs 75.81%, P<0.001), a higher proportion of HER-2-positive cases (23.65% vs 51.61%, P<0.05), a higher proportion of Ki-67>20% (12.84% vs 27.42%, P=0.011), lower MRI-ITH0 (median [interquartile range (IQR)], 0.80 [0.70–0.89] vs 0.72 [0.68–0.78], P<0.001), lower MRI-ΔITH1 (median [IQR], 0.94 [0.81–1.09] vs 0.64 [0.53–0.79], P<0.001), and lower MRI-ΔITH2 (median [IQR], 0.89 [0.76–1.06] vs 0.52 [0.42–0.70], P<0.001).
In conclusion, the menopausal status, histological grading, estrogen receptor positivity, progesterone receptor positivity, HER-2 positivity, Ki-67, MRI-ITH0, MRI-ΔITH1, and MRI-ΔITH2, among the listed variables, had significant differences between the two groups (P < 0.05) and are therefore considered potential factors to predict pCR. Age, T stage, and N stage were not significantly different (P > 0.05) between the two groups (Table 2).
 |
Table 2 Comparison of Clinicopathological and Imaging Features Between pCR and Non-pCR Patients in the Training Set |
Model Construction
Identification of Clinical Predictive Factors
Multivariate logistic regression was performed using pCR as the dependent variable, while others, such as menopausal status, histologic grade, ER, PR, HER-2 and Ki-67, were considered as the independent variables. From the analysis conducted, it was found that the level of ER (OR = 0.27, 95% CI: 0.13–0.55, P<0.001), PR (OR=0.12, 95% CI: 0.06–0.26, P<0.001), HER-2 (OR=3.00, 95% CI: 1.41–8.96, P=0.008) were independent predictive factors for pCR (Table 3).
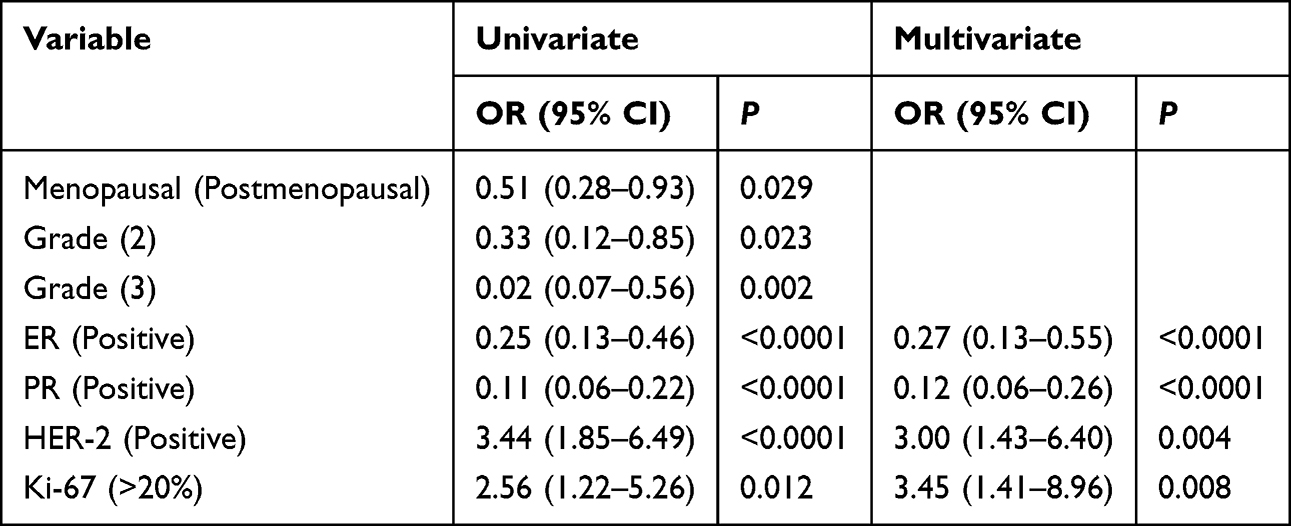 |
Table 3 Logistic Regression Analysis Results of Clinicopathological Features Affecting pCR |
Construction and Evaluation of Prediction Models
To identify the optimal predictive model, we integrated clinicopathological and imaging features, with pCR status as the dependent variable, and developed seven distinct models for comparative analysis: ① Clinical Model (ER, PR, HER-2, Ki-67); ② MRI-ITH0; ③ MRI-ΔITH1; ④ MRI-ΔITH2; ⑤ Clinical+MRI-ITH0; ⑥ Clinical+MRI-ΔITH1; ⑦ Clinical+MRI-ΔITH2. Model performance was evaluated using ROC curves, AUC values with 95% confidence intervals, sensitivity, specificity, accuracy, and F1-score. DeLong tests were additionally used to compare ROC performance between models. Calibration was assessed using calibration curves together with the Hosmer-Lemeshow test, and decision curve analysis (DCA) was performed to evaluate the potential clinical net benefit. The results are shown in Table 4 and Figures 2–5.
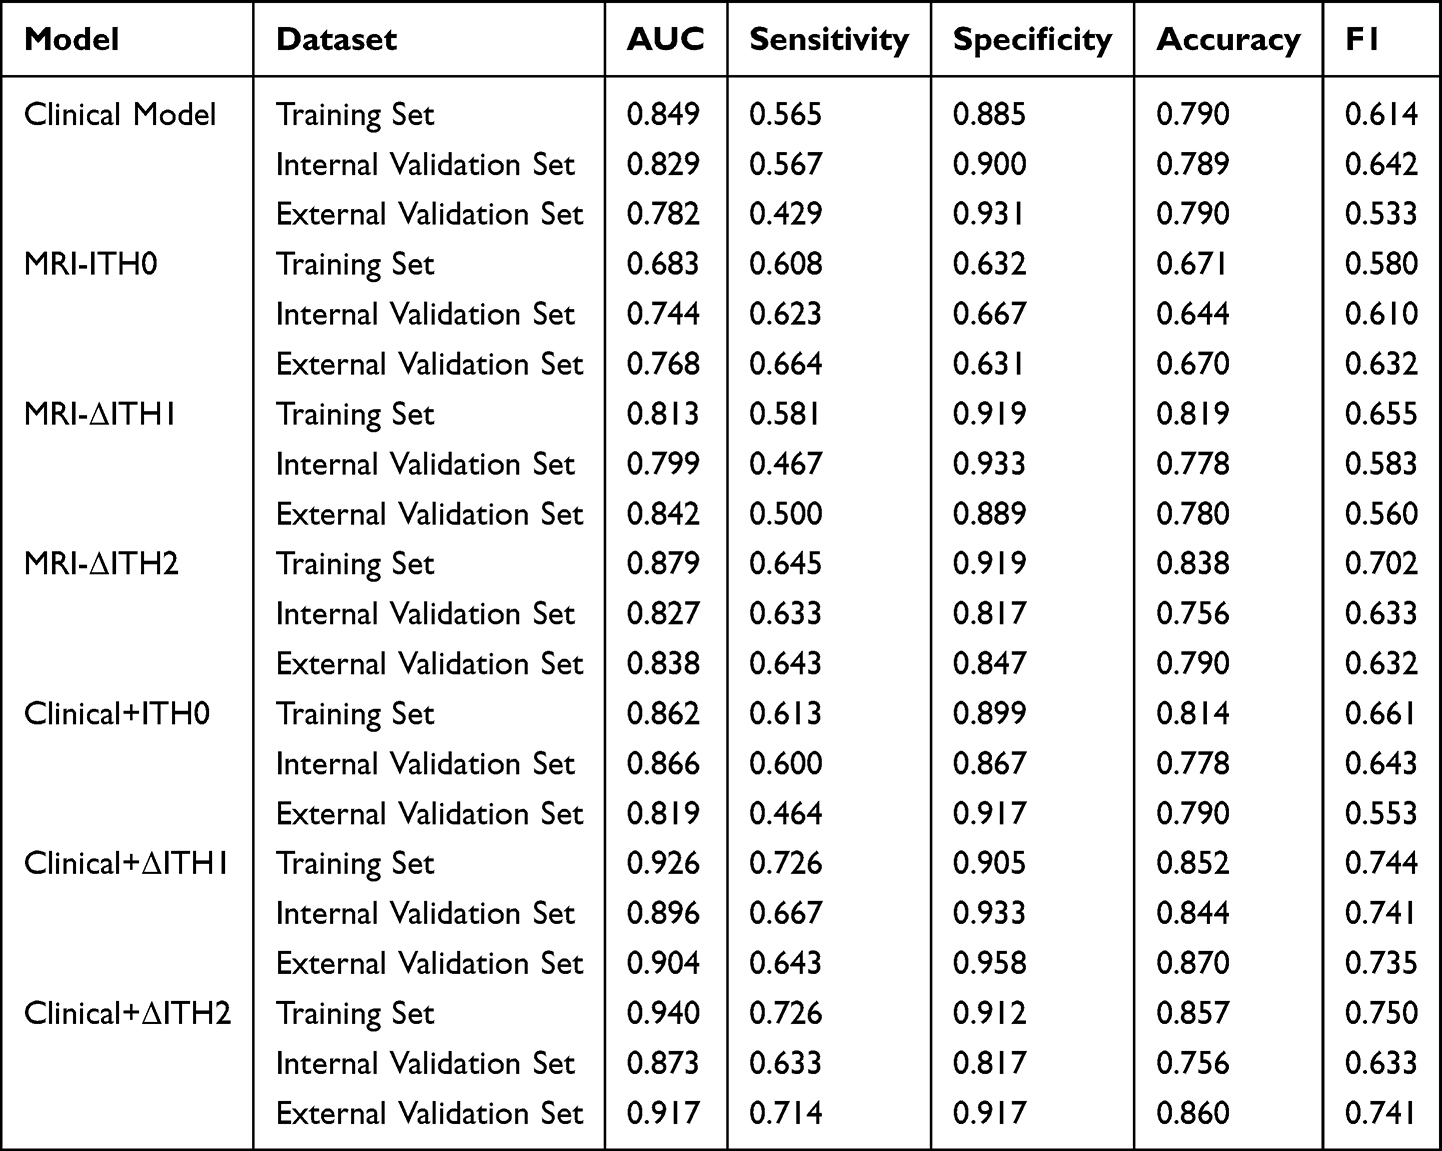 |
Table 4 Comparison of the Performance of Different Models in Predicting pCR After NAC in Breast Cancer |
 |
Figure 2 Receiver operating characteristic (ROC) curves of the seven predictive models for early assessment of pathological complete response (pCR) after neoadjuvant chemotherapy (NAC) in breast cancer patients. (A) Training cohort. (B) Internal validation cohort. (C) External validation cohort. The AUC values of all models are shown within each panel. Abbreviations: ROC, receiver operating characteristic; AUC, area under the curve; MRI-ITH, magnetic resonance imaging-based intratumoral heterogeneity. |
 |
Figure 3 Calibration curves of the seven predictive models for early assessment of pathological complete response (pCR) after neoadjuvant chemotherapy (NAC) in breast cancer patients. (A) Training cohort. (B) Internal validation cohort. (C) External validation cohort. The seven models included the Clinical Model, MRI-ITH0 model, MRI-Delta-ITH1 model, MRI-Delta-ITH2 model, Clinical+ITH0 model, Clinical+Delta-ITH1 model, and Clinical+Delta-ITH2 model. The diagonal dashed line represents ideal agreement between predicted and observed probabilities. Abbreviation: MRI-ITH, magnetic resonance imaging-based intratumoral heterogeneity. |
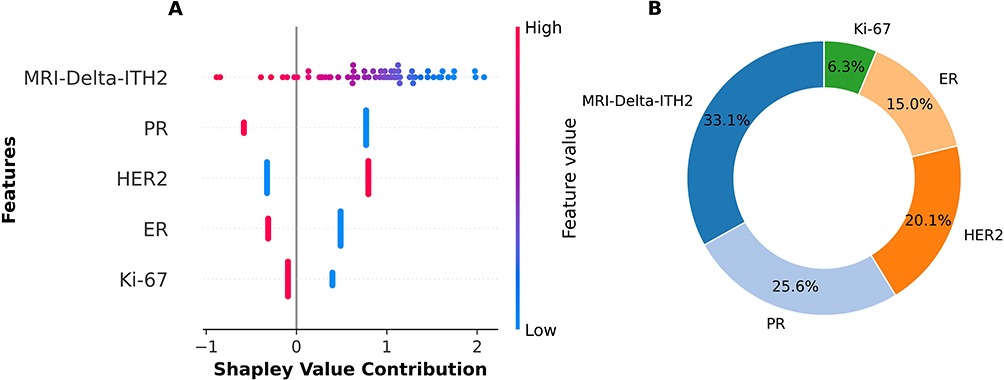 |
Figure 4 SHAP analysis of the optimal predictive model. (A) SHAP summary plot showing the direction and magnitude of feature contributions to the model output. Each point represents an individual patient, and the color scale indicates the corresponding feature value. (B) Donut chart showing the relative importance of model features based on the mean absolute SHAP values. Abbreviations: SHAP, SHapley Additive exPlanations; MRI-ITH, magnetic resonance imaging-based intratumoral heterogeneity. |
 |
Figure 5 Decision curve analysis (DCA) of the seven predictive models for early assessment of pathological complete response (pCR) after neoadjuvant chemotherapy (NAC) in breast cancer patients. (A) Training cohort. (B) Internal validation cohort. (C) External validation cohort. The seven models included the Clinical Model, MRI-ITH0 model, MRI-Delta-ITH1 model, MRI-Delta-ITH2 model, Clinical+ITH0 model, Clinical+Delta-ITH1 model, and Clinical+Delta-ITH2 model. The x-axis indicates the threshold probability, and the y-axis indicates the net benefit. Abbreviations: DCA, decision curve analysis; MRI-ITH, magnetic resonance imaging-based intratumoral heterogeneity. |
Among the seven models, the Clinical + MRI-Delta-ITH2 model achieved the best overall discriminative performance. The AUCs of this model were 0.940 (95% CI: 0.908–0.972), 0.873 (95% CI: 0.800–0.947), and 0.917 (95% CI: 0.844–0.991) in the training, internal validation, and external validation cohorts, respectively. The corresponding sensitivities were 0.726, 0.633, and 0.714; the specificities were 0.912, 0.817, and 0.917; the accuracies were 0.857, 0.756, and 0.860; and the F1-scores were 0.750, 0.633, and 0.741, respectively. Calibration performance of the seven predictive models is shown in Figure 3. The training cohort demonstrated acceptable agreement between predicted and observed probabilities, whereas calibration in the validation cohorts was less stable.
SHAP Visualization of the Model
SHAP analysis was used to interpret the decision process of the optimal model. MRI-Delta-ITH2, PR status, and HER-2 status were identified as the most influential predictors. The SHAP findings were interpreted as reflecting feature contribution to model output rather than direct evidence of specific biological mechanisms.
As shown in Figure 4, the beeswarm chart on the left (beeswarm plot) clearly shows the direction and impact strength of the influence of each variable using the contribution of the Shapley value, while the circular chart on the right (circular plot) shows the quantitative importance of each variable. These results indicate that ER status, PR status, HER-2 status, Ki-67 expression, and MRI-ΔITH2 are the key variables that contribute to the prediction results. For the Beeswarm plot, the Shapley value contribution is marked on the x-axis, whereas feature names are marked on the y-axis with red–purple–blue color scales, corresponding to feature values (red = high, blue = low).
There are many points with high values for ER, PR, and MRI-ΔITH2, with Shapley values > 0, and are colored in blue. This implies that high values of ER, PR, and MRI-ΔITH2 contribute to negative predictions. Therefore, high levels of ER and PR expression, as well as MRI-ΔITH2 values, tended to negatively predict pCR, indicating that individuals with high levels of ER and PR expression and high MRI-ΔITH2 are unlikely to achieve pCR. In contrast, there were many points with high values for HER-2 and Ki-67, with Shapley values > 0 and colored red. This indicated that high levels of HER-2 and Ki-67 expression contributed to positive predictions. This implies that patients with high levels of HER-2 expression and Ki-67 expression are more likely to achieve pCR.
Furthermore, in the circular plot, the relative importance of the features on a global scale was evaluated numerically. Thus, the feature with the highest global relative importance of 31.7% is MRI-ΔITH2; the second feature with 24.3% is PR status, followed by HER-2 status with 18.8%. Together, these three features make up more than 70% of the relative importance and constitute the “core feature set”, while ER status (14.4%) and Ki-67 (10.8%) contribute less than 15%.
Discussion
In conclusion, this study constructed an interpretable model incorporating dynamic MRI-ITH scores for early assessment of pCR after NAC in patients with breast cancer.
In this study, 400 patients with breast cancer were enrolled, with a pCR rate of 30.00%. This pCR rate was generally consistent with the range reported in contemporary multicenter studies,8 supporting the clinical relevance of the study population. In addition, the training cohort analysis showed significant differences in several clinical, pathological, and imaging characteristics between the pCR and non-pCR groups, providing useful clues for treatment-response prediction.
In terms of clinicopathological features, the pCR group had higher frequencies of ER negativity, PR negativity, HER-2 positivity, and Ki-67 >20%, and these variables were identified as independent predictors of pCR in multivariate logistic regression analysis. This observation is generally consistent with previous cohort studies, including findings from the International Breast Cancer Study Group (IBCSG), which suggested that ER/PR-negative tumors may show greater sensitivity to cytotoxic chemotherapy because of the lack of hormone signaling.9 On the other hand, in HER-2-positive breast cancer, the addition of trastuzumab to conventional chemotherapy can increase the probability of pCR to 40–60%.10 Ki-67 serves as a classic marker for proliferation and represents the proliferative status of tumor cells. A high Ki-67 value (>20%) implies that the tumor cells have entered the actively proliferating stage and, thus, become more sensitive to chemotherapeutic-induced cell death.11
Notably, considerable disparities were detected in radiomics features (MRI-ITH0, MRI-ΔITH1, and MRI-ΔITH2) between both patient cohorts (with lower values in the pCR group), demonstrating strong links between alterations of intratumoral heterogeneity in dynamics and chemotherapy responsiveness. The conventional approach for assessing ITH requires biopsy with sampling bias.12 In contrast, the proposed radiomic intratumoral heterogeneity scoring approach using MRI images allows for the detection of the entire tumor heterogeneity. Indeed, a reduction in MRI-ΔITH2 (ie, the difference in the ITH compared to the baseline level at 4 weeks after the treatment course) in the pCR group suggests that the greater the tumor clonal homogenization after chemotherapy, the greater the probability of complete response. This is in line with the statement from the latest review, which states that “reduced ITH is an early imaging sign of effective treatment”.13
In this study, seven combined models were built, and the model consisting of Clinical + MRI-ΔITH2 performed best, with an AUC value of 0.940 for the training group and 0.873 and 0.917 for the internal and external validation groups, respectively, which were significantly superior to either the single clinical model (AUC: 0.782–0.849) or the single imaging model (AUC: 0.683–0.768). This result validates the academic principle of “multi-modal fusion improves prediction performance”, as clinicopathological parameters show the molecular subtypes and proliferation activity of tumors, and the ITH index of MRI reflects the tumor heterogeneity and dynamics.14 The advantages of this model relative to other studies include the following.
First, high discriminative ability, with an estimated 15–20% increment in AUC when compared to models using single DCE-MRI characteristics (AUC: 0.683–0.768).
Second, The model demonstrated promising performance in the external validation cohort, although broader validation across more diverse regions and platforms is still needed.15 This indicates that the dynamic ITH score (MRI-ΔITH2) integrates mid-treatment imaging changes and better reflects real-time tumor response compared to baseline static features and that the rigorous multicenter validation design mitigates the impact of regional bias on model stability.16
The “black box” limitation of predictive models has long been a barrier to clinical translation. In this study, SHAP analysis improved the interpretability of the optimal model and highlighted MRI-ΔITH2, PR status, and HER-2 status as the most influential features. A high MRI-ΔITH2 value may indicate a slower reduction in tumor heterogeneity, whereas ER/PR positivity may reflect hormone dependence, both of which were negatively associated with pCR. In contrast, HER-2 positivity and high Ki-67 expression were positively associated with pCR. These findings support the potential value of dynamic imaging heterogeneity for early treatment-response assessment, although the underlying biological mechanisms require further validation.17,18
This interpretability may enhance clinician understanding of the model and help identify patients who require closer monitoring during treatment; however, further prospective clinical studies are still needed before model-guided treatment adjustment can be recommended.
The main clinical value of this study lies in providing a potentially useful tool for early treatment-response assessment in breast cancer patients receiving NAC. Rather than directly guiding treatment modification, the model may help identify patients who require closer evaluation during therapy. Further prospective clinical studies are still needed before model-guided treatment adjustment can be recommended in practice.19–21
This study has several limitations. First, although the study was prospectively conducted across multiple centers, the sample size remained moderate, and further validation in larger and more diverse populations is needed. Second, genomic or transcriptomic data were not incorporated, limiting deeper biological interpretation of the imaging findings. Third, although MRI-ITH was quantified on the basis of the whole-tumor VOI, further methodological standardization across software pipelines, segmentation procedures, and multicenter imaging protocols is still needed to improve reproducibility and clinical translation. Fourth, although multicenter data were included, additional scanner-level harmonization strategies such as ComBat were not implemented and should be considered in future work.
Conclusion
In conclusion, a predictive model integrating clinicopathological variables with dynamic MRI-ITH scores demonstrated favorable performance for early assessment of pCR after NAC in breast cancer patients. The model showed promising discrimination and interpretability in both internal and center-based external validation cohorts. Further large-scale multicenter validation is warranted before clinical translation.
Data Sharing Statement
All data used or analyzed in this study are presented in this article. For additional information, please contact the corresponding authors.
Ethical Approval and Participation Consent
Ethical approval for this multicenter prospective cohort study was led by the Institutional Review Board of the Affiliated Hospital of Xuzhou Medical University (approval number: XYFY2022-KL405-01). Written informed consent was obtained from all participants before enrollment. All patient data were handled confidentially and used exclusively for research purposes. The study was conducted in accordance with the Declaration of Helsinki.
Publication Consent
Written informed consent for study participation and publication of anonymized research data was obtained from all participants before enrollment.
Acknowledgments
We acknowledge Mr. Peng He, a biostatistician, for his valuable guidance on the statistical analysis of this manuscript.
Funding
This study was supported by XZHMU-QL Joint Research Fund (No. QL-YB035).
Disclosure
The authors declare no conflict of interest.
References
1. Bray F, Laversanne M, Sung H, et al. Global cancer statistics 2022: GLOBOCAN estimates of incidence and mortality worldwide for 36 cancers in 185 countries. CA Cancer J Clin. 2024;74(3):229–12. doi:10.3322/caac.21834
2. Laas E, Labrosse J, Hamy AS, et al. Determination of breast cancer prognosis after neoadjuvant chemotherapy: comparison of residual cancer burden (RCB) and neo-bioscore. Br J Cancer. 2021;124(8):1421–1427. doi:10.1038/s41416-020-01251-3
3. Feng X, Shi Y, Du Y, et al. Application value of ultrasound radiomics combined with clinical indicators in predicting the efficacy of neoadjuvant chemotherapy for breast cancer. Chin J Ultrasound Med. 2025;41(1):17–21.
4. Bian T, Wu Z, Lin Q, et al. Radiomic signatures derived from multiparametric MRI for the pretreatment prediction of response to neoadjuvant chemotherapy in breast cancer. Br J Radiol. 2020;93(1115):20200287. doi:10.1259/bjr.20200287
5. Yin XX, Hadjiloucas S, Zhang Y, Tian Z. MRI radiogenomics for intelligent diagnosis of breast tumors and accurate prediction of neoadjuvant chemotherapy responses-a review. Comput Methods Programs Biomed. 2022;214:106510. doi:10.1016/j.cmpb.2021.106510
6. Zardavas D, Irrthum A, Swanton C, Piccart M. Clinical management of breast cancer heterogeneity. Nat Rev Clin Oncol. 2015;12(7):381–394. doi:10.1038/nrclinonc.2015.73
7. Sun Q, Chen Y, Liang C, et al. Biologic pathways underlying prognostic radiomics phenotypes from paired MRI and RNA sequencing in glioblastoma. Radiology. 2021;301(3):654–663. doi:10.1148/radiol.2021203281
8. Cortazar P, Zhang L, Untch M, et al. Pathological complete response and long-term clinical benefit in breast cancer: the CTNeoBC pooled analysis. Lancet. 2014;384(9938):164–172. doi:10.1016/S0140-6736(13)62422-8
9. Carey LA, Dees EC, Sawyer L, et al. The triple negative paradox: primary tumor chemosensitivity of breast cancer subtypes. Clin Cancer Res. 2007;13(8):2329–2334. doi:10.1158/1078-0432.CCR-06-1109
10. Gianni L, Pienkowski T, Im YH, et al. Efficacy and safety of neoadjuvant pertuzumab and trastuzumab in women with locally advanced, inflammatory, or early HER2-positive breast cancer (NeoSphere): a randomised multicentre, open-label, Phase 2 trial. Lancet Oncol. 2012;13(1):25–32. doi:10.1016/S1470-2045(11)70336-9
11. Zhang Q, Huang Y, Lu G, et al. Research progress on the effects of neoadjuvant chemotherapy drugs on biomarkers related to breast cancer efficacy prediction. China Pharm. 2020;31(16):2033–2037.
12. Avik J. Deciphering mechanisms underlying tumor heterogeneity using multi-omics approaches. 2020.
13. Saller JJ, Boyle TA. Molecular pathology of lung cancer. Cold Spring Harbor Perspectives Med. 2022;12(3):a037812. doi:10.1101/cshperspect.a037812
14. Lambin P, Leijenaar R, Deist TM, et al. Radiomics: the bridge between medical imaging and personalized medicine. Nat Rev Clin Oncol. 2017;14(12):749–762. doi:10.1038/nrclinonc.2017.141
15. Zhang H, Wu J. Application of baseline DCE-MRI radiomics in predicting the efficacy of neoadjuvant chemotherapy in breast cancer patients. Chin J CT MRI. 2023;21(10):180–182.
16. Chen BY, Xie H, Li Y, et al. MRI-based radiomics features to predict treatment response to neoadjuvant chemotherapy in locally advanced rectal cancer: a single center, prospective study. Front Oncol. 2022;12:801743. doi:10.3389/fonc.2022.801743
17. Zhao L, Chen Z, Luo R, et al. Construction of a machine learning model based on SHAP interpretable analysis and MRI radiomics to predict the efficacy of neoadjuvant chemotherapy for breast cancer. J Mod Oncol. 2024;32(15):2839–2844.
18. Alizadeh AA, Eisen MB, Davis RE, et al. Distinct types of diffuse large B-cell lymphoma identified by gene expression profiling. Nature. 2000;403(6769):503–511. doi:10.1038/35000501
19. Fang S, Xia W, Zhang H, et al. A real-world clinicopathological model for predicting pathological complete response to neoadjuvant chemotherapy in breast cancer. Front Oncol. 2024;14:1323226. doi:10.3389/fonc.2024.1323226
20. Ma R, Wei W, Ye H, Dang C, Li K, Yuan D. A nomogram based on platelet-to-lymphocyte ratio for predicting pathological complete response of breast cancer after neoadjuvant chemotherapy. BMC Cancer. 2023;23(1):245. doi:10.1186/s12885-023-10703-x
21. Guan D, Jie Q, Wu Y, Xu Y, Hong W, Meng X. Real-world data on breast pathologic complete response and disease-free survival after neoadjuvant chemotherapy for hormone receptor-positive, human epidermal growth factor receptor-2-negative breast cancer: a multicenter, retrospective study in China. World J Surg Oncol. 2022;20(1):326. doi:10.1186/s12957-022-02787-9
 © 2026 The Author(s). This work is published and licensed by Dove Medical Press Limited. The
full terms of this license are available at https://www.dovepress.com/terms
and incorporate the Creative Commons Attribution
- Non Commercial (unported, 4.0) License.
By accessing the work you hereby accept the Terms. Non-commercial uses of the work are permitted
without any further permission from Dove Medical Press Limited, provided the work is properly
attributed. For permission for commercial use of this work, please see paragraphs 4.2 and 5 of our Terms.
© 2026 The Author(s). This work is published and licensed by Dove Medical Press Limited. The
full terms of this license are available at https://www.dovepress.com/terms
and incorporate the Creative Commons Attribution
- Non Commercial (unported, 4.0) License.
By accessing the work you hereby accept the Terms. Non-commercial uses of the work are permitted
without any further permission from Dove Medical Press Limited, provided the work is properly
attributed. For permission for commercial use of this work, please see paragraphs 4.2 and 5 of our Terms.
Recommended articles

Development and Validation of an MRI Radiomics-Based Signature to Predict Histological Grade in Patients with Invasive Breast Cancer
Wang S, Wei Y, Li Z, Xu J, Zhou Y
Breast Cancer: Targets and Therapy 2022, 14:335-342
Published Date: 14 October 2022
Validation of a Disease-Free Survival Prediction Model Using UBE2C and Clinical Indicators in Breast Cancer Patients
Shen J, Yan H, Yang C, Lin H, Li F, Zhou J
Breast Cancer: Targets and Therapy 2023, 15:295-310
Published Date: 25 April 2023
Predictive miRNAs Patterns in Blood of Breast Cancer Patients Demonstrating Resistance Towards Neoadjuvant Chemotherapy
Fan J, Tang Y, Wang K, Yang S, Ma B
Breast Cancer: Targets and Therapy 2023, 15:591-604
Published Date: 11 August 2023
ABVS-Based Radiomics for Early Predicting the Efficacy of Neoadjuvant Chemotherapy in Patients with Breast Cancers
Jiang W, Deng X, Zhu T, Fang J, Li J
Breast Cancer: Targets and Therapy 2023, 15:625-636
Published Date: 15 August 2023
A Comprehensive Model Based on Dynamic Contrast-Enhanced Magnetic Resonance Imaging Can Better Predict the Preoperative Histological Grade of Breast Cancer Than a Radiomics Model
Wu Y, Pan W, Wang L, Pan W, Zhang H, Jin S, Wu X, Liu A, Xin E, Ji W
Breast Cancer: Targets and Therapy 2023, 15:709-720
Published Date: 18 October 2023