")
Back to Journals » Breast Cancer: Targets and Therapy » Volume 15
Predictive miRNAs Patterns in Blood of Breast Cancer Patients Demonstrating Resistance Towards Neoadjuvant Chemotherapy
Authors Fan J, Tang Y, Wang K, Yang S, Ma B
Received 30 March 2023
Accepted for publication 22 July 2023
Published 11 August 2023 Volume 2023:15 Pages 591—604
DOI https://doi.org/10.2147/BCTT.S415080
Checked for plagiarism Yes
Review by Single anonymous peer review
Peer reviewer comments 3
Editor who approved publication: Professor Robert Clarke
Jingjing Fan, Yunjian Tang, Kunming Wang, Shu Yang, Binlin Ma
Department of Breast and Thyroid Surgery, Cancer Hospital Affiliated to Xinjiang Medical University, Urumqi, Xinjiang, 830011, People’s Republic of China
Correspondence: Binlin Ma, Cancer Hospital Affiliated to Xinjiang Medical University, 789 Suzhou East Street, Xincheng District, Urumqi, Xinjiang, People’s Republic of China, Tel +86-991-7819082, Email [email protected]
Objective: The effect of chemotherapy in patients with breast cancer (BC) is uncertain. This study attempted to analyze serum microRNAs (miRNAs) in NAC resistant and sensitive BC patients and develop a miRNA-based nomogram model. To further help clinicians make treatment decisions for hormone receptor-positive patients.
Methods: A total of 110 BC patients with NAC were recruited and assigned in sensitive and resistant group, and 4 sensitive patients and 3 resistant patients were subjected to high-throughput sequencing. The functions of their target genes were analyzed by GO and KEGG. Five BC-related reported miRNAs were selected for expression pattern measurement by RT-qPCR and multivariate logistic analysis. The nomogram model was developed using R 4.0.1, and its predictive efficacy, consistency and clinical application value in development and validation groups were evaluated using ROC, calibration and decision curves.
Results: There were 44 differentially-expressed miRNAs in resistant BC patients. miR-3646, miR-4741, miR-6730-3p, miR-6831-5p and miR-8485 were candidate for resistance diagnosis in BC. Logistic multiple regression analysis showed that miR-4741 (or = 0.30, 95% CI = 0.08– 0.63, P = 0.02) and miR-6831-5p (or = 0.48, 95% CI = 0.24– 0.78, P = 0.01) were protective factors of BC resistance. The ROC curves showed a sensitivity of 0.884 and 0.750 for miR-4741 and miR-6831-5P as markers of resistance, suggesting that they can be used as independent risk factors for BC resistance. The other 3 miRNAs can be used as calibration factors to establish the risk prediction model of resistance in BC. In risk model, the prediction accuracy of resistance of BC is about 78%. 5-miRNA signature diagnostic models can help clinicians provide personalized treatment for NAC resistance BC patients to improve patient survival.
Conclusion: MiR-4741 and miR-6831-5p are independent risk factors for breast cancer resistance. This study constructed a nomogram model of NAC resistance in BC based on 5 differentially-expressed serum miRNAs.
Keywords: breast cancer, neoadjuvant chemotherapy, drug resistance, serum microRNAs, nomogram model, 5-miRNAs, GO and KEGG enrichment analyses
Introduction
Breast cancer (BC) remains a common problem affecting the health of women worldwide, and unquestionably, a leading cause of cancer-related deaths.1 The known methods of therapy for BC include chemotherapy, surgery, endocrine therapy, molecular targeted therapy, radiation, and neoadjuvant therapy.2,3 Neoadjuvant chemotherapy (NAC) refers to preoperative chemotherapy and has become a pivotal adjuvant treatment method for locally advanced BC.4 If reasonably adopted, NAC can effectively reduce the clinical staging of BC patients and increase the success rate of surgery and survival rate.5,6 Unfortunately, drug resistance is responsible for the failure of chemotherapy in Hormone receptor-positive (HR+) BC.7 It’s obvious that an effective method that can predict chemotherapy resistance before chemotherapy is of great significance for HR+ BC patients with drug resistance to avoid excessive chemotherapy and to determine the therapeutic strategy after surgery.
microRNAs (miRs/miRNAs) are endogenous single-strand RNAs with 19–25 nucleotides that negatively modulate the expression of their target genes.8 Former investigations have revealed the differential expression pattern of miRNAs in drug-resistant BC patients and its close association with drug resistance in BC.9,10 Cun et al11 found that miR-92a-3p is upregulated in sera of BC patients and correlated with tamoxifen resistance. Serum miRNAs might be a promising biomarker in the early diagnosis, treatment of sensitivity/drug resistance, and prognostic evaluation of different cancer types including BC.12–14 Therefore, the present study aimed to establish a drug resistance prediction model based on the differentially expressed serum miRNAs in drug-resistant BC. Recently, next-generation sequencing and microarray techniques have been increasingly adopted to measure miRNA expression levels.15,16 Next-generation sequencing can reveal differentially expressed miRNAs in exosomes of BC patients.17 Moreover, researchers have adopted the nomogram model to predict breast pathologic complete response of NAC in BC, which helps clinicians to formulate the most beneficial individualized treatment plan for BC patients.18 However, the construction of the NAC resistance prediction model to screen out serum miRNA biomarkers in BC has not been described. By the use of the high-throughput sequencing technology to screen out differentially expressed serum miRNAs in BC patients sensitive or resistant to chemotherapy and verification of a large number of clinical samples, we analyzed the function of differentially expressed miRNAs in chemosensitivity in BC and predicted NAC resistance in BC patients and explored the clinical application value of serum miRNAs by constructing the nomogram prediction model of drug resistance based on analysis of pre-processed data, hoping to offer new ideas for prognostic evaluation of BC.
Materials and Methods
Ethics Statement
This study was a retrospective cohort study approved by the Ethics Committee of Cancer Hospital Affiliated to Xinjiang Medical University, approval number, XJZ-CR-2019-017. All participants of this study signed the informed consent before enrollment. The research is Declaration of Helsinki.
Study Subjects
The serum samples were collected from 110 chemosensitive and chemoresistant BC patients treated in the Affiliated Tumor Hospital of Xinjiang Medical University from 2017 to 2022, all of whom were diagnosed with stage IIA to IIIC locally advanced BC and received NAC before surgery, consisting of 53 HER-2 (human epidermal growth factor receptor 2) negative patients who received 6 cycles of NAC by using TAC regimen and 57 HER-2 positive patients who received 6 cycles of TcbPH regimen and the targeted therapy. Hormone receptor-positive patients, including those with positive estrogen receptor (ER) and progesterone receptor (PR), received adjuvant endocrine therapy. The inclusion criteria were as follows: a) diagnosed as BC by pathology; b) complete and clear pathological data; c) receiving NAC. The exclusion criteria were as follows: a) inflammatory BC; b) distant metastasis; c) during pregnancy or lactation period; d) chemotherapy intolerance or reneging; e) with other serious diseases. The treatment efficacy was assessed by the response evaluation criteria in solid tumors:19 complete remission (CR), no tumor found by clinical means; partial remission (PR), reduction of breast mass > 50%; stable disease (SD), reduction of breast mass < 50% or enlargement < 25%; progressive disease (PD), enlargement of breast mass > 25%. Patients with CR and PR were considered chemotherapy-sensitive (N = 68), and patients with SD and PD were defined as chemotherapy-resistant (N = 42).
Data Collection
The general information and clinical data of study subjects were collected using patient information forms. General information included age, gender, nation, menstrual status, contact information and address. Clinical data consisted of tumor size, lymph node metastasis, number of lymph nodes, histological grade, molecular classification, vascular invasion, nerve invasion, ER, ER ratio, PR, PR ratio, HER-2, and Ki-67 expression. The BC tissue samples were collected by core needle puncture. According to the pathological diagnostic criteria of BC and ER and PR based nuclear staining, ER and PR negativity (-) were defined at the staining score of 0 or 1, and ER and PR positivity (+) were defined at the staining scores of 2 or 3. Through immunohistochemistry, as an immunohistochemical score of 3+, and HER-2 negativity (-) was defined at the immunohistochemical score of 0 or 1, and HER-2 positivity (+) was defined at the immunohistochemical scores of 2 or 3.
Collection and Treatment of Serum Samples
Firstly, 5 mL of fasting blood sample was collected from each participant by venipuncture before NAC treatment. The blood samples were then centrifuged at 1600 g for 10 min at 4 C. The upper serum was divided into 2 tubes and kept at −80 C. All these procedures were completed within 2 h of blood collection.
High-Throughput RNA Sequencing
Total RNA was extracted from sera following the protocols of TRIzol reagent (Invitrogen, Carlsbad, CA, USA). The RNA concentration and purity were detected using Nanodrop 2000 (Thermo Scientific Pierce, Waltham, MA, USA). The RNA integrity was detected by agarose gel electrophoresis and RNA electrophoresis. The extracted RNA satisfied with the following parameters: total concentration ≥ 5 μg, concentration ≥ 200 ng/μL, 1.8 ≤ OD260/280 ≤ 2.0. The paired-end sequencing library was constructed according to TruSeqTM strand. RNA sequencing was carried out on Hiseq4000 platform (Illumina, San Diego, CA, USA) by Xinjiang Ouyi Biotechnology (Xinjiang, China).
Bioinformatics Analysis
The Illumina 5’ and 3’ sequencing adapters were filtered using Cutadapt software (https://cutadapt.readthedocs.io/en/stable/guide.html#), and rRNA, tRNA, miscRNA, snRNA and snoRNA were removed using BLASTN software. The filtered sequences were searched again in the miRBase 21.0 database (http://mirbase.org/) to identify new miRNAs. The expression level of miRNA was calculated using DEGseq. The differentially expressed miRNAs were screened out using p < 0.05 and FC (fold change) > 2. The target genes of differentially expressed miRNAs were predicted using miRNA target software miRDB (http://www.mirdb.org/) and miRWALK (http://mirwalk.umm.uni-heidelberg.de/). GO and KEGG function classification of target genes regulated by differentially expressed miRNAs was conducted using Blast2GO software. The miRNA-target gene co-expression network was constructed using Cytoscape 3.6.1 (https://cytoscape.org/). Functional enrichment analysis of the 5 candidate serum miRNAs was performed using Reactome (https://reactome.org/).
RT-qPCR
Total RNA was extracted from serum samples using a TRIzol kit (ET111, TransGen Biotech, Beijing, China) and reversely transcribed into cDNA using a reverse transcription kit (QP013, GeneCopoeia, Rockville, MD, USA). RT-qPCR was run using ABI QuantStudioTM6 Flex (ABI, Foster City, CA, USA) under conditions of 5 s at 95 C and 40 cycles of 30s at 60 C and 2 min at 72 C. The primers were synthesized by Xinjiang Ouyi Biotechnology. The relative mRNA expression was estimated using the 2−ΔΔCt method. U6 was utilized as a reference gene. Table 1 shows the primer sequences.
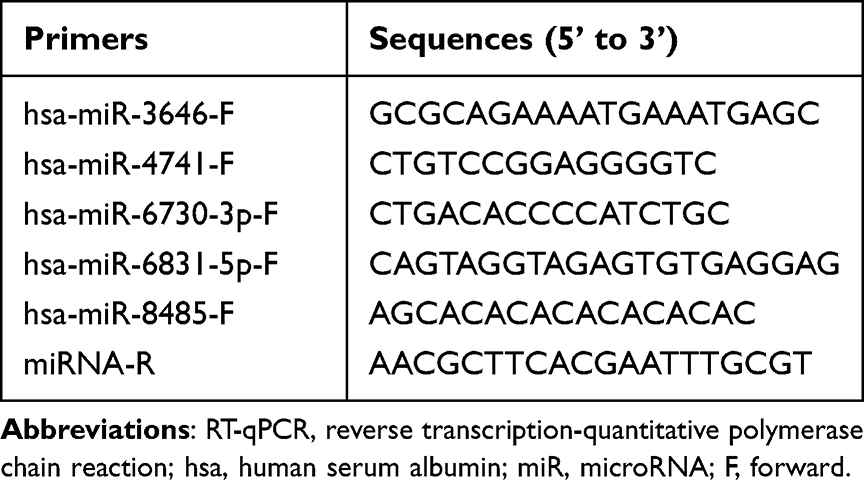 |
Table 1 RT-qPCR Primers Used in This Study |
Statistical Analysis
Statistical analysis was carried out using R software version 4.0.120,21 (R development core team; http://www.r-project.org) with the caret, rms, pROC packages. The p value of 0.05 was set as a significance level, and all tests were two-sided. We distributed 70% BC patients into the development group and 30% into the validation group at random to construct and validate the nomogram model. Data characteristics between groups were described and compared using chi-square test or t-test. The variables to develop the nomogram model were selected following the Akaike information criterion (AIC) using the stepwise selection method. The nomogram model validation consists of 3 parts: identification, calibration and clinical application. The discriminative ability of the nomogram model was assessed using the area under the curve (AUC) of ROC. The closer AUC to 1, the better the discriminative ability of the prediction model. The calibration of the prediction model refers to the consistency between the predicted result of the nomogram model and the observation probability, which was evaluated using the calibration curve. The decision curve analysis (DCA) was used to evaluate the clinical application value of the nomogram model.
Results
Comparison of the Baseline Characteristics of BC Patients
Table 2 shows the general information and clinical data of all the participants receiving NAC treatment (N = 110). The development group and validation group showed similar distribution of pathological parameters and no significant differences in age, nation, hsa-miR-3646, hsa-miR-4741, hsa-miR-6730-3p, hsa-miR-6831-5p, hsa-miR-8485, menopausal status, tumor diameter, lymph node metastasis, number of lymph nodes, histological grade, molecular classification, vascular invasion, nerve invasion, ER, ER ratio, PR, PR ratio, HER-2, and Ki-67 (all p > 0.05).
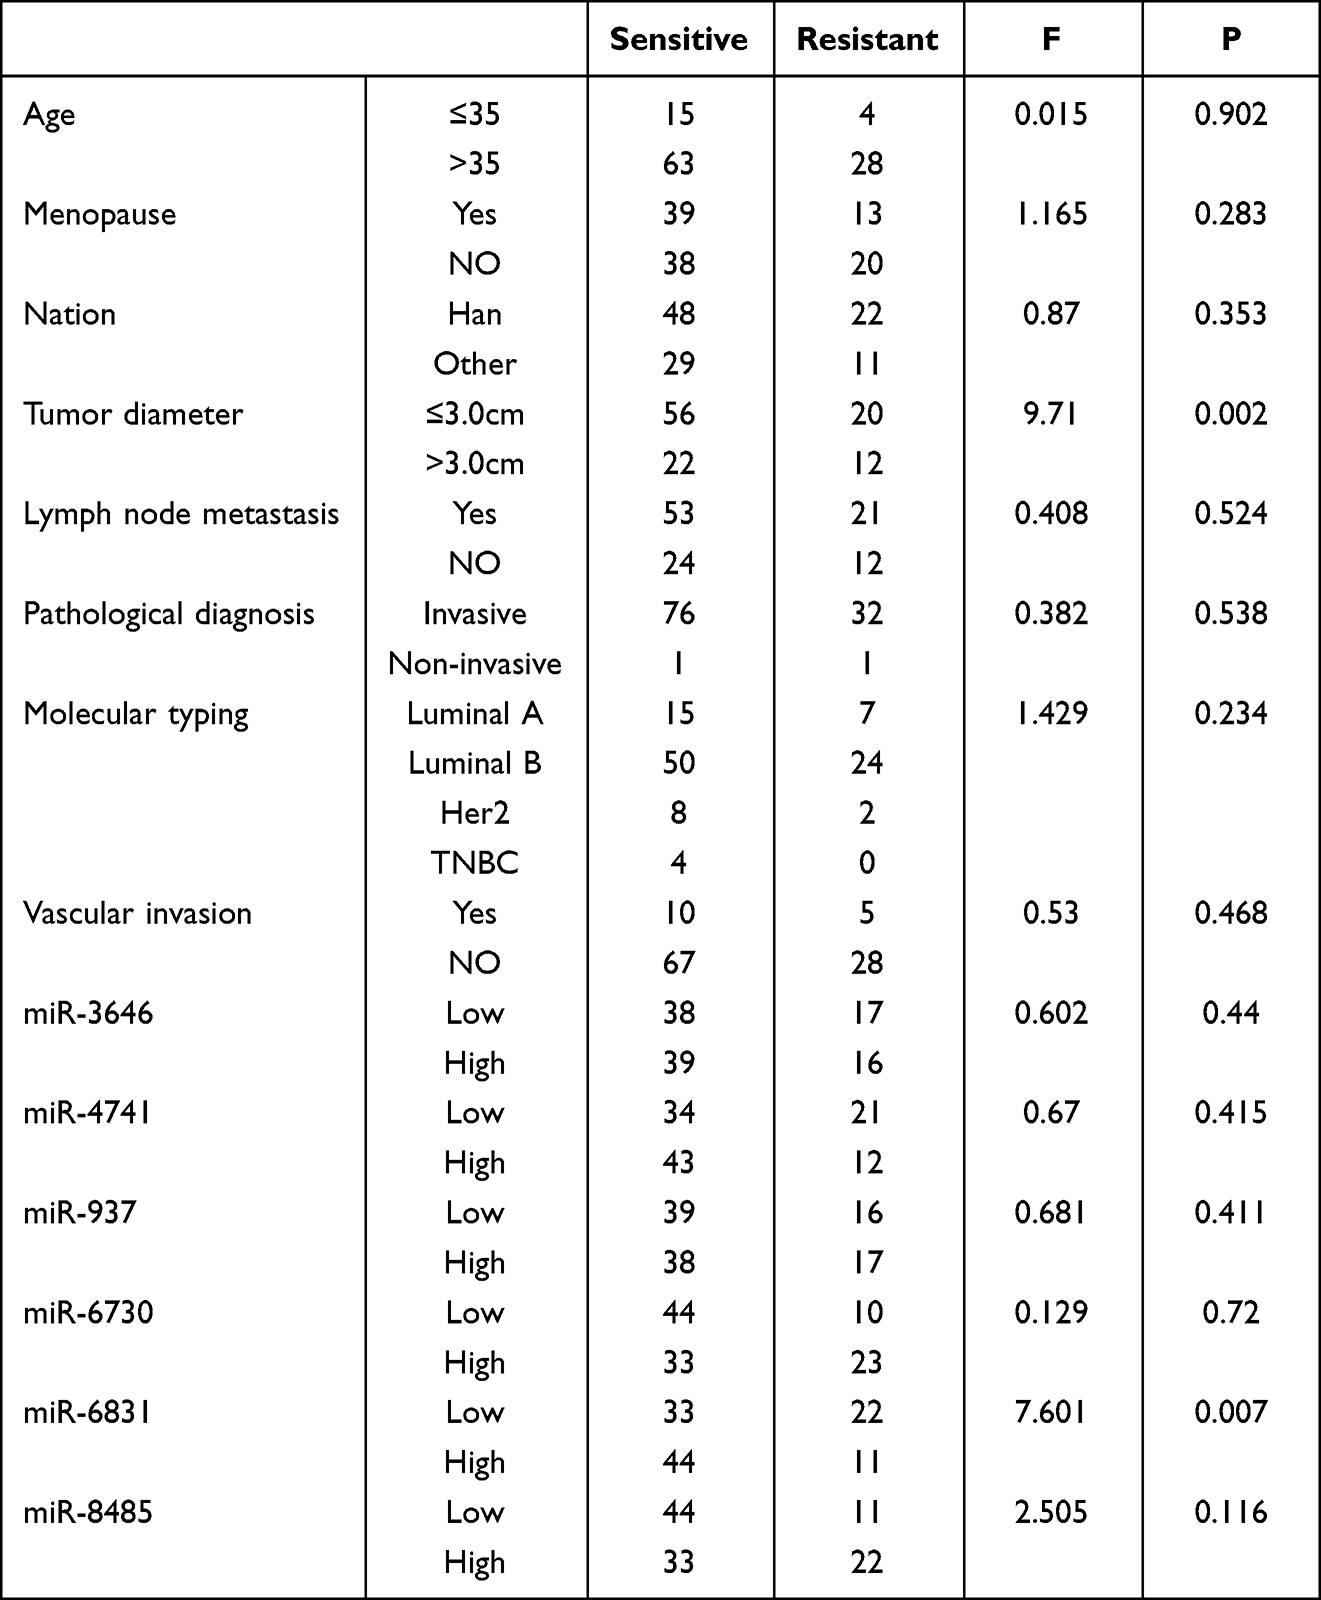 |
Table 2 Analysis of Clinical Characteristics and miRNA |
High-Throughput Sequencing Result of miRNAs in Chemosensitive and Chemoresistant BC Patients
To begin with, high-throughput sequencing (Illumina) of 4 serum samples from BC chemotherapy-sensitive patients and 3 serum samples from BC chemotherapy-resistant patients was conducted, with the presence of significant differences between groups (p < 0.05) and FC > 2 as screening standards. The differentially expressed miRNAs were screened out by bioinformatics analysis. Compared with chemotherapy-sensitive patients, chemotherapy-resistant patients had 44 differentially expressed genes in the sera, including 20 upregulated miRNAs and 24 downregulated miRNAs (all p < 0.05, Table 3, Figure 1).
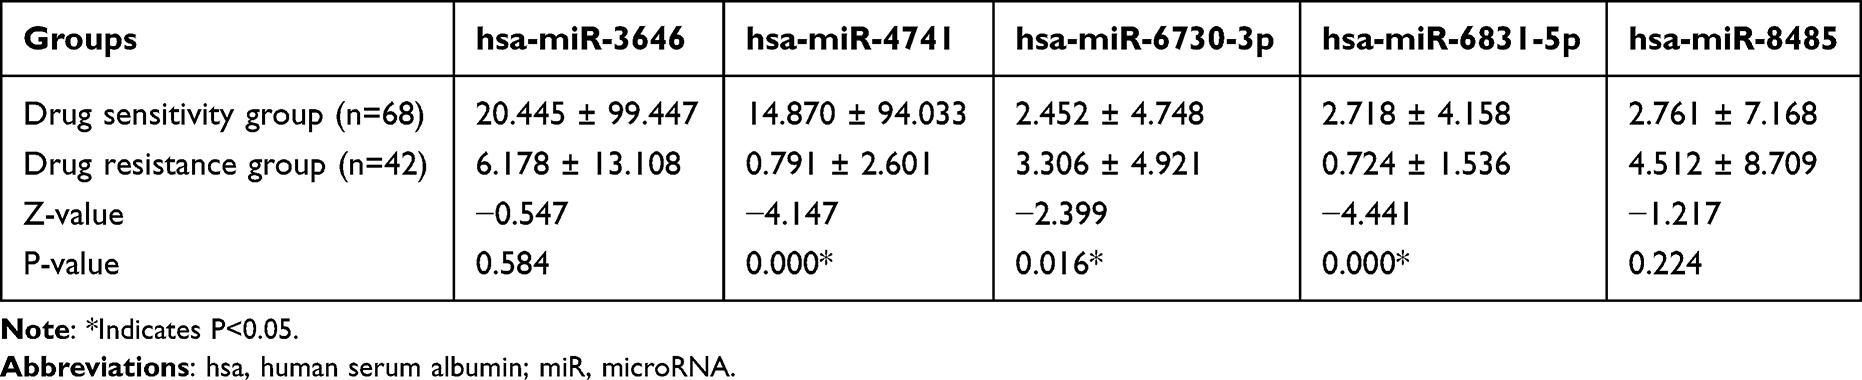 |
Table 3 Analysis of Expression Levels of miRNAs in Human Sera ( |

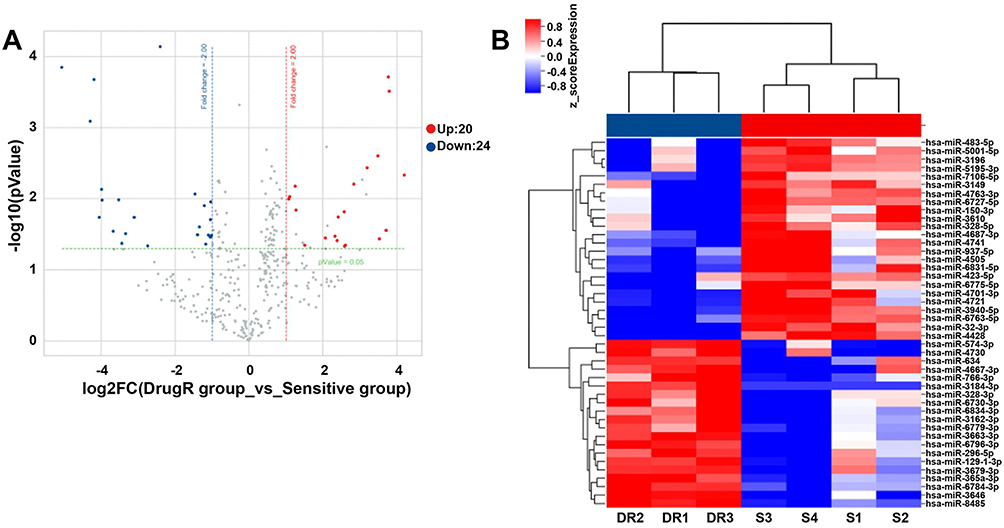 |
Figure 1 Analysis of differentially expressed miRNAs. (A) Volcano map of differentially expressed miRNAs, each dot representing one miRNA. Red dots represent upregulated miRNAs, blue dots represent downregulated miRNAs, and gray dots indicate no significant change. (B) Heat map of differentially expressed miRNA clusters. The abscissa shows the sample name and the ordinate shows the miRNA name. Red indicates upregulated expression and blue indicates downregulated expression. DR1-DR3 refer to chemoresistant serum sample, and S1-S4 refer to chemosensitive serum sample. |
Prediction and Enrichment Analysis of miRNA Target Genes
To further investigate the regulatory network of miRNAs, we analyzed the downstream target genes of 44 differentially expressed miRNAs on miRWALK and miRDB databases. Totally 869 target genes were predicted for the 44 differentially expressed miRNAs, among which 806 target genes were predicted on miRWALK database, and 75 on miRDB database, with 12 shared target genes (Figure 2A).
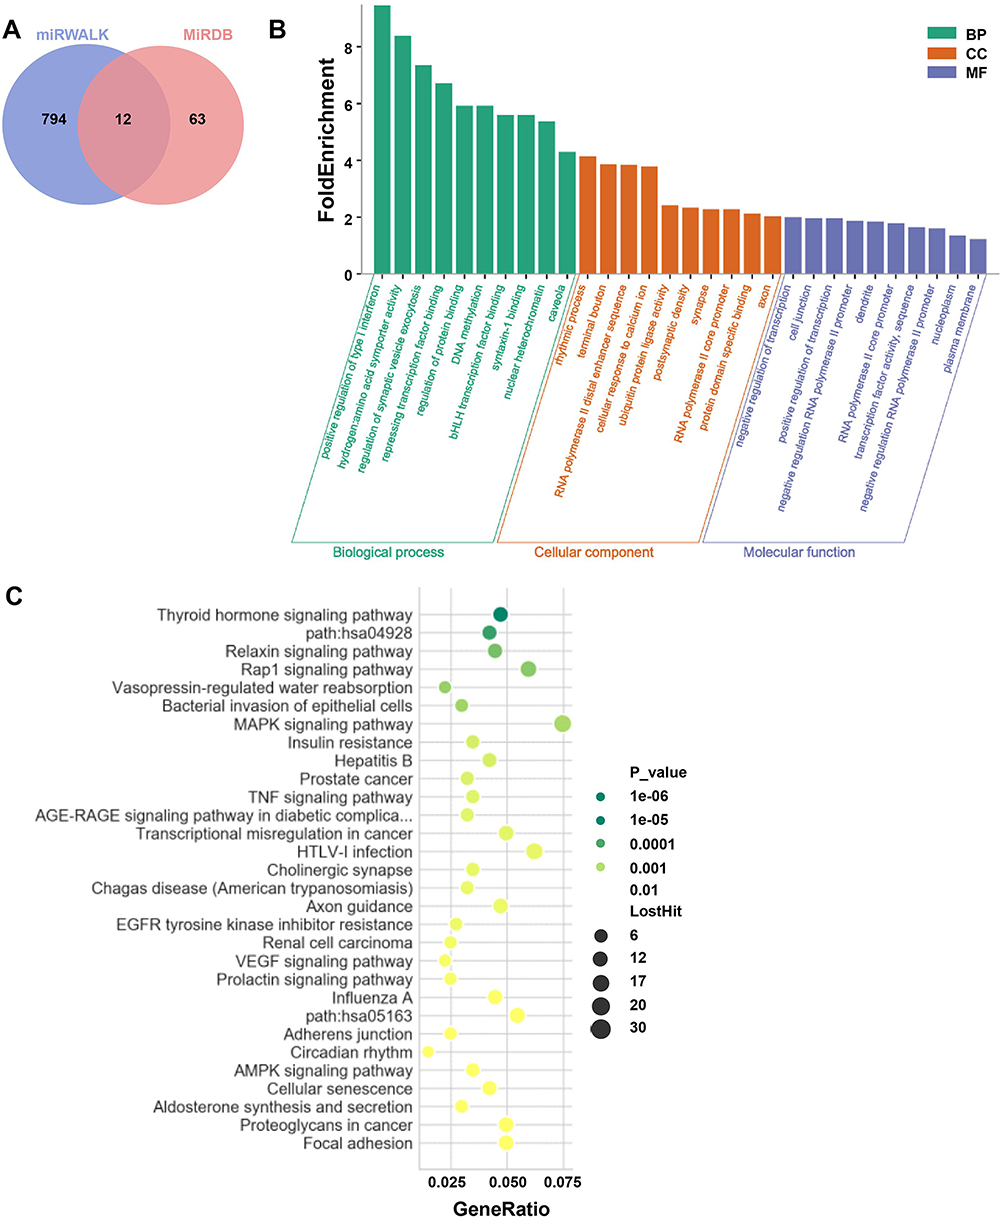 |
Figure 2 Prediction and enrichment analysis of miRNA target genes. (A) Venn Diagram of target genes regulated by 44 differentially expressed miRNAs analyzed on miRWALK and miRDB databases; (B) GO function enrichment analysis of target genes regulated by differentially expressed miRNAs using Blast2GO software; (C) KEGG signaling pathway enrichment analysis of target genes regulated by differentially expressed miRNAs. |
To understand the function of miRNAs, we conducted GO and KEGG enrichment analyses. GO enrichment analysis manifested target genes mainly participate in the positive regulation of type I interferon, amino acid transporter activity, and regulatory process of synaptic vesicle secretion (Figure 2B). KEGG analysis revealed that target genes are primarily engaged in the regulation of the thyroid hormone, MAPK, PI3K/Akt, and Rap1 signaling pathways (Figure 2C). The target genes of the differentially expressed miRNAs might be involved in the regulation of drug resistance in BC through the modulation of these functions and signaling pathways.
Expression Levels of Serum miRNAs in Chemoresistant and Chemosensitive BC Patients
To screen out miRNAs that are associated with chemotherapy resistance in BC, we identified 5 miRNAs in association with drug resistance in BC or BC progression among 40 differentially expressed miRNAs by literature review, including hsa-miR-3646, hsa-miR-4741, hsa-miR-6730-3p, hsa-miR-6831-5p and hsa-miR-8485. RT-qPCR revealed that hsa-miR-4741, hsa-miR-6730-3p, and hsa-miR-6831-5p were differentially expressed between chemosensitive and chemoresistant BC patients (Table 4, all p < 0.05). Hsa-miR-4741, hsa-miR-6730-3p, and hsa-miR-6831-5p might play pivotal roles in the progression and drug resistance in BC. Thereby, the 5-iRNA features might become the candidate diagnostic factors in chemoresistance in BC patients.
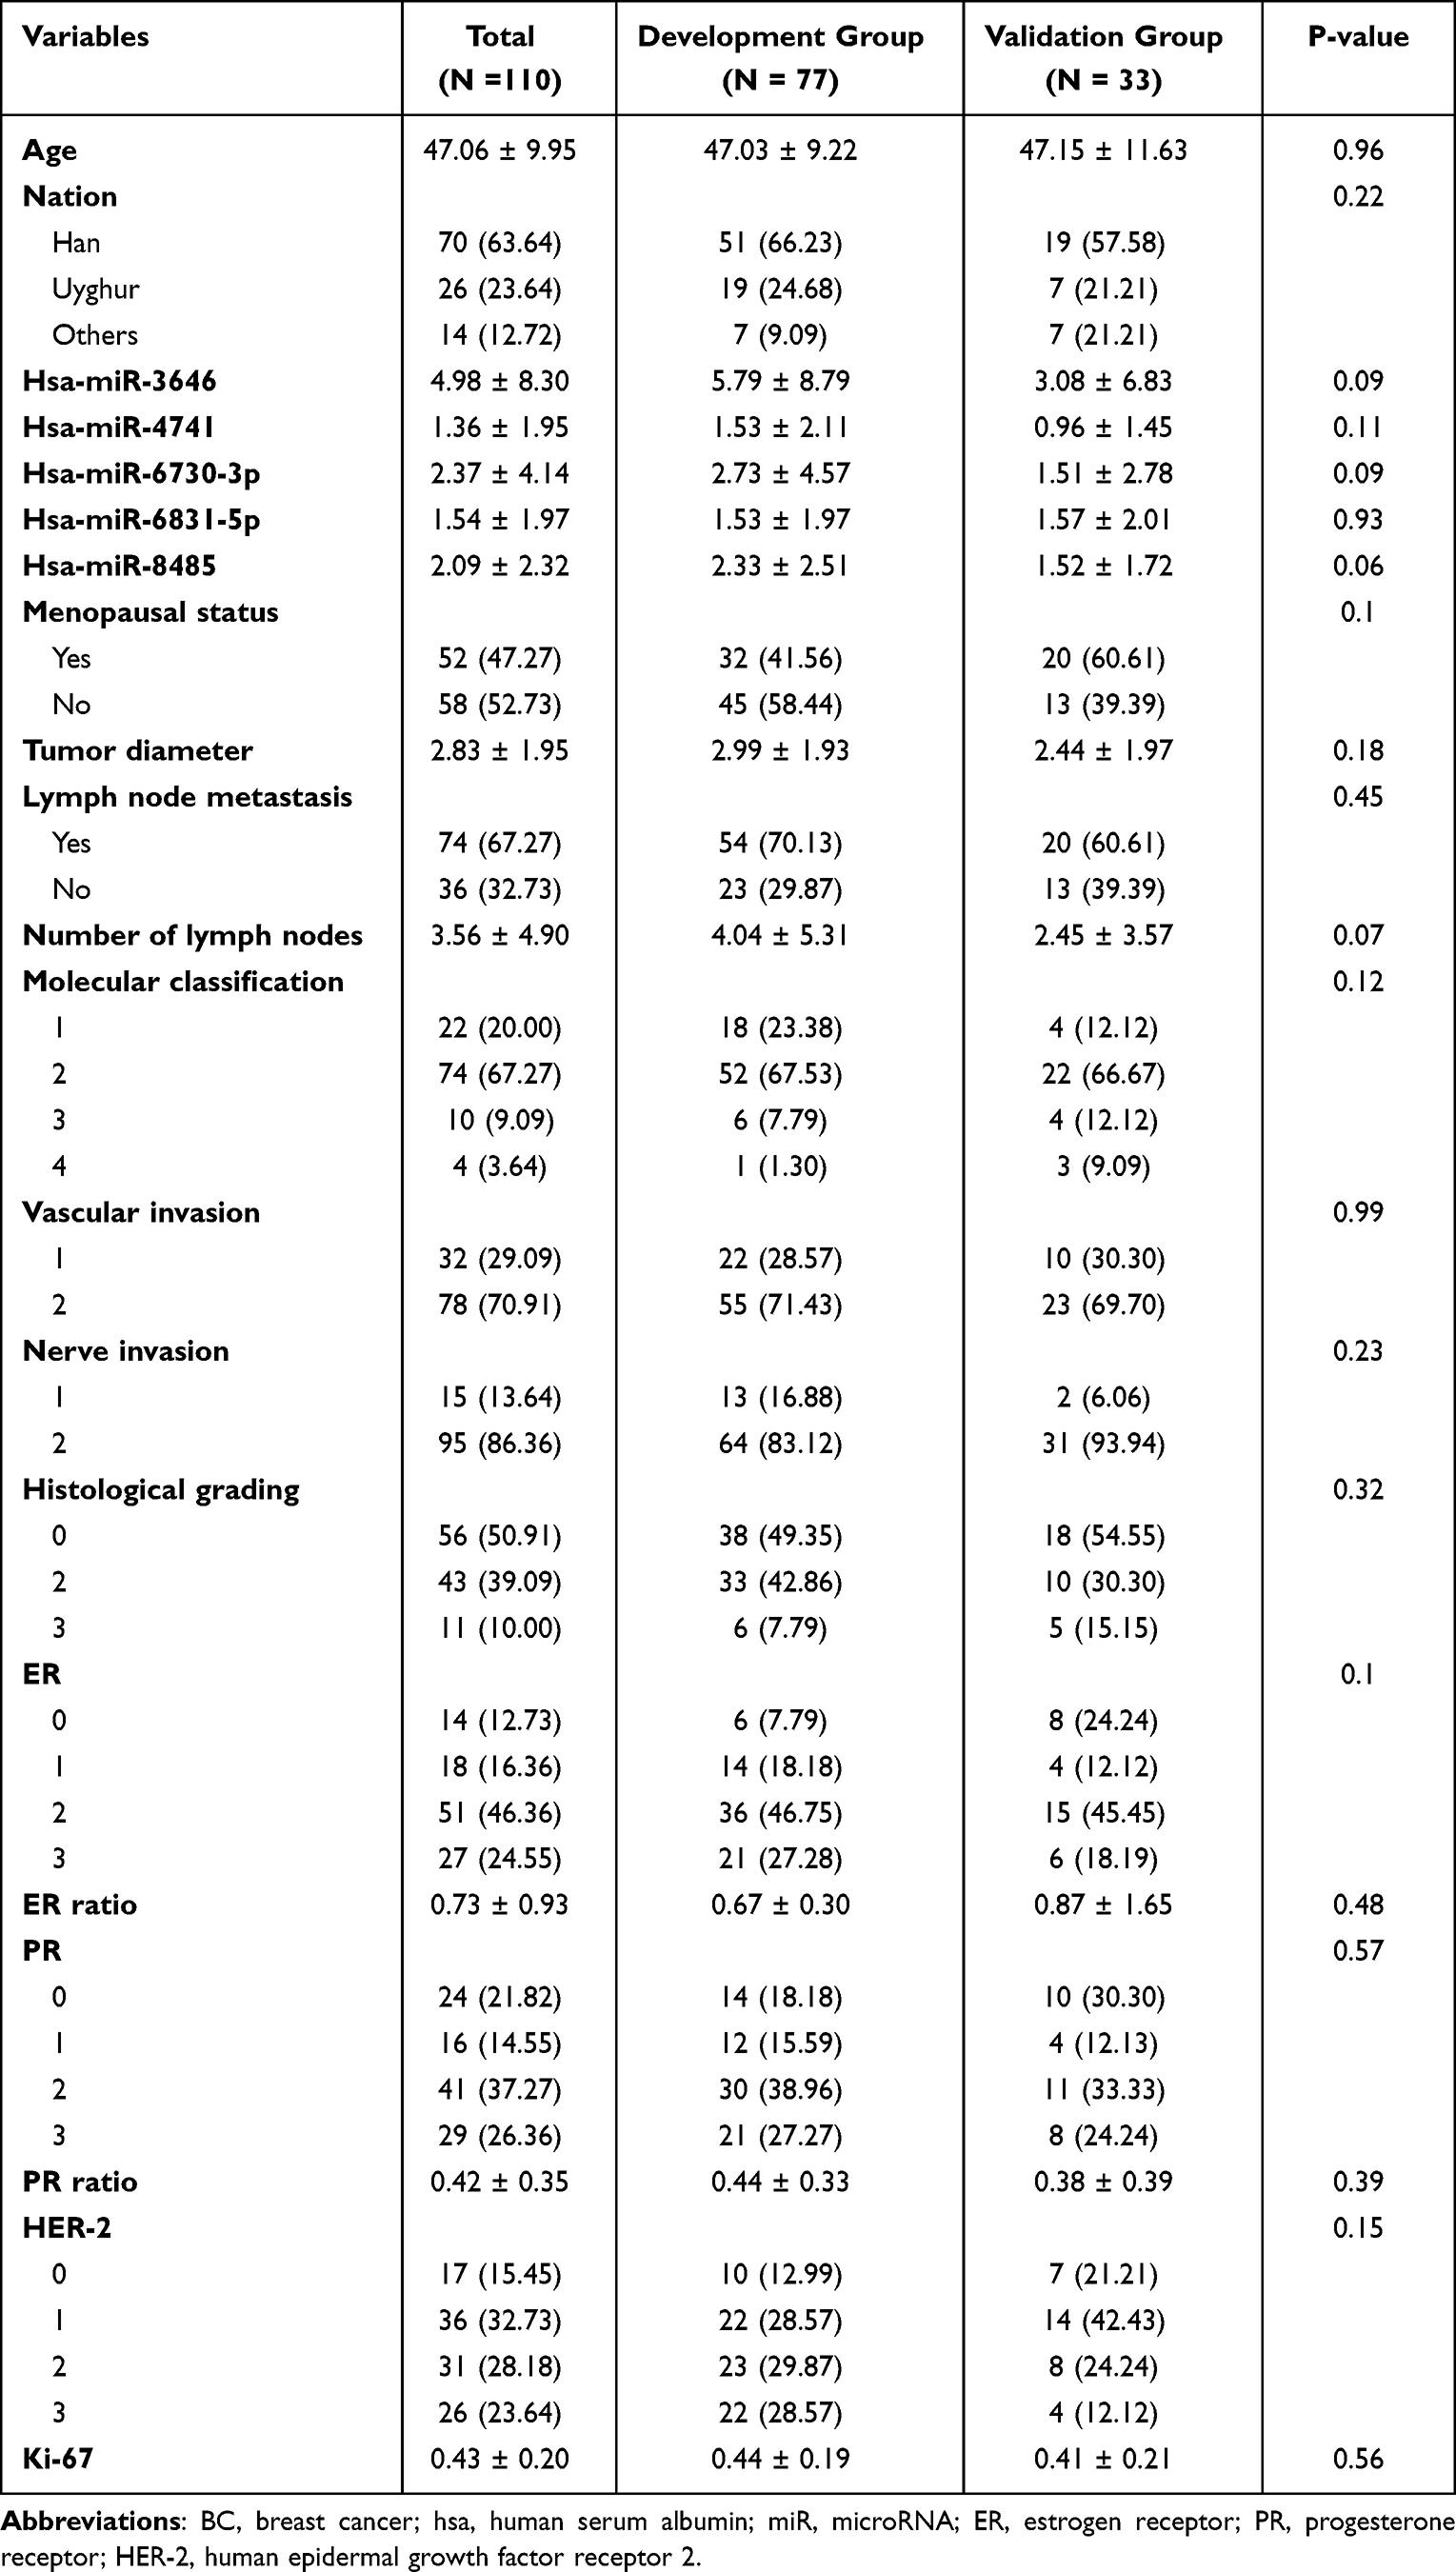 |
Table 4 General Information and Clinical Data of BC Patients |
Multivariate Logistics Regression Analysis and Establishment of Nomogram Model
Hsa-miR-3646, hsa-miR-4741, hsa-miR-6730-3p, hsa-miR-6831-5p, hsa-miR-8485, nation, ER ratio, and PR ratio were subjected multivariate logistic regression analysis (Table 5). The p value was relaxed to p < 0.15. Hsa-miR-3646, hsa-miR-4741, hsa-miR-6730-3p, hsa-miR-6831-5p, hsa-miR-8485, nation, ER ratio, and PR ratio were included in the nomogram prediction model for NAC resistance in BC using software R4.0.1 (Figure 3A). The Points and Total points of these factors were assessed through nomogram model to predict whether NAC resistance occurs. The consistency, predictive effect, and clinical application value of the nomogram model were examined using calibration curve, ROC curve, and decision curve. The calibration curve of the development group and validation group showed that the predicted calibration curve was closer to the standard curve (45 C straight line), indicating that the nomogram model had good consistency (Figure 3B). The AUCs for ROC curves in the development group and validation group were 0.884 and 0.750, respectively, suggesting that the nomogram model had good prediction ability (Figure 3C). The decision curve of the development group demonstrated higher net benefit of the nomogram model in predicting NAC resistance in BC than other models, and the net benefit of the nomogram model in predicting NAC resistance in BC was higher than other models in the validation group when the threshold value > 0.1, which elicited that the established nomogram prediction model had good clinical application value (Figure 3D).
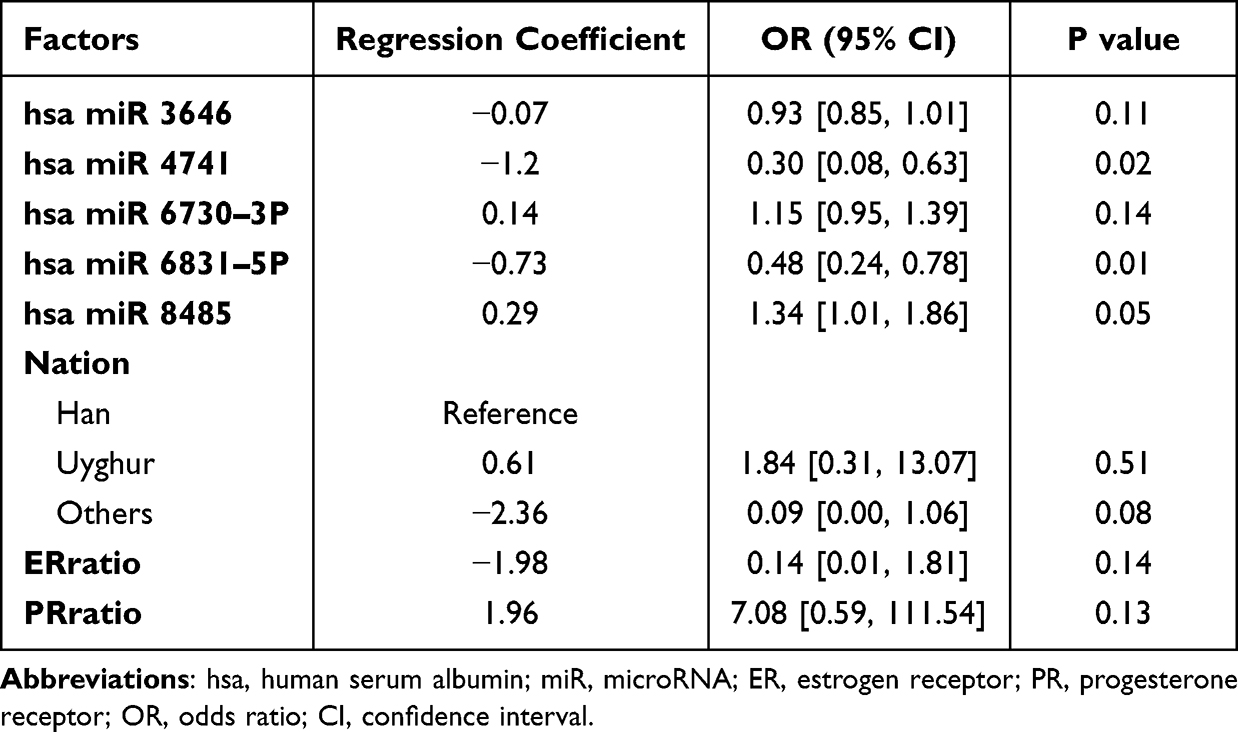 |
Table 5 Multivariate Logistic Regression Analysis of the Development Group |
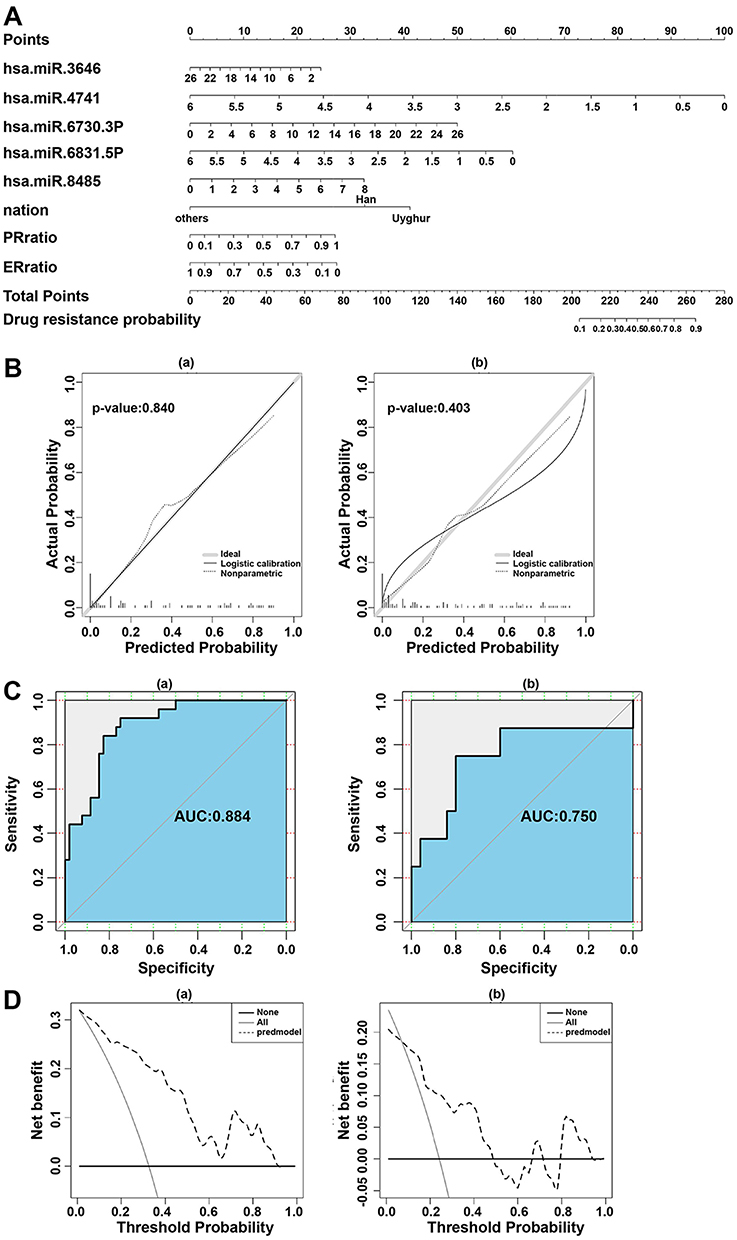 |
Figure 3 Establishment of nomogram model for the diagnosis of drug resistance in BC. (A) Nomogram model predicting drug resistance in BC patients; (B) calibration curve of the nomogram model in the development group (a) and validation group (b), with the X axis representing predicted probability and the Y axis representing the actual probability of drug resistance in BC patients through the nomogram model. The standard curve was a straight line with slope 1 through the origin of the axes. The closer the calibration curve to the standard curve, the better the consistency of the model; (C) ROC curve of the nomogram model in the development group (a) and validation group (b); (D) decision curve of the nomogram model in the development group (a) and validation group (b), with the Y axis representing net benefit and the X axis the threshold probability. The black solid line represents no intervention for all patients, the gray solid line represents intervention for all patients, and the dotted line represents the nomogram prediction model. |
Identification of Gene Sets Enriched with 5-miRNA Signature-Based Risk Score
To explore the possible mechanism of 5-miRNA in NAC resistance in BC, Reactome and KEGG signaling pathway analyses were carried out on 5-miRNA signatures in patients with high risk of drug resistance that was assessed through the nomogram model. Reactome function enrichment analysis disclosed that 5-miRNA signatures were enriched in inflammation, circulation, and metabolism, and bubble map showed the association between 5-miRNA signature with RHOJ GTPase cycle, cGMP effects, and signaling by GSK3beta (Figure 4A). Additionally, KEGG pathway analysis indicated that most target genes of the 5-miRNA were of paramount importance to the signaling pathways regulating pluripotency of stem cells, insulin, Ras, and ErbB pathways (Figure 4B). These results suggested that 5-miRNA signatures were most relevant to inflammation and cancer metastasis. Based on the KEGG analysis result, we hypothesized that immune escape promotes NAC resistance in BC, which might lead to higher drug resistance rates in patients with high-risk scores than patients with low-risk scores. Overall, the 5-miRNA signature was defined as the diagnostic factor of drug resistance in BC in the present paper.
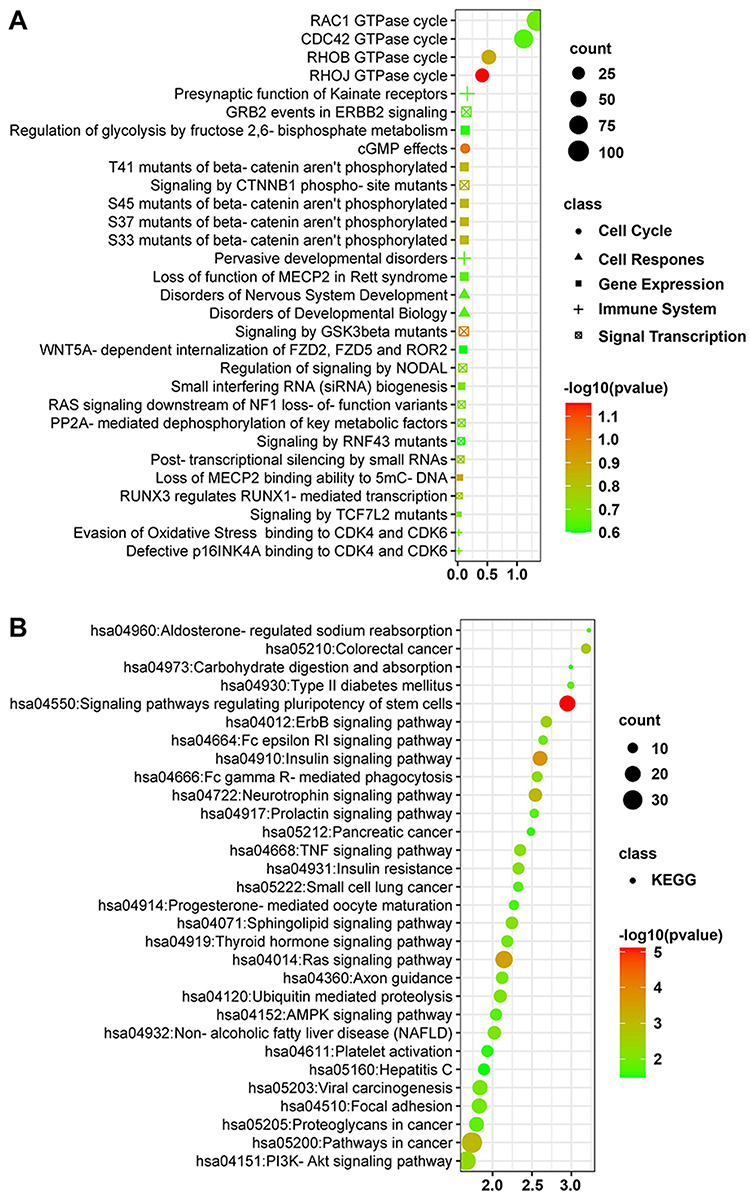 |
Figure 4 Identification of gene sets enriched with 5-miRNA signature-based risk score. (A) Reactome function enrichment analysis; (B) KEGG pathway analysis. |
TCGA Database Analysis
The expression of 5 miRNAs in breast cancer was analyzed by TCGA database. Only HSA-MIR-4741 and hsa-miR-6730 were found to be highly expressed in breast cancer (p = 2.416400e-04), the expression of hsa-miR-6730 was significantly lower in breast cancer (P = 6.38199999999367e-05) (Figure 5).
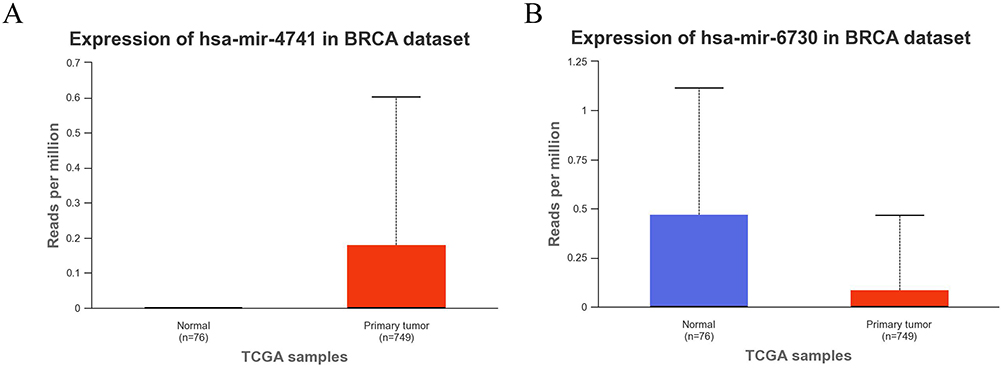 |
Figure 5 TCGA database analysis. (A) Hsa-miR-4741 is highly expressed in breast cancer; (B) Hsa-miR-6730 is low expressed in breast cancer. |
Discussion
Chemoresistance is a major contributor to the failure of anti-BC chemotherapy.22 In clinical work, patients with luminal-type breast cancer who are inconclusive in response to chemotherapy are less likely to respond to preoperative neoadjuvant therapy for a subset of patients whose tumors are 2–5 cm in diameter with or without lymph node metastasis, potentially contributing to disease progression; Whether neoadjuvant chemotherapy or surgical treatment should be given first is a difficult problem for clinicians. For some patients with HR (+) advanced breast cancer who can be treated with chemotherapy or endocrine therapy to reduce tumor burden more rapidly, there is an urgent need for accurate prediction models of chemotherapy resistance risk to assist clinical decision-making. It’s a known fact that miRNA expression levels can inform the response to chemotherapy in BC.23 Hence, this study for the first time constructed a nomogram prediction model of NAC resistance in HR(+) BC based on multiple serum miRNAs, which could help clinicians predict whether NAC resistance occurs in HR(+) BC patients in a convenient and non-invasive manner, optimize clinical treatment plan to preclude delay in the implementation of other therapeutic approaches and condition advancement due to unnecessary preoperative NAC.
As indicated in a previous study, some miRNAs play key roles in regulating BC NAC resistance and have the potential to become NAC response predictors, prognosticators, and therapeutic targets.24 First of all, we screened out 44 differentially expressed miRNAs in sera of the 3 selected chemoresistant BC patients by high-throughput sequencing and bioinformatics analysis, 20 of which were upregulated, and 24 were downregulated. Subsequently, we identified 12 shared target genes for these miRNAs. GO enrichment analysis revealed the engagement of target genes in the regulation of type I interferon, amino acid transporter, and synaptic vesicle secretion. KEGG analysis demonstrated that these target genes were enriched in the thyroid hormone pathway, MAPK pathway, PI3K/Akt pathway, and Rap1 pathway. Thereby, the target genes of the differentially expressed miRNAs might modulate chemoresistance in BC through above-mentioned functions and pathways.
Furthermore, we identified 5 miRNAs related to BC chemoresistance or development by literature review, including hsa-miR-3646, hsa-miR-4741, hsa-miR-6730-3p, hsa-miR-6831-5p and hsa-miR-8485. miR-3646 is a highly expressed miRNA in docetaxel-resistant BC cells.25 Our results indicated that hsa-miR-4741, hsa-miR-6730-3p, and hsa-miR-6831-5p were differentially expressed between chemosensitive and chemoresistant BC patients. miR-4741 is implicated in the common miRNA signatures for colon and rectal cancer.26 miR-6730-3p increases proliferation of melanoma cells.27 miR-6831-5p is upregulated in bladder cancer.28 We inferred that hsa-miR-4741, hsa-miR-6730-3p, and hsa-miR-6831-5p play essential roles in BC development and chemoresistance. We thereafter selected hsa-miR-3646, hsa-miR-4741, hsa-miR-6730-3p, hsa-miR-6831-5p and hsa-miR-8485 as study subjects.
The ethnocultural disparities might have a role to play in the screening, diagnosis, management and prognosis of BC patients.29 The positive expression of ERα is in association with chemoresistance in BC.30 PR expression is beneficial to the resistance of BC cells to gemcitabine.31 Then, we included hsa-miR-3646, hsa-miR-4741, hsa-miR-6730-3p, hsa-miR-6831-5p, hsa-miR-8485, nation, ER ratio and PR ratio for the multivariate logistic regression analysis and the development of the nomogram model. The nomogram model has potential predictive values and practical implications in BC.32 In our study, the nomogram model showed good consistency, predictive effect, and clinical application value.
Inflammation, circulation, and metabolism constitute a mechanism of chemoresistance in BC.33 Reactome function enrichment analysis revealed that the signatures of above 5 miRNAs were enriched in inflammation, circulation, and metabolism. The regulation of Rho-GTPase can regulate cell shape in triple negative BC.34 The production of cGMP is implicated in the regulation of chemosensitivity in BC cells.35 GSK3β induces chemoresistance in BC by regulating Akt phosphorylation.36 We found that the 5-miRNA signatures were related to RHOJ GTPase cycle, cGMP effects, and signaling by GSK3β. Most of the target genes of the 5 miRNAs play essential roles in signaling pathways regulating stem cell pluripotency, insulin, and Ras and ErbB pathways, which are important participants in inflammation and metastasis in cancers.37–40 These results further suggested the association between 5-miRNA signatures and inflammation and metastasis. All in all, this study illuminated that the 5-miRNA signatures could be regarded as the diagnostic factor of drug resistance in BC.
The present study had two major limitations. First, the sample size we included was relatively small. Second, the downstream target genes and pathways of the 5 miRNAs and the deeper drug resistance mechanism in BC were not explored at the cellular level. In future investigations, we shall expand the sample size to further validate the clinical value and availability of the 5-miRNA drug resistance diagnostic factors and nomogram prediction model, and conduct cell experiments to further dig into the deep mechanism of NAC resistance in BC.
Data Sharing Statement
The datasets used or analysed during the current study are available from the corresponding author on reasonable request.
Ethics Statement
This study was a retrospective cohort study approved by the Ethics Committee of Cancer Hospital Affiliated to Xinjiang Medical University, approval number XJZ-CR-2019-017. All participants of this study signed the informed consent before enrollment.
Consent for Publication
Informed consent was obtained from all individual participants included in the study.
Author Contributions
All authors made substantial contributions to conception and design, acquisition of data, or analysis and interpretation of data; took part in drafting the article or revising it critically for important intellectual content; agreed to submit to the current journal; gave final approval of the version to be published; and agree to be accountable for all aspects of the work.
Funding
This study was supported by Clinical Research Project by the Affiliated Cancer Hospital of Xinjiang Medical University, project number: 2019CL01001 and Key Laboratory Open Subject of Xinjiang Uyghur Autonomous Region, project number: 2020D04026.
Disclosure
The authors report no conflicts of interest in this work.
References
1. Anastasiadi Z, Lianos GD, Ignatiadou E, Harissis HV, Mitsis M. Breast cancer in young women: an overview. Updates Surg. 2017;69:313–317. doi:10.1007/s13304-017-0424-1
2. Hashemzadeh N, Dolatkhah M, Adibkia K, et al. Recent advances in breast cancer immunotherapy: the promising impact of nanomedicines. Life Sci. 2021;271:119110. doi:10.1016/j.lfs.2021.119110
3. McDonald ES, Clark AS, Tchou J, Zhang P, Freedman GM. Clinical diagnosis and management of breast cancer. J Nucl Med. 2016;57(Suppl 1):9S–16S. doi:10.2967/jnumed.115.157834
4. Haddad TC, Goetz MP. Landscape of neoadjuvant therapy for breast cancer. Ann Surg Oncol. 2015;22:1408–1415. doi:10.1245/s10434-015-4405-7
5. Zhang X, Li H, Wu F, et al. clinical observation of zhengyuan capsule combined with neoadjuvant chemotherapy for triple-negative breast cancer. Evid Based Complement Alternat Med. 2022;2022:1375724. doi:10.1155/2022/1375724
6. Wang M, Hou L, Chen M, et al. Neoadjuvant chemotherapy creates surgery opportunities for inoperable locally advanced breast cancer. Sci Rep. 2017;7:44673. doi:10.1038/srep44673
7. Huang J, Li H, Ren G. Epithelial-mesenchymal transition and drug resistance in breast cancer (Review). Int J Oncol. 2015;47:840–848. doi:10.3892/ijo.2015.3084
8. Lu TX, Rothenberg ME. MicroRNA. J Allergy Clin Immunol. 2018;141:1202–1207. doi:10.1016/j.jaci.2017.08.034
9. Si Z, Zhong Y, Lao S, Wu Y, Zhong G, Zeng W. The role of miRNAs in the resistance of anthracyclines in breast cancer: a systematic review. Front Oncol. 2022;12:899145. doi:10.3389/fonc.2022.899145
10. Baldassari F, Zerbinati C, Galasso M, et al. Screen for MicroRNA and drug interactions in breast cancer cell lines points to miR-126 as a modulator of CDK4/6 and PIK3CA inhibitors. Front Genet. 2018;9:174. doi:10.3389/fgene.2018.00174
11. Cun J, Yang Q. Bioinformatics-based interaction analysis of miR-92a-3p and key genes in tamoxifen-resistant breast cancer cells. Biomed Pharmacother. 2018;107:117–128. doi:10.1016/j.biopha.2018.07.158
12. Shimomura A, Shiino S, Kawauchi J, et al. Novel combination of serum microRNA for detecting breast cancer in the early stage. Cancer Sci. 2016;107:326–334. doi:10.1111/cas.12880
13. Isca C, Piacentini F, Mastrolia I, et al. Circulating and intracellular miRNAs as prognostic and predictive factors in HER2-positive early breast cancer treated with neoadjuvant chemotherapy: a review of the literature. Cancers. 2021;13(19):4894. doi:10.3390/cancers13194894
14. Carvalho TM, Brasil GO, Jucoski TS, et al. MicroRNAs miR-142-5p, miR-150-5p, miR-320a-3p, and miR-4433b-5p in serum and tissue: potential biomarkers in sporadic breast cancer. Front Genet. 2022;13:865472. doi:10.3389/fgene.2022.865472
15. Wu Q, Wang C, Lu Z, Guo L, Ge Q. Analysis of serum genome-wide microRNAs for breast cancer detection. Clin Chim Acta. 2012;413:1058–1065. doi:10.1016/j.cca.2012.02.016
16. Pimentel F, Bonilla P, Ravishankar YG, et al. Technology in MicroRNA profiling: circulating MicroRNAs as noninvasive cancer biomarkers in breast cancer. J Lab Autom. 2015;20:574–588. doi:10.1177/2211068214561788
17. Wu H, Wang Q, Zhong H, et al. Differentially expressed microRNAs in exosomes of patients with breast cancer revealed by next-generation sequencing. Oncol Rep. 2020;43:240–250. doi:10.3892/or.2019.7401
18. Li Y, Zhang J, Wang B, Zhang H, He J, Wang K. A nomogram based on clinicopathological features and serological indicators predicting breast pathologic complete response of neoadjuvant chemotherapy in breast cancer. Sci Rep. 2021;11:11348. doi:10.1038/s41598-021-91049-x
19. Eisenhauer EA, Therasse P, Bogaerts J, et al. New response evaluation criteria in solid tumours: revised RECIST guideline (version 1.1). Eur J Cancer. 2009;45:228–247. doi:10.1016/j.ejca.2008.10.026
20. Chen S, Zhang Y, Ding X, Li W. Identification of lncRNA/circRNA-miRNA-mRNA ceRNA network as biomarkers for hepatocellular carcinoma. Front Genet. 2022;13:838869. PMID: 35386284; PMCID: PMC8977626. doi:10.3389/fgene.2022.838869
21. Zhang J, Liu Y, Shi G. The circRNA-miRNA-mRNA regulatory network in systemic lupus erythematosus. Clin Rheumatol. 2021;40(1):331–339. PMID: 32533339. doi:10.1007/s10067-020-05212-2
22. Ji X, Lu Y, Tian H, Meng X, Wei M, Cho WC. Chemoresistance mechanisms of breast cancer and their countermeasures. Biomed Pharmacother. 2019;114:108800. doi:10.1016/j.biopha.2019.108800
23. Davey MG, Lowery AJ, Miller N, Kerin MJ. MicroRNA expression profiles and breast cancer chemotherapy. Int J Mol Sci. 2021;22:10812. doi:10.3390/ijms221910812
24. Lou W, Liu J, Ding B, Xu L, Fan W. Identification of chemoresistance-associated miRNAs in breast cancer. Cancer Manag Res. 2018;10:4747–4757. doi:10.2147/CMAR.S172722
25. Zhang X, Zhong S, Xu Y, et al. MicroRNA-3646 contributes to docetaxel resistance in human breast cancer cells by GSK-3beta/beta-catenin signaling pathway. PLoS One. 2016;11:e0153194. doi:10.1371/journal.pone.0153194
26. Cojocneanu R, Braicu C, Raduly L, et al. Plasma and tissue specific miRNA expression pattern and functional analysis associated to colorectal cancer patients. Cancers. 2020;12:843. doi:10.3390/cancers12040843
27. Pegoraro A, De Marchi E, Ferracin M, et al. P2X7 promotes metastatic spreading and triggers release of miRNA-containing exosomes and microvesicles from melanoma cells. Cell Death Dis. 2021;12:1088. doi:10.1038/s41419-021-04378-0
28. Usuba W, Urabe F, Yamamoto Y, et al. Circulating miRNA panels for specific and early detection in bladder cancer. Cancer Sci. 2019;110:408–419. doi:10.1111/cas.13856
29. Ginsburg OM, Fischer HD, Shah BR, et al. A population-based study of ethnicity and breast cancer stage at diagnosis in Ontario. Curr Oncol. 2015;22:97–104. doi:10.3747/co.22.2359
30. Jiang Z, Guo J, Shen J, Jin M, Xie S, Wang L. The role of estrogen receptor alpha in mediating chemoresistance in breast cancer cells. J Exp Clin Cancer Res. 2012;31:42. doi:10.1186/1756-9966-31-42
31. Grant E, Bucklain FA, Ginn L, Laity P, Ciani B, Bryant HE. Progesterone receptor expression contributes to gemcitabine resistance at higher ECM stiffness in breast cancer cell lines. PLoS One. 2022;17:e0268300. doi:10.1371/journal.pone.0268300
32. Deng ZM, Hu W, Dai FF, Yuan MQ, Hu M, Cheng YX. Immune-related genes to construct a novel prognostic model of breast cancer: a chemosensitivity-based study. Front Immunol. 2021;12:734745. doi:10.3389/fimmu.2021.734745
33. Pires BRB, Panis C, Alves VD, et al. Label-free proteomics revealed oxidative stress and inflammation as factors that enhance chemoresistance in luminal breast cancer. Oxid Med Cell Longev. 2019;2019:5357649. doi:10.1155/2019/5357649
34. Zheng L, Xiang C, Li X, et al. STARD13-correlated ceRNA network-directed inhibition on YAP/TAZ activity suppresses stemness of breast cancer via co-regulating Hippo and Rho-GTPase/F-actin signaling. J Hematol Oncol. 2018;11:72. doi:10.1186/s13045-018-0613-5
35. Frederiksen LJ, Sullivan R, Maxwell LR, et al. Chemosensitization of cancer in vitro and in vivo by nitric oxide signaling. Clin Cancer Res. 2007;13:2199–2206. doi:10.1158/1078-0432.CCR-06-1807
36. Gao C, Yuan X, Jiang Z, et al. Regulation of AKT phosphorylation by GSK3beta and PTEN to control chemoresistance in breast cancer. Breast Cancer Res Treat. 2019;176:291–301. doi:10.1007/s10549-019-05239-3
37. Zhou BB. Targeting ligand cleavage to inhibit the ErbB pathway in cancer. Ann N Y Acad Sci. 2005;1059:56–60. doi:10.1196/annals.1339.022
38. Rose DP, Gracheck PJ, Vona-Davis L. The interactions of obesity, inflammation and insulin resistance in breast cancer. Cancers. 2015;7:2147–2168.
39. Castellano E, Molina-Arcas M, Krygowska AA, et al. RAS signalling through PI3-Kinase controls cell migration via modulation of Reelin expression. Nat Commun. 2016;7:11245. doi:10.1038/ncomms11245
40. Afify SM, Seno M. Conversion of stem cells to cancer stem cells: undercurrent of cancer initiation. Cancers. 2019;11:345. doi:10.3390/cancers11030345
 © 2023 The Author(s). This work is published and licensed by Dove Medical Press Limited. The full terms of this license are available at https://www.dovepress.com/terms.php and incorporate the Creative Commons Attribution - Non Commercial (unported, v3.0) License.
By accessing the work you hereby accept the Terms. Non-commercial uses of the work are permitted without any further permission from Dove Medical Press Limited, provided the work is properly attributed. For permission for commercial use of this work, please see paragraphs 4.2 and 5 of our Terms.
© 2023 The Author(s). This work is published and licensed by Dove Medical Press Limited. The full terms of this license are available at https://www.dovepress.com/terms.php and incorporate the Creative Commons Attribution - Non Commercial (unported, v3.0) License.
By accessing the work you hereby accept the Terms. Non-commercial uses of the work are permitted without any further permission from Dove Medical Press Limited, provided the work is properly attributed. For permission for commercial use of this work, please see paragraphs 4.2 and 5 of our Terms.