Back to Journals » Breast Cancer: Targets and Therapy » Volume 15
ABVS-Based Radiomics for Early Predicting the Efficacy of Neoadjuvant Chemotherapy in Patients with Breast Cancers
Authors Jiang W, Deng X, Zhu T, Fang J, Li J
Received 24 April 2023
Accepted for publication 11 August 2023
Published 15 August 2023 Volume 2023:15 Pages 625—636
DOI https://doi.org/10.2147/BCTT.S418376
Checked for plagiarism Yes
Review by Single anonymous peer review
Peer reviewer comments 2
Editor who approved publication: Professor Pranela Rameshwar
Wei Jiang, Xiaofei Deng, Ting Zhu, Jing Fang, Jinyao Li
Department of Ultrasound, Huazhong University of Science and Technology Union Shenzhen Hospital (Nanshan Hospital), Shenzhen, Guangdong province, People’s Republic of China
Correspondence: Wei Jiang, Department of Ultrasound, Huazhong University of Science and Technology Union Shenzhen Hospital (Nanshan Hospital), No. 89 Taoyuan Road, Nanshan District, Shenzhen, Guangdong province, 518052, People’s Republic of China, Tel + 86- 13026628099, Email [email protected]
Background: Neoadjuvant chemotherapy (NAC) plays a significant role in breast cancer (BC) management; however, its efficacy varies among patients. Current evaluation methods may lead to delayed treatment alterations, and traditional imaging modalities often yield inaccurate results. Radiomics, an emerging field in medical imaging, offers potential for improved tumor characterization and personalized medicine. Nevertheless, its application in early and accurately predicting NAC response remains underinvestigated.
Objective: This study aims to develop an automated breast volume scanner (ABVS)-based radiomics model to facilitate early detection of suboptimal NAC response, ultimately promoting personalized therapeutic approaches for BC patients.
Methods: This retrospective study involved 248 BC patients receiving NAC. Standard guidelines were followed, and patients were classified as responders or non-responders based on treatment outcomes. ABVS images were obtained before and during NAC, and radiomics features were extracted using the PyRadiomics toolkit. Inter-observer consistency and hierarchical feature selection were assessed. Three machine learning classifiers, logistic regression, support vector machine, and random forest, were trained and validated using a five-fold cross-validation with three repetitions. Model performance was comprehensively evaluated based on discrimination, calibration, and clinical utility.
Results: Of the 248 BC patients, 157 (63.3%) were responders, and 91 (36.7%) were non-responders. Radiomics feature selection revealed 7 pre-NAC and 6 post-NAC ABVS features, with higher weights for post-NAC features (min > 0.05) than pre-NAC (max < 0.03). The three post-NAC classifiers demonstrated AUCs of approximately 0.9, indicating excellent discrimination. DCA curves revealed a substantial net benefit when the threshold probability exceeded 40%. Conversely, the three pre-NAC classifiers had AUCs between 0.7 and 0.8, suggesting moderate discrimination and limited clinical utility based on their DCA curves.
Conclusion: The ABVS-based radiomics model effectively predicted suboptimal NAC responses in BC patients, with early post-NAC classifiers outperforming pre-NAC classifiers in discrimination and clinical utility. It could enhance personalized treatment and improve patient outcomes in BC management.
Keywords: breast cancer, neoadjuvant chemotherapy, radiomics, automated breast volume scanner, prediction model, model validation comparison
Introduction
Neoadjuvant chemotherapy (NAC) plays a crucial role in managing breast cancer (BC) by facilitating tumor size reduction, transforming inoperable cases into operable ones, and increasing the chances of breast-conserving surgery. This treatment is beneficial for various types of breast cancer, including locally advanced breast cancers and other cases where tumor shrinkage is essential for effective surgical intervention.1 However, it is noteworthy that the treatment efficacy of NAC is suboptimal for many patients, with only 20%-40% achieving a pathological complete response (pCR) following treatment. Current techniques for evaluating NAC efficacy, including medical imaging and pCR evaluation, rely on post-treatment examinations, which may consequently lead to delayed treatment alterations for patients with suboptimal responses.2 Therefore, the timely identification of insufficient NAC response is essential, as it facilitates prompt adjustments to treatment strategies and minimizes risks related to postponed surgery, disease progression, and severe toxic side effects in patients who receive limited benefits from NAC.
NAC efficacy prediction primarily relies on imaging techniques such as ultrasonography, mammography, and magnetic resonance imaging (MRI).3–5 However, these traditional imaging modalities often yield inaccurate results due to their dependence on tumor morphological changes, limiting their early and precise application for evaluating treatment efficacy.6,7 Radiomics, an emerging field in medical imaging, has demonstrated significant potential in various oncological settings by extracting quantitative features from medical images, providing a comprehensive characterization of tumors and enabling a progression of image analysis from visual inspection to big data analytics.8 The advent of radiomics, coupled with advancements in medical image analysis and data mining, has shown promise in the noninvasive biological characterization of tumors, ultimately bridging the gap between medical imaging and personalized medicine.9,10
Radiomics research in breast cancer has primarily focused on MRI, with studies involving ultrasound imaging being relatively scarce.11 Despite this, ultrasound offers several advantages such as being easily repeatable, economical, and having high patient acceptability, which make it more suitable for NAC response evaluation.12,13 The development of the automated breast volume scanner (ABVS) has further overcome the limitations of handheld ultrasound.14 This system allows for the observation of breast lesion volume, offering a more precise and thorough evaluation of tumor morphology and alterations during treatment while preserving the inherent advantages of ultrasonography.15,16 Although the potential of ABVS in assessing NAC response is apparent, there have been limited studies on the application of ABVS-based radiomics for NAC efficacy prediction.
This study aims to establish an ABVS-based radiomics model for predicting NAC efficacy in BC patients. By establishing a radiomics signature at pre-treatment and early treatment of NAC, we hope to enable early detection of the BC patients with suboptimal NAC response. This will allow for prompt adjustments in treatment strategies, ultimately promoting personalized therapeutic approaches.
Materials and Methods
In compliance with the Declaration of Helsinki, this retrospective study received approval from the Ethics Committee of Huazhong University of Science and Technology Union Shenzhen Hospital (KY-2022-042). All participating women provided their informed consent, and to safeguard their privacy, the collected data were anonymized before conducting any analyses.
Patient Information
We included 300 patients with histologically confirmed primary BC without distant metastasis who were scheduled to receive NAC at our institution between January 2020 and January 2023. Standard clinical practice guidelines were followed for treatment and subsequent follow-up. NAC primarily comprised anthracycline and taxane-based regimens, while adjuvant radiotherapy, endocrine therapy, and targeted therapy were administered according to institutional protocols.
To ensure a homogeneous patient population for this study, strict inclusion criteria were established: (1) pathological diagnosis of unifocal primary breast cancer without evidence of distant metastasis; (2) receipt of a complete NAC course without prior chemotherapy; (3) surgical intervention following NAC completion, with pCR assessed through postoperative pathological examination; and (4) acquisition of ABVS data before and during treatment using the same device. Patients were excluded if they underwent non-standard treatment or if their ABVS images were of inadequate quality for feature extraction. A total of 248 patients satisfied the criteria and were incorporated into the study. Baseline characteristics, such as age, menopausal status, initial tumor size, molecular subtype, histological type, clinical stages, and chemotherapy regimens were gathered from patients’ medical records.
Response Criteria
All patients underwent six or eight cycles of NAC before surgery. Tumor dimensions were measured using combined ultrasound and MRI evaluations pre- and post-treatment. Routine ultrasound examinations, including ABVS, were conducted every two cycles. Surgical intervention, either lumpectomy or mastectomy, took place 2–3 weeks after NAC completion, followed by pathologic response assessment. In this study, patients were classified as responder group (R group) or non-responder group (NR group) based on treatment outcomes. Responders were defined as those who achieved a pCR, exhibited “very low” cellularity, or demonstrated a tumor size reduction greater than 30% according to RECIST-based criteria,17 as determined by comparing pre- and post-treatment tumor dimensions. Conversely, patients with progressive disease or a tumor size decrease of less than 30% were classified as non-responders.
ABVS Acquisition and Image Segmentation
In this study, two ABVS examinations were selected for radiomics analysis: (1) within one week before initiating NAC, and (2) within one week after the second NAC cycle. The ACUSON Oxana2 system (Siemens Medical Solutions, Inc., Mountain View, CA, USA) was employed by experienced sonographers. Patients were positioned supine with arms raised overhead while maintaining gentle breathing. The mechanical arm was adjusted to ensure the probe exerted optimal pressure on the breast without causing discomfort. Sequential scanning of the median, lateral, and medial positions of the breast was performed, with additional planes scanned as necessary. Following the examination, axial images were sent to a dedicated workstation for sagittal and coronal reconstruction. Two trained ultrasonographers manually segmented breast lesions using ITK-SNAP software (version 3.8.0; http://www.itksnap.org/pmwiki/pmwiki.php), carefully delineating the region of interest (ROI) on axial, sagittal, and coronal images for radiomics feature extraction.
Radiomics Features Extraction and Selection
Pre-NAC and early post-NAC ABVS images from each patient were selected for radiomics investigation. Utilizing the PyRadiomics toolkit (v3.0.1), comprehensive radiomic features within the ROI, including wavelet transformations, were extracted for analysis. To standardize the extracted features and ensure their compatibility with subsequent analyses, Z-score normalization was applied. The inter-observer consistency in feature extraction was assessed using interclass correlation coefficients (ICCs), with an ICC > 0.80 considered acceptable A hierarchical feature selection approach was utilized to identify features with the greatest relevance to NAC response prediction. The initial screening involved a Student’s t-test, followed by the application of the least absolute shrinkage and selection operator (LASSO) logistic regression to further refine the selection of features obtained from the primary screening. A 10-fold cross-validation method was implemented to determine the optimal lambda parameter, ensuring the optimal number of features was obtained while minimizing overfitting concerns.
Radiomics Model Training and Validation
The final selected features were employed to train and test three prevalent machine learning classifiers, namely logistic regression (Logit), support vector machine (SVM), and random forest (RF). A five-fold cross-validation with three repetitions was implemented, with each fold being utilized once as testing data while the classifiers were trained using the remaining folds as training data. The mean values acquired from the cross-validation process were employed to estimate the performance of the model. To train the Logit model, a linear combination of the chosen features and their corresponding coefficients was employed, fitting the Logit model to predict binary outcomes. A fixed threshold (0.5) was used for classification purposes. The SVM classifier adopted the radial basis function as its kernel function and implemented a 10-fold cross-validation to determine the optimal performing model during its development stage. Regarding the RF model, an ensemble of decision trees was generated, with each tree being trained on bootstrapped samples from the dataset alongside feature bagging. The final classification result was obtained by aggregating their predictions through a majority vote. In the validation stage, the discrimination, calibration, and clinical utility of the radiomics models were assessed and compared. A flow diagram illustrating the processing steps using the radiomics approach for predicting NAC responses is shown in Figure 1.
 |
Figure 1 A comprehensive illustration of a four-step workflow implemented for the development of an ABVS-derived radiomics strategy to predict NAC response. The workflow initiates with the definition of an ROI, which includes the tumor region within the ABVS imaging. Subsequently, an automatic extraction of seven diverse radiomics features is conducted from six imaging types and wavelet transformation using the Pyradiomics toolkit. Upon normalization, the key radiomic features associated with NAC responders are identified through a hierarchical feature selection procedure, encompassing ICC assessment, Student’s t-test, and LASSO logistic regression. Finally, the performance of NAC response prediction is evaluated using Logit, SVM, and RF classifiers. Abbreviations: ABVS, automated breast volume scanner; ROI, region of interest; GLCM, gray-level co-occurrence matrix; GLDM, gray-level dependence matrix; GLRLM, gray-level run length matrix; GLSZM, gray-level size zone matrix; NGTDM, neighbouring grey tone difference matrix; ICC; Interclass Correlation Coefficient, LASSO; least absolute shrinkage and selection operator, Logit; logistic regression, RF; random forest, SVM; support vector machine, NAC, neoadjuvant chemotherapy. |
Statistical Analysis
In the validation of the radiomics models, we aimed to comprehensively evaluate their performance and clinical applicability in predicting NAC responses by focusing on discrimination, calibration, and net benefits. The discrimination of the Logit, SVM, and RF classifiers was assessed using receiver operating characteristic (ROC) curves to determine the area under the curve (AUC), sensitivity, specificity, and accuracy. Delong’s test was employed to compare the AUCs. The goodness of fit for each model was evaluated by analyzing the calibration curve. Additionally, decision curve analysis (DCA) was applied to determine the net benefits of each model under various threshold probabilities, which aided in assessing the clinical utility of these models. For all analyses, a P-value of less than 0.05 was considered statistically significant, except in the initial screening of radiomic features using Student’s t-test. Due to the substantial number of comparisons among diverse parameters in this particular case, the False Discovery Rate was utilized to address multiple comparisons. A two-tailed approach was adopted for all tests. Statistical data processing was carried out using IBM SPSS Statistics (v 22.0, SPSS Inc.), R package (v 4.2.3), and Python (v 3.7.1).
Results
Patient Data and Outcome Analysis
Subsequent to the screening process, a total of 248 BC patients were incorporated and analyzed in this investigation. The process of participant selection and grouping is depicted in Figure 2, while Table 1 offers a summary of their characteristics. The predominantly utilized chemotherapy protocol was AC-T (Adriamycin, Cyclophosphamide, and Paclitaxel), accounting for 64.9%, followed by FEC-D (Fluorouracil, Epirubicin, Cyclophosphamide, and Docetaxel) at 28.6%. Alongside NAC, all HER2+ patients were administered trastuzumab within the neoadjuvant setting. Based on the evaluation of clinical and pathological criteria, 157 patients (63.3%) were identified as responders, while 91 patients (36.7%) were classified as non-responders. pCR was documented in 59 patients, comprising 23.8% of the entire cohort.
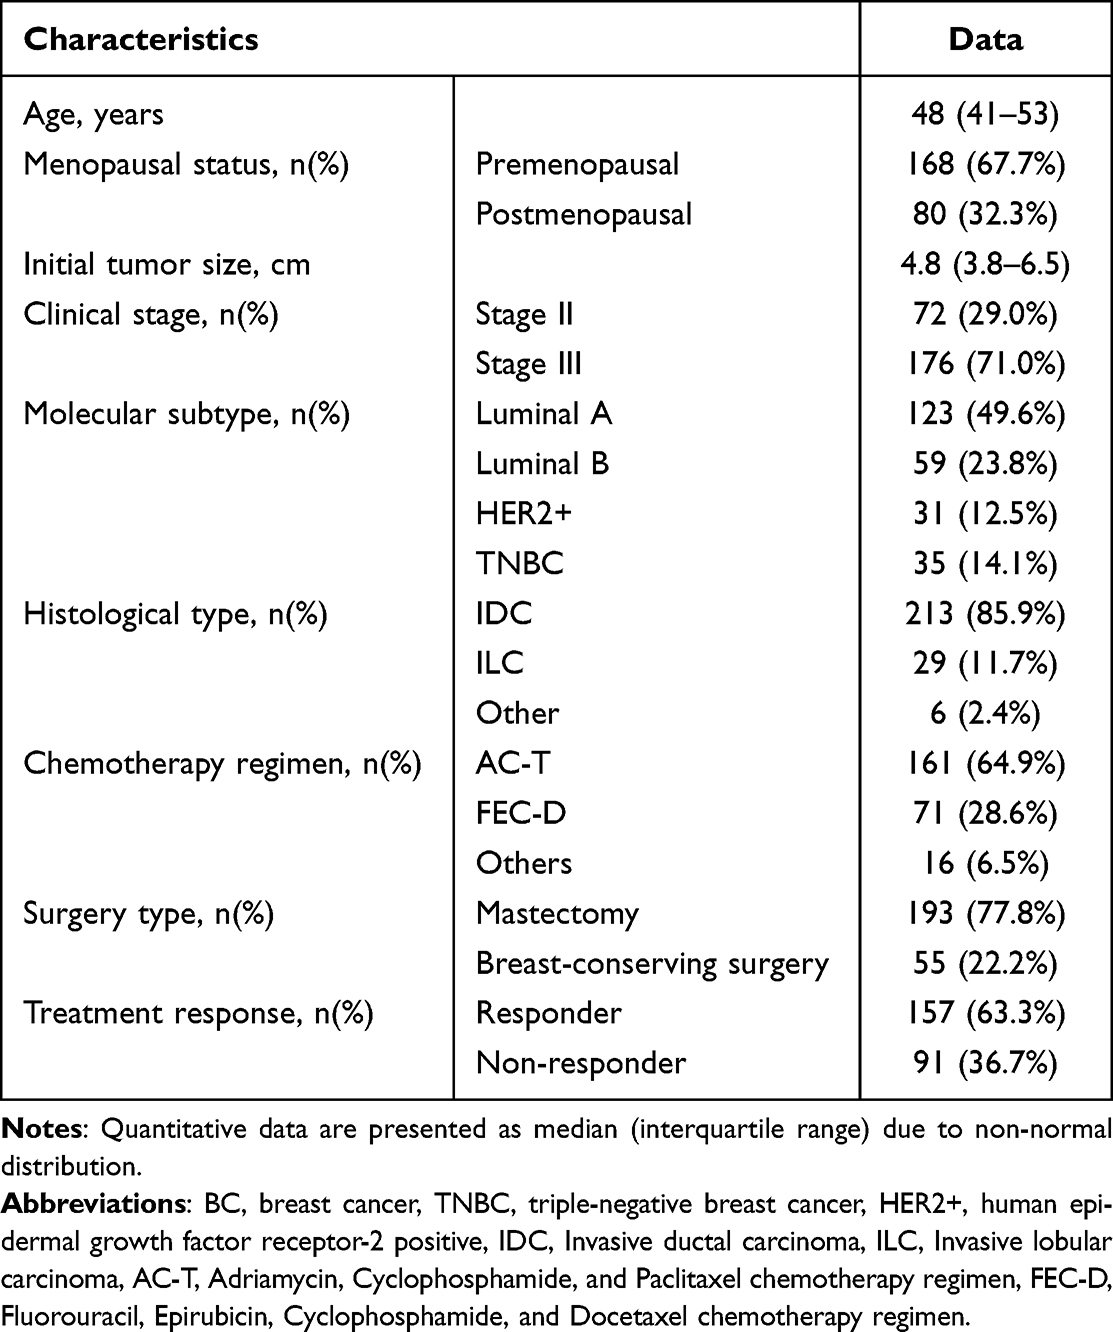 |
Table 1 Characteristics of BC Patients Involved in the Study (n=248) |
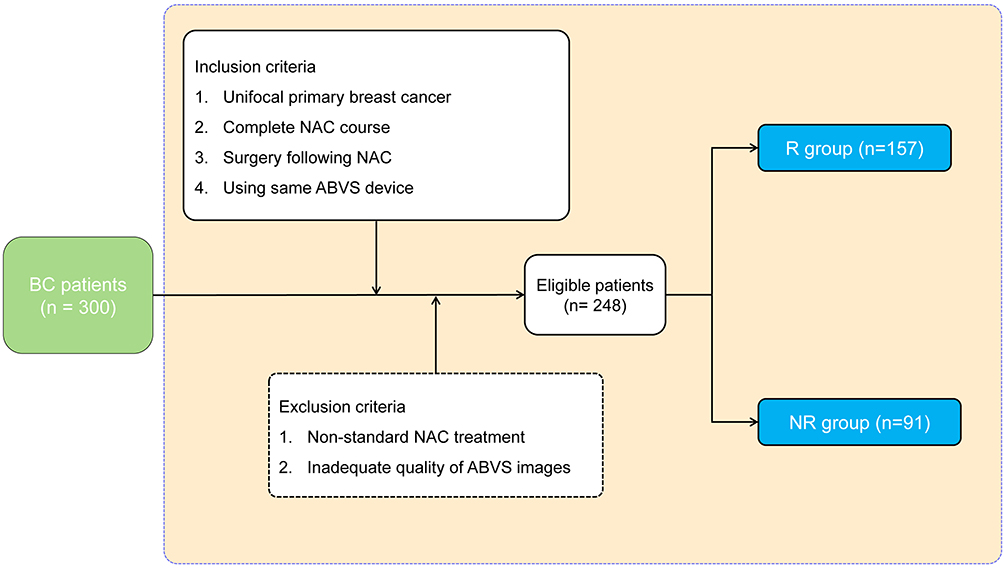 |
Figure 2 Flow diagram of patient selection and grouping in the study. Abbreviations: BC, breast cancer; NAC, neoadjuvant chemotherapy; ABVS, automated breast volume scanner; R, responder; NR, non-responder. |
Feature Selection
We investigated the relationship between radiomics features, extracted from pre- and early post-NAC ABVS images, and NAC responses, with a total of 2628 features (1314 for each time point). Of the initial pool of features, a subset meeting a threshold of intra-observer ICC ≥ 0.8 was selected for further evaluation. Specifically, this encompassed 932 (70.9%) pre-NAC features and 985 (74.9%) post-NAC features. Further analysis via t-tests identified 55 significant pre-NAC features, and 59 significant early post-NAC features associated with NAC responses.
Utilizing LASSO regression, we explored the significance of features with nonzero coefficients derived from both pre- and early post-NAC radiomics features. While seven significant features were identified from the pre-NAC set (Figure 3A), the early post-NAC set yielded six features (Figure 3B) that carried higher weights, thereby indicating a stronger association with NAC responses. This distinction indicated the superior predictive value of the post-NAC features, compared to their pre-treatment counterparts. The respective LASSO formulas are documented in Supplemental Appendix 1. The LASSO distribution diagrams (Figures 3C and D) further supported this finding, as the pre-NAC ABVS feature distribution appeared relatively uniform, without any distinguishable features. In contrast, the distribution of early post-NAC ABVS revealed six distinct features that significantly deviated from the others in their spatial arrangement. These included features demonstrating grayscale uniformity (“Logarithm_glcm_Imc1”), grayscale intensity variability and larger zone dominance (“Squareroot_glszm_GrayLevelNonUniformity”, “LLL_glszm_LargeAreaEmphasis”), voxel intensity dispersion (“HLL_firstorder_Variance”), and specific low grayscale and run length patterns (“HLL_gldm_LargeDependenceLowGrayLevelEmphasis”, “HHH_glrlm_RunLengthNonUniformity”).
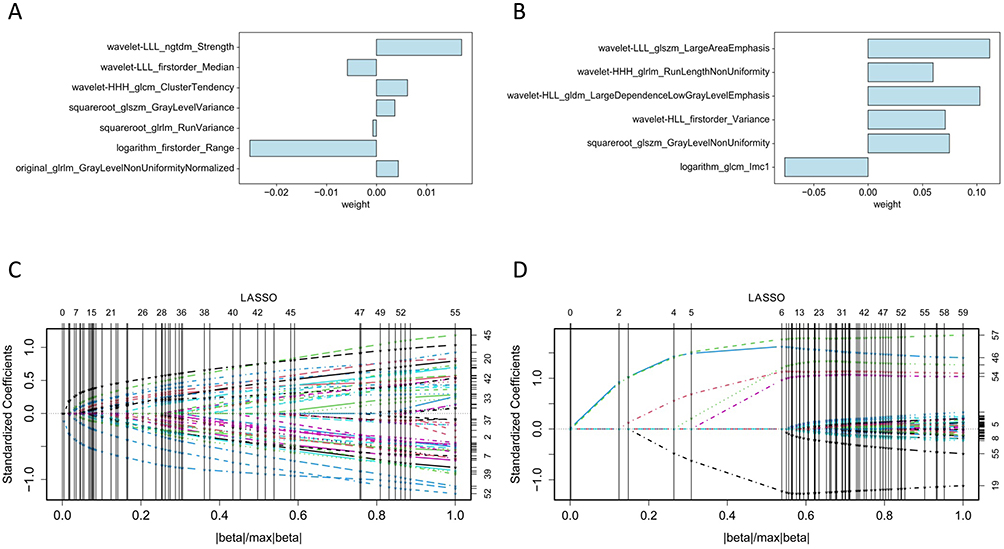 |
Figure 3 LASSO regression-based radiomics feature selection associated with NAC response outcomes. In pre-NAC ABVS, seven features are identified, and in early post-NAC ABVS, six features are selected, with their corresponding weights presented in (A and B), respectively. (C and D) illustrate the distributions of radiomics features in pre- and early post-NAC ABVS images, respectively. Abbreviation: LASSO, least absolute shrinkage and selection operator. |
Comparison of Classifiers in Predicting NAC Efficacy
In the prediction of NAC treatment outcomes, we employed three machine learning classifiers (Logit, SVM, and RF) to evaluate their efficacy based on the selected ABVS radiomics features during pre-NAC and early post-NAC stages. A visual representation of the ROC, calibration, and DCA curves is displayed in Figure 4, while Table 2 presents a detailed summary of the sensitivity, specificity, and accuracy of each classifier derived from the ROC curves. Our investigation revealed that the calibration curves displayed satisfactory agreement for both the pre-NAC and early post-NAC treatment stages. The primary differences between the two stages were observed in the ROC and DCA curves. During the pre-NAC stage, the AUCs for all three classifiers fell within the range of 0.7 to 0.8, indicating moderate discrimination. However, the DCA curves suggested no substantial net benefit for any of the classifiers, indicating limited clinical utility based on pre-NAC predictions. In contrast, following the completion of two NAC treatment cycles, the AUCs of all three classifiers increased to approximately 0.9, representing a statistically significant improvement in discrimination (P < 0.05). This improvement was most evident in the specificity of each classifier, suggesting that the models demonstrate high reliability in predicting unfavorable NAC outcomes. Furthermore, the DCA curves indicated that when the threshold probability exceeded 40%, the classifiers derived from the early post-NAC ABVS features delivered a net benefit. This observation implied potential clinical benefits in adapting treatment strategies based on predictions from this stage. As the linear predictive model amongst the three machine learning classifiers, the prediction model formula for Logit is documented in Supplemental Appendix 2.
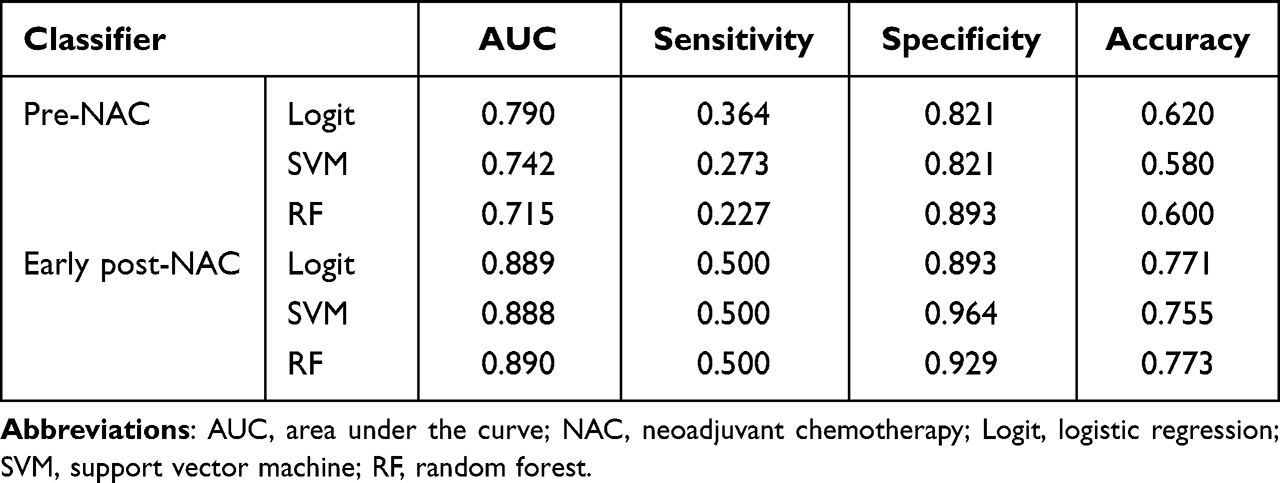 |
Table 2 Comparison of Logit, SVM, and RF Classifiers in Assessing AUC, Sensitivity, Specificity, and Accuracy for NAC Response Prediction at Pre- and Early Post-NAC Treatment Stages |
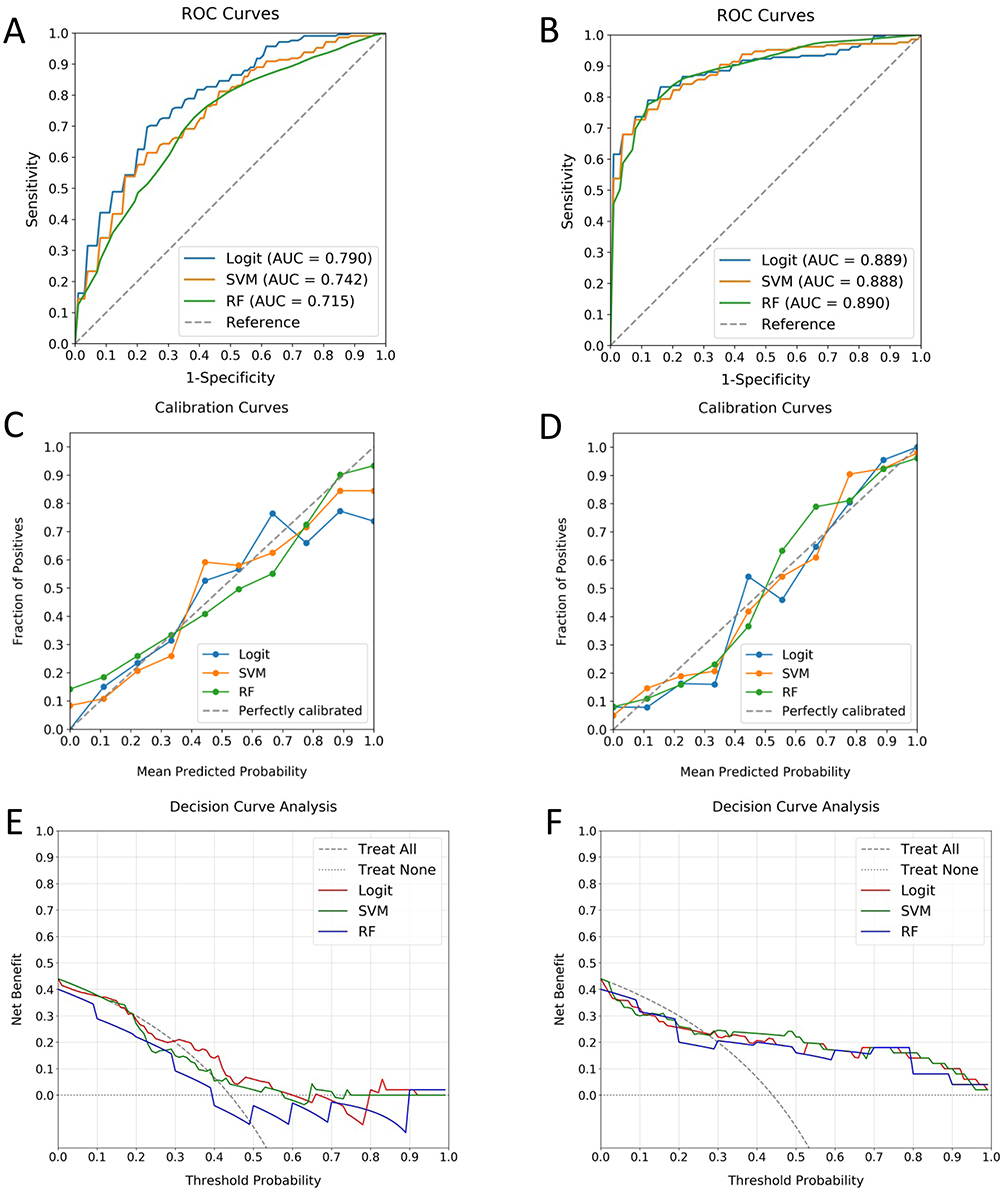 |
Figure 4 Comparison of prediction performance of Logit, SVM, and RF classifiers using selected ABVS radiomics features at pre- and early post-NAC stages. (A and B) depict the ROC curves for pre- and post-NAC predictions, respectively. (C and D) represent the calibration curves for the same stages. (E and F) illustrate the DCA curves. The results exhibit moderate discrimination with limited clinical applicability during the pre-NAC stage. Moving into the early post-NAC stage, improved discrimination is observed, alongside good agreement between predicted and observed probabilities, and a substantial net benefit when the threshold probability exceeds 40%. Abbreviations: Logit, logistic regression; SVM, support vector machine; RF, random forest; ROC, receiver operating characteristic; DCA, decision curve analysis; NAC, neoadjuvant chemotherapy. |
For a more comprehensive comparison, we evaluated the performance of classifiers using radiomics features from conventional grayscale ultrasound images at both pre- and early post-NAC stages. As depicted in Supplemental Figure S1, these classifiers underperformed compared to the ABVS-based machine learning models. Specifically, the pre-NAC classifiers’ AUCs ranged between 0.50 and 0.64, while the early post-NAC classifiers showed slight improvement, with AUCs ranging from 0.57 to 0.71. Moreover, the calibration and DCA curves indicated poor performance at both stages, suggesting limited consistency and clinical utility. Therefore, it was found that ABVS radiomics features outperformed those from conventional grayscale ultrasound images in predictive capability.
Discussion
In the current study, we aimed to evaluate the prognostic capabilities of three distinct machine learning classifiers (Logit, SVM, and RF) for predicting NAC response in BC patients by incorporating ABVS images acquired before treatment and after two NAC cycles. Our findings revealed that the classifiers exhibited improved discrimination and clinical utility when employing radiomics features obtained after two NAC cycles, as opposed to the features extracted prior to treatment initiation. Consequently, the predictive models developed at this early post-NAC stage could offer valuable insights to clinicians regarding patient-specific NAC responses. These findings emphasized the potential of employing machine learning and big data methodologies for a more comprehensive prognostic evaluation by leveraging imaging-based heterogeneity. By utilizing this knowledge, clinicians have the potential to customize treatment plans to improve clinical outcomes, and provide personalized care based on individual NAC response patterns, ultimately enhancing patient management in BC treatment.
NAC resistance encompasses both acquired and intrinsic aspects.18 Pre-treatment imaging is linked to primary tumor invasion and metastasis, while post-treatment imaging provides valuable insights into response status, making it suitable for monitoring or predicting NAC response.19,20 Ideally, breast imaging should follow each NAC cycle for tracking progress. We argue that assessing treatment efficacy after the second cycle is more advantageous than evaluations after later cycles. At this point, the tumor microenvironment and biological properties have been impacted by chemotherapy, better reflecting the overall response.21 Second-cycle assessments enable timely adjustments to treatment plans, minimizing toxicity and maximizing therapeutic outcomes. This strategy balances the need for adequate NAC response time with avoiding delays in detecting non-responders. A systematic review highlighted the significance of MRI changes after the first or second NAC cycle for predicting response.22 Experts also recommend bi-cycle breast examinations to assess treatment response.23 Our study did not evaluate the predictive value of the first NAC cycle due to the retrospective design and the absence of routine imaging records. However, existing research indicates the first cycle may effectively predict NAC prognosis,24 meriting future investigation.
The utilization of ABVS imaging combined with radiomics analysis offers significant benefits in predicting NAC response. Conventional imaging techniques primarily depend on changes in tumor size, which may not accurately reflect the true response to NAC.6,25 In contrast, radiomics analysis of ABVS images captures high-dimensional features that are beyond human visual perception, allowing for a more comprehensive assessment of NAC response by considering tumor heterogeneity and microenvironment changes.26,27 ABVS overcomes the limitations of conventional ultrasound by providing a three-dimensional evaluation of the tumor, similar to MRI, while being less costly and more accessible.28,29
In our study, we employed LASSO regression to identify seven pre-NAC and six post-NAC ABVS features, most of which demonstrated wavelet transform properties. Wavelet transform is notably adept at extracting nuanced texture details from low-contrast ultrasound images, a subtlety often overlooked by human observers.30,31 The identified ABVS features can be hypothesized to respond to NAC, reflecting not only the tumor’s heterogeneity and complex architecture but also its inherent biological dynamics, such as growth trajectories and cellular microstructures. However, these interpretations are currently speculative. The actual correlation between these radiomics features and NAC efficacy may be intertwined with more complex biological mechanisms. Therefore, rigorous experimental and clinical studies are required to validate these hypotheses. Our preliminary findings suggested that the integration of ABVS imaging and radiomics analysis could enhance the predictive accuracy of NAC responses. This perspective highlighted the potential of advanced image analysis techniques in decoding the complex relationships between tumor characteristics and therapeutic responses. Such an approach could contribute significantly to the field of personalized oncology, facilitating the development of more customized cancer management strategies.
In this pioneering study, we utilized ABVS-based radiomics features and three distinct machine learning classifiers (Logit, SVM, and RF) to predict NAC response in BC patients. Our results revealed that radiomics features derived from ABVS images after two NAC cycles offered the most effective predictions. Similar findings have been reported using MRI-based radiomics,32–34 emphasizing the promising prognostic value of ABVS-derived radiomics. Each classifier has its own unique characteristics.35,36 RF, an ensemble algorithm with multiple decision trees, boasts high accuracy and a reduced likelihood of overfitting, although it demands significant computational resources.37 SVM excels in analyzing intricate datasets, yet its complexity may not always prevent overfitting.38 Conversely, Logit is a simple algorithm adept at binary classification, providing interpretable probabilities for each class; however, its simplicity could hinder performance with more complex datasets.39 Therefore, it is necessary to compare the performance of different classifiers during the development of a predictive model in order to select the most suitable one.
Our study specifically focused on imaging-based radiomics without incorporating clinical indicators, in line with the aim of automating data extraction and processing to facilitate clinical implementation and wider adoption. The growing evidence that predictive models using big data can outperform human experts highlights the potential of radiomics-based machine learning models in clinical decision support.40 As artificial intelligence advances, the potential for extracting valuable information from imaging data increases, leading to streamlined clinical processes.
Despite the encouraging outcomes, some limitations must be recognized in this study. Primarily, the single-center retrospective nature of the analysis could limit the generalizability of our findings, and variations in ABVS settings among institutions may potentially affect the performance of radiomics models. Furthermore, the absence of data from the first NAC cycle and the sole focus on tumor region features without peritumoral tissue analysis might have hindered our understanding of the predictive performance of the model.5,41,42 Lastly, the study relies only on internal cross-validation, lacking an independent external validation cohort, which could impact the generalizability and clinical applicability of the radiomics model. In light of these limitations, we plan to conduct well-designed, multi-center prospective research with larger, prospectively enrolled patient cohorts to confirm the robustness and accuracy of our radiomics model.
Conclusion
This study emphasized the potential of utilizing ABVS-based radiomics in combined with machine learning classifiers (Logit, SVM, and RF) to predict NAC response in BC patients. Enhanced predictions were achieved by extracting features from ABVS images following the second NAC cycle. By integrating radiomics analysis and machine learning, clinical decision-making could be significantly improved, ultimately facilitating the development of personalized BC treatment plans.
Data Sharing Statement
The data during the current study are available from the corresponding author on reasonable request.
Ethical Approval
Ethical approvals for the study were obtained from the Institutional Review Boards of Huazhong University of Science and Technology Union Shenzhen Hospital (KY-2022-042).
Informed Consent
Informed consents were obtained from all patients.
Author Contributions
All authors made a significant contribution to the work reported, whether that is in the conception, study design, execution, acquisition of data, analysis and interpretation, or in all these areas; took part in drafting, revising or critically reviewing the article; gave final approval of the version to be published; have agreed on the journal to which the article has been submitted; and agree to be accountable for all aspects of the work.
Disclosure
The authors declare that they have no conflicts of interest.
References
1. Montemurro F, Nuzzolese I, Ponzone R. Neoadjuvant or adjuvant chemotherapy in early breast cancer? Expert Opin Pharmacother. 2020;21(9):1071–1082. doi:10.1080/14656566.2020.1746273
2. Wang H, Mao X. Evaluation of the efficacy of neoadjuvant chemotherapy for breast cancer. Drug Des Devel Ther. 2020;14:2423–2433. doi:10.2147/dddt.s253961
3. Wang J, Chu Y, Wang B, Jiang T. A narrative review of ultrasound technologies for the prediction of neoadjuvant chemotherapy response in breast cancer. Cancer Management Res. 2021;13:7885–7895. doi:10.2147/cmar.s331665
4. Yin XX, Hadjiloucas S, Zhang Y, Tian Z. MRI radiogenomics for intelligent diagnosis of breast tumors and accurate prediction of neoadjuvant chemotherapy responses-a review. Comput Methods Programs Biomed. 2022;214:106510. doi:10.1016/j.cmpb.2021.106510
5. Mao N, Shi Y, Lian C, et al. Intratumoral and peritumoral radiomics for preoperative prediction of neoadjuvant chemotherapy effect in breast cancer based on contrast-enhanced spectral mammography. Eur Radiolo. 2022;32(5):3207–3219. doi:10.1007/s00330-021-08414-7
6. Fowler AM, Mankoff DA, Joe BN. Imaging neoadjuvant therapy response in breast cancer. Radiology. 2017;285(2):358–375. doi:10.1148/radiol.2017170180
7. Schaefgen B, Mati M, Sinn HP, et al. Can routine imaging after neoadjuvant chemotherapy in breast cancer predict pathologic complete response? Ann Surg Oncol. 2016;23(3):789–795. doi:10.1245/s10434-015-4918-0
8. Mayerhoefer ME, Materka A, Langs G, et al. Introduction to radiomics. J Nucl Med. 2020;61(4):488–495. doi:10.2967/jnumed.118.222893
9. Tagliafico AS, Piana M, Schenone D, Lai R, Massone AM, Houssami N. Overview of radiomics in breast cancer diagnosis and prognostication. Breast. 2020;49:74–80. doi:10.1016/j.breast.2019.10.018
10. Conti A, Duggento A, Indovina I, Guerrisi M, Toschi N. Radiomics in breast cancer classification and prediction. Semin Cancer Biol. 2021;72:238–250. doi:10.1016/j.semcancer.2020.04.002
11. Pesapane F, Rotili A, Agazzi GM, et al. Recent radiomics advancements in breast cancer: lessons and pitfalls for the next future. Curr Oncol. 2021;28(4):2351–2372. doi:10.3390/curroncol28040217
12. Dighe SP, Shinde RK, Shinde SJ, Anand A. Review on assessment of response of neo-adjuvant chemotherapy in patients of carcinoma breast by high frequency ultrasound. J Evolution Med Dental Sci. 2020;9:
13. Gu J, Tong T, He C, et al. Deep learning radiomics of ultrasonography can predict response to neoadjuvant chemotherapy in breast cancer at an early stage of treatment: a prospective study. Int J Med. 2022;32(3):2099–2109. doi:10.1007/s00330-021-08293-y
14. Vourtsis A. Three-dimensional automated breast ultrasound: technical aspects and first results. Diagn Interv Imaging. 2019;100(10):579–592. doi:10.1016/j.diii.2019.03.012
15. Meng Z, Chen C, Zhu Y, et al. Diagnostic performance of the automated breast volume scanner: a systematic review of inter-rater reliability/agreement and meta-analysis of diagnostic accuracy for differentiating benign and malignant breast lesions. Eur Radiol. 2015;25(12):3638–3647. doi:10.1007/s00330-015-3759-3
16. Hellgren R, Dickman P, Leifland K, Saracco A, Hall P, Celebioglu F. Comparison of handheld ultrasound and automated breast ultrasound in women recalled after mammography screening. Acta Radiol. 2017;58(5):515–520. doi:10.1177/0284185116665421
17. Eisenhauer EA, Therasse P, Bogaerts J, et al. New response evaluation criteria in solid tumours: revised RECIST guideline (version 1.1). Eur J Cancer. 2009;45(2):228–247. doi:10.1016/j.ejca.2008.10.026
18. St. Croix B, Man S, Kerbel RS. Reversal of intrinsic and acquired forms of drug resistance by hyaluronidase treatment of solid tumors. Cancer Lett. 1998;131(1):35–44. doi:10.1016/S0304-3835(98)00199-2
19. Junttila MR, de Sauvage FJ. Influence of tumour micro-environment heterogeneity on therapeutic response. Nature. 2013;501(7467):346–354. doi:10.1038/nature12626
20. Pietras K, Östman A. Hallmarks of cancer: interactions with the tumor stroma. Exp Cell Res. 2010;316(8):1324–1331. doi:10.1016/j.yexcr.2010.02.045
21. Iwamoto T, Kajiwara Y, Zhu Y, Iha S. Biomarkers of neoadjuvant/adjuvant chemotherapy for breast cancer. Chin Clin Oncol. 2020;9(3):27. doi:10.21037/cco.2020.01.06
22. Marinovich ML, Sardanelli F, Ciatto S, et al. Early prediction of pathologic response to neoadjuvant therapy in breast cancer: systematic review of the accuracy of MRI. Breast. 2012;21(5):669–677. doi:10.1016/j.breast.2012.07.006
23. Group BC, Branch of Oncologist CM, Society IM, Chinese Anti-Cancer Association. Chinese expert consensus of albumin-bound paclitaxel in the treatment of breast cancer. Zhonghua Zhong Liu Za Zhi. 2023;45(3):203–211. doi:10.3760/cma.j.cn112152-20230103-00006
24. Wang Y, Zhang C, Liu J, Huang G. Is 18F-FDG PET accurate to predict neoadjuvant therapy response in breast cancer? A meta-analysis. Breast Cancer Res Treat. 2012;131(2):357–369. doi:10.1007/s10549-011-1780-z
25. Derks MGM, van de Velde CJH. Neoadjuvant chemotherapy in breast cancer: more than just downsizing. Lancet Oncol. 2018;19(1):2–3. doi:10.1016/s1470-2045(17)30914-2
26. Aerts HJ. The potential of radiomic-based phenotyping in precision medicine: a review. JAMA Oncol. 2016;2(12):1636–1642. doi:10.1001/jamaoncol.2016.2631
27. Liu Z, Wang S, Dong D, et al. The applications of radiomics in precision diagnosis and treatment of oncology: opportunities and challenges. Theranostics. 2019;9(5):1303–1322. doi:10.7150/thno.30309
28. Ng F, Kozarski R, Ganeshan B, Goh V. Assessment of tumor heterogeneity by CT texture analysis: can the largest cross-sectional area be used as an alternative to whole tumor analysis? Eur J Radiol. 2013;82(2):342–348. doi:10.1016/j.ejrad.2012.10.023
29. D’Angelo A, Orlandi A, Bufi E, Mercogliano S, Belli P, Manfredi R. Automated breast volume scanner (ABVS) compared to handheld ultrasound (HHUS) and contrast-enhanced magnetic resonance imaging (CE-MRI) in the early assessment of breast cancer during neoadjuvant chemotherapy: an emerging role to monitoring tumor response? Radiol Med. 2021;126(4):517–526. doi:10.1007/s11547-020-01319-3
30. Guo Y, Hu Y, Qiao M, et al. Radiomics analysis on ultrasound for prediction of biologic behavior in breast invasive ductal carcinoma. Clin Breast Cancer. 2018;18(3):e335–e344. doi:10.1016/j.clbc.2017.08.002
31. Hu S, Xu C, Guan W, Tang Y, Liu Y. Texture feature extraction based on wavelet transform and gray-level co-occurrence matrices applied to osteosarcoma diagnosis. Biomed Mater Eng. 2014;24(1):129–143. doi:10.3233/bme-130793
32. McAnena P, Moloney BM, Browne R, et al. A radiomic model to classify response to neoadjuvant chemotherapy in breast cancer. BMC Med Imaging. 2022;22(1):225. doi:10.1186/s12880-022-00956-6
33. Chen S, Shu Z, Li Y, et al. Machine learning-based radiomics nomogram using magnetic resonance images for prediction of neoadjuvant chemotherapy efficacy in breast cancer patients. Front Oncol. 2020;10:1410. doi:10.3389/fonc.2020.01410
34. Li Y, Fan Y, Xu D, et al. Deep learning radiomic analysis of DCE-MRI combined with clinical characteristics predicts pathological complete response to neoadjuvant chemotherapy in breast cancer. Front Oncol. 2022;12:1041142. doi:10.3389/fonc.2022.1041142
35. Saberioon M, Císař P, Labbé L, Souček P, Pelissier P, Kerneis T. Comparative performance analysis of support vector machine, random forest, logistic regression and k-nearest neighbours in rainbow trout (Oncorhynchus mykiss) classification using image-based features. Sensors. 2018;18(4):1027.
36. Maroco J, Silva D, Rodrigues A, Guerreiro M, Santana I, de Mendonça A. Data mining methods in the prediction of Dementia: a real-data comparison of the accuracy, sensitivity and specificity of linear discriminant analysis, logistic regression, neural networks, support vector machines, classification trees and random forests. BMC Res Notes. 2011;4(1):299. doi:10.1186/1756-0500-4-299
37. Sarica A, Cerasa A, Quattrone A. Random forest algorithm for the classification of neuroimaging data in alzheimer’s disease: a systematic review. Front Aging Neurosci. 2017;9:329. doi:10.3389/fnagi.2017.00329
38. Huang S, Cai N, Pacheco PP, Narrandes S, Wang Y, Xu W. Applications of Support Vector Machine (SVM) Learning in Cancer Genomics. Cancer Genomics Proteomics. 2018;15(1):41–51. doi:10.21873/cgp.20063
39. Shipe ME, Deppen SA, Farjah F, Grogan EL. Developing prediction models for clinical use using logistic regression: an overview. J Thorac Dis. 2019;11(Suppl 4):S574–s584. doi:10.21037/jtd.2019.01.25
40. Oberije C, Nalbantov G, Dekker A, et al. A prospective study comparing the predictions of doctors versus models for treatment outcome of lung cancer patients: a step toward individualized care and shared decision making. Radiother Oncol. 2014;112(1):37–43. doi:10.1016/j.radonc.2014.04.012
41. Guo L, Du S, Gao S, et al. Delta-radiomics based on dynamic contrast-enhanced MRI predicts pathologic complete response in breast cancer patients treated with neoadjuvant chemotherapy. Cancers. 2022;14(14):3515.
42. Braman NM, Etesami M, Prasanna P, et al. Intratumoral and peritumoral radiomics for the pretreatment prediction of pathological complete response to neoadjuvant chemotherapy based on breast DCE-MRI. Breast Cancer Res. 2017;19(1):57. doi:10.1186/s13058-017-0846-1
 © 2023 The Author(s). This work is published and licensed by Dove Medical Press Limited. The
full terms of this license are available at https://www.dovepress.com/terms
and incorporate the Creative Commons Attribution
- Non Commercial (unported, 3.0) License.
By accessing the work you hereby accept the Terms. Non-commercial uses of the work are permitted
without any further permission from Dove Medical Press Limited, provided the work is properly
attributed. For permission for commercial use of this work, please see paragraphs 4.2 and 5 of our Terms.
© 2023 The Author(s). This work is published and licensed by Dove Medical Press Limited. The
full terms of this license are available at https://www.dovepress.com/terms
and incorporate the Creative Commons Attribution
- Non Commercial (unported, 3.0) License.
By accessing the work you hereby accept the Terms. Non-commercial uses of the work are permitted
without any further permission from Dove Medical Press Limited, provided the work is properly
attributed. For permission for commercial use of this work, please see paragraphs 4.2 and 5 of our Terms.
Recommended articles
Development and Validation of an MRI Radiomics-Based Signature to Predict Histological Grade in Patients with Invasive Breast Cancer
Wang S, Wei Y, Li Z, Xu J, Zhou Y
Breast Cancer: Targets and Therapy 2022, 14:335-342
Published Date: 14 October 2022
Validation of a Disease-Free Survival Prediction Model Using UBE2C and Clinical Indicators in Breast Cancer Patients
Shen J, Yan H, Yang C, Lin H, Li F, Zhou J
Breast Cancer: Targets and Therapy 2023, 15:295-310
Published Date: 25 April 2023
Predictive Value of Simulated CT Radiomics Combined with Ipsilateral Lung Dosimetry Parameters for Radiation Pneumonitis in Patients with Esophageal Cancer: A Machine Learning-Based Retrospective Study
Hu S, Li Y, Fan X
International Journal of General Medicine 2024, 17:4127-4140
Published Date: 16 September 2024
The Clinical Study of Intratumoral and Peritumoral Radiomics Based on DCE-MRI for HER-2 Positive and Low Expression Prediction in Breast Cancer
Shang Y, Wang Y, Guo Y, Li S, Liao J, Hai M, Wang M, Tan H
Breast Cancer: Targets and Therapy 2024, 16:957-972
Published Date: 14 December 2024
Interpretable Dynamic MRI-ITH Model for Predicting Neoadjuvant Chemotherapy Response in Breast Cancer: A Multicenter Study
Wang M, Liu X, Ding W, Xu K, Feng J, Lyu D
Journal of Multidisciplinary Healthcare 2026, 19:616424
Published Date: 3 July 2026