Back to Journals » Journal of Inflammation Research » Volume 19
Integrated Transcriptomic Analysis Unveils Hub Genes and Immune Dysregulation in Chronic Spontaneous Urticaria Pathogenesis
Received 7 December 2025
Accepted for publication 27 February 2026
Published 12 March 2026 Volume 2026:19 574707
DOI https://doi.org/10.2147/JIR.S574707
Checked for plagiarism Yes
Review by Single anonymous peer review
Peer reviewer comments 2
Editor who approved publication: Dr Anish R. Maskey
Xueyi Wen,1 Jing Zhang2
1Peking University Third Hospital, Beijing, 100191, People’s Republic of China; 2Peking Union Medical College Hospital, Beijing, 100730, People’s Republic of China
Correspondence: Xueyi Wen, Peking University Third Hospital, No. 49 Huayuan North Road, Haidian District, Beijing, 100191, People’s Republic of China, Email [email protected]
Background: Chronic spontaneous urticaria (CSU) is a debilitating inflammatory skin disorder with a significant impact on quality of life. Current treatment algorithms are ineffective for a substantial portion of patients, highlighting an urgent need to elucidate its underlying pathological mechanisms for the development of novel therapies.
Methods: Microarray datasets (GSE72540 and GSE57178) from CSU lesional skin (LS), non-lesional skin (NLS), and healthy controls (HC) were analyzed using weighted gene co-expression network analysis (WGCNA) and differential expression to identify characteristic genes. Functional enrichment, transcription factor networks, protein-protein interactions (PPI), and immune cell deconvolution via CIBERSORT were performed. Hub genes were correlated with immune infiltrates, and expression was validated in IgE-stimulated RBL-2H3 basophil cells via RT-qPCR.
Results: WGCNA identified six modules (3,114 genes) correlated with LS status. Differential analysis revealed 101 characteristic DEGs enriched in inflammatory, cytokine, and metabolic pathways. Fifteen transcription factors, including STAT1 and JUN, regulated these DEGs. PPI networks identified 10 hub genes (CXCL2, MYC, THBS1, EGR1, SOCS3, CXCL1, ICAM1, IL6, PTGS2, CCL2). LS showed increased activated mast cells, eosinophils, neutrophils, and monocytes, with depleted regulatory T cells and plasma cells. Hub genes positively correlated with activated mast cells and eosinophils. Validation confirmed biphasic hub gene expression: early downregulation (2 hours) and late upregulation (8 hours) post-stimulation.
Conclusion: This study reveals a multifaceted inflammatory and metabolic landscape in CSU, identifying hub genes as candidates warranting further investigation for the development of targeted therapeutic strategies. These findings require validation in larger, clinically characterized cohorts.
Keywords: chronic spontaneous urticaria, WGCNA, immune infiltration
Introduction
Chronic spontaneous urticaria (CSU) is a prevalent inflammatory skin disorder characterized by the recurrent emergence of wheals, angioedema, or both, persisting for a duration exceeding six weeks.1 Globally, CSU affects approximately 0.5% to 1% of the general population,2 severely impairing patients’ quality of life (QoL) and imposing a substantial socioeconomic burden.3 Current management relies on second-generation H1 antihistamines as first-line therapy, yet fewer than 50% of patients achieve optimal symptom control at standard doses, and up-dosing still leaves one-quarter to one-third of patients with incomplete relief.1,2,4 Omalizumab, the recommended second-line biologic, provides adequate control in only 26% to 83% of refractory cases.5–8 This significant treatment gap underscores the need to move beyond symptomatic management toward mechanistically informed therapies. Although established mechanisms such as IgE-mediated mast cell activation and autoimmune pathways have been well-characterized, the broader molecular and cellular networks driving CSU pathogenesis remain incompletely understood. In particular, the specific hub genes coordinating inflammatory signaling, the comprehensive immune cell landscape within CSU lesions, and the interplay between these molecular and cellular elements represent critical knowledge gaps. Therefore, the present study aimed to integrate transcriptomic profiling with computational and experimental approaches to identify key molecular targets and characterize the immune microenvironment in CSU, with the ultimate goal of informing the development of precision-based therapeutic strategies.
Mast cells and basophils are central effectors in CSU pathogenesis.9,10 In the classical IgE-dependent pathway, antigen binding to surface IgE triggers crosslinking of high-affinity IgE receptors (FcεRI), leading to degranulation and release of inflammatory mediators such as histamine, prostaglandins, and cytokines.9,11,12 In addition to this well-characterized mechanism, autoimmune processes; including IgG autoantibodies against IgE or FcεRI, have been increasingly recognized as important drivers of mast cell activation in a substantial subset of CSU patients.12 Beyond mast cells, several other immune cell populations contribute to CSU pathology through coordinated inflammatory networks. Eosinophils, for instance, become activated through IgG-anti-FcεRII/CD23 interactions and release major basic protein (MBP), which in turn promotes histamine secretion from basophils, thereby amplifying the inflammatory response.13,14 Neutrophils accumulate in urticarial wheals during disease exacerbation, as demonstrated by immunofluorescence studies of CSU biopsies, and their presence is associated with more severe disease.15 Despite these advances, a comprehensive understanding of the immune cell landscape in CSU tissue lesions; and how these cellular populations interact with the molecular signaling network, remains lacking.
To address these gaps, we performed an integrated transcriptomic analysis of CSU tissue biopsies from publicly available microarray datasets. Using a combination of weighted gene co-expression network analysis (WGCNA) and differential gene expression analysis, we identified characteristic genes associated with CSU phenotypes. Functional enrichment analysis, transcription factor regulatory networks, and protein-protein interaction (PPI) networks were employed to delineate the molecular pathology and identify hub genes. Immune cell infiltration was characterized using CIBERSORT deconvolution and correlated with hub gene expression. Finally, key findings were validated experimentally using an IgE-mediated mast cell activation model in RBL-2H3 cells.
Methods
Study Design and Data Acquisition
This retrospective bioinformatic analysis was designed to integrate multiple computational approaches for comprehensive characterization of CSU pathogenesis. The study protocol followed STREGA (STrengthening the REporting of Genetic Association studies) guidelines for transparent reporting of genetic association studies. The microarray datasets of CSU tissue biopsy were systematically retrieved from the Gene Expression Omnibus (GEO) database (https://www.ncbi.nlm.nih.gov/geo/) using the search terms “chronic spontaneous urticaria” OR “chronic idiopathic urticaria” AND “Homo sapiens” with filters for expression profiling by array. The annotation file GPL16699 with gene expression profiling data GSE72540 and GPL6244 with GSE57178 were obtained using the R package “GEOquery” (version 2.68.0). Clinical characteristics, including sample size, disease status, treatment protocols, patient demographics, disease duration, and medication history were extracted for further analysis. The combined datasets encompass three distinct sample categories: 16 tissue biopsies from lesional skin (LS) of CSU patients, 20 from non-lesional skin (NLS) of CSU patients, and 13 from skin of healthy controls (HC). Inclusion criteria for CSU samples required documented diagnosis according to EAACI/GA2LEN/EDF/WAO guidelines, while exclusion criteria included concurrent autoimmune diseases, systemic corticosteroid use within 4 weeks, and incomplete clinical data. A comprehensive summary of all analytical parameters, threshold values, and software versions used throughout this study is provided in Supplementary Table S1.
Data Processing, Quality Control, and Differential Expression Analysis
The raw expression data underwent comprehensive pre-processing and normalization utilizing R packages “limma” (version 3.56.2) and “affy” (version 1.78.0), implementing the Robust Multiarray Average (RMA) algorithm for background correction, quantile normalization, and probe summarization.16 Quality assessment was performed using arrayQualityMetrics package, examining RNA degradation plots, NUSE (Normalized Unscaled Standard Errors) and RLE (Relative Log Expression) metrics. Arrays with median NUSE > 1.05 or RLE > 0.1 were flagged for potential exclusion. Batch effects between the two datasets were corrected using the ComBat function from the “sva” package (version 3.48.0), with parametric adjustments and empirical Bayes framework. The resulting combined gene expression matrix was subjected to differential expression analysis to distinguish expression patterns among the three phenotypes, utilizing the “limma” package with the Benjamini-Hochberg method for multiple testing correction. A linear model was fitted incorporating the phenotype as the primary variable of interest, with adjustment for potential confounders including age and sex when available. The stringent criteria for identifying differentially expressed genes (DEGs) were: (i) adjusted p-value < 0.05; (ii) |log2(fold change)| > 1, thresholds widely adopted in transcriptomic studies to balance sensitivity and specificity while ensuring biological relevance of expression changes[21]. Additionally, genes with low expression (mean expression < 5th percentile across all samples) were filtered out to reduce noise.
Weighted Gene Co-Expression Network Analysis (WGCNA)
The R package “WGCNA” (version 1.72.1) was employed to construct gene co-expression networks following established protocols. Prior to network construction, outlier samples were identified using hierarchical clustering with average linkage and removed if their height exceeded the threshold of mean + 3 × standard deviation. Gene similarity was assessed through Pearson correlation analysis based on gene expression profiles, where Sij indicates the degree of similarity between gene pairs i and j. The gene expression similarity matrix was subsequently transformed into an adjacency matrix using a power adjacency function: aij = |Sij|^β, where aij represents the adjacency between genes i and j, and β denotes the soft-thresholding power. The optimal β value was determined by analyzing the scale-free topology fit index (R2 > 0.85) and mean connectivity, ensuring biological network characteristics. The topological overlap matrix (TOM) was calculated to measure similarity across all network nodes, where TOMij represents the topological overlap score and lij is defined as the number of nodes to which both i and j are connected. The minimum module size was set to 30 genes, with a module merging threshold of 0.25 based on dissimilarity of module eigengenes; these parameters follow recommended WGCNA best practices to ensure biologically meaningful modules while avoiding overly fragmented or merged clusters. Modules were classified through hierarchical clustering using TOM-based dissimilarity (1-TOM) with dynamic tree cutting. Module eigengenes (ME), representing the first principal component of each module, were correlated with clinical parameters to identify biologically relevant modules. Module preservation was assessed using the modulePreservation function with 200 permutations to ensure robustness. Gene co-expression modules were selected based on correlation with clinical attributes (r > 0.6) and statistical significance (p < 0.05).
Transcription Factor Interactive Network Analysis
Regulatory transcription factors (TFs) governing the characteristic DEGs were identified through complementary approaches. The ChEA3 platform (https://maayanlab.cloud/chea3/) was utilized with the “MeanRank” integration method combining multiple TF-gene interaction databases including ENCODE, ReMap, and literature-curated sets. Additionally, the TRRUST database (https://www.grnpedia.org/trrust/) was employed to identify experimentally validated TF-target interactions from over 11,000 PubMed articles. Gene-TF interaction networks were constructed and visualized using Cytoscape software (version 3.9.1) with force-directed layout algorithms. Potential regulatory TFs were selected based on stringent criteria: p-value < 0.01 and adjusted p-value < 0.01 with a minimum of 3 target genes among the characteristic DEGs. Network topology analysis was performed to identify central regulatory nodes using betweenness centrality and degree distribution metrics.
Functional Enrichment Analyses
Comprehensive functional annotation of the 101 characteristic DEGs was performed using the R package “clusterProfiler” (version 4.8.1). Gene Ontology (GO) enrichment analysis encompassed biological processes, molecular functions, and cellular components using the org.Hs.egdb annotation database (version 3.17.0). Kyoto Encyclopedia of Genes and Genomes (KEGG) pathway analysis was conducted with the latest KEGG database release (version 105.0), while Reactome pathway enrichment utilized the ReactomePA package (version 1.44.0) accessing Reactome database version 84. Visualization of enriched pathways was accomplished using the “ggplot2” package (version 3.4.2) with custom color schemes for improved clarity. Stringent screening criteria were applied: p-value < 0.01 and adjusted p-value < 0.01 with a minimum gene count of 3 per enriched term. Gene set enrichment analysis (GSEA) was additionally performed using ranked gene lists based on fold change values, with 1000 permutations for statistical assessment.
Evaluation of Immune Cell Infiltration
The cellular composition of tissue samples was deconvoluted using CIBERSORT (Cell-type Identification By Estimating Relative Subsets Of RNA Transcripts), a computational method for inferring immune cell fractions from bulk gene expression profiles. The LM22 signature matrix, comprising 547 genes distinguishing 22 human hematopoietic cell phenotypes, was obtained from the CIBERSORTx website (https://cibersortx.stanford.edu). The algorithm was run with 1000 permutations for statistical significance testing, and samples with deconvolution p-value > 0.05 were excluded from downstream analysis. The abundance of tissue-infiltrating immune cells was quantified using support vector regression with ν-SVR feature selection. Correlation analysis between infiltrating immune cell populations was performed using Spearman’s rank correlation to account for non-normal distributions. The “heatmap” package was employed for correlation visualization, while “ggplot2” and “pheatmap” packages with hierarchical clustering using Ward’s linkage method were utilized to illustrate differences in immune cell populations across sample groups.
Protein-Protein Interaction Network Analysis
To elucidate the functional relationships among characteristic DEGs, protein-protein interaction (PPI) networks were constructed using the STRING database (https://cn.string-db.org) version 12.0, incorporating experimental, co-expression, and text-mining evidence channels. The minimum required interaction score was set to 0.4 (medium confidence) with active interaction sources including experiments, databases, and co-expression. Network visualization and analysis were performed in Cytoscape (version 3.9.1). The CentiScaPe plugin (version 2.2) was utilized to compute network centrality measures including degree, betweenness centrality, and closeness centrality in the unweighted interaction networks. Node degree represents the number of edges connected to a node, betweenness centrality quantifies the number of shortest paths passing through a node, and closeness centrality measures the average distance to all other nodes. The Molecular Complex Detection (MCODE) plugin (version 2.0.2) was applied to identify densely connected regions representing potential protein complexes with parameters: degree cutoff = 2, node score cutoff = 0.2, k-core = 2, and max depth = 100[22]. Hub genes were defined as nodes satisfying multiple criteria: MCODE score > 6, degree > 30, betweenness > 100, and closeness > 0.005, ensuring both local and global network importance. These multi-metric criteria were applied to minimize false-positive identification by requiring convergent evidence of centrality across complementary topological measures.17
Correlation Analysis Between Hub Genes and Immune Infiltrates
The R package “corrplot” (version 0.92) was employed to conduct Pearson correlation analysis between hub gene expression levels and the abundance of various immune cell types across all tissue samples. Correlation coefficients were calculated with 95% confidence intervals using Fisher’s z-transformation. Visualization was accomplished using the “ggplot2” package with scatter plots including linear regression lines and confidence bands. Statistical significance was assessed using t-distribution with Bonferroni correction for multiple testing, considering correlations with |r| > 0.5 and adjusted p-value < 0.05 as biologically meaningful.
Cell Line and Reagents
To experimentally validate the bioinformatic findings, we employed an in vitro mast cell activation model. The rat basophilic leukemia cell line RBL-2H3 was selected as it is a widely used and well-characterized model for IgE-mediated mast cell degranulation, expressing high-affinity FcεRI receptors and closely recapitulating key aspects of human mast cell signaling.18,19 RBL-2H3 cells were purchased from Cell Bank of the Chinese Academy of Sciences (Shanghai, China). Cells were cultured in Dulbecco’s Modified Eagle’s Medium (DMEM; Gibco, New York, USA) supplemented with 10% fetal bovine serum (heat-inactivated at 56°C for 30 minutes) (Gibco, New Zealand), 100 U/mL penicillin, and 100 μg/mL streptomycin (Gibco, New York, USA) with 2 mM L-glutamine. Cells were maintained at 37°C in a humidified incubator with 5% CO2 and passaged twice weekly at a 1:3 ratio, using cells between passages 5–20 for experiments. Dinitrophenylated human serum albumin (DNP-HSA) and anti-DNP IgE isotype (monoclonal anti-dinitrophenyl antibody produced in mouse) were purchased from Sigma-Aldrich (St. Louis, MO, USA). Tyrode’s buffer (137 mM NaCl, 2.7 mM KCl, 1.8 mM CaCl2, 1 mM MgCl2, 5.6 mM glucose, 12 mM NaHCO3, 0.4 mM NaH2PO4, 0.1% BSA, pH 7.4) was purchased from Solarbio (Beijing, China). TRIzol reagent and HiScript II Q RT SuperMix for qPCR were obtained from Vazyme (Nanjing, China).
Mast Cell Activation Assay
For IgE-mediated sensitization, RBL-2H3 cells were seeded at a density of 5 × 10⁵ cells/well in 6-well plates and incubated with 100 ng/mL anti-DNP IgE overnight (16–18 hours) at 37°C. Following sensitization, cells were washed three times with pre-warmed Tyrode’s buffer to remove unbound IgE. For activation, sensitized cells were stimulated with 500 ng/mL DNP-HSA at 37°C for 2 hours and 8 hours to capture early and late phase responses. Unstimulated cells served as negative controls while cells treated with 1 μM ionomycin for 30 minutes served as positive controls for maximal degranulation. Each experimental condition was performed in triplicate wells across three independent experiments. The activated and control cells were harvested for subsequent RNA extraction.
RNA Extraction and Real-Time Quantitative PCR
Total RNA was extracted from harvested cells using TRIzol reagent according to the manufacturer’s protocol with RNA quality assessed by NanoDrop spectrophotometry (A260/A280 ratio between 1.8–2.1 and A260/A230 ratio > 2.0). One microgram of total RNA was reverse transcribed using HiScript II Q RT SuperMix with genomic DNA elimination step. Real-time quantitative PCR was performed using SYBR Green detection on a QuantStudio 5 Real-Time PCR System (Applied Biosystems) with the following cycling conditions: 95°C for 30 seconds, followed by 40 cycles of 95°C for 5 seconds and 60°C for 30 seconds. GAPDH served as the internal reference gene after validation of stable expression across experimental conditions. Relative mRNA expression was calculated using the comparative Ct method (2^-ΔΔCt) with efficiency correction when primer efficiencies deviated from 100% ± 10%. Primer sequences are provided in Table 1 and were validated for specificity by melt curve analysis and agarose gel electrophoresis of PCR products.
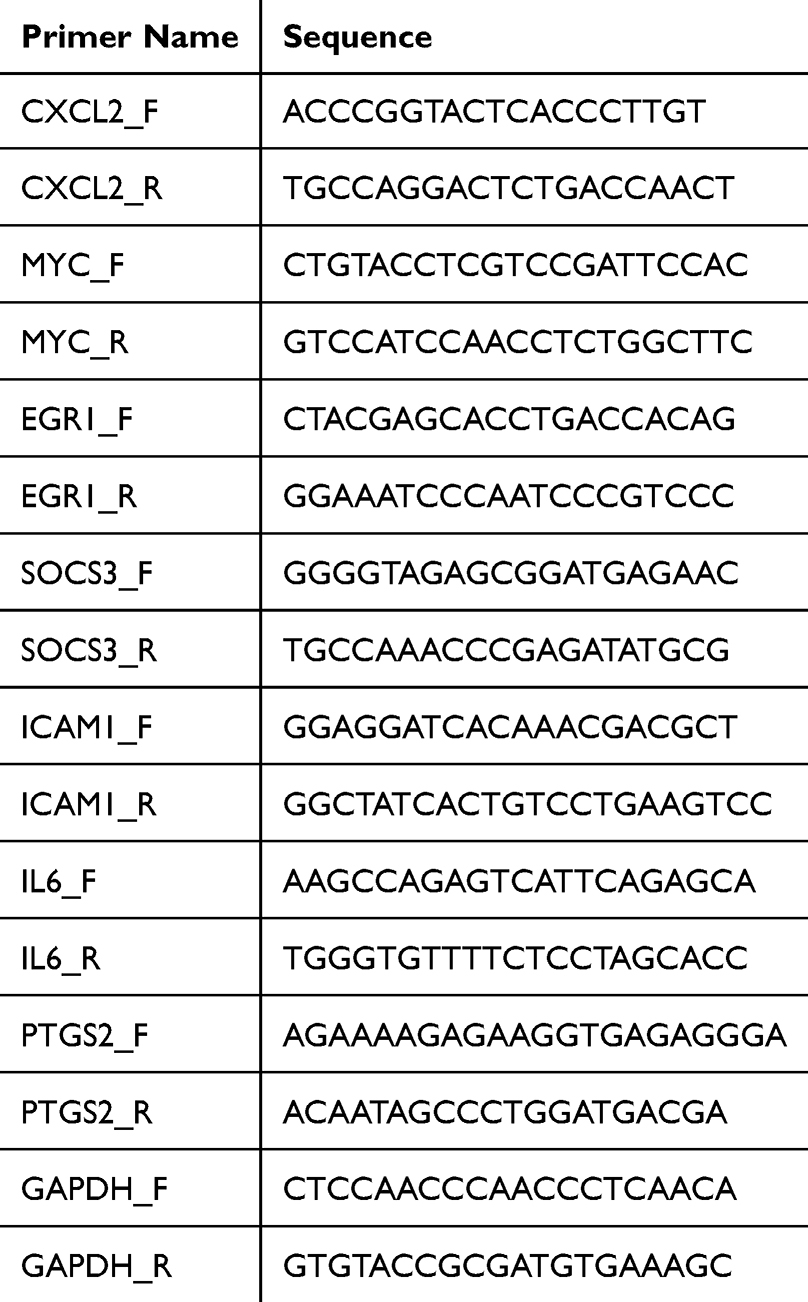 |
Table 1 Primer Sequences Used |
Statistical Analysis
All statistical analyses were performed using R software (version 4.3.1) and GraphPad Prism (version 9.5.1). For bioinformatic analyses, the Benjamini-Hochberg method was applied for multiple testing correction throughout. Differential expression analysis employed moderated t-statistics with empirical Bayes shrinkage. For experimental validation, normality was assessed using the Shapiro–Wilk test. Comparisons between two groups were performed using unpaired Student’s t-test for normally distributed data or Mann–Whitney U-test for non-parametric data. Multiple group comparisons utilized one-way ANOVA with Tukey’s post-hoc test or Kruskal–Wallis test with Dunn’s correction as appropriate. Data are presented as mean ± standard error of the mean (SEM) unless otherwise specified. Statistical significance was defined as p < 0.05 for single comparisons and adjusted p < 0.05 for multiple comparisons. Sample size calculations for experimental validation were based on pilot experiments with 80% power to detect a 1.5-fold change at α = 0.05.
Results
Identification of CSU-Associated Gene Modules Through Weighted Co-Expression Network Analysis
To elucidate the transcriptional architecture underlying CSU pathogenesis, we constructed weighted gene co-expression networks using the integrated expression matrix from GSE72540 and GSE57178, encompassing 17,966 genes across 49 tissue samples. Initial quality assessment through hierarchical clustering revealed four samples exhibiting significant deviation from the expected dendrogram structure, which were subsequently excluded to ensure data integrity (samples with clustering height > mean + 3×SD). The remaining 45 high-quality samples were incorporated with their corresponding clinical attributes for network construction (Figure 1A).
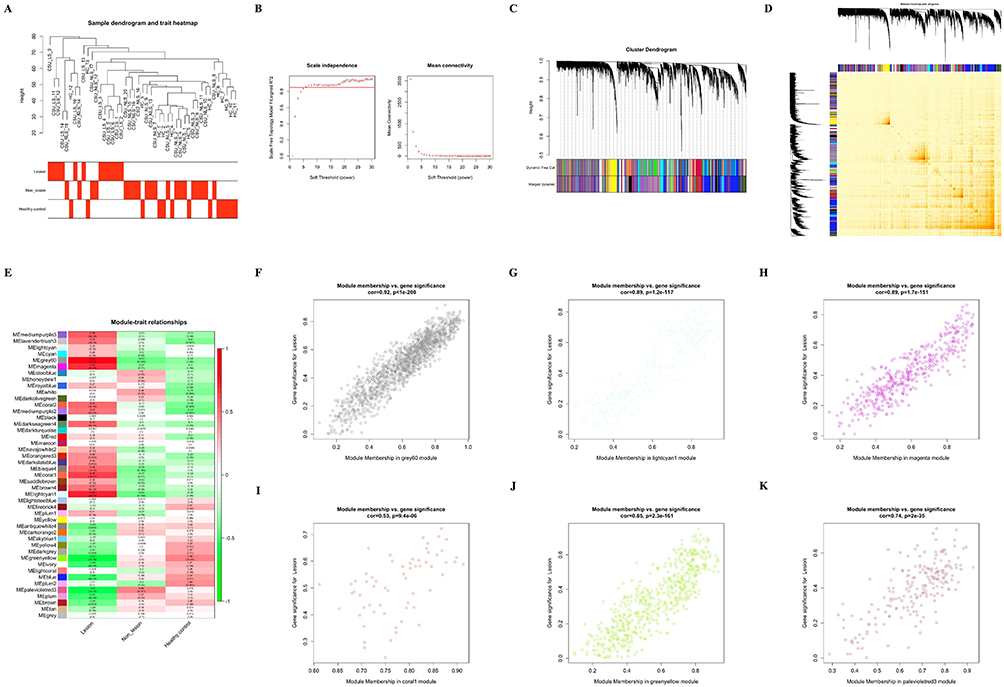 |
Figure 1 Weighted Gene Co-Expression Network Analysis (WGCNA). (A) Dendrogram illustrating sample clustering with associated clinical attributes for lesional skin (LS), non-lesional skin (NLS), and healthy controls (HC). (B) Selection of soft-thresholding power (β) for scale-free topology; the left panel plots the fitting index (R2, y-axis) against β (x-axis), and the right panel shows mean connectivity (y-axis) versus β. (C) Gene clustering dendrogram, with co-expression modules color-coded based on dissimilarity. (D) Topological overlap matrix plot depicting inter-module associations. (E) Heatmap of correlation coefficients and p-values between module eigengenes (MEs) and clinical attributes, with rows representing modules and columns indicating clinical status. (F–K) Scatterplots of highly correlated modules with LS status: grey60 (F), lightcyan1 (G), magenta (H), coral1 (I), greenyellow (J), and palevioletred3 (K). |
Network topology analysis determined the optimal soft-thresholding power β = 9, achieving scale-free topology with R2 exceeding 0.85 while maintaining adequate mean connectivity for biological relevance (Figure 1B). This power value balanced the scale-free topology criterion with preservation of biologically meaningful connections, as evidenced by the mean connectivity plateau. Application of dynamic tree cutting with stringent parameters (minimum module size = 30 genes, merging threshold = 0.25) yielded 45 distinct co-expression modules, as visualized in the hierarchical clustering dendrogram (Figure 1C). Inter-module correlation analysis demonstrated substantial independence among identified modules, confirming the specificity of our module detection approach (Figure 1D).
To identify modules with biological relevance to CSU pathology, we systematically evaluated correlations between module eigengenes and clinical phenotypes (Figure 1E). This analysis revealed six modules exhibiting robust associations with lesional skin status. Four modules demonstrated strong positive correlations with lesional skin: grey60 (r = 0.83, p < 0.001), lightcyan1 (r = 0.75, p < 0.001), magenta (r = 0.72, p < 0.001), and coral1 (r = 0.66, p < 0.01) (Figure 1F–I). Conversely, two modules showed significant negative correlations: greenyellow (r = −0.61, p < 0.01) and palevioletred3 (r = −0.6, p < 0.01) (Figure 1J and K). Module preservation analysis confirmed the robustness of these associations across dataset partitions (preservation Z-score > 10 for all six modules). Collectively, these six CSU-associated modules encompassed 3,114 genes, providing a comprehensive molecular signature for subsequent functional characterization.
Differential Expression Analysis Reveals Distinct Transcriptional Signatures in CSU Lesions
Comprehensive differential expression analysis across tissue phenotypes revealed profound transcriptional alterations specifically localized to lesional skin. The comparison between lesional skin and healthy controls identified 321 differentially expressed genes, with a marked upregulation bias (251 upregulated versus 70 downregulated genes), suggesting widespread transcriptional activation in CSU pathology. The magnitude of differential expression ranged from −4.2 to 6.8 log2 fold change, with the most prominently upregulated genes including inflammatory mediators and chemokines. Similarly, the lesional versus non-lesional skin comparison yielded 213 DEGs (197 upregulated, 16 downregulated), confirming that transcriptional perturbations are predominantly confined to active lesions (Figure 2A and B).
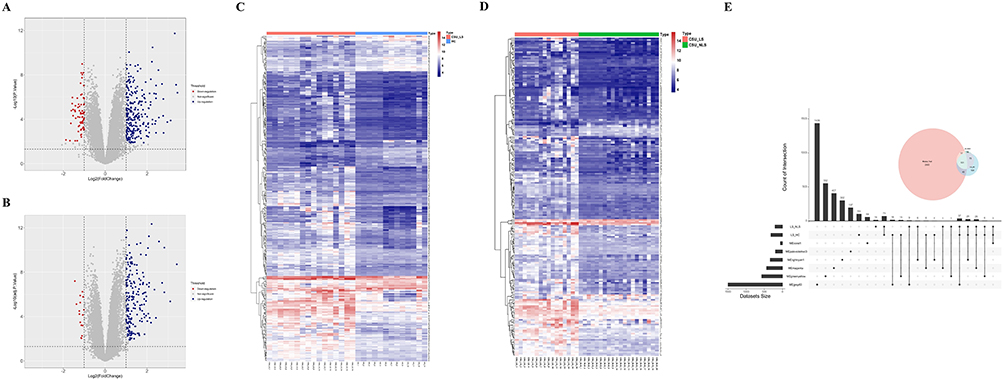 |
Figure 2 Identification of Differentially Expressed Genes (DEGs). (A and B) Volcano plots illustrating DEGs in LS versus healthy controls (HC) (A) and LS versus non-lesional skin (NLS) (B), with up- and down-regulated genes highlighted. (C and D) Heatmaps showing expression patterns of DEGs in LS versus HC (C) and LS versus NLS (D). (E) Venn diagram depicting the overlap of DEGs associated with CSU phenotypes, identifying 101 characteristic DEGs. |
Remarkably, no significant differential expression was detected between non-lesional skin from CSU patients and healthy control skin, indicating that CSU-associated transcriptional alterations are spatially restricted to areas of active inflammation. This observation suggests that non-lesional skin maintains a transcriptional profile comparable to healthy tissue, supporting the hypothesis of localized rather than systemic skin involvement in CSU. Hierarchical clustering of DEGs generated distinct expression signatures that clearly segregated tissue types, with lesional samples forming a cohesive cluster separate from both non-lesional and control samples (Figure 2C and D).
Integration of differential expression results identified 174 genes consistently dysregulated in lesional skin across both comparisons (Figure 2E). To focus on genes with both statistical significance and biological relevance to CSU, we intersected these 174 DEGs with the 3,114 CSU-associated genes identified through WGCNA. This stringent filtering approach yielded 101 characteristic DEGs, representing high-confidence candidates for CSU pathogenesis (Figure 2E). These characteristic DEGs showed enrichment for inflammatory response genes (p < 0.001) and exhibited coordinated expression patterns suggestive of regulatory relationships.
Transcriptional Regulatory Networks Governing CSU-Associated Gene Expression
To delineate the regulatory architecture controlling characteristic DEG expression, we employed complementary transcription factor prediction approaches. ChEA3 analysis, integrating multiple TF-gene interaction databases, identified 23 potential regulatory transcription factors with significant enrichment among our characteristic DEGs (adjusted p < 0.01, with enrichment scores ranging from 2.3 to 8.7). Parallel analysis using the TRRUST database, which focuses on experimentally validated regulatory interactions, predicted 87 transcription factors with documented regulatory relationships to our gene set.
Convergent evidence from both platforms highlighted 15 transcription factors as central regulatory nodes: STAT1, STAT3, FOS, CEBPB, CEBPD, STAT2, MAX, JUND, JUN, ATF3, TFAP2A, EGR1, TBP, FOSL2, and RELA (Figure 3). Network topology analysis revealed these TFs occupy hub positions with average degree centrality of 12.3 ± 4.2, indicating their potential as master regulators. These transcription factors predominantly represent inflammatory and stress response pathways, with notable enrichment for STAT family members indicative of cytokine signaling involvement, and AP-1 complex components (FOS, JUN, JUND, FOSL2) suggesting activation of immediate early response programs. The identification of RELA, a critical NF-κB subunit, further underscores the central role of inflammatory signaling in CSU pathogenesis. Motif enrichment analysis confirmed overrepresentation of binding sites for these TFs within 2kb promoter regions of characteristic DEGs (p < 0.001).
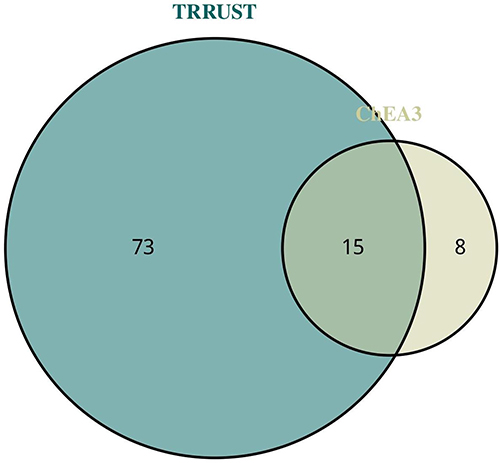 |
Figure 3 Transcription Factor (TF) Analysis and Interaction Network. Venn diagram showing shared TFs predicted by ChEA3 and TRRUST databases for characteristic DEGs. |
Functional Enrichment Analysis Reveals Multi-Faceted Inflammatory and Metabolic Dysregulation
Comprehensive functional annotation of the 101 characteristic DEGs unveiled complex biological processes underlying CSU pathophysiology. Gene Ontology analysis revealed profound enrichment for inflammatory response pathways, with particular emphasis on immune cell dynamics. The most significantly enriched biological processes encompassed migration, chemotaxis, adhesion, and proliferation of diverse immune cell populations, with mast cell activation emerging as a central theme (adjusted p < 0.001). Quantitative enrichment scores ranged from 3.2 to 12.4, with the highest scores observed for neutrophil chemotaxis and mast cell degranulation pathways. Additionally, smooth muscle cell proliferation and regulation pathways were prominently represented, suggesting vascular involvement in CSU pathology.
Molecular function analysis highlighted extensive dysregulation of cytokine and chemokine activities, including both ligand production and receptor binding capabilities. Specifically, 42% of characteristic DEGs encoded proteins with direct cytokine/chemokine activity or receptor function, emphasizing the critical role of intercellular communication in disease progression. The enrichment analysis also revealed unexpected involvement of coagulation cascades and their regulatory mechanisms, suggesting potential crosstalk between inflammatory and hemostatic systems. Notably, metabolic processes including nitric oxide metabolism and vitamin/cofactor pathways emerged as significantly enriched categories, indicating metabolic reprogramming accompanies the inflammatory response (Figure 4A).
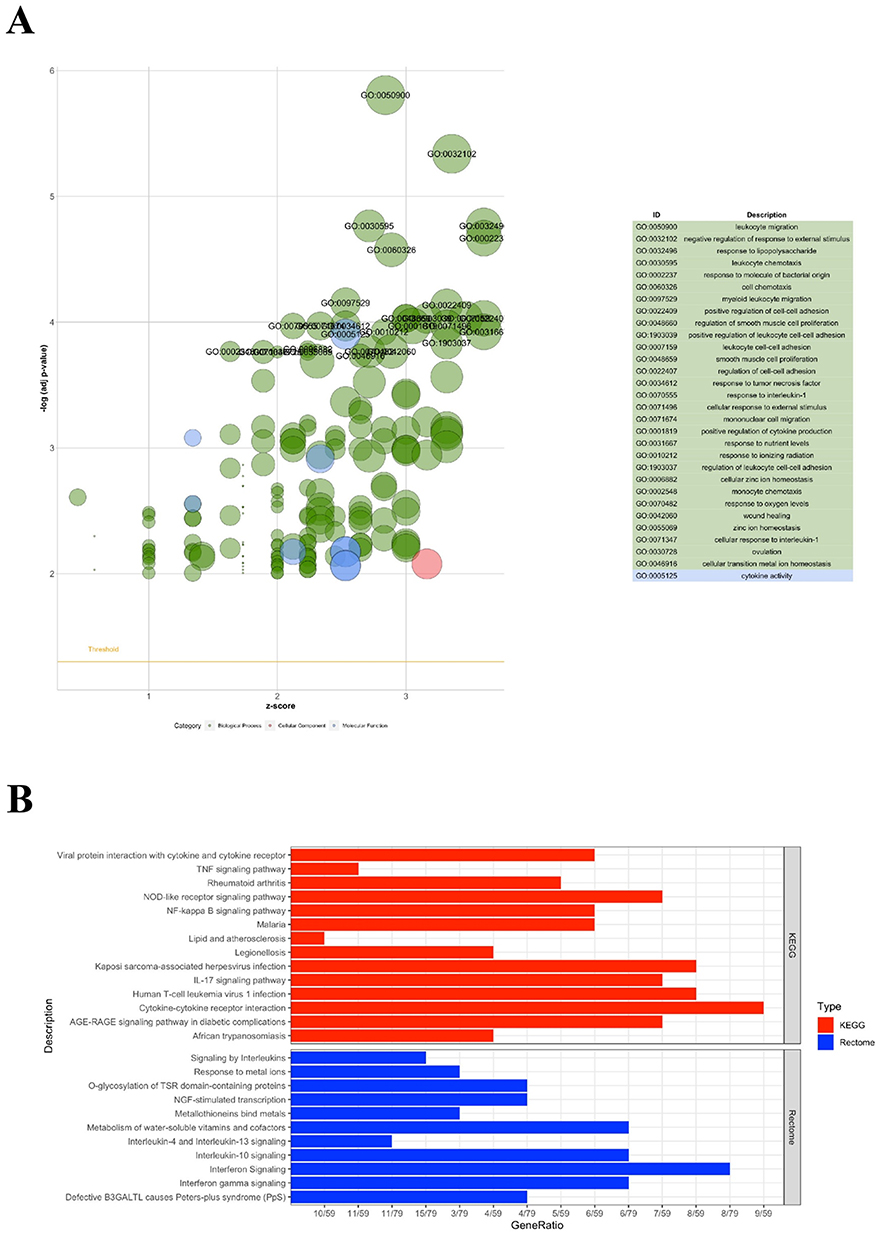 |
Figure 4 Functional Enrichment of Characteristic DEGs. (A) Gene Ontology (GO) enrichment results. (B) KEGG (upper panel; red) and Reactome (lower panel; blue) pathways enrichment results. Enriched terms are ranked by adjusted p-value; bar length represents gene count per term. |
KEGG pathway analysis corroborated and extended these findings, demonstrating significant enrichment for signal transduction cascades mediating inflammatory cytokine responses including IL-17 signaling (p = 2.3×10⁻⁶), TNF signaling (p = 8.1×10⁻⁵), and chemokine signaling pathways (p = 1.2×10⁻⁴). Intriguingly, pathways related to bacterial and viral infections were also significantly enriched, potentially indicating either infectious triggers or activation of pattern recognition receptor pathways in CSU (Figure 4B). Reactome pathway analysis provided granular detail on specific signaling cascades, particularly highlighting the involvement of interleukin signaling networks, complement activation, and G-protein coupled receptor signaling in CSU pathogenesis (Figure 4B). Integration of enrichment results across databases revealed a core set of 23 pathways consistently identified across all three annotation systems, providing high-confidence therapeutic targets.
Immune Cell Landscape Analysis Reveals Altered Cellular Composition in CSU Lesions
To characterize the cellular immunological milieu of CSU, we performed comprehensive deconvolution analysis of tissue-infiltrating immune cells using CIBERSORT. All analyzed samples passed quality control with deconvolution p-values < 0.05, ensuring reliable cellular fraction estimates. The analysis revealed striking alterations in immune cell composition specifically within lesional skin, while non-lesional skin maintained an immune profile remarkably similar to healthy controls (Figure 5A).
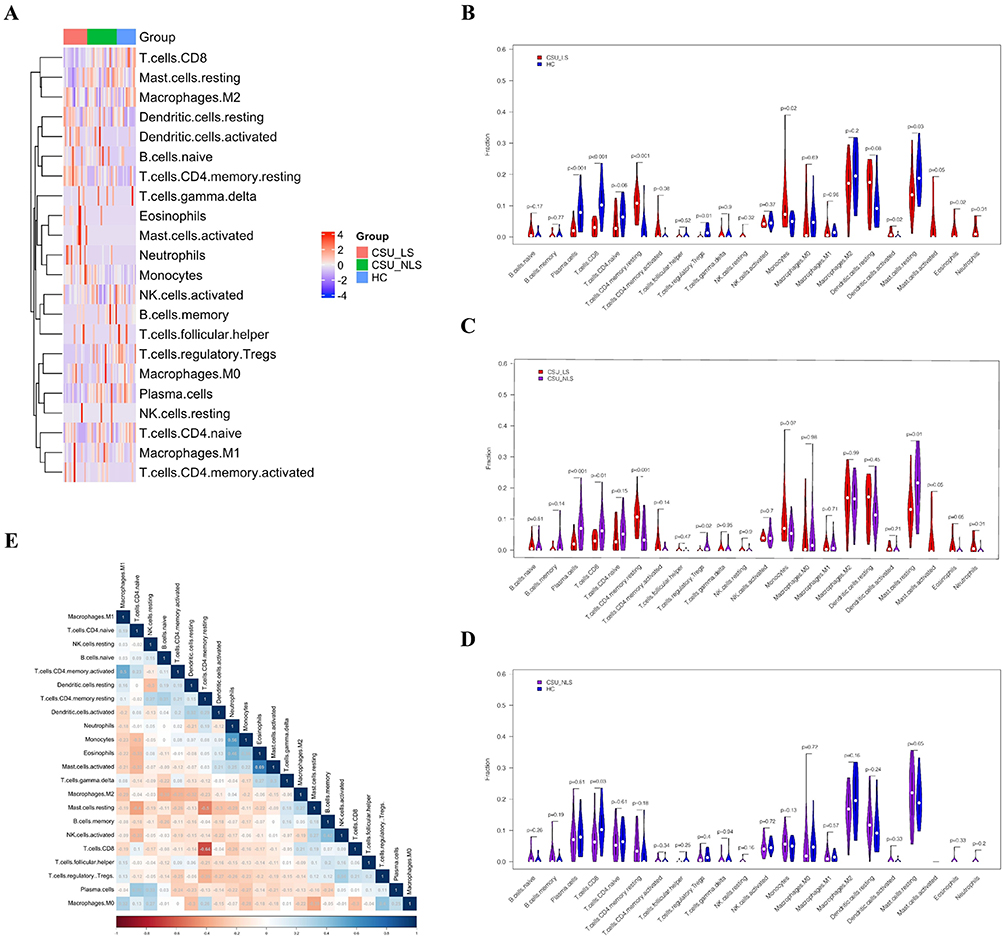 |
Figure 5 Immune Cell Infiltration Profiles. (A) Heatmap illustrating the distribution and relative abundance of 22 immune cell types across LS, NLS, and HC biopsies. (B–D) Bar plots comparing immune cell proportions in LS versus HC (B), LS versus NLS (C), and NLS versus HC (D). (E) Correlation heatmap depicting relationships among infiltrating immune cell types. |
Comparative analysis between lesional skin and healthy controls unveiled significant perturbations in both innate and adaptive immune compartments. Lesional skin exhibited marked depletion of plasma cells (mean difference: −3.2% ± 0.8%, p < 0.001), CD8+ T cells (−4.1% ± 1.2%, p < 0.001), regulatory T cells (−2.8% ± 0.6%, p < 0.01), and resting mast cells (−5.3% ± 1.4%, p < 0.001) (Figure 5B). Conversely, substantial enrichment was observed for monocytes (+3.7% ± 0.9%, p < 0.01), activated dendritic cells (+2.1% ± 0.5%, p < 0.05), resting CD4+ memory T cells (+4.8% ± 1.3%, p < 0.001), eosinophils (+3.2% ± 0.8%, p < 0.01), and neutrophils (+6.4% ± 1.7%, p < 0.001).
The comparison between lesional and non-lesional skin from CSU patients revealed similar patterns, confirming that immune dysregulation is spatially restricted to active lesions (Figure 5C). Principal component analysis of immune cell profiles demonstrated clear separation of lesional samples from both non-lesional and control samples along PC1 (explaining 42% of variance), with myeloid cell populations being the primary drivers of this separation. Notably, non-lesional and healthy control skin showed minimal differences in immune composition, with only CD8+ T cells exhibiting modest variation (Figure 5D).
Correlation analysis among infiltrating immune populations revealed intricate cellular relationships within the tissue microenvironment. A strong negative correlation emerged between CD8+ T cells and CD4+ memory T cells (r = −0.62, p < 0.001), suggesting potential competitive or mutually exclusive infiltration patterns. Network analysis of immune cell correlations identified two distinct cellular clusters: a myeloid-dominant cluster comprising neutrophils, eosinophils, and activated mast cells, and a lymphoid cluster encompassing various T cell subsets. Particularly noteworthy was the positive correlation between eosinophils and activated mast cells (r = 0.58, p < 0.001), supporting coordinated type 2 immune responses in CSU pathogenesis (Figure 5E). Together, these findings indicate that the CSU lesional microenvironment is characterized by a shift from immunoregulatory to pro-inflammatory cellular programs, with the simultaneous enrichment of myeloid effector cells and depletion of regulatory populations creating conditions that favor chronic, self-sustaining inflammation.
Protein Interaction Network Analysis Identifies Core Molecular Hubs in CSU
Construction of protein-protein interaction networks for the 101 characteristic DEGs yielded a highly interconnected molecular network comprising 86 nodes and 650 edges, indicating extensive functional relationships among CSU-associated proteins with an average node degree of 15.1 and clustering coefficient of 0.42, significantly exceeding random network expectations (p < 0.001) (Figure 6A). The network’s high connectivity suggested coordinated molecular responses rather than isolated pathway perturbations.
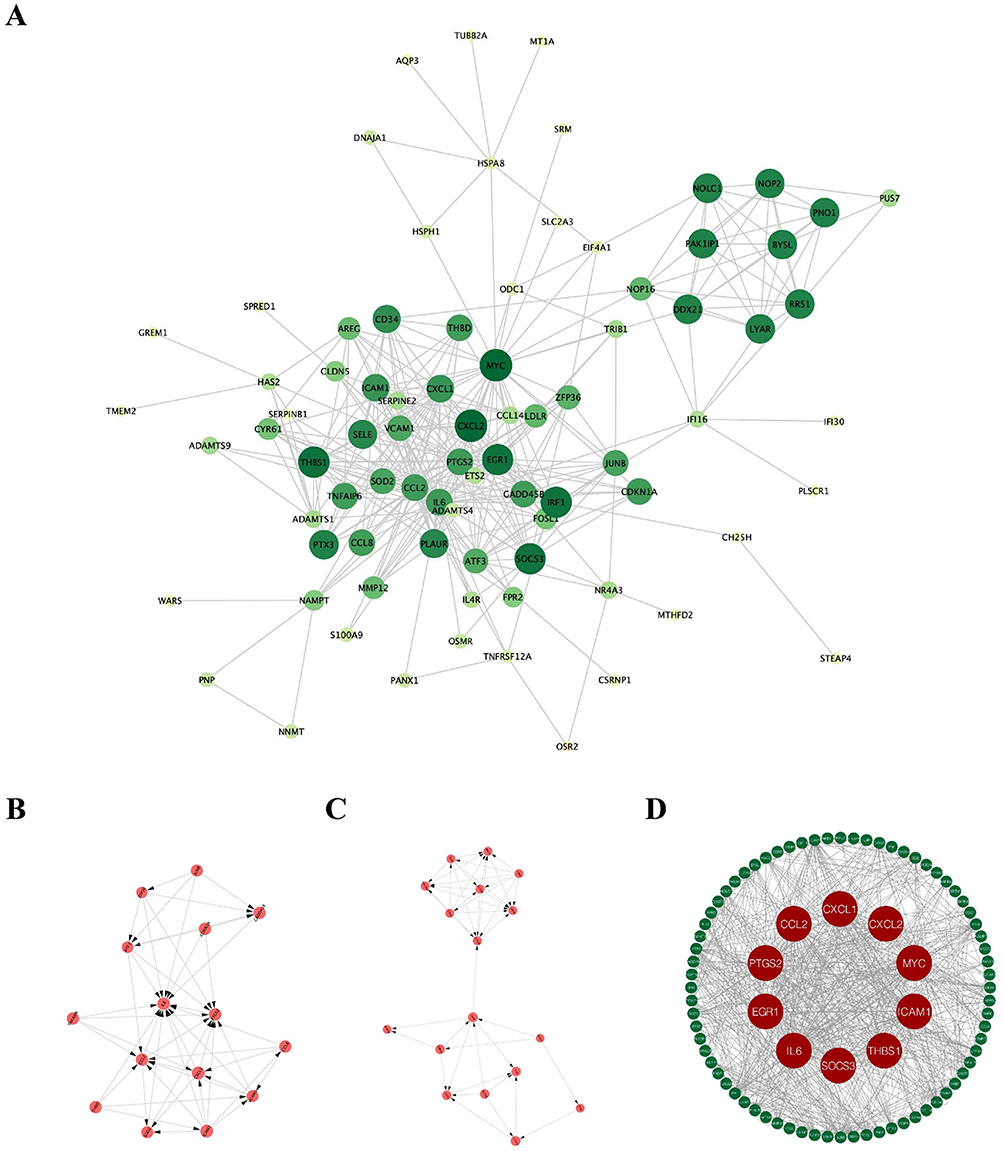 |
Figure 6 Protein-Protein Interaction (PPI) Network and Hub Gene Identification. (A) PPI network of characteristic DEGs, with nodes representing genes and edges indicating interactions; node size reflects MCODE k-score. (B and C) Subnetworks of densely connected clusters identified by MCODE: cluster 1 (B) and cluster 2 (C). (D) Visualization of 10 hub genes (CXCL2, MYC, THBS1, EGR1, SOCS3, CXCL1, ICAM1, IL6, PTGS2, CCL2) selected using CentiScaPe and MCODE algorithms. |
Topological analysis using the MCODE algorithm identified two densely connected protein clusters representing potential functional modules. Cluster 1, achieving a score of 7.14, encompassed 15 nodes connected by 100 edges, predominantly comprising inflammatory mediators and their receptors. Functional annotation of Cluster 1 revealed enrichment for acute phase response proteins and chemokine signaling components (p < 0.001). Cluster 2, with a score of 5.75, contained 17 nodes and 92 edges, with notable representation of transcriptional regulators and cell adhesion molecules showing enrichment for NF-κB signaling pathway components (p < 0.01) (Figure 6B and C).
Comprehensive centrality analysis using CentiScaPe identified ten hub genes exhibiting exceptional network properties across multiple metrics. These genes—CXCL2, MYC, THBS1, EGR1, SOCS3, CXCL1, ICAM1, IL6, PTGS2, and CCL2—satisfied stringent criteria including MCODE scores exceeding 6, degree greater than 30, betweenness centrality above 100, and closeness centrality exceeding 0.005 (Table 2 and Figure 6D). Bootstrap analysis with 1000 iterations confirmed the statistical robustness of hub gene identification (stability > 0.85 for all hub genes). These hub genes represent diverse functional categories including chemokines (CXCL1, CXCL2, CCL2), transcriptional regulators (MYC, EGR1), inflammatory mediators (IL6, PTGS2), and negative feedback regulators (SOCS3), suggesting their potential as multifaceted therapeutic targets. Biologically, the prominence of chemokines CXCL1, CXCL2, and CCL2 as hub genes underscores the central role of immune cell recruitment in sustaining lesional inflammation, as these molecules are primary drivers of neutrophil and monocyte chemotaxis. The co-identification of IL6 and PTGS2 highlights the involvement of both cytokine-mediated amplification and prostaglandin-dependent vascular changes in CSU pathology, while SOCS3 likely reflects an activated but insufficient negative feedback loop attempting to restrain excessive cytokine signaling.
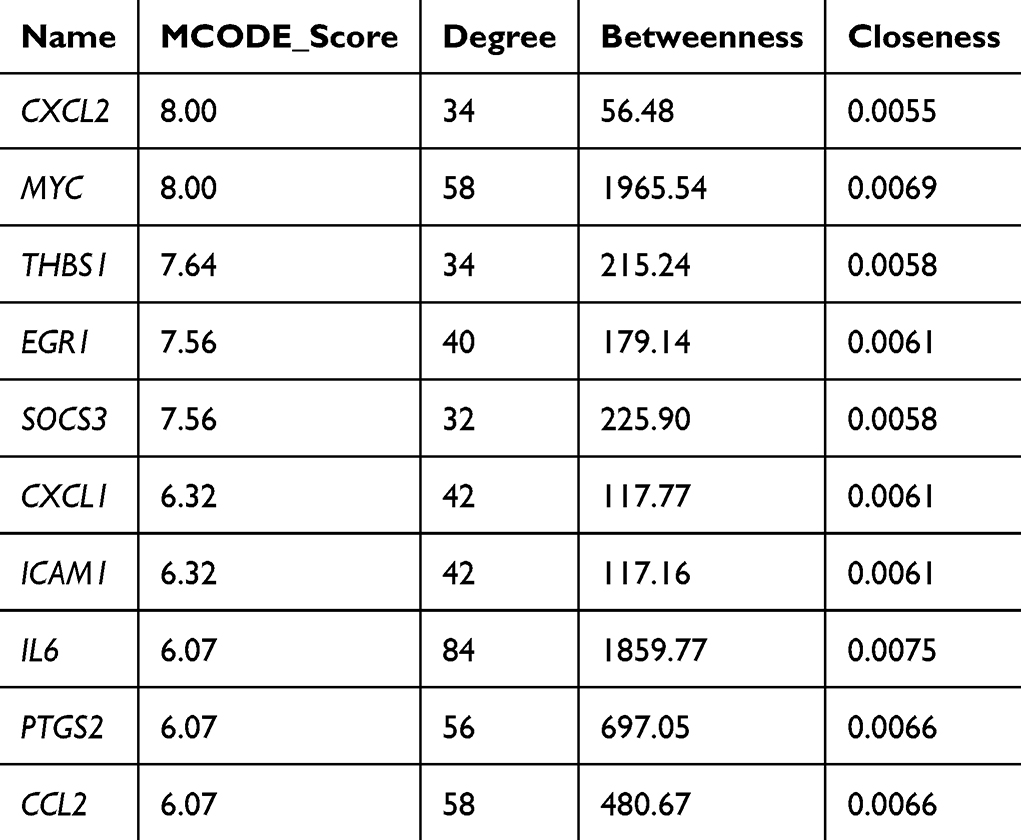 |
Table 2 Hub Genes Identified by CentiScaPe and MCODE |
Hub Genes Demonstrate Specific Associations with Infiltrating Immune Populations
Integration of hub gene expression profiles with immune cell infiltration data revealed highly specific and biologically coherent associations. Pearson correlation analysis demonstrated that seven of the ten hub genes exhibited strong positive correlations with activated mast cells, the primary effector cells in CSU pathogenesis. CXCL2 and CXCL1 showed the strongest associations (r = 0.75 for both, p < 0.001), followed by PTGS2 (r = 0.67, p < 0.001), EGR1 (r = 0.64, p < 0.001), MYC (r = 0.57, p < 0.01), and both IL6 and SOCS3 (r = 0.56, p < 0.01). These correlations remained significant after adjustment for multiple testing using false discovery rate correction (q < 0.05).
Hub genes also demonstrated significant associations with eosinophils, another key cell type in allergic inflammation. MYC and PTGS2 exhibited the strongest eosinophil correlations (r = 0.62 for both, p < 0.001), while CXCL2, EGR1, CXCL1, and SOCS3 showed moderate but significant associations (r = 0.51–0.56, all p < 0.01). The coordinated expression of hub genes with both mast cells and eosinophils suggests their involvement in type 2 immune response orchestration.
Analysis of hub gene relationships with adaptive immune cells revealed THBS1 as specifically associated with resting memory CD4+ T cells (r = 0.57, p < 0.01), potentially indicating a role in T cell recruitment or retention within lesional tissue. Several hub genes demonstrated strong correlations with neutrophil infiltration, including IL6 (r = 0.67, p < 0.001), PTGS2 (r = 0.61, p < 0.001), and both MYC and ICAM1 (r = 0.60, p < 0.001), supporting the emerging recognition of neutrophilic inflammation in CSU subset. Hierarchical clustering of correlation patterns revealed two distinct hub gene groups: a myeloid-associated cluster (CXCL1, CXCL2, PTGS2, IL6) and a lymphoid-associated cluster (THBS1, ICAM1), with MYC showing promiscuous associations across cell types. The monocyte-specific associations of CXCL1 (r = 0.64, p < 0.001) and ICAM1 (r = 0.55, p < 0.01), coupled with the negative correlation between ICAM1 and plasma cells (r = −0.61, p < 0.001), further illustrate the complex cellular interactions mediated by these hub genes (Figure 7A–J).
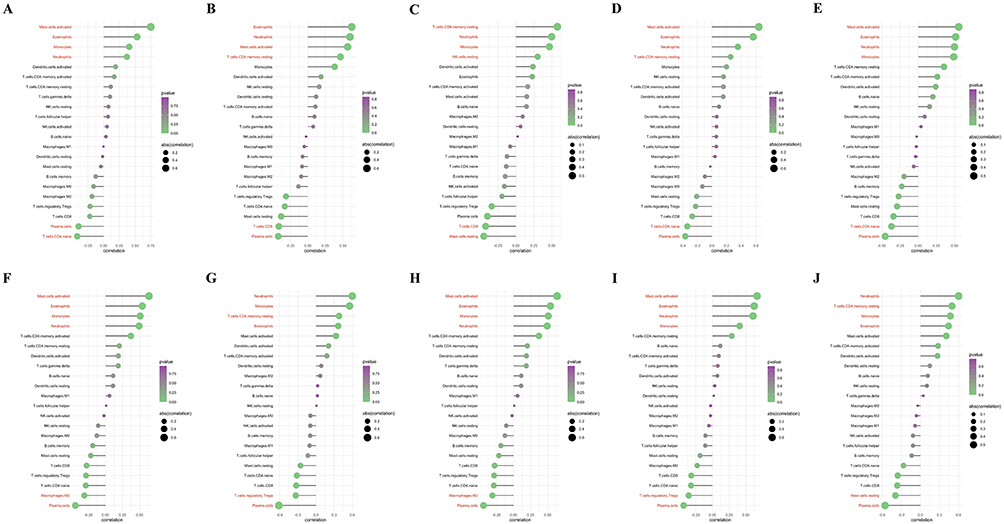 |
Figure 7 Correlations Between Hub Genes and Immune Cells. (A–J) Scatterplots illustrating Pearson correlations between hub genes and tissue-infiltrating immune cells: CXCL2 (A), MYC (B), THBS1 (C), EGR1 (D), SOCS3 (E), CXCL1 (F), ICAM1 (G), IL6 (H), PTGS2 (I), and CCL2 (J), highlighting associations with activated mast cells, eosinophils, neutrophils, and other immune cell types. Immune cell types shown in red indicate the cell subsets with the strongest positive and/or negative correlations with each hub gene (highlighted for emphasis). Dot color indicates p value and dot size indicates |r|. |
Experimental Validation Confirms Temporal Dynamics of Hub Gene Expression in Mast Cell Activation
To validate our bioinformatic findings and establish the temporal dynamics of hub gene expression during mast cell activation, we employed an established IgE-mediated activation model using RBL-2H3 basophilic cells. Successful sensitization was confirmed by β-hexosaminidase release assay showing 42% ± 5% degranulation upon DNP-HSA stimulation versus 3% ± 1% in unstimulated controls (p < 0.001). Real-time quantitative PCR analysis revealed distinct temporal expression patterns for mast cell-associated hub genes following activation.
Early-phase responses (2 hours post-stimulation) demonstrated predominantly downregulation of hub genes, with CXCL2 showing the most pronounced suppression (0.32 ± 0.08-fold, p < 0.01), followed by SOCS3 (0.45 ± 0.12-fold, p < 0.05) and EGR1 (0.52 ± 0.14-fold, p < 0.05). This early suppression potentially represents immediate feedback mechanisms limiting initial inflammatory responses.
Conversely, late-phase responses (8 hours post-stimulation) exhibited marked upregulation of multiple hub genes. IL6 demonstrated the most substantial induction (8.4 ± 2.1-fold, p < 0.001), followed by PTGS2 (6.2 ± 1.8-fold, p < 0.001), CXCL1 (4.7 ± 1.3-fold, p < 0.01), and MYC (3.9 ± 0.9-fold, p < 0.01) (Figure 8). This biphasic expression pattern was reproducible across three independent experiments with coefficient of variation < 25% for all measured genes.
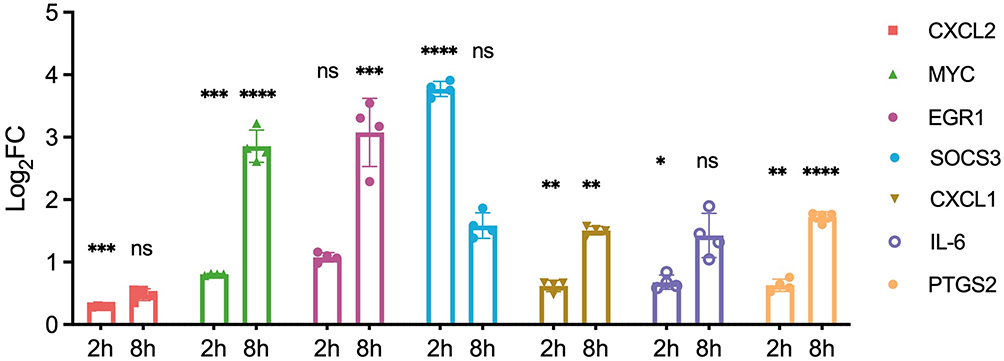 |
Figure 8 Validation of Mast Cell-Related Gene Expression. Bar plot showing relative mRNA expression levels of hub genes associated with activated mast cells in RBL-2H3 cells, comparing unstimulated controls to cells stimulated with DNP-HSA for 2 and 8 hours, as determined by RT-qPCR. Data are presented as mean ± SEM from three independent experiments. *p < 0.05, **p < 0.01, ***p < 0.001, ****p < 0.0001 versus unstimulated control (Student’s t-test). Abbreviation: ns, non-significant. |
The temporal expression dynamics observed in our experimental model corroborate the bioinformatic predictions of hub gene involvement in mast cell biology. The transition from early suppression to late-phase induction suggests these hub genes participate in both immediate regulatory responses and sustained inflammatory programs characteristic of CSU pathophysiology. Mechanistically, the early downregulation may represent a transient negative feedback response aimed at limiting initial degranulation-associated tissue damage, while the subsequent robust upregulation likely reflects the activation of de novo transcriptional programs driven by NF-κB and AP-1 signaling that sustain the late-phase inflammatory response. This biphasic pattern mirrors the clinical observation of early wheal formation followed by prolonged inflammation in CSU lesions. These validation experiments provide mechanistic support for the identified hub genes as genuine participants in CSU-relevant mast cell activation cascades, strengthening their candidacy as therapeutic targets.
Discussion
CSU is a complex, idiopathic inflammatory skin disorder characterized by recurrent wheals and angioedema, driven by diverse immunological and non-immunological triggers. Immunological CSU involves antibody-mediated activation of mast cells, leading to degranulation and cytokine release, whereas non-immunological CSU is associated with physical or chemical stimuli such as cold, ultraviolet radiation, or xenobiotics.20 The reliance on clinical diagnosis and the limited efficacy of current therapies, such as antihistamines and omalizumab, underscore the need for a deeper understanding of CSU’s pathogenesis to develop targeted interventions. By leveraging bioinformatics approaches, including WGCNA, differential expression analysis, and immune infiltration profiling, this study elucidates key molecular and cellular mechanisms underlying CSU and identifies 10 hub genes (CXCL2, MYC, THBS1, EGR1, SOCS3, CXCL1, ICAM1, IL6, PTGS2, CCL2) as promising therapeutic targets.
The application of WGCNA revealed six gene modules comprising 3,114 genes highly correlated with CSU phenotypes, particularly in lesional skin (LS) compared to non-lesional skin (NLS) and healthy controls (HC). Differential expression analysis further confirmed that pathological gene expression changes are predominantly confined to LS, with NLS exhibiting profiles similar to HC. These findings suggest that CSU manifests primarily at sites of active inflammation, leaving unaffected skin largely unaltered at the transcriptomic level. This spatial specificity aligns with prior transcriptomic studies, which reported distinct molecular signatures in CSU skin lesions.21 The identification of 101 characteristic differentially expressed genes (DEGs) through the intersection of WGCNA and DEG analyses provided a robust foundation for exploring CSU’s molecular pathology.
Functional enrichment analyses confirmed the centrality of inflammatory pathways in CSU, including mast cell activation, neutrophil chemotaxis, and cytokine-chemokine signaling.15,22 The enrichment of pathways related to bacterial and viral infections suggests a potential role for pattern recognition receptor activation or microbial triggers, consistent with clinical observations linking infections to CSU flares.23,24 The involvement of coagulation pathways aligns with evidence of thrombin-mediated mast cell activation in CSU.25 Notably, the emergence of metabolic processes—including nitric oxide and vitamin metabolism—as significantly enriched categories suggests that CSU involves metabolic reprogramming beyond classical inflammatory cascades. Nitric oxide, through its regulation of vascular permeability and endothelial function, may directly contribute to wheal formation by facilitating plasma extravasation.26 Altered vitamin D metabolism, increasingly linked to immune cell differentiation and function, could modulate both innate and adaptive immune responses in CSU, representing a potentially modifiable therapeutic target.27
The identification of 10 hub genes through PPI network analysis provides mechanistic insights into how inflammatory signaling is coordinated in CSU lesions. CXCL1 and CXCL2, both CXC-family chemokines, likely drive neutrophil recruitment to urticarial wheals—a process directly linked to the neutrophilic infiltrate observed in a subset of CSU patients with more severe disease.15 CCL2, a potent monocyte chemoattractant, may facilitate the monocyte influx we identified in lesional skin, potentially contributing to sustained antigen presentation and chronic inflammation. IL6, a pleiotropic cytokine, occupies a central position in the network and likely amplifies inflammation through both classical and trans-signaling pathways, promoting acute-phase responses and inhibiting regulatory T cell differentiation—consistent with the Treg depletion we observed in lesional skin. PTGS2 (COX-2) catalyzes prostaglandin synthesis, which enhances vascular permeability and edema formation central to wheal pathology. ICAM1 mediates leukocyte adhesion and transmigration across the endothelium, a prerequisite for the immune cell infiltration characteristic of CSU lesions. The transcription factor EGR1 and the proto-oncogene MYC are immediate early genes that regulate inflammatory gene programs downstream of FcεRI activation, while SOCS3 acts as a negative regulator of JAK-STAT signaling and may represent an endogenous but insufficient braking mechanism. THBS1, involved in extracellular matrix remodeling and TGF-β activation, may contribute to tissue remodeling in chronic lesions. These hub genes overlap with targets of biologics effective in related inflammatory diseases, such as tocilizumab (anti-IL-6R) and dupilumab,28 and the preliminary efficacy of secukinumab in CSU further supports the therapeutic potential of targeting cytokine-driven inflammation.29
Immune infiltration analysis revealed a distinct cellular landscape in LS, characterized by increased activated mast cells, eosinophils, neutrophils, monocytes, and resting CD4+ memory T cells, alongside reduced resting mast cells, regulatory T cells (Tregs), plasma cells, and CD8+ T cells. This shift likely reflects the recruitment and activation of mast cells in lesions, depleting their resting pool and triggering mediator release that recruits other immune cells.30 The positive correlation between eosinophils and activated mast cells supports their synergistic role in sustaining inflammation, as eosinophils release mediators like major basic protein that enhance mast cell activity.13 The reduced Treg population in LS, consistent with peripheral blood findings in CSU patients,31 suggests impaired immune regulation, potentially exacerbating chronic inflammation. The depletion of plasma cells and CD8+ T cells in LS may indicate their consumption during intense inflammatory responses or migration to lymphoid organs, warranting further investigation into their dynamics in CSU.32
Correlation analyses demonstrated strong associations between hub genes and infiltrating immune cells, particularly activated mast cells, eosinophils, and neutrophils. RT-qPCR validation in stimulated RBL-2H3 cells revealed temporal dynamics in hub gene expression, with downregulation in the early phase (2 hours) and upregulation in the late phase (8 hours). This biphasic pattern has important mechanistic implications: the early suppression of hub genes such as CXCL2 and SOCS3 may reflect immediate post-degranulation feedback mechanisms that transiently limit excessive mediator release, whereas the subsequent robust upregulation of IL6, PTGS2, and CXCL1 at 8 hours likely reflects de novo gene transcription driven by NF-κB and MAPK signaling cascades activated downstream of FcεRI crosslinking.33 This temporal regulation parallels the clinically observed early and late-phase responses in urticaria, where initial wheal formation (mediated by preformed mediators) is followed by a sustained inflammatory phase driven by newly synthesized cytokines and chemokines. The late-phase upregulation of these hub genes may thus represent a critical window during which therapeutic intervention could prevent the transition from acute to chronic inflammation. The consistency between bioinformatic predictions and experimental validation reinforces the reliability of our identified hub genes as therapeutic targets.
Despite these advances, several limitations merit consideration. First, the combined dataset included only 16 lesional skin biopsies, a relatively small sample size given the well-recognized heterogeneity of CSU with respect to disease triggers, severity, autoimmune associations, and treatment responsiveness. It is unlikely that this sample fully represents the spectrum of CSU phenotypes, and larger cohort studies will be essential to confirm the generalizability of our findings and to stratify hub gene expression across CSU subtypes. Second, the reliance on microarray data from public repositories, while enabling hypothesis generation, carries inherent limitations including potential platform-specific biases, batch effects (although addressed computationally), and inability to capture transcript isoforms or low-abundance transcripts. Future studies should incorporate single-cell RNA sequencing to resolve cell-specific contributions and spatial transcriptomics to map gene expression within the tissue architecture. Third, the in vitro validation using RBL-2H3 cells, while providing useful mechanistic insights, represents a simplified model that may not fully recapitulate the complexity of human mast cell responses within the tissue microenvironment, where interactions with other immune cells, stromal cells, and extracellular matrix components modulate gene expression. Validation in primary human mast cells, patient-derived samples, or humanized mouse models would strengthen these findings. Finally, the therapeutic potential of targeting these hub genes, while supported by their network centrality and immune cell correlations, remains to be established through preclinical and clinical studies, particularly given the systemic roles of genes such as IL6 and MYC in homeostasis and the potential for off-target effects.34
In conclusion, this study provides insights into the molecular and cellular mechanisms of CSU, integrating transcriptomic analysis with immune profiling and experimental validation. The identified hub genes represent candidates for further investigation as potential therapeutic targets, though their clinical utility requires validation in larger, well-characterized patient cohorts. Future research should prioritize clinical validation of these targets, exploration of the metabolic dimensions of CSU pathogenesis, and development of multi-omics approaches correlating therapeutic response with molecular profiles to advance precision medicine in CSU management.
Conclusion
This integrated transcriptomic and experimental study characterizes the molecular and cellular landscape of chronic spontaneous urticaria, identifying key inflammatory cascades involving cytokine-chemokine signaling, immune cell infiltration, coagulation pathways, and metabolic processes that contribute to chronic inflammation in CSU.
The ten hub genes—CXCL2, MYC, THBS1, EGR1, SOCS3, CXCL1, ICAM1, IL6, PTGS2, and CCL2—demonstrate strong associations with disease-relevant immune cell populations and represent candidates warranting further investigation as potential therapeutic targets. The distinctive immune microenvironment in lesional skin, characterized by elevated activated mast cells, eosinophils, and neutrophils alongside depleted regulatory T cells, reveals complex immune dysregulation underlying CSU manifestations.
However, these findings should be interpreted in the context of limitations including the relatively small sample size, reliance on publicly available microarray data, and in vitro validation in a single cell line model. Future studies incorporating larger patient cohorts, single-cell resolution technologies, and clinical correlation of hub gene expression with treatment responses will be essential to translate these findings toward precision medicine approaches for CSU management.
Data Sharing Statement
The microarray datasets analyzed in this study, GSE72540 and GSE57178, are publicly accessible via the GEO database (https://www.ncbi.nlm.nih.gov/geo/). Expression profiling was performed using platforms GPL16699 (GSE72540) and GPL6244 (GSE57178). Data processing was conducted with R packages “GEOquery,” “limma,” and “oligo” available through Bioconductor (https://www.bioconductor.org/). Transcription factor predictions utilized ChEA3 (https://maayanlab.cloud/chea3/) and TRRUST (https://www.grnpedia.org/trrust/). All other data generated or analyzed are included in this article.
Ethics Approval and Consent to Participate
This study was conducted in accordance with the Declaration of Helsinki. The bioinformatic analyses utilized exclusively publicly available, de-identified microarray datasets (GSE72540 and GSE57178) retrieved from the Gene Expression Omnibus (GEO) database. According to the regulations of the National Health Commission of the People’s Republic of China (Measures for Ethical Review of Life Science and Medical Research Involving Human Subjects, 2023, Article 32) and consistent with international guidelines including the US Common Rule (45 CFR 46.104(d)(4)), research involving only de-identified, publicly available datasets does not constitute human subjects research and is therefore exempt from Institutional Review Board (IRB) review. The original studies depositing these datasets obtained appropriate ethical approvals and informed consent from participants at the time of data collection. Furthermore, the in vitro experiments using the commercially available RBL-2H3 rat basophilic leukemia cell line did not involve human or animal subjects and therefore did not require ethical approval. Based on these considerations, this retrospective bioinformatic study was exempt from additional IRB review at our institution.
Author Contributions
Xueyi Wen; Conceptualization, Data curation, Formal analysis, Investigation, Methodology, Software, Supervision, Validation, Visualization, Writing – original draft, Writing – review & editing. Jing Zhang; Data curation, Investigation, Writing – review & editing. All authors gave final approval of the version to be published; have agreed on the journal to which the article has been submitted; and agree to be accountable for all aspects of the work.
Funding
This study received no specific funding. All resources were provided by the authors’ institutional support.
Disclosure
The authors declare no competing interests, financial or non-financial, that could influence the objectivity or integrity of this research.
References
1. Zuberbier T, Aberer W, Asero R, et al. The EAACI/GA2LEN/EDF/WAO guideline for the definition, classification, diagnosis and management of urticaria. Allergy. 2018;73(7):1393–19. doi:10.1111/all.13397
2. Maurer M, Weller K, Bindslev-Jensen C, et al. Unmet clinical needs in chronic spontaneous urticaria. A GA(2)LEN task force report. Allergy. 2011;66(3):317–330. doi:10.1111/j.1398-9995.2010.02496.x
3. Maurer M, Abuzakouk M, Berard F, et al. The burden of chronic spontaneous urticaria is substantial: real-world evidence from ASSURE-CSU. Allergy. 2017;72(12):2005–2016. doi:10.1111/all.13209
4. Guillén-Aguinaga S, Jáuregui Presa I, Aguinaga-Ontoso E, Guillén-Grima F, Ferrer M. Updosing nonsedating antihistamines in patients with chronic spontaneous urticaria: a systematic review and meta-analysis. Br J Dermatol. 2016;175(6):1153–1165. doi:10.1111/bjd.14768
5. Maurer M, Rosén K, Hsieh HJ, et al. Omalizumab for the treatment of chronic idiopathic or spontaneous urticaria. N Engl J Med. 2013;368(10):924–935. doi:10.1056/NEJMoa1215372
6. Metz M, Ohanyan T, Church MK, Maurer M. Omalizumab is an effective and rapidly acting therapy in difficult-to-treat chronic urticaria: a retrospective clinical analysis. J Dermatol Sci. 2014;73(1):57–62. doi:10.1016/j.jdermsci.2013.08.011
7. Agache I, Akdis CA, Akdis M, et al. EAACI biologicals guidelines-Omalizumab for the treatment of chronic spontaneous urticaria in adults and in the paediatric population 12-17 years old. Allergy. 2022;77(1):17–38. doi:10.1111/all.15030
8. Maurer M, Altrichter S, Bieber T, et al. Efficacy and safety of omalizumab in patients with chronic urticaria who exhibit IgE against thyroperoxidase. J Allergy Clin Immunol. 2011;128(1):202–209. doi:10.1016/j.jaci.2011.04.038
9. Church MK, Kolkhir P, Metz M, Maurer M. The role and relevance of mast cells in urticaria. Immunol Rev. 2018;282(1):232–247. doi:10.1111/imr.12632
10. Bandara G, Metcalfe DD, Kirshenbaum AS. Growth of human mast cells from bone marrow and peripheral blood-derived CD34(+) pluripotent hematopoietic cells. Methods Mol Biol. 2015;1220:155–162. doi:10.1007/978-1-4939-1568-2_10
11. Yanase Y, Takahagi S, Ozawa K, Hide M. The role of coagulation and complement factors for mast cell activation in the pathogenesis of chronic spontaneous urticaria. Cells. 2021;10(7):1759–1769. doi:10.3390/cells10071759
12. Kolkhir P, Church MK, Weller K, Metz M, Schmetzer O, Maurer M. Autoimmune chronic spontaneous urticaria: what we know and what we do not know. J Allergy Clin Immunol. 2017;139(6):1772–1781. doi:10.1016/j.jaci.2016.08.050
13. Altrichter S, Frischbutter S, Fok JS, et al. The role of eosinophils in chronic spontaneous urticaria. J Allergy Clin Immunol. 2020;145(6):1510–1516. doi:10.1016/j.jaci.2020.03.005
14. Puccetti A, Bason C, Simeoni S, et al. In chronic idiopathic urticaria autoantibodies against Fc epsilon RII/CD23 induce histamine release via eosinophil activation. Clin Exp Immunol. 2005;35(12):1599–1607. doi:10.1111/j.1365-2222.2005.02380.x
15. Martins CF, Morais KL, Figueroa P, et al. Histopathological and clinical evaluation of chronic spontaneous urticaria patients with neutrophilic and non-neutrophilic cutaneous infiltrate. Allergol Int. 2018;67(1):114–118. doi:10.1016/j.alit.2017.06.012
16. Ritchie ME, Phipson B, Wu D, et al. limma powers differential expression analyses for RNA-sequencing and microarray studies. Nucleic Acids Res. 2015;43(7):e47. doi:10.1093/nar/gkv007
17. Altaf-Ul-Amin M, Shinbo Y, Mihara K, Kurokawa K, Kanaya S. Development and implementation of an algorithm for detection of protein complexes in large interaction networks. BMC Bioinform. 2006;7:207–220. doi:10.1186/1471-2105-7-207
18. Benhamou M, Stephan V, Robbins K, Siraganian R. High-affinity IgE receptor-mediated stimulation of rat basophilic leukemia (RBL-2H3) cells induces early and late protein-tyrosine phosphorylations. J Biol Chem. 1992;267(11):7310–7314. doi:10.1016/S0021-9258(18)42520-3
19. Falcone FH, Wan D, Barwary N, Sagi‐Eisenberg R. RBL cells as models for in vitro studies of mast cells and basophils. Immunol Rev. 2018;282(1):47–57. doi:10.1111/imr.12628
20. Hennino A, Bérard F, Guillot I, Saad N, Rozières A, Nicolas JF. Pathophysiology of urticaria. Clin Rev Allergy Immunol. 2006;30(1):3–11. doi:10.1385/criai:30:1:003
21. Giménez-Arnau A, Curto-Barredo L, Nonell L, et al. Transcriptome analysis of severely active chronic spontaneous urticaria shows an overall immunological skin involvement. Allergy. 2017;72(11):1778–1790. doi:10.1111/all.13183
22. Collington SJ, Williams TJ, Weller CL. Mechanisms underlying the localisation of mast cells in tissues. Trends Immunol. 2011;32(10):478–485. doi:10.1016/j.it.2011.08.002
23. Bansal CJ, Bansal AS. Stress, pseudoallergens, autoimmunity, infection and inflammation in chronic spontaneous urticaria. Allergy Asthma Clin Immunol. 2019;15:56–67. doi:10.1186/s13223-019-0372-z
24. Minciullo PL, Cascio A, Barberi G, Gangemi S. Urticaria and bacterial infections. Allergy Asthma Proc. 2014;35(4):295–302. doi:10.2500/aap.2014.35.3764
25. Cugno M, Marzano AV, Asero R, Tedeschi A. Activation of blood coagulation in chronic urticaria: pathophysiological and clinical implications. Intern Emerg Med. 2010;5(2):97–101. doi:10.1007/s11739-009-0333-5
26. Förstermann U, Sessa WC. Nitric oxide synthases: regulation and function. Eur Heart J. 2012;33(7):829–837d. doi:10.1093/eurheartj/ehr304
27. Holick MF. The vitamin D deficiency pandemic: approaches for diagnosis, treatment and prevention. Rev Endocr Metab Disord. 2017;18(2):153–165. doi:10.1007/s11154-017-9424-1
28. Guttman-Yassky E, Bissonnette R, Ungar B, et al. Dupilumab progressively improves systemic and cutaneous abnormalities in patients with atopic dermatitis. J Allergy Clin Immunol. 2019;143(1):155–172. doi:10.1016/j.jaci.2018.08.022
29. Feldborg SEB, Thomsen SF, Vestergaard C. Treatment refractory chronic spontaneous urticaria may benefit from treatment with dupilumab: a case series of eight patients. J Eur Acad Dermatol Venereol. 2024;38(10). doi:10.1111/jdv.19976
30. Kay AB, Ying S, Ardelean E, et al. Elevations in vascular markers and eosinophils in chronic spontaneous urticarial weals with low-level persistence in uninvolved skin. Br J Dermatol. 2014;171(3):505–511. doi:10.1111/bjd.12991
31. Sun RS, Sui JF, Chen XH, et al. Detection of CD4+ CD25+ FOXP3+ regulatory T cells in peripheral blood of patients with chronic autoimmune urticaria. Australas J Dermatol. 2011;52(3):e15–8. doi:10.1111/j.1440-0960.2010.00658.x
32. Sallusto F, Lanzavecchia A, Araki K, Ahmed R. From vaccines to memory and back. Immunity. 2010;33(4):451–463. doi:10.1016/j.immuni.2010.10.008
33. Metcalfe DD, Peavy RD, Gilfillan AM. Mechanisms of mast cell signaling in anaphylaxis. J Allergy Clin Immunol. 2009;124(4):639–648. doi:10.1016/j.jaci.2009.08.035
34. Kumari N, Dwarakanath BS, Das A, Bhatt AN. Role of interleukin-6 in cancer progression and therapeutic resistance. Tumor Biol. 2016;37(9):11553–11572. doi:10.1007/s13277-016-5098-7
 © 2026 The Author(s). This work is published and licensed by Dove Medical Press Limited. The
full terms of this license are available at https://www.dovepress.com/terms
and incorporate the Creative Commons Attribution
- Non Commercial (unported, 4.0) License.
By accessing the work you hereby accept the Terms. Non-commercial uses of the work are permitted
without any further permission from Dove Medical Press Limited, provided the work is properly
attributed. For permission for commercial use of this work, please see paragraphs 4.2 and 5 of our Terms.
© 2026 The Author(s). This work is published and licensed by Dove Medical Press Limited. The
full terms of this license are available at https://www.dovepress.com/terms
and incorporate the Creative Commons Attribution
- Non Commercial (unported, 4.0) License.
By accessing the work you hereby accept the Terms. Non-commercial uses of the work are permitted
without any further permission from Dove Medical Press Limited, provided the work is properly
attributed. For permission for commercial use of this work, please see paragraphs 4.2 and 5 of our Terms.
Recommended articles
Identification of an Immune-Related Gene Diagnostic Model and Potential Drugs in Sepsis Using Bioinformatics and Pharmacogenomics Approaches
Chen P, Chen J, Ye J, Yang L
Infection and Drug Resistance 2023, 16:5665-5680
Published Date: 28 August 2023
Identification of Immune-Related Genes as Biomarkers for Uremia

Lyu D, He G, Zhou K, Xu J, Zeng H, Li T, Tang N
International Journal of General Medicine 2023, 16:5633-5649
Published Date: 29 November 2023
Based on Weighted Gene Co-Expression Network Analysis Reveals the Hub Immune Infiltration-Related Genes Associated with Ulcerative Colitis
Tan Z, Liu C, He P, Wu Y, Li J, Zhang J, Dong W
Journal of Inflammation Research 2024, 17:357-370
Published Date: 17 January 2024
A Novel Immune-Related Three-Gene Signature and Immune Infiltration Insights in Psoriasis and Chronic Kidney Disease
Yin T, Zhang T, Ma L
Clinical, Cosmetic and Investigational Dermatology 2025, 18:267-286
Published Date: 25 January 2025
Integrative Bioinformatics Analysis and Machine Learning Reveal TSPAN7 Regulates the Involution of Infantile Hemangioma via NK Cells
Bai J, Lin S
Clinical, Cosmetic and Investigational Dermatology 2026, 19:619344
Published Date: 14 July 2026