Back to Journals » Journal of Inflammation Research » Volume 16
Identification and Validation of Immune-Related Genes Diagnostic for Progression of Atherosclerosis and Diabetes
Authors Fu Y ![]() , Xu L, Zhang H, Ding N, Zhang J, Ma S, Yang A, Hao Y, Gao Y
, Xu L, Zhang H, Ding N, Zhang J, Ma S, Yang A, Hao Y, Gao Y ![]() , Jiang Y
, Jiang Y
Received 20 October 2022
Accepted for publication 18 January 2023
Published 10 February 2023 Volume 2023:16 Pages 505—521
DOI https://doi.org/10.2147/JIR.S393788
Checked for plagiarism Yes
Review by Single anonymous peer review
Peer reviewer comments 2
Editor who approved publication: Dr Adam Bachstetter
Yajuan Fu,1,2 Lingbo Xu,1– 3 Hui Zhang,1– 3 Ning Ding,1– 3 Juan Zhang,1– 3 Shengchao Ma,1– 3 Anning Yang,1– 3 Yinjv Hao,1– 3 Yujing Gao,1,2 Yideng Jiang1– 3
1National Health Commission Key Laboratory of Metabolic Cardiovascular Diseases Research, Ningxia Medical University, Yinchuan, People’s Republic of China; 2Ningxia Key Laboratory of Vascular Injury and Repair Research, Ningxia Medical University, Yinchuan, People’s Republic of China; 3School of Basic Medical Sciences, Ningxia Medical University, Yinchuan, People’s Republic of China
Correspondence: Yujing Gao; Yideng Jiang, Email [email protected]; [email protected]
Background: Atherosclerosis and type 2 diabetes mellitus contribute to a large part of cardiovascular events, but the underlying mechanism remains unclear. In this study, we focused on identifying the linking genes of the diagnostic biomarkers and effective therapeutic targets associated with these two diseases.
Methods: The transcriptomic datasets of atherosclerosis and type 2 diabetes mellitus were obtained from the GEO database. Differentially expressed genes analysis was performed by R studio software, and differential analysis including functional enrichment, therapeutic small molecular agents prediction, and protein–protein interaction analysis were applied to the common shared differentially expressed genes. Hub genes were identified and further validated using an independent dataset and clinical samples. Furthermore, we measured the expression correlations, immune cell infiltration, and diagnostic capability of the three key genes.
Results: We screened out 28 up-regulated and six down-regulated common shared differentially expressed genes. Functional enrichment analysis showed that cytokines and immune activation were involved in the development of these two diseases. Six small molecules with the highest absolute enrichment value were identified. Three critical genes (CD4, PLEK, and THY1) were further validated both in validation sets and clinical samples. The gene correlation analysis showed that CD4 was strongly positively correlated with PLEK, and ROC curves confirmed the good discriminatory capacity of CD4 and PLEK in two diseases.We have established the co-expression network between atherosclerosis lesions progressions and type 2 diabetes mellitus, and identified CD4 and PLEK as key genes in the two diseases, which may facilitate both development of diagnosis and therapeutic strategies.
Keywords: small molecular agents, immune infiltration, atherosclerosis, diabetes mellitus, inflammation
Introduction
As a systemic disease with focal manifestations and the primary process of cardiovascular diseases (CVDs), atherosclerosis (AS) is one of the leading causes of death and disability worldwide.1 The atheromatous plaques develop from an early stage to advanced atherosclerosis, which was symbolized with an increased plaque necrotic core, and thinner fibrous caps; the plaques are prone to rupture. The disruption of unpredictable and destabilizing plaques leads to serious cardiac events, such as myocardial infarction and stroke, or, even worse, sudden cardiac death (SCD).2,3 Therefore, exploring and improving diagnosis and therapies of high-risk plaques occurring in “vulnerable” patients is of significance for reducing cardiovascular events.4
The association of diabetes mellitus with CVD has been established for decades, and it can occur before or after atherosclerotic CVD (ASCVD) and can cause or aggravate ASCVD.5 It is reported that patients with diabetes mellitus tend to have advanced coronary plaques with larger necrotic core areas, and greater calcification in arterial media, especially in patients with type 2 diabetes mellitus (T2DM).6,7 Several factors such as LDL-cholesterol (LDL-C) and inflammatory factors were considered to contribute to CVD risk of patients with diabetes.7 Besides, studies have confirmed that insulin signaling contributes to atherosclerosis and deletion of insulin receptors in SMC cells resulted in reduced intimal hyperplasia8 and accelerated atherosclerotic lesions in the endothelium.9 Nevertheless, the link between AS and T2DM at the genetic level is rarely systematically developed. Therefore, the identification of novel diagnostic markers and therapeutic targets is particularly important for early diagnosis and specific intervention of T2DM-associated AS progression.
RNA-seq and microarray technologies are effective tools to explore genes involved in the pathogenesis of diseases and identify diagnostic biomarkers or explore therapeutic targets for the disease.10 Several transcriptomic profiling studies have revealed differentially expressed genes (DEGs) involved in atherosclerosis progression and T2DM. For instance, levels of CCL4, CCL18, MMP9, and SPP1 were increased in ruptured plaques, which could be used as interventional targets.11 ACLY,12 SERPING1, and ANPEP13 were proved to be correlated with the development of T2DM. Jiao et al14 reported that four genes (CD40, F11R, TNRC18, and CAMK2G) act as potential biomarkers for CVD in non-diabetic patients. However, strategies focused on linking high-risk atherosclerotic plaques and T2DM are limited and remain further developed.
To probe the underlying mechanisms of the development of AS and T2DM, we obtained four datasets containing advanced atherosclerotic plaque-related and T2DM-associated expression profiles from the Gene Expression Omnibus (GEO) database. After identifying the common shared DEGs between these two diseases, we performed functional enrichment analysis for understanding the biological processes. Then, small molecular agents were identified based on the shared DEGs. Finally, hub genes were verified based on protein–protein interaction (PPI) networks and validated in two other validation datasets and clinical samples. The expression correlation between hub genes and their distinguishing capacity was also measured, which provide hypersensitized diagnostic biomarkers and promising intervention targets for T2DM-associated atherosclerotic disease progression.
Materials and Methods
Microarray Datasets Acquisition
Microarray profiles related to AS and T2DM were screened and obtained from the GEO database (https://www.ncbi.nlm.nih.gov/geo/). The GSE28829 series, including 13 early (intimal thickening and intimal xanthoma) and 16 advanced (thin or thick fibrous cap atheroma) atherosclerotic plaque samples from carotid artery, and GSE20966 dataset, which contains 10 T2DM and 10 non-diabetic data, were chosen as training sets. Two datasets, GSE43292, which consist of 32 early-stage (stages I and II of the Stary classification) and 32 advanced plaques (stage IV and over), and GSE25724, containing seven T2DM and six non-diabetic controls, were brought into validation sets analysis (Table 1).
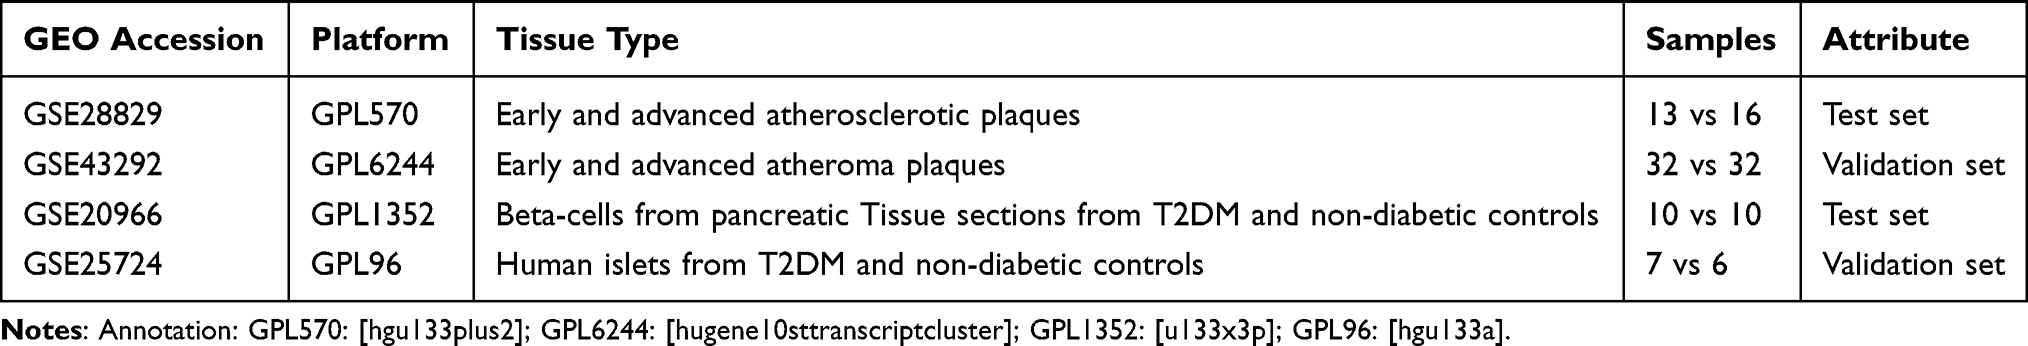 |
Table 1 The Summary of Datasets Used in This Study |
Data Preprocessing
The Series Matrix files were obtained and normalized with robust multiarray average (RMA) method15 to remove batch effects based on R version 3.6.3, and then log2 transformation was performed for probe matrix. We matched probes and gene symbols via the Bioconductor package with the corresponding annotation document,16 and the average value was calculated in the presence of duplicate expression data. DEGs were identified using limma package of R Bioconductor, and only genes with a P-value <0.05 and |logFC | >0.5 were considered as significant DEGs. Volcano plots were created using GraphPad prism 9.0 (San Diego, CA). The common up- and down-regulated significant DEGs shared between the GSE28829 and GSE20966 datasets were overlapped with an online Venn tool (http://www.bioinformatics.com.cn/static/others/jvenn/example.html). The enrichment analysis of Gene Ontology (GO) and the Kyoto Encyclopedia of Genes and Genomes (KEGG) pathway of DEGs were carried out with the web server (http://www.bioinformatics.com.cn/basic_local_go_pathway_enrichment_analysis_122), which have contributed extensively to our understanding of gene functional categories.
The Protein–Protein Interaction (PPI) Networks Establishment
PPI networks are mathematical representations of the physical connection between gene candidates at the protein level and used to further understand disease mechanisms and drug discovery.17 PPI networks of common DEGs were constructed based on the STRING database (http://string-db.org)18 with the minimum required interaction score (combined score >0.4).19 Then, the interaction information was downloaded and visualized with Cytoscape software (v3.8.0). CytoHubba plug-in (http://apps.cytoscape.org/apps/CytoHubba)20 in Cytoscape was applied to screen the Top 10 node genes in eight algorithms, including betweenness, bottleNeck, edge percolated component (EPC), degree, maximal clique centrality (MCC), maximum neighborhood component (MNC), radiality, and stress in the PPI networks.
Prediction of Therapeutic Small Molecular Agents
Small candidate molecules were identified with the Broad Institutes Connectivity Map (cMAP) database (https://portals.broadinstitute.org/cmap).21 To classify the candidate small molecules targeting in AS and T2DM treatment, all common shared DEGs in GSE28829 and GSE29906 datasets were uploaded into the cMAP database. The molecules with high negative values might have potential therapeutic effects on the two diseases. PubChem (https://pubchem.ncbi.nml.gov) and ChemDraw were used to obtain the detailed information and draw the compound’s structure.
Validation of Hub Genes Expression
All the identified hub genes were further validated in GSE43292 and GSE25724 to avoid false positive rates. The comparison between the early and advanced, or T2DM and non-diabetic groups of the two sets was calculated with the T-test. A P-value <0.05 was considered a significant difference between the groups.
Receiver Operating Characteristic (ROC) Curves of the Hub Genes
To evaluate the predictive efficiency for disease of the identified critical genes, the accuracy of hub genes was evaluated by ROC validation and the area under the curve (AUC) values were calculated by an online website (https://www.xiantao.love/products/). Efficacy evaluation: non-efficiency (AUC≦0.5); modest-efficiency (0.5<AUC<0.7); high-efficiency (AUC>0.7).
Immune Cell Infiltration Analysis of Critical Genes
CIBERSORT, a deconvolution algorithm, was utilized to predict the infiltration abundance of 22 diverse immune cells.22 The association of critical genes and infiltrated immune cells was performed by an online website (http://vip.sangerbox.com/home.html) with Spearman’s rank analysis.
Clinical Samples Collection and qRT-PCR Analysis
We collected peripheral blood from 31 healthy controls and 30 patients with AS and T2DM from the Affiliated Hospital Ningxia Medical University between 2021 to 2022. We confirm that all participants provided informed consent, in accordance with the Declaration of Helsinki. This study was approved by the Ethics Committee in Ningxia Medical University, China (2021-Z009). RNA was extracted from peripheral blood using TRIzol reagent (Invitrogen, US) and cDNA was synthesized using reverse transcription kit (Applied Biosystems) according to the introduction. Quantitative real-time PCR was performed on a BioRad CFX96 real-time with KAPA SYBR green FAST BioRad icycler kit (Peqlab). The expression of target genes was determined with the 2 −ΔΔCt method of β-actin as control. Primers were used as follows, human PLEK Forward: AAGAAGGGGAGCGTGTTCAAT, human PLEK Reverse: TCAGCGGGATCATTCCTTTGG; human THY1 Forward: ATCGCTCTCCTGCTAACAGTC, human THY1 Reverse: CTCGTACTGGATGGGTGAACT; human CD4 Forward: TGCCTCAGTATGCTGGCTCT, human CD4 Reverse: GAGACCTTTGCCTCCTTGTTC; human β-actin Forward: CATGTACGTTGCTATCCAGGC, human β-actin Reverse: CTCCTTAATGTCACGCACGAT.
Statistical Analyses
Rstudio software and GraphPad Prism 8.0 software were used to draw graphics and conduct statistical analysis. All of the data are shown as mean±SD. P<0.05 indicated statistical significance.
Results
Co-Expression Genes Shared in AS and T2DM
The study flowchart is shown in Figure 1. To identify the co-expressed genes in AS and T2DM, microarray data were taken from two datasets: GSE28829 (early vs advanced plaques) and GSE29906 (T2DM vs non-diabetics sample) for training sets. After normalization and logarithmization of the data, we deleted the probes with no annotation information and calculated the average value in the presence of duplicate expression data using R software. Genes with a screening criteria of P<0.05 and |logFC|>0.5 were identified as DEGs. In total, 965 DEGs (602 upregulated and 363 downregulated genes) in the GSE28829 dataset and 644 DEGs (373 upregulated and 271 downregulated genes) in the GSE29906 dataset were separately identified and visualized by volcano plot in Figure 2A and B. Then, we extracted the co-expressed genes between two datasets, and 28 upregulated and six downregulated genes were screened as potential crosstalk genes by Venn diagrams (Figure 2C and D), which indicated that there might be a common pathogenesis in AS and T2DM.
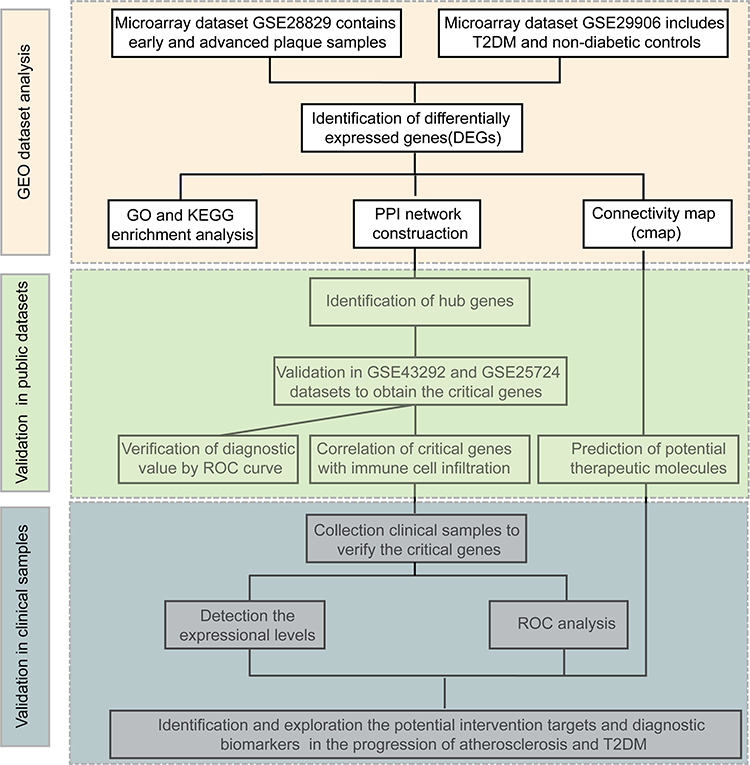 |
Figure 1 Workflow of this study. |
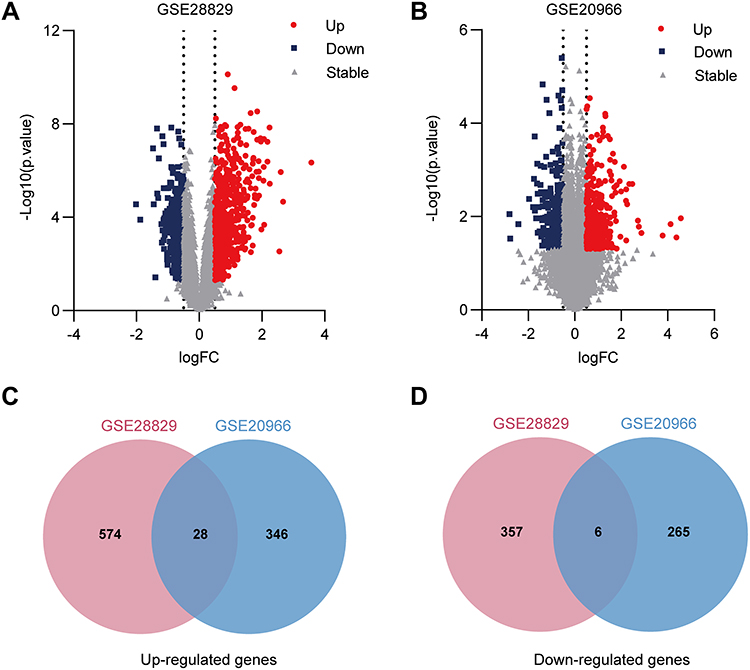 |
Figure 2 The common shared genes between AS and T2DM. (A and B) Volcano plot of all DEGs between (A) early and advanced plaque groups in GSE28829 dataset or (B) T2DM and control group in GSE20966 dataset analyzed by the limma R package, genes with a P-value <0.05 and |logFC| >0.5 were considered as significant DEGs, red dots indicate the up-regulated genes, blue squares represent down-regulated genes, and gray triangles indicate non-significant genes; (C and D) Venn diagram of up- and down-regulated genes in the two datasets. |
Functional Enrichment Analysis of the Common Shared DEGs
In order to further analyze the biological functions and pathways, GO enrichment and KEGG pathway enrichment analysis based on common DEGs were performed. As shown in Figure 3, GO enrichment results revealed that the variations in biological process (BP) were mostly enriched in regulation of cytokine production (P=8.06E-6), immune response (P=1.46E-5), and leukocyte activation (P=5.39E-6). In the cellular component (CC), most genes were enriched in the secretory granule membrane (P=8.98E-6) and cell leading edge (P=0.0005) and in molecular function (MF), most genes were enriched in phosphatidylinositol binding and phospholipid binding (Figure 3A–C). The results of KEGG enrichment analysis exhibited that pertussis, lipid, and atherosclerosis and cytokine-cytokine receptor interaction were significantly enriched (Figure 3D). Taken together, these results strongly suggested that inflammatory pathways and immune activation were involved in the development of AS and T2DM.
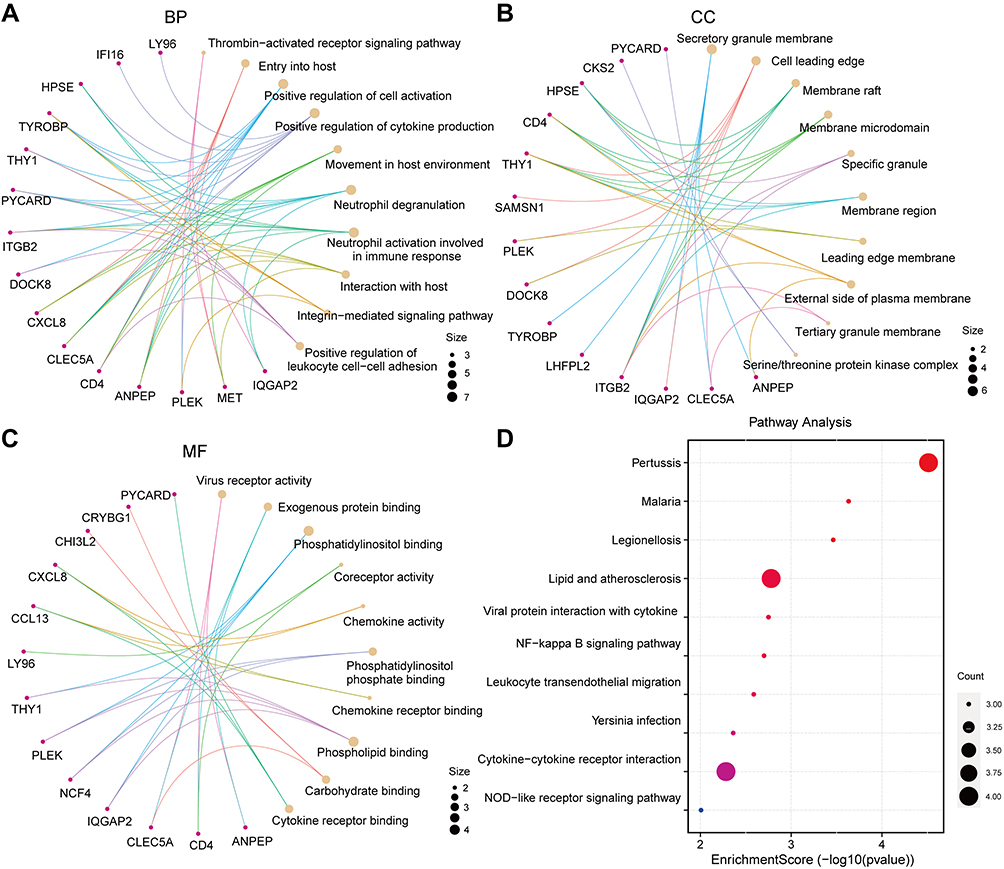 |
Figure 3 GO anal and KEGG pathways enrichment analysis of the common DEGs. (A–C) GO categories of biological process (BP), cellular component (CC), and molecular function (MF), respectively. (D) KEGG enrichment analysis of DEGs. |
Identification of Therapeutic Small Molecular Agents Based on the DEGs
Whereas several drugs approved for treating diabetes were of benefit for AS, their effect is controversial.23 For instance, though peroxisome proliferator-activated receptor (PPAR) γ agonist, pioglitazone benefits in the reduction and stabilization of coronary plaque lesions in patients with T2DM,24,25 it can increase plasma HDL-C levels and adiponectin,26 suggesting an unmet medical need to identify optimal drugs. Therefore, we predicted the potential therapeutic small molecular agents based on the common shared DEGs. According to the results of cMap database, we identified many potential therapeutic small molecular agents based on the upregulated genes. The top six small molecules with the highest absolute enrichment values were selected and shown in Table 2, including Desoxypeganine, Aminogenistein, Desoxycortone, SJ-172550, BJM-CSC-19, and Actarit, which might have potential in AS and T2DM treatment. Then, detailed information and the compound’s structure were obtained and plotted using PubChem and ChemDraw. The 3D conformation of the six small molecules is shown in Figure 4, which might target the corresponding genes and contribute to the treatment of AS and T2DM.
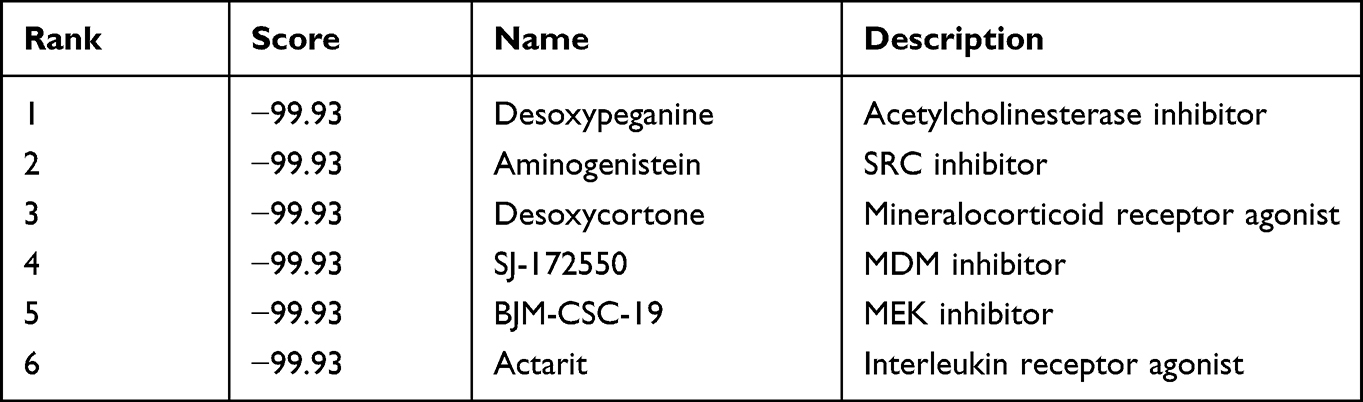 |
Table 2 Six Small Molecules Predicted with the Common Shared DEGs |
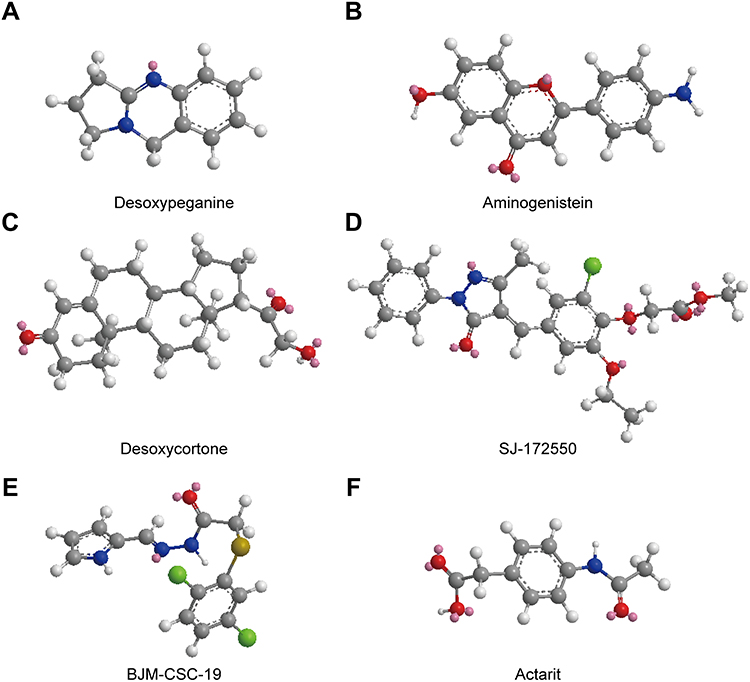 |
Figure 4 The structure of six small molecules. (A) Desoxypeganine; (B) Aminogenistein; (C) Desoxycortone; (D) SJ-172550; (E) BJM-CSC-19 and (F) Actarit. |
PPI Networks Construction and Hub Genes Identification
To further study the interaction between common shared DEGs in AS and T2DM, a PPI network of the 34 DEGs was established based on the STRING database and visualized by Cytoscape software. The red boxes indicate the up-regulated genes and the blue boxes represent down-regulated genes (Figure 5). The hub genes were selected from the PPI network with CytoHubba plug-in in Cytoscape based on eight topological methods, including betweenness, bottleNeck, EPC, degree, MCC, MNC, radiality, and stress (Table 3). After intersection, eight genes including CD4, CXCL8, DOCK8, ITGB2, NCF4, PLEK, THY1, and TYROBP, were found and their functional information was obtained (Table 4). Therefore, these genes could be considered as the kernel targets of AS and T2DM diseases.
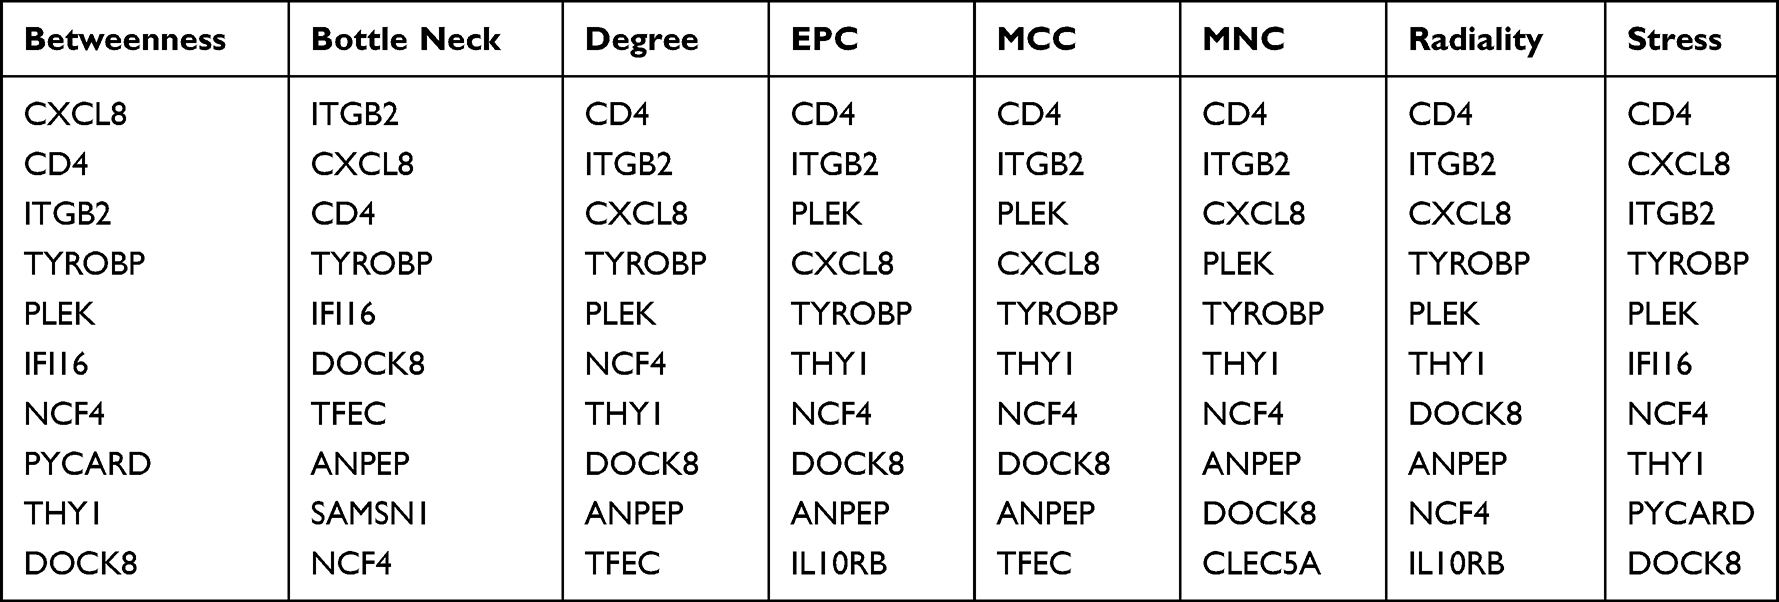 |
Table 3 The Top 10 Hub Genes Analyzed by cytoHubba |
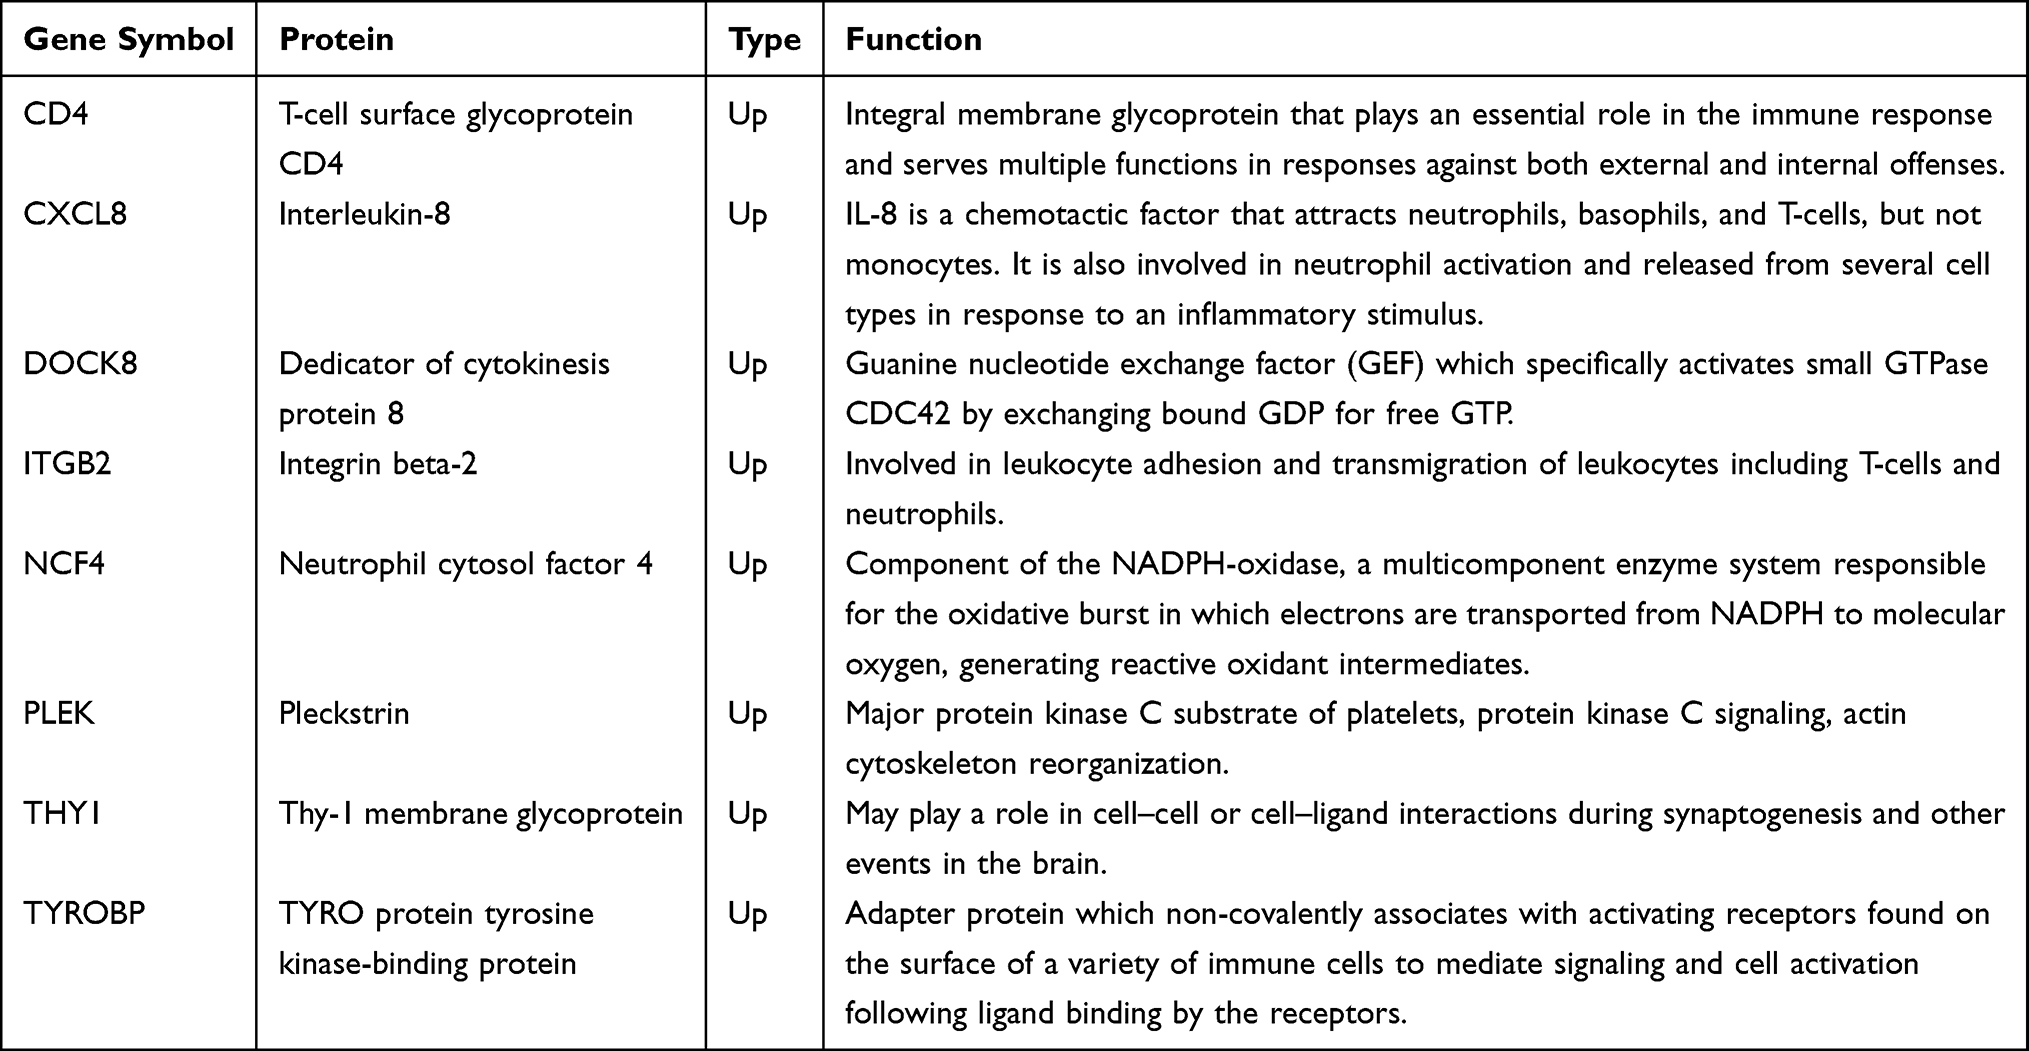 |
Table 4 Functional Roles of Hub Genes |
 |
Figure 5 Construction of PPI network. The red boxes indicate the up-regulated genes and the blue boxes represent down-regulated genes. |
Identification and Exploration of Diagnostic Biomarkers
For verification of the reliability of the eight hub genes, we first validated the expression of these genes in the GSE43292 dataset, which contains AS-related samples. As shown in Figure 6, all the hub genes in this data set were upregulated significantly in the advanced plaques group compared with the early group. In the GSE25724 dataset, only three genes including CD4, PLEK, and THY1 expression levels were significantly increased in the T2DM group, in comparison with the non-diabetic group (Figure 7). Altogether, these three genes (CD4, PLEK, and THY1) could act as a bridge between AS and T2DM, and were selected for subsequent analysis. Moreover, we analyzed the correlation between the three genes and found that CD4 expression levels were strongly positively correlated with PLEK both in AS and T2DM related datasets (r>0.9) (Figure 8A and B). To further evaluate the discriminatory ability of CD4, PLEK, and THY1 among the two diseases, ROC curves were plotted based on the expression data of these genes in GSE43292 and GSE25724. As shown in Figure 8C and D, the AUCs of CD4, PLEK, and THY1 were 0.846, 0.846, and 0.685, respectively, in the AS-related validation dataset. Furthermore, the AUC values of these three genes were greater than 0.8 in the T2DM-related validation dataset with an AUC of 0.952, 0.833, and 0.976 for CD4, PLEK, and THY1, respectively. Given the above, CD4 and PLEK might hold a powerful discrimination capability as potential biomarkers for AS and T2DM diseases.
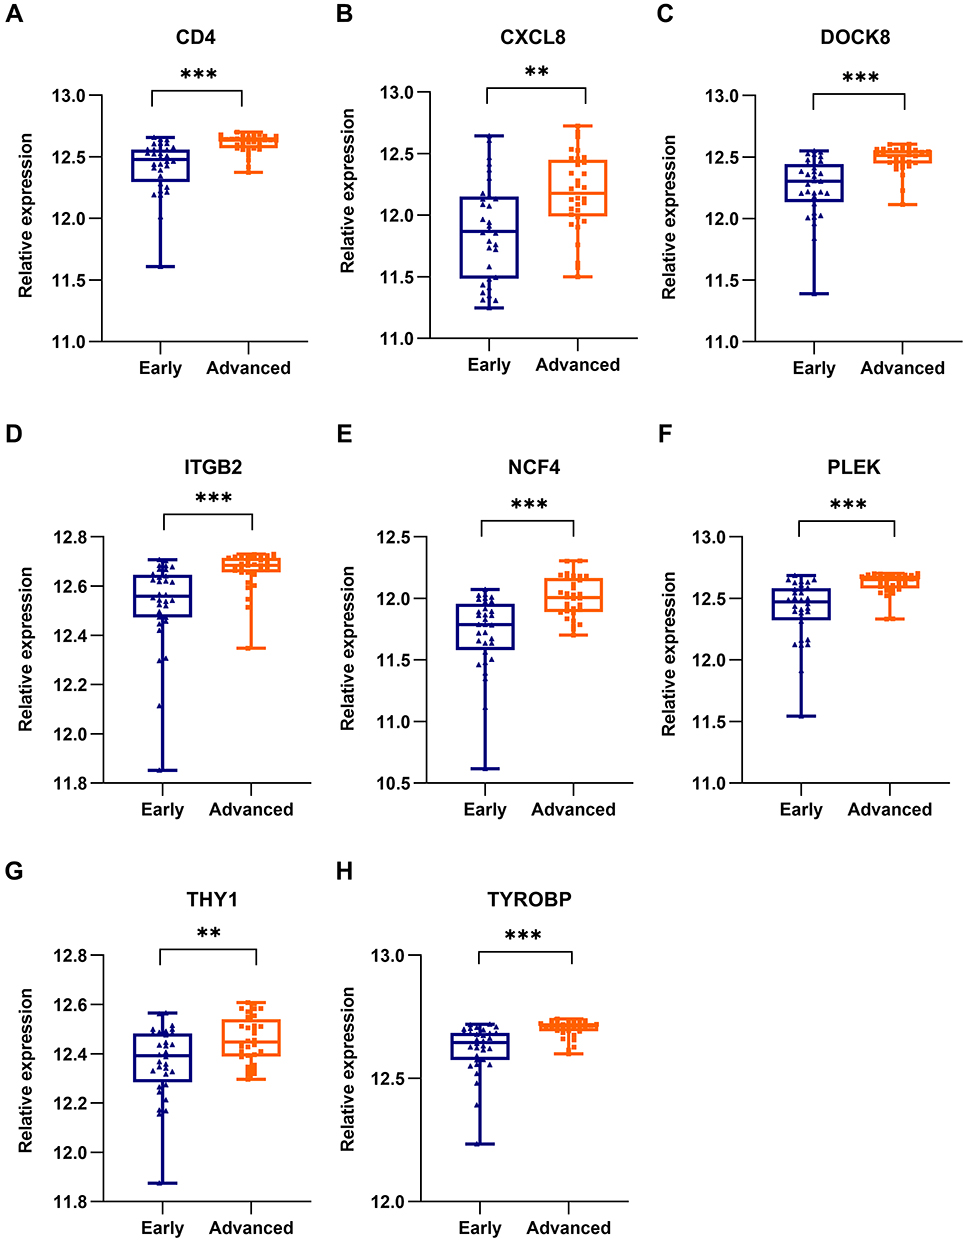 |
Figure 6 Validation of the identified hub genes in the AS-related dataset. The expression of (A) CD4, (B) CXCL8, (C) DOCK8, (D) ITGB2, (E) NCF4, (F) PLEK, (G) THY1, and (H) TYROBP between early and advanced groups in GSE43292 dataset. T-test was employed in the comparison. * P<0.05, ** P<0.01, *** P<0.001. |
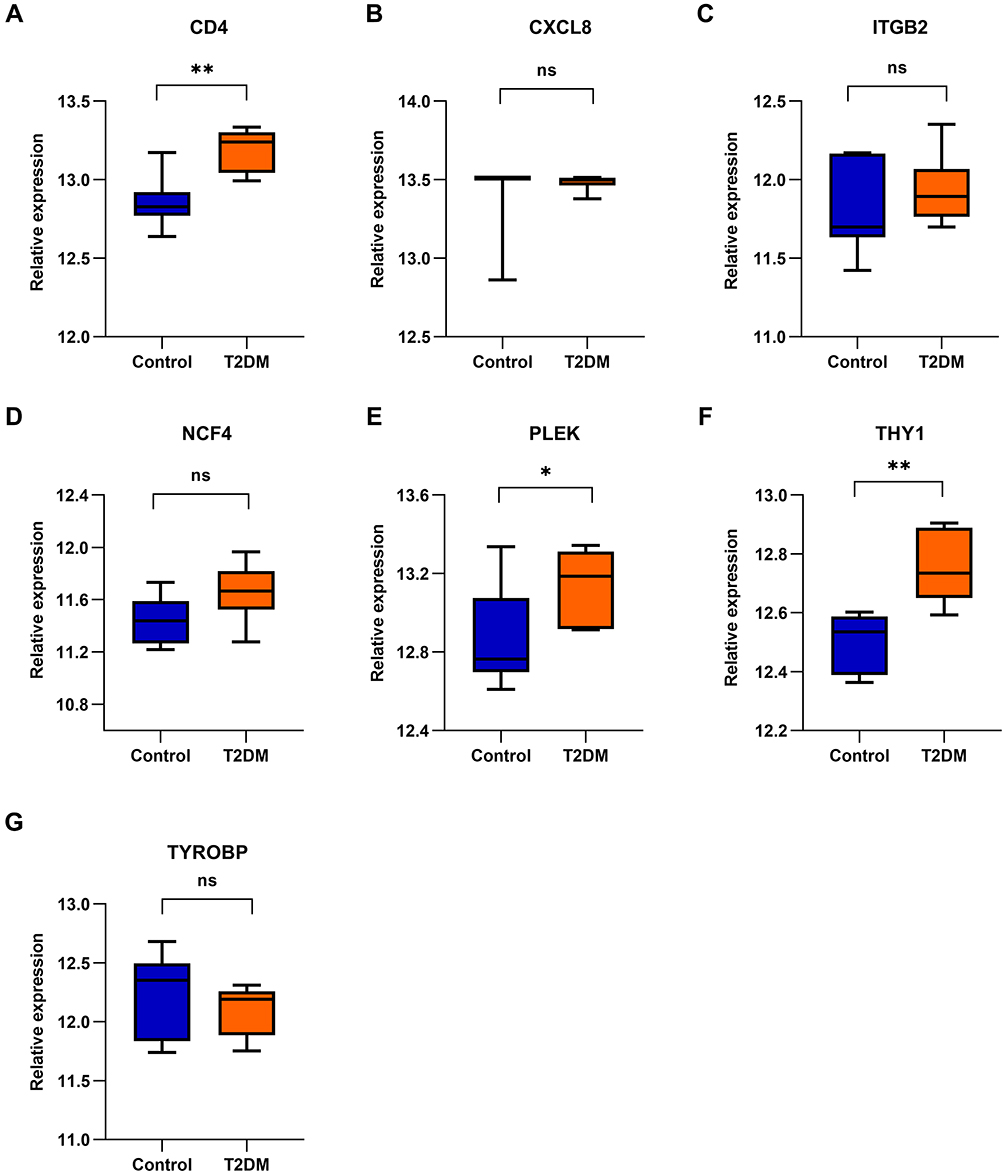 |
Figure 7 Validation of the seven hub genes between T2DM and non-diabetic groups in GSE25724. (A) CD4; (B) CXCL8; (C) ITGB2; (D) NCF4; (E) PLEK; (F) THY1; and (G) TYROBP. T-test was used to determine statistical significance. * P<0.05, ** P<0.01. Abbreviation: ns, no significant difference. |
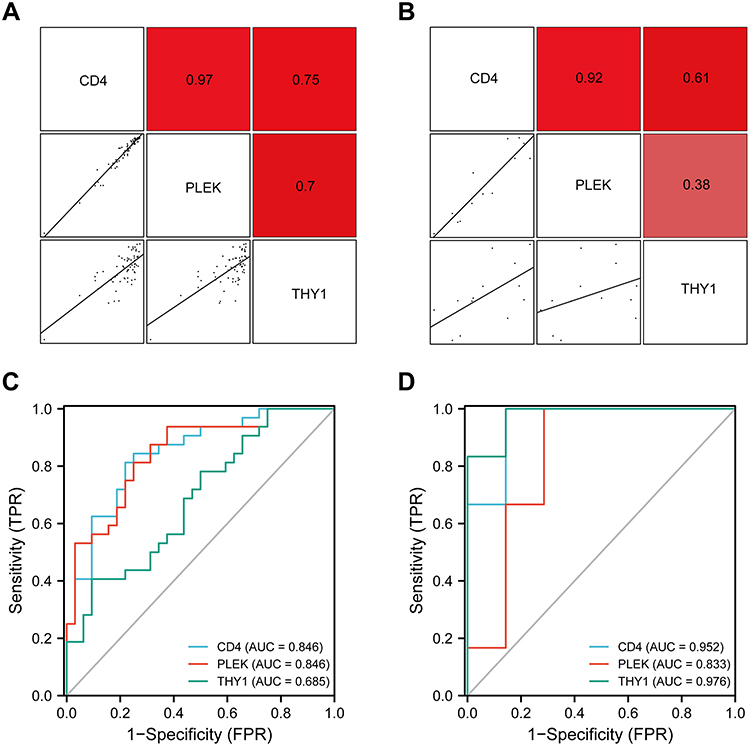 |
Figure 8 Co-expression correlations and ROC analysis of the three hub genes in AS and T2DM diseases. Co-expression correlation analysis of CD4, PLEK, and THY1 in (A) GSE43292 and (B) GSE25724. ROC curves of the three hub genes in (C) GSE43292 and (D) GSE25724. Each biomarker plots one ROC. |
The Correlations Between Critical Genes and Immune Cell Infiltration
Increased evidence has shown that immune cell infiltration and chronic inflammation participated in the development of AS and diabetes,27,28 meanwhile, the functional enrichment analysis shows that inflammatory pathways and immune activation are involved in the development of AS and T2DM. Moreover, CD4, a glycoprotein that was expressed in the surface of several immune cells, was upregulated in the two diseases. Thus, we quantify the immune cell infiltration with CIBERSORT deconvolution algorithm. Specifically, the immune cell types in the AS-related dataset were naive B cells, CD8+ T cells, activated memory CD4+ T cells, regulatory T cells, M0 macrophages, and M1 macrophages (Figure 9A). The immune cell types including regulatory T cells and M1 macrophages were involved in the T2DM-related dataset (Figure 9B). Furthermore, we analyzed the relationship between the immune cells and CD4, PLEK, and THY1. The results indicate that CD4 expression was associated with naive B cells, monocytes, M0 macrophages, and M2 macrophages, and PLEK was related to naive B cells, activated memory CD4+ T-cells, monocytes, M0 macrophages, M2 macrophages, and neutrophils, while THY1 was correlated with M0 macrophages, M2 macrophages, and neutrophils in the AS-related dataset (Figure 9C). In the T2DM-related dataset, PLEK expression was distinctly associated with CD8+ T cells (Figure 9D), consistent with a previous report.29 Angela Vinu´e et al30 reported that both patients with AS and T2DM groups displayed increased macrophages, consistent with our results, suggesting these three genes are involved in macrophage polarization. Researchers have found that THY1, also called CD90, acts as an anchor for monocyte/macrophage adhesion, providing a physical interaction between CD90 cells and monocytes/macrophages in Pancreatic ductal adenocarc inoma (PDAC).31 In conclusion, these results suggestthat CD4, PLEK, and THY1 might contribute to the immune microenvironment of AS and T2DM.
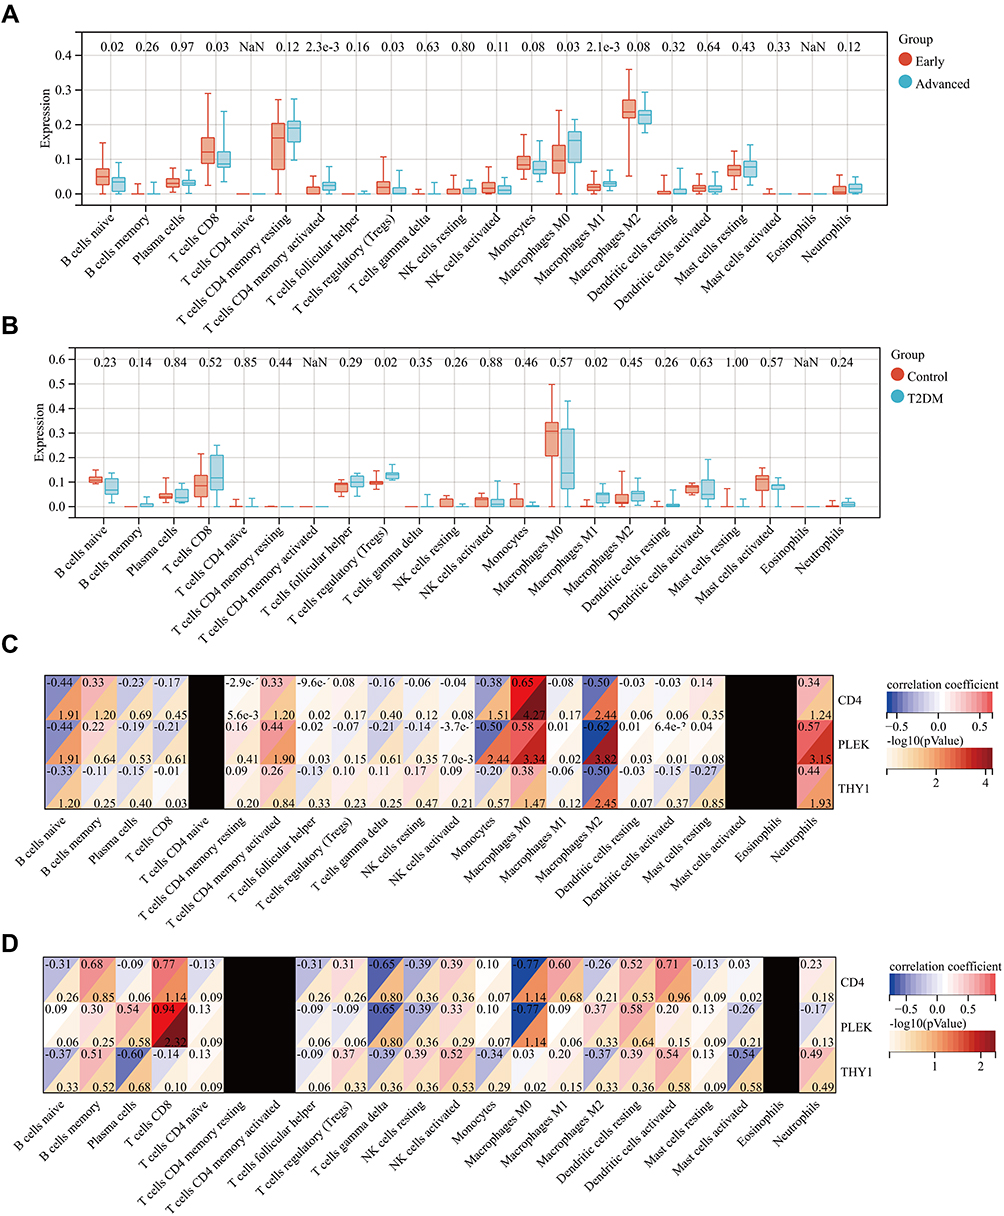 |
Figure 9 Pertinence of the critical genes with immune cells. (A and B) Boxplots of 22 infiltrating immune cells in GSE43292 and GSE25724 datasets. (C and D) Correlations between immune cells and three critical genes including CD4, PLEK, and THY1. In conclusion, these results suggested that CD4, PLEK, and THY1 might contributes to the immune microenvironment of AS and T2DM. |
Expression of CD4, PLEK, and THY1 in AS and T2DM Patients
In this study, we enrolled 31 healthy individuals and 30 AS and T2DM patients to further determine the identified three genes. Among the patients with T2DM and prevalent AS, the levels of total cholesterol (TC) and glucose were increased and the high density lipoprotein cholesterol (HDL-C) was decreased, while there were no significant differences between low density lipoprotein cholesterol (LDL-C) and triglyceride (TG) between the two groups (Figure 10A–E). We detected the expression levels of CD4, PLEK, and THY1 in peripheral blood and the results demonstrated that the expression of CD4 and PLEK was increased in the disease group compared with the healthy individuals, consistent with the bioinformatics analysis (Figure 10F and G), while THY1 was not detected in our collected samples. The correlation analysis also showed that CD4 expression levels were correlated with PLEK (Figure 10H). In addition, CD4 and PLEK performed good discriminatory properties in distinguishing the healthy and the disease group with AUC values of 0.733 and 0.790 (Figure 10I). These results further confirmed the role of CD4 and PLEK in mediating the pathogenic process of AS and T2DM progression and could be the novel therapeutic targets (Figure 11). Moreover, CD4 and PLEK might be potential diagnostic biomarkers in distinguishing the T2DM-associated AS disease.
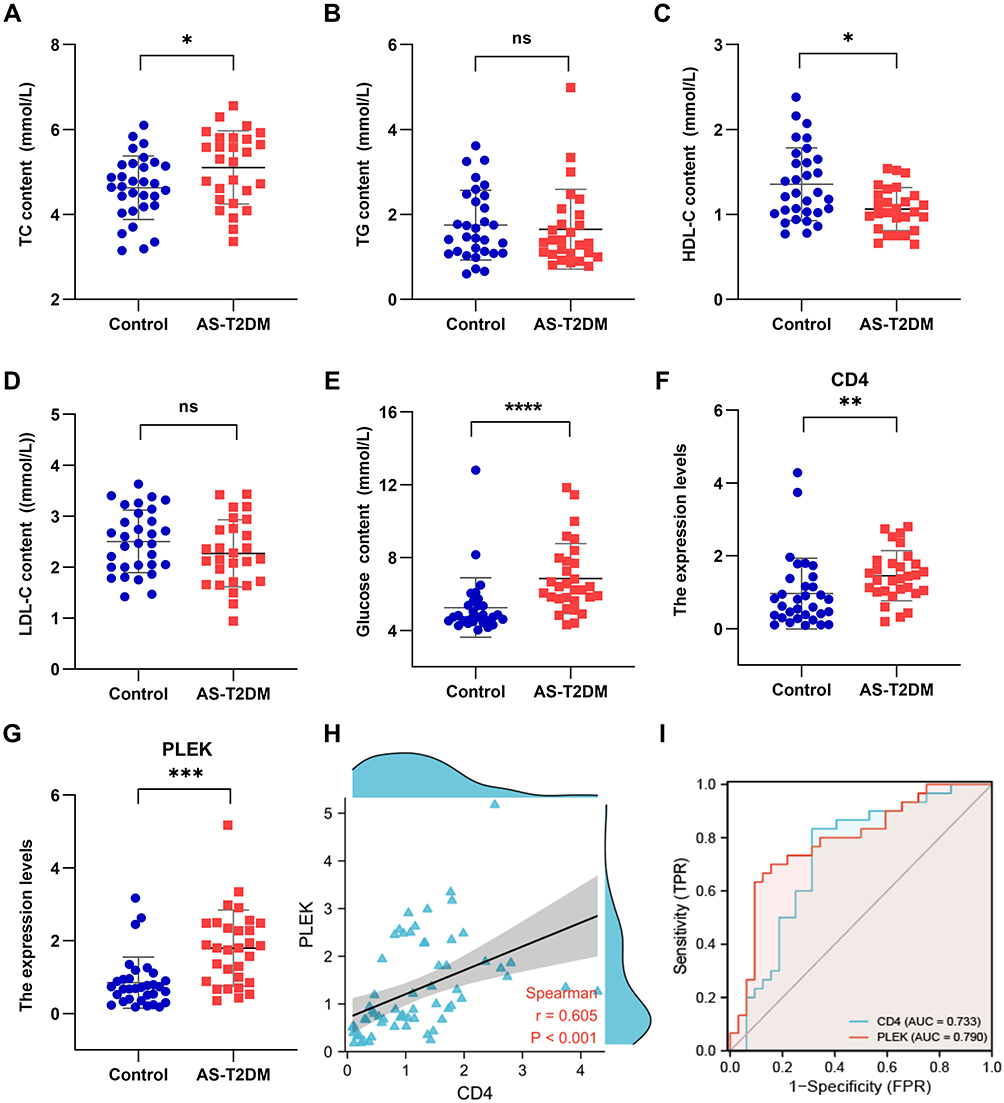 |
Figure 10 Relative expression levels and diagnostic efficacy of the critical genes in peripheral blood. The levels of (A) total cholesterol (TC), (B) triglyceride (TG), (C) high density lipoprotein cholesterol (HDL-C), (D) low density lipoprotein cholesterol (LDL-C), and (E) glucose in healthy groups and patients with AS and T2DM. (F and G) The mRNA expression of CD4 and PLEK were measured by qRT-PCR. (H) The expression correlation of CD4 and PLEK. (I) ROC curves to determine the diagnostic capacity of CD4 and PLEK. * P<0.05, ** P<0.01, *** P<0.001. Abbreviation: ns, no significant difference. |
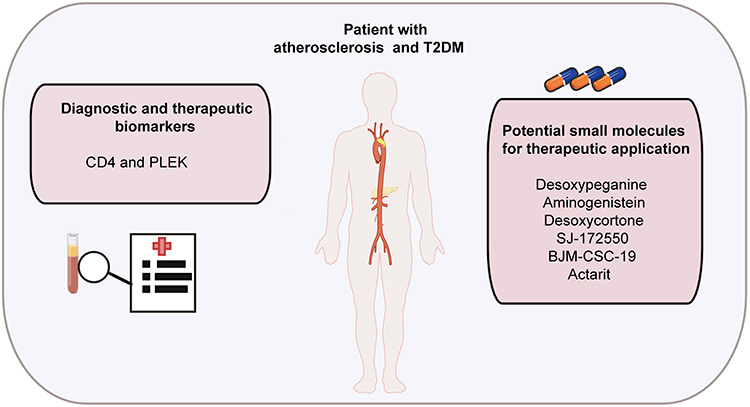 |
Figure 11 Schematic summary for the identified diagnostic and therapeutic targets and potential small molecules for patients with AS and T2DM. |
Discussion
AS is closely related to diabetes, especially with T2DM, which will promote development of atherosclerotic plaques and expand necrotic core of advanced atherosclerotic lesions.7 So far, the relationship between T2DM and AS development is incompletely understood. Recent studies have found that glucose and insulin contribute to the pathogenesis of atherosclerosis, and myeloid-restricted deletion of glucose transporter GLUT1 could decelerate atherosclerosis.32 Whereas, loss of insulin receptors led to a different effect which depends on the cell types.8,9 These data are not sufficient to point out the underlying molecular mechanism for further guiding the diagnosis and therapy of two diseases. Therefore, the development of novel biomarkers and effective therapeutic targets is demanded. The GEO database, an open-access repository, contains an abundant microarray chip and high-throughput microarray.33 Thus, building a molecular mechanism map based on GEO database is useful to comprehensively and multi-dimensionally understand the disease progression.
In the present study, we identified key genes involved in AS and T2DM and conducted a comprehensive analysis to explore the potential pathogenesis of molecular changes between AS and T2DM. In total, 34 common shared DEGs, including 28 upregulated and six downregulated DEGs in GSE28829 and GSE29906 datasets were identified. GO and KEGG enrichment analysis showed that these DEGs participated in inflammatory pathways and immune activation. Evidence has confirmed that inflammation plays a prominent role in AS progressions, and immune cells in lesions can be activated with unremitting inflammatory stimulation or defective inflammation resolution.34,35 T2DM, also referred to as “metaflammation”, is characterized by chronic low-grade inflammation.36 Researchers have reported that inflammation contributes to the beta cell dysfunction,37 and elevated inflammatory factors such as interleukin (IL)-6, IL-8, and chemokine KC were released from islets of T2DM subjects.38 Herein, anti-inflammatory therapy could be considered for management of AS and diabetes. The present study revealing these potential inflammation-related targets have the bright future for treating these complicated diseases.
Based on the construction of PPI network, eight hub genes (CD4, CXCL8, DOCK8, ITGB2, NCF4, PLEK, THY1, and TYROBP) have been harvested with CytoHubba plug-in in Cytoscape. To verify this results, these eight hub genes were validated in another two datasets, GSE43292 and GSE25724, and all of them were differentially expressed in the AS-related dataset GSE43292, while only three genes CD4, PLEK, and THY1 were discrepant in the T2DM-related dataset GSE25724. We further confirmed these three genes expression levels in patients with AS and T2DM. These results indicated that CD4 and PLEK play significant roles in T2DM-associated AS progression.
Subsequently, we conducted an analysis of ROC to evaluate the diagnostic value of the three genes. The results showed that CD4 and PLEK have good diagnostic performance in the validation datasets and clinical data, suggesting that CD4 and PLEK can act as the diagnostic markers in AS and T2DM. CD4 is a glycoprotein that was expressed in the surface of several immune cells such as T helper cells, macrophages, dendritic cells, and monocytes. CD4+ T cells, critical regulators, are commonly existed in atherosclerotic lesions, and genetic or antibody-mediated depletion of CD4+ T cells can prevent development of atherosclerotic lesions.39 Han et al40 reported that CD4 T cells were markedly reduced in diabetic subjects among COVID-19 patients, and insulin resistance in T2DM can be caused by activating CD4 T-cells of bone marrow.41 In addition, frequencies of CD4+ T cells were positively associated with age, BMI, HOMA2 estimate of β-cell function (HOMA2-B), and HOMA2 estimate of insulin resistance (HOMA2-IR).42 Taken together, CD4 T cells are attractive targets for diagnosing and treating AS and T2DM. The pleckstrin protein, encoded by the PLEK gene, is the major protein kinase C (PKC) substrate of platelets and leucocytes.43 Phosphorylation of leckstrin was reported to up-regulate in diabetic mononuclear phagocytes and mediate secretion and activation of proinflammatory cytokines.44 In addition, PLEK was evidenced to be significantly increased in CVD, rheumatoid arthritis (RA) and ulcerative colitis (UC), suggesting its crucial role in chronic inflammatory diseases.45 Besides, we also found that the expression levels of CD4 were strongly positively correlated with PLEK, implying their close relationships. Based on the above results, CD4 and PLEK could be the novel diagnostic and therapeutic targets in AS and T2DM. Additional studies involving animals and cellular levels will be required to confirm the function and mechanism of these two genes.
Conclusion
In this study, we have established the co-expression network between AS lesions progressions and T2DM, and identified CD4 and PLEK as key genes in the two diseases, which may contribute to the development of diagnosis and therapeutic strategies of T2DM-associated AS progression.
Data Sharing Statement
The public datasets analyzed in this study can be found in the online GEO database and the accession numbers are listed in the article.
Author Contributions
All authors made a significant contribution to the work reported, whether that is in the conception, study design, execution, acquisition of data, analysis and interpretation, or in all these areas; took part in drafting, revising or critically reviewing the article; gave final approval of the version to be published; have agreed on the journal to which the article has been submitted; and agree to be accountable for all aspects of the work.
Funding
This work was supported by the grants from the National Natural Science Foundation of China (U21A20343, 81870225, 82270492), the Natural Science Foundation of Ningxia (2022AAC03191), the Scientific research project of Ningxia Medical University (XT2021002, XZ2020006).
Disclosure
The authors declare that the research was conducted in the absence of any commercial or financial relationships that could be construed as a potential conflict of interest.
References
1. Song P, Fang Z, Wang H, et al. Global and regional prevalence, burden, and risk factors for carotid atherosclerosis: a systematic review, meta-analysis, and modelling study. Lancet Glob Health. 2020;8:e721–e729. doi:10.1016/S2214-109X(20)30117-0
2. Zhang S, Liu Y, Cao Y, et al. Targeting the microenvironment of vulnerable atherosclerotic plaques: an emerging diagnosis and therapy strategy for atherosclerosis. Adv Mater. 2022;34:e2110660. doi:10.1002/adma.202110660
3. Kovanen PT. Mast cells as potential accelerators of human atherosclerosis-from early to late lesions. Int J Mol Sci. 2019;20:4479. doi:10.3390/ijms20184479
4. Tomaniak M, Katagiri Y, Modolo R, et al. Vulnerable plaques and patients: state-of-The-art. Eur Heart J. 2020;41:2997–3004. doi:10.1093/eurheartj/ehaa227
5. Ferket BS, Hunink MGM, Masharani U, et al. Lifetime cardiovascular disease risk by coronary artery calcium score in individuals with and without diabetes: an analysis from the multi-ethnic study of atherosclerosis. Diabetes Care. 2022;45:975–982. doi:10.2337/dc21-1607
6. Yahagi K, Kolodgie FD, Lutter C, et al. Pathology of human coronary and carotid artery atherosclerosis and vascular calcification in diabetes mellitus. Arterioscler Thromb Vasc Biol. 2017;37:191–204. doi:10.1161/ATVBAHA.116.306256
7. Eckel RH, Bornfeldt KE, Goldberg IJ. Cardiovascular disease in diabetes, beyond glucose. Cell Metab. 2021;33:1519–1545. doi:10.1016/j.cmet.2021.07.001
8. Li Q, Fu J, Xia Y, et al. Homozygous receptors for insulin and not IGF-1 accelerate intimal hyperplasia in insulin resistance and diabetes. Nat Commun. 2019;10:4427. doi:10.1038/s41467-019-12368-2
9. Rask-Madsen C, Li Q, Freund B, et al. Loss of insulin signaling in vascular endothelial cells accelerates atherosclerosis in apolipoprotein E null mice. Cell Metab. 2010;11:379–389. doi:10.1016/j.cmet.2010.03.013
10. Mendiola AS, Ryu JK, Bardehle S, et al. Transcriptional profiling and therapeutic targeting of oxidative stress in neuroinflammation. Nat Immunol. 2020;21:513–524. doi:10.1038/s41590-020-0654-0
11. Chen P, Chen Y, Wu W, Chen L, Yang X, Zhang S. Identification and validation of four hub genes involved in the plaque deterioration of atherosclerosis. Aging. 2019;11:6469–6489. doi:10.18632/aging.102200
12. Zhong M, Wu Y, Ou W, Huang L, Yang L. Identification of key genes involved in type 2 diabetic islet dysfunction: a bioinformatics study. Biosci Rep. 2019;39. doi:10.1042/BSR20182172
13. Ding L, Fan L, Xu X, Fu J, Xue Y. Identification of core genes and pathways in type 2 diabetes mellitus by bioinformatics analysis. Mol Med Rep. 2019;20:2597–2608. doi:10.3892/mmr.2019.10522
14. Jiao M, Li J, Zhang Q, et al. Identification of four potential biomarkers associated with coronary artery disease in non-diabetic patients by gene co-expression network analysis. Front Genet. 2020;11:542. doi:10.3389/fgene.2020.00542
15. Irizarry RA, Hobbs B, Collin F, et al. Exploration, normalization, and summaries of high density oligonucleotide array probe level data. Biostatistics. 2003;4:249–264. doi:10.1093/biostatistics/4.2.249
16. Reimers M, Carey VJ. Bioconductor: an open source framework for bioinformatics and computational biology. Methods Enzymol. 2006;411:119–134.
17. Vella D, Marini S, Vitali F, Di Silvestre D, Mauri G, Bellazzi R. MTGO: PPI network analysis via topological and functional module identification. Sci Rep. 2018;8:5499. doi:10.1038/s41598-018-23672-0
18. Szklarczyk D, Franceschini A, Wyder S, et al. STRING v10: protein-protein interaction networks, integrated over the tree of life. Nucleic Acids Res. 2015;43:D447–52. doi:10.1093/nar/gku1003
19. Li L, Lei Q, Zhang S, Kong L, Qin B. Screening and identification of key biomarkers in hepatocellular carcinoma: evidence from bioinformatic analysis. Oncol Rep. 2017;38:2607–2618. doi:10.3892/or.2017.5946
20. Chin CH, Chen SH, Wu HH, Ho CW, Ko MT, Lin CY. CytoHubba: identifying hub objects and sub-networks from complex interactome. BMC Syst Biol. 2014;8:S11. doi:10.1186/1752-0509-8-S4-S11
21. Subramanian A, Narayan R, Corsello SM, et al. A next generation connectivity map: L1000 platform and the first 1,000,000 profiles. Cell. 2017;171:1437–1452 e17. doi:10.1016/j.cell.2017.10.049
22. Newman AM, Liu CL, Green MR, et al. Robust enumeration of cell subsets from tissue expression profiles. Nat Methods. 2015;12:453–457. doi:10.1038/nmeth.3337
23. Cannon CP, Pratley R, Dagogo-Jack S, et al.; V.C. Investigators. Cardiovascular outcomes with ertugliflozin in type 2 diabetes. N Engl J Med. 2020;383:1425–1435. doi:10.1056/NEJMoa2004967
24. Nissen SE, Nicholls SJ, Wolski K, et al.; P. Investigators. Comparison of pioglitazone vs glimepiride on progression of coronary atherosclerosis in patients with type 2 diabetes: the PERISCOPE randomized controlled trial. JAMA. 2008;299:1561–1573. doi:10.1001/jama.299.13.1561
25. Ogasawara D, Shite J, Shinke T, et al. Pioglitazone reduces the necrotic-core component in coronary plaque in association with enhanced plasma adiponectin in patients with type 2 diabetes mellitus. Circ J. 2009;73:343–351. doi:10.1253/circj.CJ-08-0699
26. Vaccaro O, Masulli M, Nicolucci A, et al. Thiazolidinediones or sulfonylureas cardiovascular accidents intervention trial study, and S. Italian diabetes, effects on the incidence of cardiovascular events of the addition of pioglitazone versus sulfonylureas in patients with type 2 diabetes inadequately controlled with metformin (TOSCA.IT): a randomised, multicentre trial. Lancet Diabetes Endocrinol. 2017;5:887–897. doi:10.1016/S2213-8587(17)30317-0
27. Cochain C, Zernecke A. Protective and pathogenic roles of CD8(+) T cells in atherosclerosis. Basic Res Cardiol. 2016;111:71. doi:10.1007/s00395-016-0589-7
28. Shin JJ, Lee EK, Park TJ, Kim W. Damage-associated molecular patterns and their pathological relevance in diabetes mellitus. Ageing Res Rev. 2015;24:66–76.
29. Reddy SS, Agarwal H, Jaiswal A, Jagavelu K, Dikshit M, Barthwal MK. Macrophage p47(phox) regulates pressure overload-induced left ventricular remodeling by modulating IL-4/STAT6/PPARgamma signaling. Free Radic Biol Med. 2021;168:168–179.
30. Vinu EA, MartInez-Hervas S, Herrero-Cervera A, et al. Changes in CDKN2A/2B expression associate with T-cell phenotype modulation in atherosclerosis and type 2 diabetes mellitus. Transl Res. 2019;203:31–48.
31. Shi J, Lu P, Shen W, et al. CD90 highly expressed population harbors a stemness signature and creates an immunosuppressive niche in pancreatic cancer. Cancer Lett. 2019;453:158–169.
32. Flynn MC, Kraakman MJ, Tikellis C, et al. Transient intermittent hyperglycemia accelerates atherosclerosis by promoting myelopoiesis. Circ Res. 2020;127:877–892.
33. Barrett T, Wilhite SE, Ledoux P, et al. NCBI GEO: archive for functional genomics data sets--update. Nucleic Acids Res. 2013;41:D991–5.
34. Engelen SE, Robinson AJB, Zurke YX, Monaco C. Therapeutic strategies targeting inflammation and immunity in atherosclerosis: how to proceed? Nat Rev Cardiol. 2022;2022:1.
35. Tabas I. Macrophage death and defective inflammation resolution in atherosclerosis. Nat Rev Immunol. 2010;10:36–46.
36. Prattichizzo F, De Nigris V, Spiga R, et al. Inflammageing and metaflammation: the yin and yang of type 2 diabetes. Ageing Res Rev. 2018;41:1–17.
37. Ying W, Fu W, Lee YS, Olefsky JM. The role of macrophages in obesity-associated islet inflammation and beta-cell abnormalities. Nat Rev Endocrinol. 2020;16:81–90.
38. Ehses JA, Perren A, Eppler E, et al. Increased number of islet-associated macrophages in type 2 diabetes. Diabetes. 2007;56:2356–2370.
39. Saigusa R, Winkels H, Ley K. T cell subsets and functions in atherosclerosis. Nat Rev Cardiol. 2020;17:387–401.
40. Han M, Ma K, Wang X, et al. Immunological characteristics in type 2 diabetes mellitus among COVID-19 patients. Front Endocrinol. 2021;12:596518.
41. Cifuentes-Mendiola SE, Solis-Suarez DL, Martinez-Davalos A, Godinez-Victoria M, Garcia-Hernandez AL. CD4(+) T-cell activation of bone marrow causes bone fragility and insulin resistance in type 2 diabetes. Bone. 2022;155:116292.
42. Ratter-Rieck JM, Maalmi H, Trenkamp S, et al.; German Diabetes Study, and G.D.S. Group. Leukocyte counts and T-cell frequencies differ between novel subgroups of diabetes and are associated with metabolic parameters and biomarkers of inflammation. Diabetes. 2021;70:2652–2662.
43. Gailani D, Fisher TC, Mills DC, Macfarlane DE. P47 phosphoprotein of blood platelets (pleckstrin) is a major target for phorbol ester-induced protein phosphorylation in intact platelets, granulocytes, lymphocytes, monocytes and cultured leukaemic cells: absence of P47 in non-haematopoietic cells. Br J Haematol. 1990;74:192–202.
44. Ding Y, Kantarci A, Badwey JA, Hasturk H, Malabanan A, Van Dyke TE. Phosphorylation of pleckstrin increases proinflammatory cytokine secretion by mononuclear phagocytes in diabetes mellitus. J Immunol. 2007;179:647–654.
45. Lundmark A, Davanian H, Bage T, et al. Transcriptome analysis reveals mucin 4 to be highly associated with periodontitis and identifies pleckstrin as a link to systemic diseases. Sci Rep. 2015;5:18475.
 © 2023 The Author(s). This work is published and licensed by Dove Medical Press Limited. The
full terms of this license are available at https://www.dovepress.com/terms
and incorporate the Creative Commons Attribution
- Non Commercial (unported, 3.0) License.
By accessing the work you hereby accept the Terms. Non-commercial uses of the work are permitted
without any further permission from Dove Medical Press Limited, provided the work is properly
attributed. For permission for commercial use of this work, please see paragraphs 4.2 and 5 of our Terms.
© 2023 The Author(s). This work is published and licensed by Dove Medical Press Limited. The
full terms of this license are available at https://www.dovepress.com/terms
and incorporate the Creative Commons Attribution
- Non Commercial (unported, 3.0) License.
By accessing the work you hereby accept the Terms. Non-commercial uses of the work are permitted
without any further permission from Dove Medical Press Limited, provided the work is properly
attributed. For permission for commercial use of this work, please see paragraphs 4.2 and 5 of our Terms.
Recommended articles
Decreased Serum Osteocalcin is an Independent Risk Factor for Metabolic Dysfunction-Associated Fatty Liver Disease in Type 2 Diabetes
Wang YJ, Jin CH, Ke JF, Wang JW, Ma YL, Lu JX, Li MF, Li LX
Diabetes, Metabolic Syndrome and Obesity 2022, 15:3717-3728
Published Date: 29 November 2022
Study on Relationship Between Carotid Intima-Media Thickness and Inflammatory Factors in Obstructive Sleep Apnea
Ji P, Kou Q, Zhang J
Nature and Science of Sleep 2022, 14:2179-2187
Published Date: 14 December 2022
Insights into the Role of Inflammation in the Management of Atherosclerosis
Rocha VZ, Rached FH, Miname MH
Journal of Inflammation Research 2023, 16:2223-2239
Published Date: 24 May 2023
Research Progress and Molecular Mechanisms of Endothelial Cells Inflammation in Vascular-Related Diseases
Xue J, Zhang Z, Sun Y, Jin D, Guo L, Li X, Zhao D, Feng X, Qi W, Zhu H
Journal of Inflammation Research 2023, 16:3593-3617
Published Date: 23 August 2023
The Mechanism of Pyroptosis and Its Application Prospect in Diabetic Wound Healing
Al Mamun A, Shao C, Geng P, Wang S, Xiao J
Journal of Inflammation Research 2024, 17:1481-1501
Published Date: 6 March 2024