Back to Journals » International Journal of General Medicine » Volume 19
Development and Validation of an Interpretable Machine Learning Model Based on Peripheral Blood Biomarkers for Esophageal Cancer Risk Prediction
Authors Wang Q, Shen L, Qiu W, Shi Q, Zhang Y, Shen K, Zhang J, Qiu H
Received 17 April 2026
Accepted for publication 20 June 2026
Published 26 June 2026 Volume 2026:19 617852
DOI https://doi.org/10.2147/IJGM.S617852
Checked for plagiarism Yes
Review by Single anonymous peer review
Peer reviewer comments 3
Editor who approved publication: Dr Ching-Hsien Chen
Qingkai Wang,1 Liran Shen,1 Weibing Qiu,2 Qianjin Shi,2 Yunbiao Zhang,1 Kang Shen,2 Jiaqi Zhang,1 Hao Qiu2
1Department of Medical Laboratory Centre, Shanxian Central Hospital, Heze, 274330, People’s Republic of China; 2Department of Radiation Oncology, Siyang Hospital, Suqian, 223700, People’s Republic of China
Correspondence: Hao Qiu, Department of Radiation Oncology, Siyang Hospital, Siyang, 223700, People’s Republic of China, Email [email protected]
Background: Noninvasive, low-cost prescreening tools are needed to improve risk stratification for esophageal cancer (EC) before endoscopic confirmation. We developed and validated explainable machine-learning (ML) models using routine peripheral blood biomarkers.
Methods: This dual-center retrospective case–control study enrolled 454 participants (198 EC cases, 256 non-EC controls) from two hospitals between March 2021 and June 2025. Data were randomly split 7:3 into training (n=319) and validation (n=135) sets. LASSO regression selected nine features (SIRI, MLR, AST, ADA, CREA, UA, K, PT, and TT). Seven algorithms—logistic regression, decision tree, random forest (RF), XGBoost, LightGBM, support vector machine, and artificial neural network—were trained with 10-fold cross-validation and grid-search hyperparameter tuning. Performance was assessed by discrimination, calibration, clinical utility, and confusion matrices, with Shapley additive explanations (SHAP) for interpretation.
Results: Baseline demographics and comorbidities were comparable between groups. In the validation set, RF performed best (AUC=0.973; accuracy=0.926; sensitivity=0.881; specificity=0.961; F1-score=0.912), achieved the lowest Brier score (0.059), and showed favorable net benefit. SHAP analysis identified creatinine and SIRI as the most influential features, where lower creatinine and higher SIRI increased predicted EC risk.
Conclusion: This explainable RF model showed excellent discrimination and good calibration. As a retrospective case–control study using healthy controls, it is intended as a prescreening tool to guide endoscopic referral rather than a diagnostic test, and requires prospective external validation before clinical use.
Keywords: esophageal cancer, machine learning, risk prediction, routine laboratory biomarkers, systemic inflammation, SHAP
Introduction
Esophageal cancer is a common malignancy of the digestive tract characterized by an insidious onset, rapid progression, and poor prognosis.1 Early-stage disease often lacks specific symptoms or presents only with mild dysphagia, which can be overlooked or mistaken for benign upper gastrointestinal conditions. Established risk factors for esophageal cancer—including tobacco smoking, heavy alcohol consumption, dietary factors, Barrett’s esophagus, and a family history of the disease—are well recognized, yet they capture only part of an individual’s risk and are not always documented in routine practice; readily measured laboratory biomarkers may therefore complement traditional risk assessment. Consequently, many patients are diagnosed at an advanced stage, when therapeutic options are limited, and survival outcomes are modest.2,3 Early identification and risk stratification of high-risk populations, thereby enabling earlier diagnostic evaluation, are therefore critical strategies for reducing disease burden and optimizing clinical management. Prior research indicates that identifying high-risk individuals before symptom onset or while tumors are still treatable can facilitate appropriate surveillance and intervention, potentially alleviating the concentrated resource consumption driven by a reactive care model.4–6
Currently, endoscopy with pathological biopsy remains the diagnostic and staging standard for esophageal cancer, providing irreplaceable value through direct visualization, targeted sampling, and histological confirmation.7,8 For population screening or large-scale risk assessment, however, endoscopy is an invasive procedure constrained by cost, resource allocation, primary care accessibility, patient adherence, and regional disparities in capacity. Frequent and sustained coverage of broad populations is therefore difficult to achieve. Some truly high-risk individuals may thus miss opportunities for early detection due to limited access, while overuse in low-risk groups can impose unnecessary medical burdens. Developing non-invasive tools for prescreening and stratification before the standard diagnostic pathway, therefore, holds clear clinical value, allowing for a more rational selection of individuals who warrant endoscopic evaluation.
Peripheral blood–based laboratory indices are promising sources of information for population-level risk assessment due to their ease of collection, low cost, and high reproducibility.9,10 Routine blood counts, biochemical parameters, and coagulation measures are widely available in clinical practice with established quality control, and they can reflect systemic changes in inflammation, nutritional status, and coagulation function. Evidence suggests these biological processes are associated with tumor initiation and progression.11–13 Compared to single tumor markers, a comprehensive evaluation using multidimensional routine laboratory data may better capture risk profiles given tumor heterogeneity. Furthermore, these indices can be readily integrated into health checkups or primary care screening workflows, offering a practical approach to the dynamic monitoring of high-risk individuals.14,15 However, as comorbidities and lifestyle factors influence these parameters, extracting a signal relevant to esophageal cancer risk from such a complex background requires robust modeling frameworks and strong validation.
Machine learning has gained increasing attention in medical risk prediction and clinical decision-support research in recent years. A key advantage of this approach is its capacity to integrate multi-source, high-dimensional variables and capture potential nonlinear relationships and interactions among predictors, thereby providing methodological support for building risk assessment tools that reflect real-world clinical complexity.16,17 Different algorithms vary in their representation of feature space and their bias–variance trade-offs; comparing and validating multiple algorithms can help identify the most suitable modeling strategy for a given data structure and clinical task.18 Several models have been proposed for esophageal cancer risk assessment, including questionnaire- or score-based tools for opportunistic screening populations15 and autoantibody- or biomarker-panel approaches analyzed with machine learning.19 Blood-based machine-learning models have likewise shown promise for prescreening other gastrointestinal cancers, such as colorectal cancer, using routine complete blood counts and clinical data.20,21 However, few studies have combined routine, low-cost peripheral blood inflammatory, biochemical, and coagulation indices with explainable machine learning specifically for esophageal cancer risk. Because opaque “black-box” models hinder clinical trust and adoption, model interpretability is increasingly regarded as essential for clinical decision support; explainable techniques such as Shapley additive explanations (SHAP) allow the contribution and direction of each predictor to be examined, improving transparency and clinical plausibility.16 The present study addresses this gap by developing and validating an interpretable, blood-based model for esophageal cancer risk.
Based on these considerations, this study used retrospective case–control data from Siyang Hospital and Shanxian Central Hospital to develop and validate machine-learning models for predicting esophageal cancer risk. Using pre-treatment peripheral blood laboratory parameters and basic clinical information, we constructed and evaluated multiple algorithms to support risk assessment and early identification, thereby providing decision support for subsequent diagnostic evaluations such as endoscopy. In particular, because the required laboratory parameters are routinely collected during health checkups and primary-care visits, such a model could be embedded into existing screening or referral pathways—especially in resource-limited settings—to help prioritize higher-risk individuals for endoscopic evaluation while reducing unnecessary procedures in lower-risk groups.
Methods
Data Selection and Preprocessing
This retrospective case–control study utilized data from the clinical and laboratory information systems of Siyang Hospital and Shanxian Central Hospital between March 2021 and June 2025. Participants were patients with a first diagnosis of esophageal cancer who had undergone peripheral blood sampling and routine laboratory testing before any anti-tumor treatment, alongside individuals receiving health examinations at the same institutions during the same period. The case group consisted of patients with pathologically confirmed esophageal cancer, including both squamous cell carcinoma and adenocarcinoma. The control group comprised contemporaneous health examination attendees who completed routine clinical data collection and laboratory testing as part of standard checkup procedures, ensuring consistency between cases and controls in the clinical setting and testing platform.
Baseline information encompassed demographic and clinical characteristics (sex, age, drinking status, body mass index [BMI, kg/m2], hypertension, and diabetes), composite inflammation-related indices (systemic immune-inflammation index [SII], neutrophil-to-lymphocyte ratio [NLR], systemic inflammation response index [SIRI], platelet-to-lymphocyte ratio [PLR], monocyte-to-lymphocyte ratio [MLR], neutrophil-to-albumin ratio [NAR], C-reactive protein-to-lymphocyte ratio [CLR], inflammatory burden index [IBI], and aggregate index of systemic inflammation [AISI]), biochemical parameters (aspartate aminotransferase [AST, U/L], alkaline phosphatase [ALP, U/L], gamma-glutamyl transferase [GGT, U/L], globulin [GLB, g/L], prealbumin [PA, mg/L], adenosine deaminase [ADA, U/L], urea [UREA, mmol/L], creatinine [CREA, μmol/L], uric acid [UA, μmol/L], potassium [K, mmol/L], sodium [Na, mmol/L], and chloride [Cl, mmol/L]), and coagulation function parameters (prothrombin time [PT, s], activated partial thromboplastin time [APTT, s], fibrinogen [Fbg, g/L], and thrombin time [TT, s]).
Inclusion and Exclusion Criteria
Inclusion criteria comprised: (1) a confirmed diagnosis of primary esophageal cancer via endoscopy and histopathology; (2) a first-onset diagnosis with complete medical records accessible in the hospital information system; (3) control subjects confirmed through comprehensive health examinations to have no apparent organ dysfunction or history of malignancy; (4) availability of complete clinical documentation for all participants; and (5) no missing data for key laboratory indicators.
Exclusion criteria were: (1) acute or chronic active infectious diseases, such as pneumonia, tuberculosis, or urinary tract infection; (2) hematologic disorders affecting blood cell counts, including leukemia, aplastic anemia, or primary thrombocytopenia; (3) a history of autoimmune or connective tissue diseases, such as rheumatoid arthritis, systemic lupus erythematosus, or Sjögren’s syndrome; (4) a prior or concurrent diagnosis of malignancy or other active tumors; and (5) any condition likely to substantially alter peripheral blood, biochemical, or coagulation parameters, including acute infection, active severe inflammation, confirmed immune system diseases, long-term immunosuppression, or severe hepatic or renal failure.
Variable Selection and Model Development
The entire cohort was initially divided into a training set (n=319) and a testing set (n=135) using simple random sampling at a 7:3 ratio. Within the training set, least absolute shrinkage and selection operator (LASSO) regression was applied to select features and eliminate redundant variables, yielding a candidate subset for modeling. Seven machine learning models were constructed using these features: Logistic Regression (LR), Decision Tree (DT), Random Forest (RF), Extreme Gradient Boosting (XGBoost), Light Gradient Boosting Machine (LightGBM), Support Vector Machine (SVM), and an Artificial Neural Network (ANN). To ensure accuracy and robustness, model training employed 10-fold cross-validation on the training set. A grid search was conducted concurrently to tune each algorithm’s hyperparameters and identify optimal configurations. The independent testing set was finally used to evaluate the generalization performance of the optimized models. The hyperparameter search grids and the final selected configuration for each algorithm are provided in Supplementary Table S1. Full details of the analysis pipeline—including the random train–test split (seed 123), the 10-fold grid search used for hyperparameter tuning, and the fixed 0.50 classification threshold—are provided in the Supplementary Methods.
Model Evaluation
Model performance was evaluated on the validation set using the area under the receiver operating characteristic curve (AUC), accuracy, precision, sensitivity, specificity, F1 score, Cohen’s kappa, positive predictive value (PPV), and negative predictive value (NPV). Classification results were visualized with confusion matrices. Calibration curves assessed the agreement between predicted probabilities and observed event rates. Decision curve analysis (DCA) compared the net benefit across a range of threshold probabilities to provide an overall assessment of clinical utility.
Model Interpretation
Shapley Additive Explanations (SHAP) were used to interpret the best-performing prediction model, quantifying each feature’s contribution and directionality toward the final classification. Features were ranked by their SHAP values, with higher values indicating greater influence on the model’s predictions. SHAP dependence plots were also generated to illustrate the relationships between individual features and the model output.
Statistical Analysis
All statistical analyses were performed using SPSS version 27.0, and a two-sided P value <0.05 was considered statistically significant. Continuous variables with a normal distribution were presented as mean ± standard deviation and compared between groups using the independent-samples t-test. Non-normally distributed continuous variables are reported as median (interquartile range) and were compared using the Wilcoxon rank-sum test. Categorical variables are summarized as counts (percentages) and were compared using the chi-square test or Fisher’s exact test, as appropriate. Statistical analyses were conducted in R version 4.2.2 (R Foundation for Statistical Computing). SHAP analyses were performed in Python version 3.10.4 (Python Software Foundation) using the “shapviz” package.
Results
Patient Characteristics
The study included 454 participants (243 men and 211 women) with a mean age of 56 years, stratified by esophageal cancer status into non-EC (n=256) and EC (n=198) groups. As presented in Table 1, the EC group exhibited significantly higher SIRI levels than the non-EC group [2.44 (1.48, 3.77) vs. 1.64 (1.13, 2.33), P<0.001] but significantly lower MLR levels [0.34 (0.20, 0.60) vs. 0.44 (0.34, 0.62), P<0.001]. ADA and UA levels were also significantly elevated in the EC group, whereas creatinine (CREA) levels were significantly reduced (all P<0.001). No statistically significant differences were found between the groups in baseline characteristics, including sex, age, BMI, hypertension, diabetes, or drinking status (all P > 0.05). Among the 198 EC cases, the TNM stage distribution was 23.7% stage I, 22.7% stage II, 38.4% stage III, and 15.2% stage IV (Supplementary Table S2), so that early-stage (I–II) and advanced-stage (III–IV) disease were both well represented.
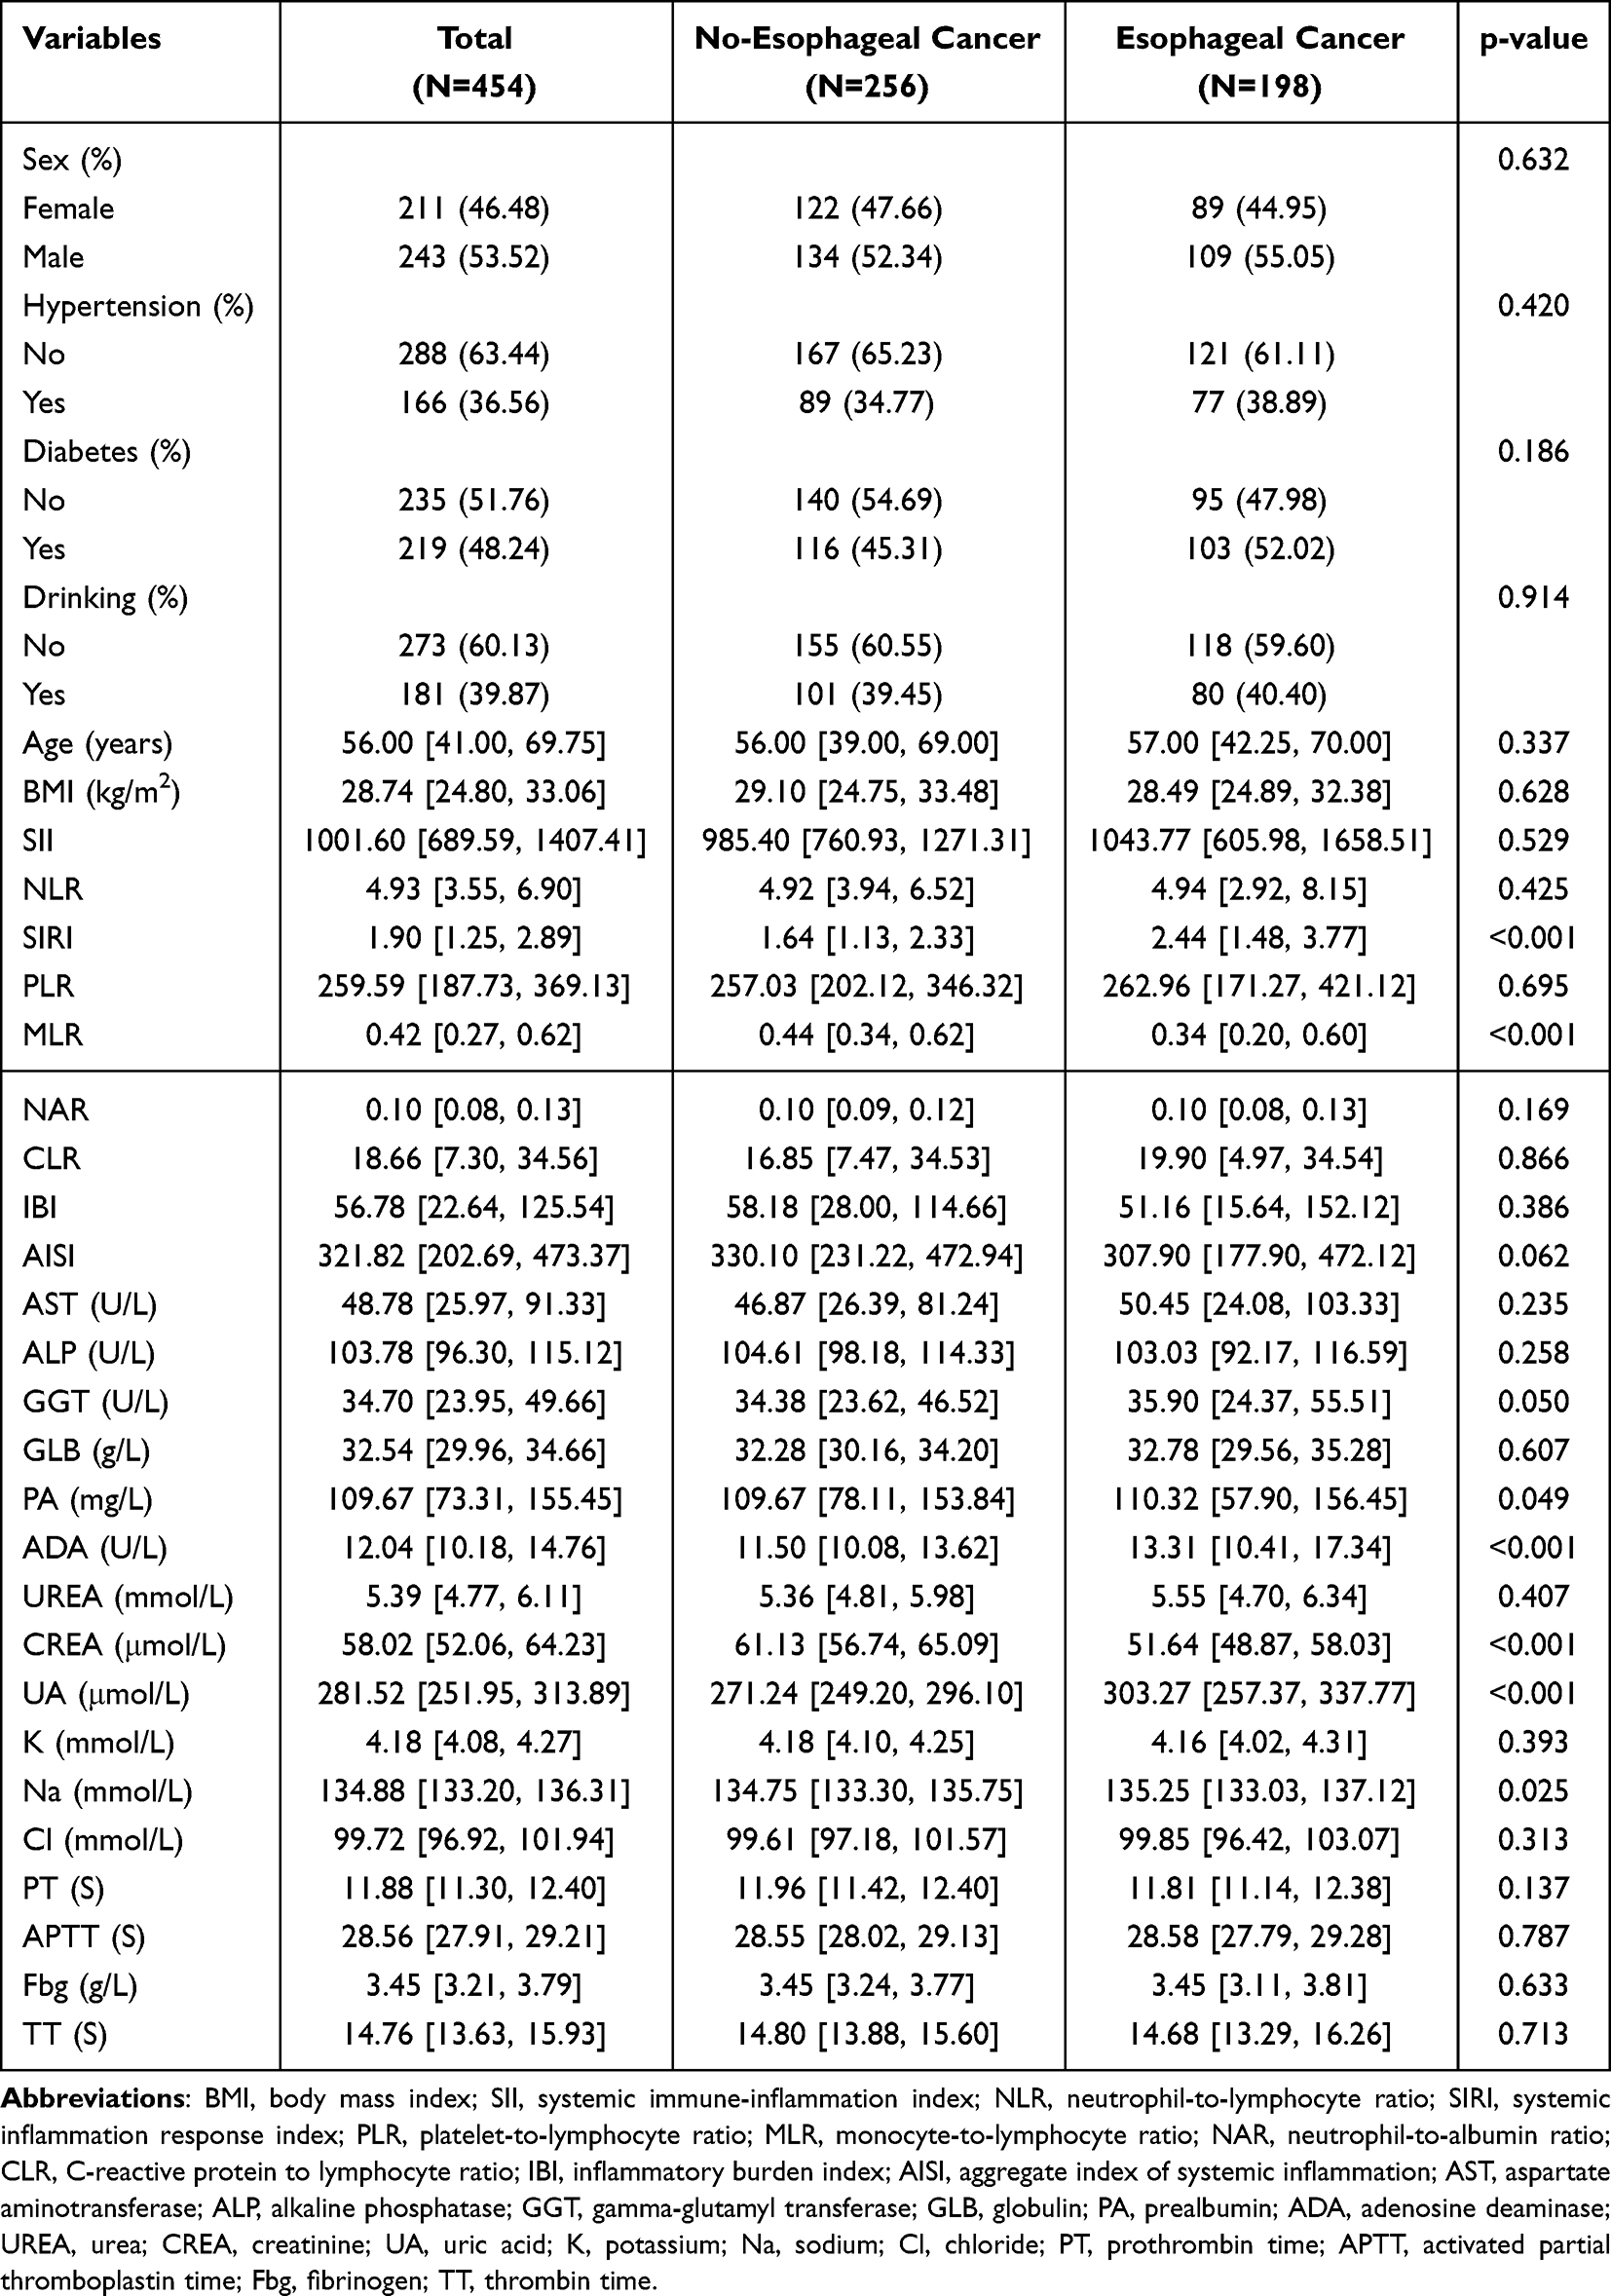 |
Table 1 Baseline Characteristics |
LASSO Regression for Prediction Factors
LASSO regression selected features, with the optimal penalization parameter (λ) determined through 10-fold cross-validation. The left vertical dashed line indicates the binomial deviance ± standard error (SE), while the right vertical dashed line corresponds to the 1-SE criterion relative to the minimum deviance. Applying the 1-SE criterion, nine variables with non-zero coefficients were selected for further analysis: SIRI, MLR, AST, ADA, CREA, UA, K, PT, and TT (Figure 1A). The coefficient path plot demonstrates that as log(λ) increases, the regression coefficients for all variables progressively shrink toward zero. At the optimal λ, only a subset of predictors retained non-zero coefficients, indicating their strong association with esophageal cancer occurrence (Figure 1B).
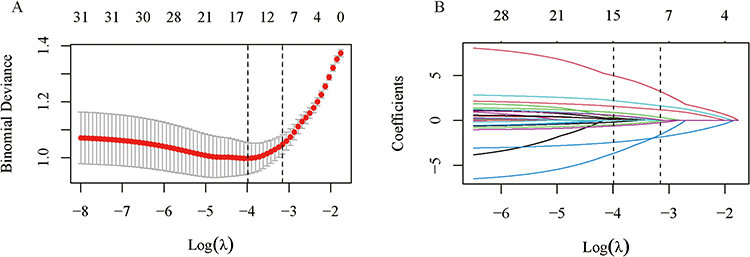 |
Figure 1 Feature selection by LASSO regression. (A) Ten-fold cross-validation for selecting the optimal penalty parameter (λ). (B) Coefficient paths versus log(λ); coefficients shrink toward zero with increasing penalty, and non-zero coefficients at the selected λ are retained. |
Model Development and Performance Assessment
Seven machine learning models were trained, and their performance was evaluated on an independent test set. The LR, DT, RF, XGBoost, LightGBM, SVM, and ANN models achieved AUC values of 0.808, 0.913, 0.973, 0.960, 0.955, 0.811, and 0.854, respectively (Figure 2A–G). Among these, the RF model demonstrated the highest discriminative ability, with an AUC of 0.973 (95% CI: 0.942–0.995) (Figure 2H). A comprehensive assessment of all seven models confirmed that the RF model performed best, attaining an accuracy of 0.926, a precision of 0.945, a sensitivity of 0.881, a specificity of 0.961, an F1 score of 0.912, a Kappa coefficient of 0.848, a PPV of 0.945, and an NPV of 0.913. The RF, XGBoost, and LightGBM models all showed strong performance, with high AUC and F1 scores (Table 2). Calibration analysis indicated that the RF model had the lowest Brier score (0.059; 95% CI: 0.037–0.085), and its calibration curve closely followed the ideal line, reflecting excellent reliability (Figure 3A). Decision curve analysis revealed that, across a wide range of threshold probabilities, the RF and XGBoost models provided the greatest clinical net benefit (Figure 3B). In addition, confusion matrices for all models were presented (Figure 4).The confusion matrix for the RF model on the test set showed false-positive and false-negative rates of 3.95% and 11.86%, respectively, underscoring its robust specificity and sensitivity (Figure 4C).
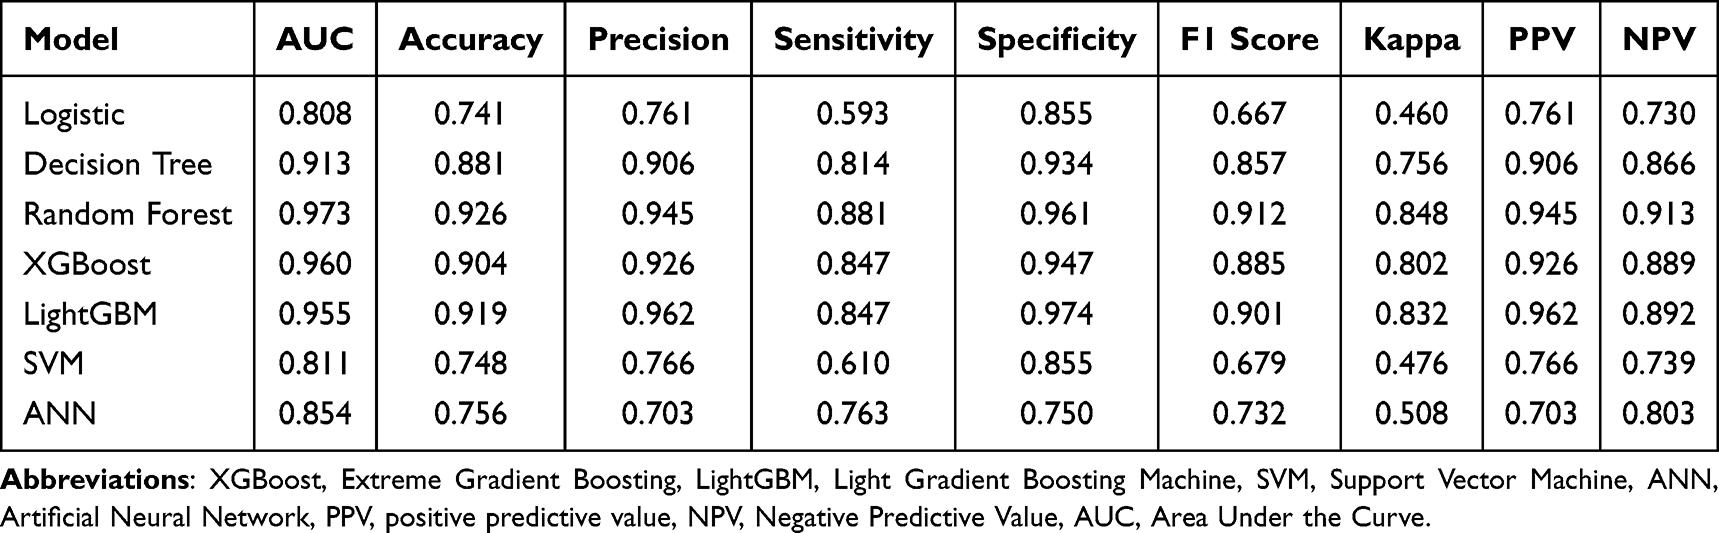 |
Table 2 Comparative Analysis of the Performance Outcomes Across Machine Learning Models |
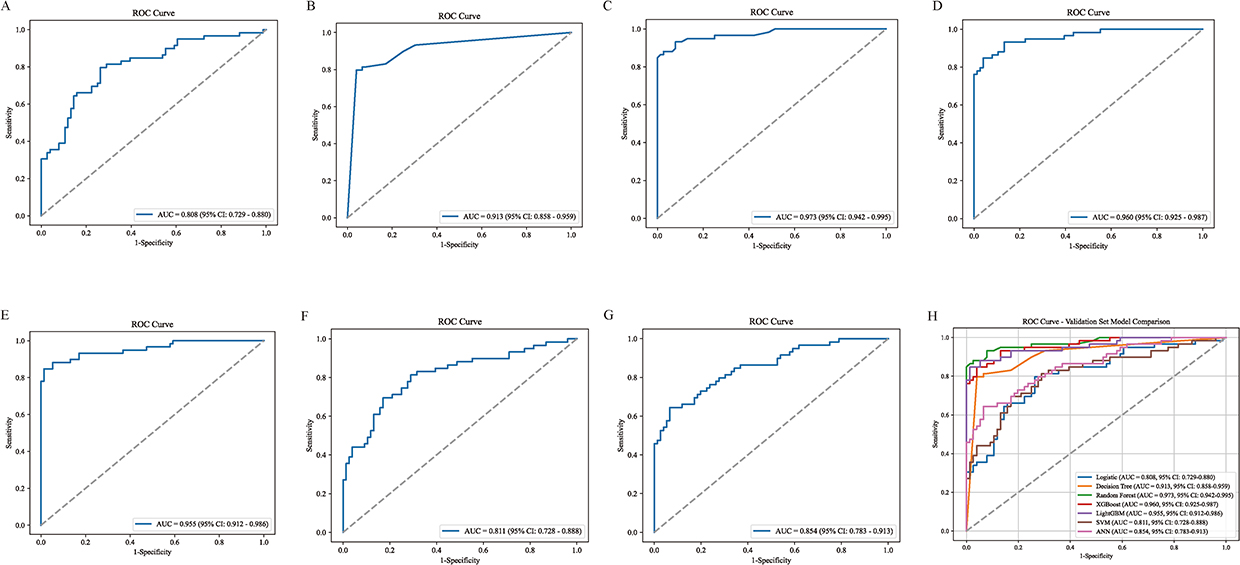 |
Figure 2 ROC curve of the test dataset. (A) Logistic (B) Decision Tree (C) Random Forest (D) XGBoost (E) LightGBM (F) SVM (G) ANN (H) ROC Curves for All Models. Abbreviations: XGBoost, Extreme Gradient Boosting, LightGBM, Light Gradient Boosting Machine, SVM, Support Vector Machine, ANN, Artificial Neural Network. |
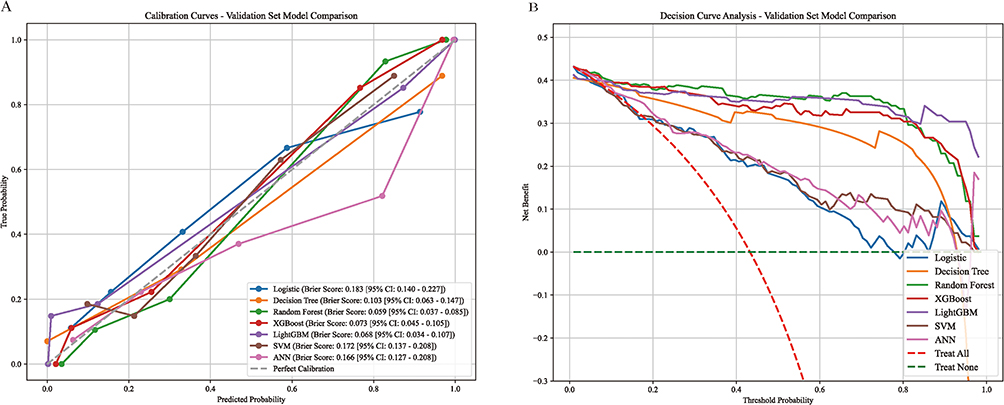 |
Figure 3 Model performance evaluation. (A) Calibration curves for the models. (B) DCA curves for the test dataset. |
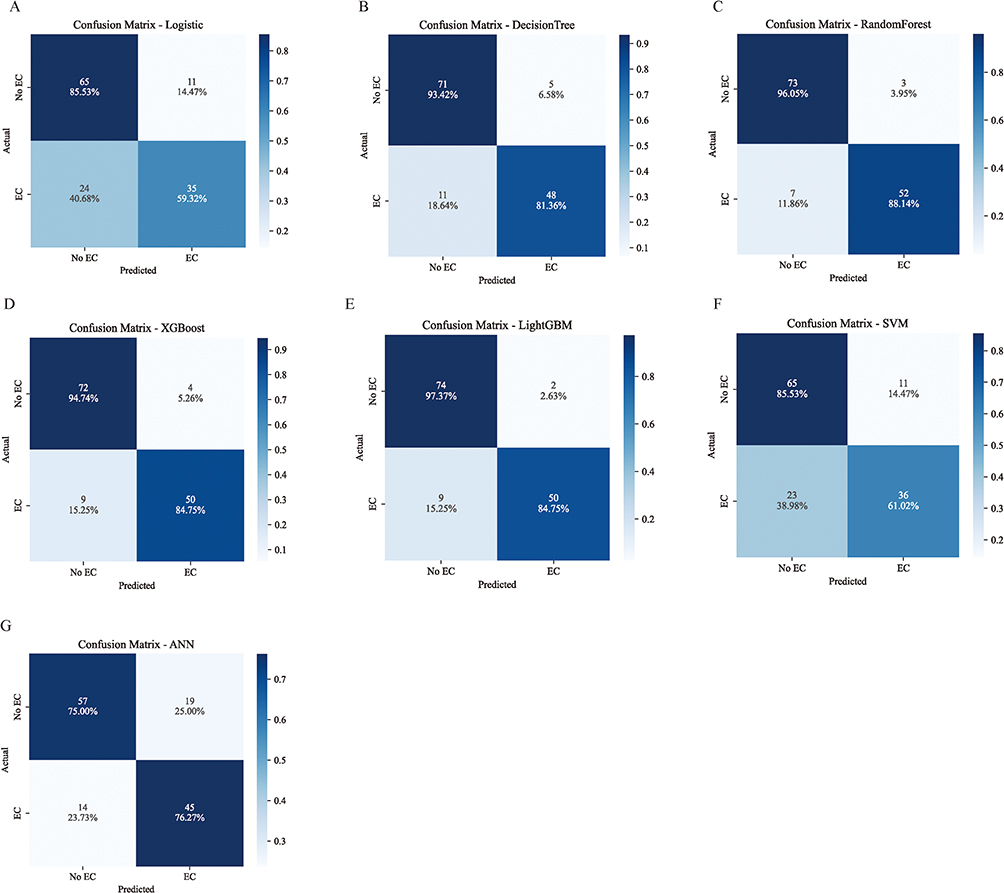 |
Figure 4 Test Dataset Confusion Matrix. (A) Logistic (B) Decision Tree (C) Random Forest (D) XGBoost (E) LightGBM (F) SVM (G) ANN. |
Robustness and Sensitivity Analyses
To further examine model stability, repeated stratified cross-validation (10 folds × 20 repeats) was performed; the RF model maintained the strongest and most stable discrimination (mean AUC 0.984 ± 0.012; Supplementary Table S3). Stage-restricted sensitivity analyses showed that the RF model retained high discrimination when limited to early-stage (stage I–II) EC cases versus controls (AUC 0.993 in the internal test set) as well as advanced-stage (stage III–IV) cases (AUC 0.970; Supplementary Table S4), indicating that performance was not driven solely by advanced disease. Permutation-importance analysis was concordant with the SHAP ranking, with CREA showing the largest mean AUC decrease, followed by MLR, UA, and SIRI (Supplementary Table S5).
Model Interpretation
We used SHAP analysis on the top-performing random forest model to interpret the influence of each predictor. CREA had the greatest average impact on the model output (mean (|SHAP|)=0.12), followed by SIRI (0.07), MLR (0.05), K (0.05), UA (0.04), TT (0.04), ADA (0.04), PT (0.02), and AST (0.02) (Figure 5A). The SHAP beeswarm plot indicated that lower CREA and higher SIRI values were positively associated with an increased risk of esophageal cancer (Figure 5B). Individual-level SHAP waterfall plots for representative subjects showed that the same features contributed in opposite directions and with different magnitudes to “cancer” versus “non-cancer” predictions, with CREA, SIRI, and MLR being the key drivers of the model’s decisions (Figure 5C and D). SHAP dependence plots further revealed pronounced non-linear relationships between individual variables and the model output (Figure 6). For SIRI, the effect on the output was modest at lower levels. Still, it increased steadily as values rose, with SHAP values shifting from negative to positive in the moderate-to-high range, indicating a stronger positive contribution to the predicted probability beyond a certain threshold (Figure 6A). Distinct U-shaped relationships were observed for MLR, AST, ADA, CREA, UA, K, PT, and TT, in which these variables primarily exerted a negative influence within their intermediate ranges but showed intensified, often positive, effects at very low or high values, highlighting a strong range-dependent effect on predictions (Figure 6B–I).
 |
Figure 5 SHAP explains the results of the Random Forest model. (A) SHAP values for each feature variable. (B) SHAP beeswarm plot showing the distribution and direction of feature effects across individuals. (C and D) Waterfall chart for the same patient (C) Esophageal cancer occurs (D) No esophageal cancer was detected. |
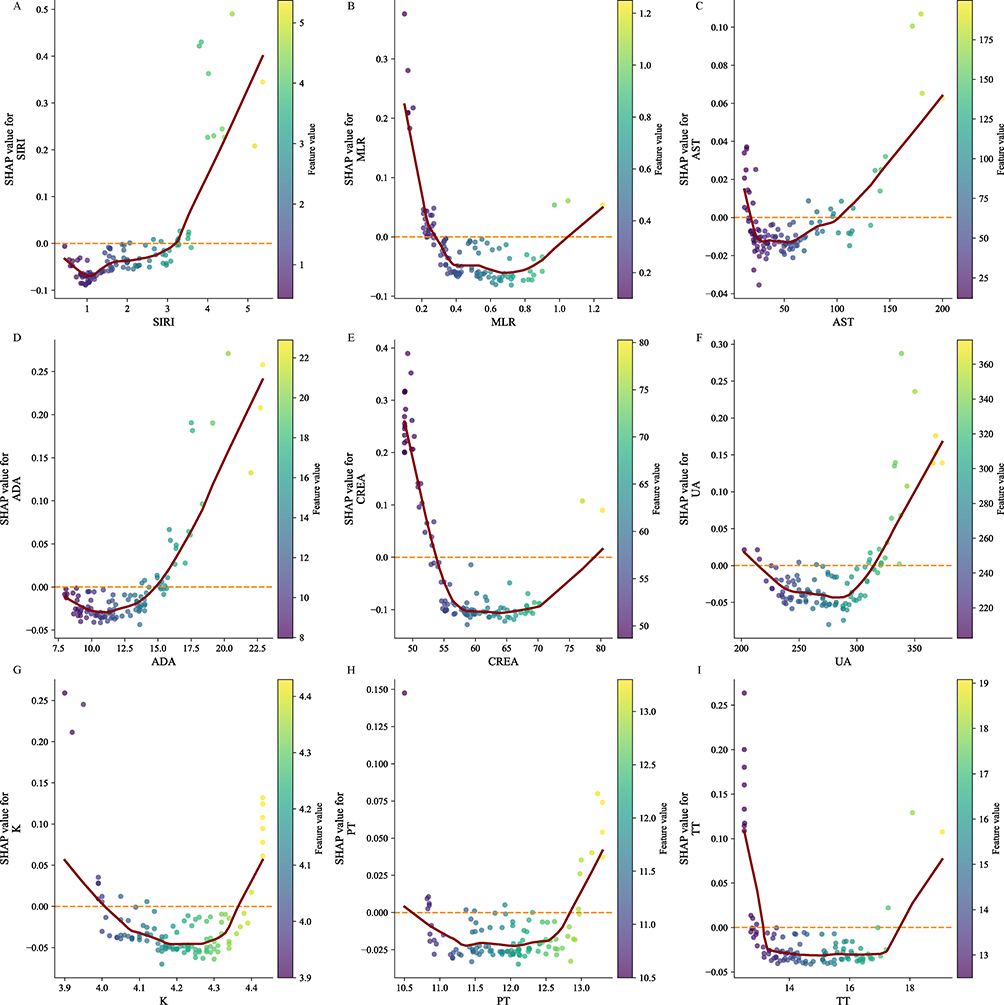 |
Figure 6 SHAP dependence plots for key predictors. Dependence plots show the relationship between feature values (x-axis) and SHAP values (y-axis) for SIRI, MLR, AST, ADA, CREA, UA, K, PT, and TT, illustrating potential non-linear effects on model predictions; the horizontal dashed line indicates SHAP =0. |
Discussion
Esophageal cancer is often diagnosed at an advanced stage due to its insidious early symptoms, leading to a poor prognosis for most patients. While endoscopy with pathological biopsy remains the diagnostic gold standard, its invasive nature leads to poor patient compliance in population-based screening. The high cost and uneven distribution of endoscopic resources further limit its feasibility for widespread, sustainable screening.22 A non-invasive, cost-effective, and accessible tool for preliminary risk stratification before endoscopic referral is therefore urgently needed. Using retrospective case-control data from two hospitals, this study developed a machine-learning model based on readily available routine laboratory metrics and basic clinical characteristics that demonstrated robust efficacy in predicting esophageal cancer risk. This model provides evidence-based support for proactively identifying high-risk individuals and optimizing the allocation of endoscopic resources.
Multi-indicator models offer greater clinical utility than single biomarkers,19,23 as routine laboratory parameters reflect comprehensive systemic alterations in inflammatory-immune status, nutrition, and coagulation during tumorigenesis. Evidence increasingly shows that machine learning models integrating routine hematological and biochemical data achieve superior performance in early risk identification and stratification for gastrointestinal malignancies.24,25 For example, Los et al used complete blood counts and interpretable machine learning to develop an effective pre-colonoscopy risk-stratification tool for colorectal cancer in a large screening cohort.20 Similarly, Zhen et al developed models from routine clinical data to identify young individuals at high risk for colorectal cancer, highlighting how deep data integration enhances the clinical applicability of early risk stratification.21 Methodologically, this study confirms the particular suitability of tree-based models for such multidimensional medical data. Human biochemical and inflammatory parameters often exhibit complex non-linear relationships, threshold effects, and interactive coupling, such as between liver function and coagulation or between inflammation and nutrition. Ren et al, using a large gastrointestinal cancer cohort, pathophysiologically substantiated this profound internal network: tumor-induced systemic inflammation disrupts hepatic protein metabolism and nutritional conversion while cross-activating the coagulation cascade via inflammatory mediators, thereby creating a synergistic, mutually causal pathological axis.26 Tree-based models, with their flexible splitting rules, can delineate these non-linear feature structures more effectively than traditional linear models, generating risk mappings that better approximate true clinical and physiological mechanisms.
Many machine learning models are constrained by their “black-box” nature, which obscures decision logic and impedes clinical translation. By applying the SHAP interpretability framework, this study provides a global ranking of feature importance. It elucidates the non-linear relationships and potential threshold effects between key variables and the predicted risk. The model’s risk determination does not rely on simplistic assumptions of higher or lower values equating to higher risk; instead, it captures significant shifts in risk contribution when indicators deviate from physiological homeostasis. At the inflammatory and immunological level, SIRI and MLR exhibited threshold effects, showing lower contributions within homeostatic intervals and increased contributions upon deviation, corroborating the biological cascade from systemic inflammation and immunosuppression to a protumorigenic microenvironment. While the relative proportions of neutrophils, monocytes, and lymphocytes contribute minimally to the model within an intermediate homeostatic range, breaching a specific inflection point—indicating a shift to an abnormal pro-inflammatory or immunosuppressive state—significantly increases their assigned risk weight. Indicators of metabolism, organ function, and coagulation, such as AST, ADA, CREA, UA, potassium ions (K), and PT/TT, similarly show pronounced low-contribution intervals with elevated contributions at distribution tails. Although not tumor-specific, abnormal fluctuations in these markers often reflect systemic homeostatic perturbations driven by tissue stress, high metabolic burden, or microenvironmental hypoxia.27,28 Within a multi-indicator network, they serve as comprehensive signals of host-tumor interactions, significantly enhancing the model’s sensitivity to subtle abnormal signals in the population.
The exceptionally high discrimination observed here (validation AUC 0.973) warrants cautious interpretation, and we examined several potential explanations. Repeated cross-validation confirmed that the random forest’s performance was stable rather than an artifact of a single favorable data split (Supplementary Table S3), and stage-restricted analyses showed that discrimination was preserved even for early-stage disease (Supplementary Table S4), arguing against the possibility that the model merely detects advanced systemic illness. Permutation importance was concordant with the SHAP results (Supplementary Table S5), and full hyperparameter configurations are reported (Supplementary Table S2) to support reproducibility. Nonetheless, a substantial part of the apparent performance likely reflects the case–control design itself: confirmed cancer patients were compared with a generally healthy examination population, a spectrum effect that tends to inflate discrimination relative to real-world screening, where the comparison group includes symptomatic individuals and benign esophageal disease. The reported metrics should therefore be regarded as an upper bound on real-world performance.
This study has several limitations. First, its dual-center retrospective case–control design is susceptible to selection and spectrum bias; the control group was drawn from a health examination population that is generally asymptomatic and healthier than individuals presenting with esophageal symptoms or benign esophageal disease, which may inflate apparent model performance and limit generalizability to real-world screening populations. Second, no independent external validation was performed: because the analytic dataset did not retain a center identifier, the model could not be trained on one hospital and tested on the other, and the internal robustness checks described above are not a substitute for prospective external validation. Third, the model is intended as a prescreening tool to prioritize individuals for endoscopic evaluation rather than as a diagnostic test, and its performance in symptomatic populations remains unknown. Fourth, because the data were retrospective, several established esophageal cancer risk factors—including detailed smoking and alcohol history, dietary structure, Barrett’s esophagus, gastroesophageal reflux disease, and family history—could not be incorporated. Finally, the non-linear correlations revealed by SHAP dependence plots operate at the model level and cannot be directly equated with biological causal mechanisms. These findings should therefore be interpreted with caution, and prospective, multicenter external validation in more diverse populations—including symptomatic and benign-disease comparison groups—is needed before clinical application.
In conclusion, an interpretable machine-learning model integrating routine laboratory parameters and clinical information showed strong internal performance for stratifying individuals at risk for esophageal cancer. Although these results are preliminary and require prospective, multicenter external validation, such an interpretable approach could—if validated—be developed into a low-cost, high-compliance prescreening aid in primary care to help prioritize individuals for endoscopic evaluation.
Conclusion
This study developed an interpretable machine-learning model to predict esophageal cancer risk using routine peripheral blood inflammatory, biochemical, and coagulation parameters. The random forest model demonstrated the best internal performance. Because the model was developed in a retrospective case–control setting with healthy controls and has undergone internal validation only, it should be regarded as a prescreening rather than a diagnostic tool; prospective, multicenter external validation is required before it can support clinical decision-making.
Declarations
Generative AI and AI-assisted technologies were NOT used in the preparation of this work.
Abbreviations
ADA, Adenosine Deaminase; AISI, Aggregate Index of Systemic Inflammation; ALP, Alkaline Phosphatase; ANN, Artificial Neural Network; APTT, Activated Partial Thromboplastin Time; AST, Aspartate Aminotransferase; CLR, C-reactive Protein to Lymphocyte Ratio; CREA, Creatinine; DCA, Decision Curve Analysis; DT, Decision Tree; EC, Esophageal Cancer; Fbg, Fibrinogen; GGT, Gamma-Glutamyl Transferase; GLB, Globulin; IBI, Inflammatory Burden Index; LASSO, Least Absolute Shrinkage and Selection Operator; LightGBM, Light Gradient Boosting Machine; LR, Logistic Regression; ML, Machine Learning; MLR, Monocyte-to-Lymphocyte Ratio; NAR, Neutrophil-to-Albumin Ratio; NLR, Neutrophil-to-Lymphocyte Ratio; NPV, Negative Predictive Value; PA, Prealbumin; PLR, Platelet-to-Lymphocyte Ratio; PPV, Positive Predictive Value; PT, Prothrombin Time; RF, Random Forest; SHAP, Shapley Additive Explanations; SII, Systemic Immune-Inflammation Index; SIRI, Systemic Inflammation Response Index; SVM, Support Vector Machine; TT, Thrombin Time; UA, Uric Acid; UREA, Urea; XGBoost, Extreme Gradient Boosting.
Data Sharing Statement
The datasets used and/or analysed during the current study are available from the corresponding author on reasonable request. The analysis code used to develop and evaluate the models is also available from the corresponding author on reasonable request.
Ethics Approval and Consent to Participate
All research procedures involving human participants complied with the 1964 Declaration of Helsinki and its subsequent amendments or comparable ethical standards. This study was approved by the Medical Ethics Committee of Siyang Hospital (approval number: KS2026002). Given the retrospective design of the study, which used only pre-existing, de-identified clinical and laboratory records and posed no more than minimal risk to participants, and because obtaining individual informed consent was impracticable for this record-based analysis, the Medical Ethics Committee of Siyang Hospital waived the requirement for informed consent. All patient data were anonymized prior to analysis, were stored on secure institutional servers with access restricted to the authorized study investigators, and were used solely for the purposes of this study, in accordance with the Declaration of Helsinki and applicable data-protection regulations, to protect patient confidentiality.
Author Contributions
All authors made a significant contribution to the work reported, whether that is in the conception, study design, execution, acquisition of data, analysis and interpretation, or in all these areas; took part in drafting, revising or critically reviewing the article; gave final approval of the version to be published; have agreed on the journal to which the article has been submitted; and agree to be accountable for all aspects of the work.
Funding
This study was jointly funded by Siyang Hospital and the Suqian Municipal Health Commission, as part of the 2024 Suqian Municipal Health Commission Medical Research Project (ZD202409).
Disclosure
The authors declare they have no conflicts of interest in this work.
References
1. Jin W, Huang K, Ding Z, et al. Global, regional, and national burden of esophageal cancer: a systematic analysis of the Global Burden of Disease Study 2021. Biomark Res. 2025;13(1):3. doi:10.1186/s40364-024-00718-2
2. Deboever N, Jones CM, Yamashita K, Ajani JA, Hofstetter WL. Advances in diagnosis and management of cancer of the esophagus. BMJ. 2024;385:e074962. doi:10.1136/bmj-2023-074962
3. Zhao YX, Zhao HP, Zhao MY, et al. Latest insights into the global epidemiological features, screening, early diagnosis and prognosis prediction of esophageal squamous cell carcinoma. World J Gastroenterol. 2024;30(20):2638–14. doi:10.3748/wjg.v30.i20.2638
4. Li H, Ding C, Zeng H, et al. Improved esophageal squamous cell carcinoma screening effectiveness by risk-stratified endoscopic screening: evidence from high-risk areas in China. Cancer Commun. 2021;41(8):715–725. doi:10.1002/cac2.12186
5. Li F, Liu M, Guo C, et al. Cost-effectiveness of precision screening for esophageal cancer based on individualized risk stratification in China: real-world evidence from the ESECC trial. Front Oncol. 2022;12:1002693. doi:10.3389/fonc.2022.1002693
6. Li H, Sun D, Cao M, et al. Risk prediction models for esophageal cancer: a systematic review and critical appraisal. Cancer Med. 2021;10(20):7265–7276. doi:10.1002/cam4.4226
7. Ma J, Pan S, Mortan R, Ali FS, Thosani N, Wadhwa V. Role of endoscopy in the diagnosis and management of esophageal cancer. J Clin Med. 2025;14(22). doi:10.3390/jcm14228169
8. Qu HT, Li Q, Hao L, et al. Esophageal cancer screening, early detection and treatment: current insights and future directions. World J Gastrointest Oncol. 2024;16(4):1180–1191. doi:10.4251/wjgo.v16.i4.1180
9. Chacko N, Ankri R. Non-invasive early-stage cancer detection: current methods and future perspectives. Clin Exp Med. 2024;25(1):17. doi:10.1007/s10238-024-01513-x
10. Heshmat-Ghahdarijani K, Sarmadi V, Heidari A, Falahati Marvasti A, Neshat S, Raeisi S. The neutrophil-to-lymphocyte ratio as a new prognostic factor in cancers: a narrative review. Front Oncol. 2023;13:1228076. doi:10.3389/fonc.2023.1228076
11. Zhao H, Wu L, Yan G, et al. Inflammation and tumor progression: signaling pathways and targeted intervention. Signal Transduct Target Ther. 2021;6(1):263. doi:10.1038/s41392-021-00658-5
12. Xie H, Ruan G, Wei L, et al. A novel inflammation-nutrition biomarker score for predicting prognosis of patients with cancer: results from a multicenter study. BMC Cancer. 2022;22(1):1311. doi:10.1186/s12885-022-10399-5
13. Paul S, Mukherjee T, Das K. Coagulation protease-driven cancer immune evasion: potential targets for cancer immunotherapy. Cancers. 2024;16(8). doi:10.3390/cancers16081568
14. Wang H, Zhou Z, Li H, et al. Blood biomarkers panels for screening of colorectal cancer and adenoma on a machine learning-assisted detection platform. Cancer Control. 2023;30:10732748231222109. doi:10.1177/10732748231222109
15. Bian Y, Gao Y, Jiang H, et al. Development and validation of a score-based model for estimating esophageal squamous cell carcinoma and precancerous lesions risk in an opportunistic screening population. Cancers. 2025;17(13). doi:10.3390/cancers17132138
16. Adlung L, Cohen Y, Mor U, Elinav E. Machine learning in clinical decision making. Med. 2021;2(6):642–665. doi:10.1016/j.medj.2021.04.006
17. Cai Y, Cai YQ, Tang LY, et al. Artificial intelligence in the risk prediction models of cardiovascular disease and development of an independent validation screening tool: a systematic review. BMC Med. 2024;22(1):56. doi:10.1186/s12916-024-03273-7
18. Efthimiou O, Seo M, Chalkou K, Debray T, Egger M, Salanti G. Developing clinical prediction models: a step-by-step guide. BMJ. 2024;386e078276. doi:10.1136/bmj-2023-078276
19. Xu YW, Peng YH, Liu CT, et al. Machine learning technique-based four-autoantibody test for early detection of esophageal squamous cell carcinoma: a multicenter, retrospective study with a nested case-control study. BMC Med. 2025;23(1):235. doi:10.1186/s12916-025-04066-2
20. Los B, Rocha BA, Da Silva DN, et al. AI-driven pre-screening for colorectal cancer using complete blood counts: toward broader population impact. Int J Colorectal Dis. 2025;40(1):235. doi:10.1007/s00384-025-05030-5
21. Zhen J, Li J, Liao F, et al. Development and validation of machine learning models for young-onset colorectal cancer risk stratification. NPJ Precis Oncol. 2024;8(1):239. doi:10.1038/s41698-024-00719-2
22. Rai V, Abdo J, Agrawal DK. Biomarkers for early detection, prognosis, and therapeutics of esophageal cancers. Int J Mol Sci. 2023;24(4). doi:10.3390/ijms24043316
23. Luan Y, Zhong G, Li S, et al. A panel of seven protein tumour markers for effective and affordable multi-cancer early detection by artificial intelligence: a large-scale and multicentre case-control study. EClinicalMedicine. 2023;61:102041. doi:10.1016/j.eclinm.2023.102041
24. Ke X, Cai X, Bian B, et al. Predicting early gastric cancer risk using machine learning: a population-based retrospective study. Digit Health. 2024;10:20552076241240905. doi:10.1177/20552076241240905
25. Li R, Hao X, Diao Y, Yang L, Liu J. Explainable machine learning models for colorectal cancer prediction using clinical laboratory data. Cancer Control. 2025;32:10732748251336417. doi:10.1177/10732748251336417
26. Ren JY, Wang D, Zhu LH, Liu S, Yu M, Cai H. Combining systemic inflammatory response index and albumin fibrinogen ratio to predict early serious complications and prognosis after resectable gastric cancer. World J Gastrointest Oncol. 2024;16(3):732–749. doi:10.4251/wjgo.v16.i3.732
27. Wu C, Xu T, Zhang H, et al. Hypoxia and immunometabolism in the tumor microenvironment: insights into mechanisms and therapeutic potential. Cancer Lett. 2025;631:217913. doi:10.1016/j.canlet.2025.217913
28. Bauer AT, Gorzelanny C, Gebhardt C, Pantel K, Schneider SW. Interplay between coagulation and inflammation in cancer: limitations and therapeutic opportunities. Cancer Treat Rev. 2022;102:102322. doi:10.1016/j.ctrv.2021.102322
 © 2026 The Author(s). This work is published and licensed by Dove Medical Press Limited. The
full terms of this license are available at https://www.dovepress.com/terms
and incorporate the Creative Commons Attribution
- Non Commercial (unported, 4.0) License.
By accessing the work you hereby accept the Terms. Non-commercial uses of the work are permitted
without any further permission from Dove Medical Press Limited, provided the work is properly
attributed. For permission for commercial use of this work, please see paragraphs 4.2 and 5 of our Terms.
© 2026 The Author(s). This work is published and licensed by Dove Medical Press Limited. The
full terms of this license are available at https://www.dovepress.com/terms
and incorporate the Creative Commons Attribution
- Non Commercial (unported, 4.0) License.
By accessing the work you hereby accept the Terms. Non-commercial uses of the work are permitted
without any further permission from Dove Medical Press Limited, provided the work is properly
attributed. For permission for commercial use of this work, please see paragraphs 4.2 and 5 of our Terms.
Recommended articles
An Explainable Machine Learning Model to Predict Acute Kidney Injury After Cardiac Surgery: A Retrospective Cohort Study
Gao Y, Wang C, Dong W, Li B, Wang J, Li J, Tian Y, Liu J, Wang Y
Clinical Epidemiology 2023, 15:1145-1157
Published Date: 4 December 2023
Analysis of Health-Related Quality of Life in Elderly Patients with Stroke Complicated by Hypertension in China Using the EQ-5D-3L Scale
Wang S, Shen C, Yang S
Journal of Multidisciplinary Healthcare 2024, 17:1981-1997
Published Date: 30 April 2024
Integrating Machine Learning and the SHapley Additive exPlanations (SHAP) Framework to Predict Lymph Node Metastasis in Gastric Cancer Patients Based on Inflammation Indices and Peripheral Lymphocyte Subpopulations
Zhu Z, Wang C, Shi L, Li M, Li J, Liang S, Yin Z, Xue Y
Journal of Inflammation Research 2024, 17:9551-9566
Published Date: 23 November 2024
Explainable Prediction of Long-Term Glycated Hemoglobin Response Change in Finnish Patients with Type 2 Diabetes Following Drug Initiation Using Evidence-Based Machine Learning Approaches
Chandra G, Lavikainen P, Siirtola P, Tamminen S, Ihalapathirana A, Laatikainen T, Martikainen J, Röning J
Clinical Epidemiology 2025, 17:225-240
Published Date: 8 March 2025
Construction and Validation of a Machine Learning-Based Risk Prediction Model for Sleep Quality in Patients with OSA
Tong Y, Wen K, Li E, Ai F, Tang P, Wen H, Guo B
Nature and Science of Sleep 2025, 17:1271-1289
Published Date: 12 June 2025