Back to Journals » Psychology Research and Behavior Management » Volume 19
Development and Validation of a Nomogram to Identify and Predict High-Distress Psychosocial Phenotypes in Tinnitus Patients: A Latent Profile Analysis
Authors Xu X, Xiao S, Li X, Niu Y, Cen S, Chang Z, Liu C, Zhang L, Zhang X, Liu F
Received 6 April 2026
Accepted for publication 16 June 2026
Published 26 June 2026 Volume 2026:19 614795
DOI https://doi.org/10.2147/PRBM.S614795
Checked for plagiarism Yes
Review by Single anonymous peer review
Peer reviewer comments 2
Editor who approved publication: Professor Mei-Chun Cheung
Xinyu Xu,1,2,* Sijie Xiao,2,* Xinran Li,2 Yingbu Niu,2 Sihui Cen,3 Zongyu Chang,2 Caixia Liu,2 Leyi Zhang,4 Xilu Zhang,5 Fang Liu1
1Department of Otology, Affiliated Hospital of Yan’an University, Yan’an, Shaanxi, People’s Republic of China; 2School of Public Health, Xi’an Jiaotong University, Xi’an, Shaanxi, People’s Republic of China; 3School of Life Sciences and Technology, Xi’an Jiaotong University, Xi’an, Shaanxi, People’s Republic of China; 4Independent Researcher, Xi’an, Shaanxi, People’s Republic of China; 5Department of Acupuncture and Tuina, Shaanxi University of Chinese Medicine, Xianyang, Shaanxi, People’s Republic of China
*These authors contributed equally to this work
Correspondence: Fang Liu, Department of Otology, Affiliated Hospital of Yan’an University, Yan’an, Shaanxi, People’s Republic of China, Email [email protected] Xilu Zhang, Department of Acupuncture and Tuina, Shaanxi University of Chinese Medicine, Xianyang, Shaanxi, People’s Republic of China, Email [email protected]
Objective: Evidence is limited on the multidimensional psychosocial heterogeneity among patients with subjective tinnitus, and practical tools for early risk stratification remain largely unexplored. This study aimed to identify distinct psychosocial phenotypes under the biopsychosocial model to pinpoint the high-risk population and to develop and validate a visualized nomogram predicting severe psychological distress for targeted interventions.
Methods: A total of 534 subjective tinnitus patients were enrolled. Latent profile analysis using seven psychosocial indicators (Self-Rating Anxiety Scale total score, Self-Rating Depression Scale total score, positive life events score, negative life events score, subjective support score, objective support score, and support utilization score) identified distinct patient phenotypes. The “Severe Anxiety Isolated” phenotype was defined as the target “high-distress” group for the prediction model. Clinical characteristics and tinnitus-related disability were compared across groups. Multivariate logistic regression identified independent predictors of the high-distress phenotype to construct a nomogram, validated via ROC, calibration, and decision curve analysis.
Results: Four distinct psychosocial phenotypes were identified via LPA: the Chronic Vulnerable phenotype (18.73%), the Severe Anxiety Isolated phenotype (28.09%, defined as the high-distress high-risk phenotype), the Well Adapted Healthy phenotype (43.82%), and the High Positive Life Events Resilient phenotype (9.18%). The Severe Anxiety Isolated phenotype had significantly higher Tinnitus Handicap Inventory (THI) and Insomnia Severity Index (ISI) scores compared with other phenotypes (all P< 0.001). Age group (21– 39 years), longer tinnitus duration, concurrent presence of vertigo, bilateral tinnitus, and easily agitated/irritable personality traits were independent risk factors for the high-distress phenotype. The constructed nomogram exhibited good discrimination (AUC=0.756 in the training cohort and 0.737 in the testing cohort), calibration, and clinical utility.
Conclusion: Subjective tinnitus patients exhibit profound psychosocial heterogeneity, with the Severe Anxiety Isolated phenotype facing the highest psychological risk. Our developed nomogram accurately predicts this high-risk phenotype using routine outpatient indicators, facilitating early risk stratification and precision biopsychosocial interventions.
Keywords: subjective tinnitus, latent profile analysis, nomogram, precision medicine, audiological rehabilitation
Introduction
Tinnitus, defined as the perception of sound in the absence of an external acoustic stimulus, is a complex clinical symptom that has long affected approximately 10–15% of adults worldwide.1,2 The chronicity and severity of this symptom contribute to a significant global disease burden, generating substantial psychosocial and economic costs.3,4 Tinnitus not only manifests as abnormal auditory perception, but is often accompanied by severe psychological disorders such as anxiety, depression, and sleep disturbances.5,6 A meta-analysis encompassing 22 studies revealed that compared to the general population, patients with tinnitus not only face elevated risks of anxiety (1.63-fold), depression (1.92-fold), and insomnia (3.07-fold), but more alarmingly, exhibit a 5.31-fold higher risk of suicide when accompanied by severe psychological distress.6 However, the clinical manifestations of tinnitus exhibit remarkable heterogeneity:7 the severity of psycho-emotional distress is often disproportionate to the audiological or physiological impairment. Individuals presenting with nearly identical audiometric profiles may report vastly different subjective experiences; one might successfully habituate to the phantom sound, while another suffers from debilitating anxiety and severe functional impairment. Traditional biomedical perspectives, which focus primarily on auditory pathways or isolated neurostructural abnormalities, fail to adequately explain this profound individual variance.8,9
To unravel this profound heterogeneity, it is crucial to recognize that the psychological burden of tinnitus is not merely an isolated emotional response but the result of complex interactions across multiple psychosocial dimensions.7,10 While previous studies have extensively documented the individual impacts of hearing loss11 or basic emotional distress,12 they have largely overlooked the dynamic interconnections among these clinical variables. For instance, negative life events can act as catalysts that intensify psychological distress and weaken social bonds,13 whereas robust social support serves as a critical buffer that mitigates anxiety and indirectly reduces perceived tinnitus severity.14 Because these diverse dimensions recombine in different ways, tinnitus patients comprise multiple distinct psychosocial phenotypes rather than a homogeneous population. Traditional linear analytical methods, which estimate average associations across the entire sample, often struggle to capture complex nonlinear heterogeneity and may obscure clinically meaningful individual differences and distinct symptom configurations, thereby necessitating more refined, person-centered classification approaches.15 Furthermore, identifying these subtypes is only the first step. The ultimate goal of clinical practice is to predict phenotypic classification through simple, objective clinical indicators. Establishing an effective predictive model can assist clinicians in rapidly identifying high-risk patients who are prone to severe psychosocial crises, thereby providing clear intervention targets for personalized and precision management.16,17 This is particularly important because standard tinnitus care still relies heavily on subjective symptom reports and audiological evaluation,3 while reliable objective markers for psychosocial risk stratification and treatment success remain limited. A nomogram is a visual clinical prediction tool that integrates multiple independent predictors into a simple graphical scoring system, allowing clinicians to estimate an individual patient’s probability of a specific outcome in an intuitive and quantitative manner.18,19 In the present study, this approach is particularly relevant because it can translate routinely collected outpatient indicators into individualized risk estimates for high-distress psychosocial phenotypes, thereby supporting rapid screening and precision biopsychosocial intervention.
Therefore, this study aimed to systematically characterize the psychosocial patterns of patients with subjective tinnitus and to identify distinct latent subgroups using Latent Profile Analysis (LPA). As an advanced person-centered statistical approach, LPA was utilized to deconstruct the multidimensional heterogeneity of the population by uncovering unobserved, homogeneous profiles based on continuous psychosocial indicators. Furthermore, we sought to determine the key risk factors such as personality traits, disease course, and clinical symptoms that drive this phenotypic classification and to develop a visualized nomogram. These findings are intended to provide clinicians with an intuitive and quantifiable tool to accurately predict individual risk levels and implement more targeted intervention strategies.
Methods
Study Design and Population
This cross-sectional study reviewed the historical electronic medical records and clinical data of outpatients who visited the Tinnitus Clinic of the Department of Otology, Yan’an University Affiliated Hospital, between January 2023 and December 2025. During this period, consecutive outpatients attending the clinic were routinely evaluated according to the institution’s standardized clinical protocols for tinnitus management. As part of standard routine care, tinnitus type was determined, and secondary etiologies were systematically ruled out through comprehensive medical history collection, physical examinations, and necessary auxiliary tests. To monitor clinical progress, eligible patients routinely completed standardized clinical scale assessments in a quiet environment during their consultations. Clinic medical staff provided standard procedural guidance regarding the scales as part of normal clinical practice, without intervening in the patients’ responses. All clinical findings and scale scores were documented and verified in the hospital’s electronic database using a pre-defined case report form for routine quality control and traceability. Patients were eligible for consecutive enrollment if they met the following clinical criteria: (1) a definite diagnosis of subjective tinnitus with a disease duration ≥ 3 months; (2) age between 18 and 75 years; and (3) normal reading and comprehension abilities sufficient to independently complete self-assessment scales during their routine visits. Patients were excluded from this retrospective analysis if they met any of the following criteria based on their historical medical records: (1) organic or conductive tinnitus caused by definite etiologies (eg., external auditory canal obstruction, otitis media, or acoustic neuroma); (2) a documented history of psychiatric illness, or the use of systemic anxiolytics or antidepressants within two weeks prior to the clinic visit (to eliminate baseline psychiatric confounds and ensure that psychological scale scores primarily reflected tinnitus-related distress); (3) presence of severe systemic diseases that could significantly affect symptom assessment or confound result interpretation; or (4) incomplete routine questionnaire records.
As illustrated in the flow chart in Figure 1, a total of 642 medical records of patients with tinnitus were initially screened. During the data selection process, 35 cases were excluded in the first round because 12 patients were aged under 18 or over 75 years and 23 patients had a tinnitus duration of less than 3 months, leaving 607 eligible patients after the first exclusion. In the second round of screening, an additional 73 cases were excluded, which specifically consisted of 28 patients with organic or conductive tinnitus, 21 patients with a history of psychiatric illness or recent anxiolytic and antidepressant use, 14 patients with severe systemic diseases, and 10 patients with incomplete routine questionnaire records, resulting in a final analytical cohort of 534 patients.
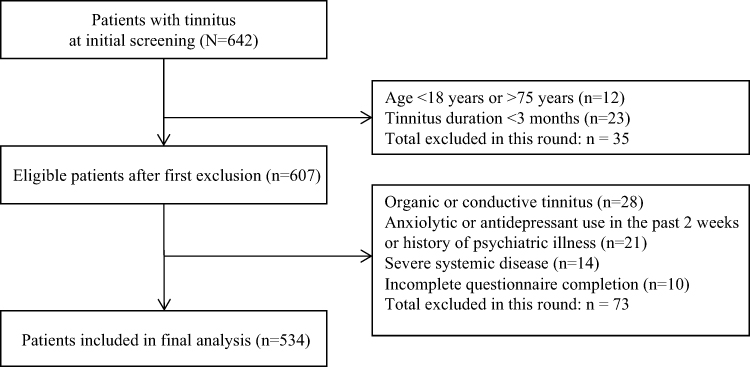 |
Figure 1 Flowchart of participant screening and enrollment. |
The current research protocol was formally reviewed and approved by the Medical Ethics Committee of the Yan’an University Affiliated Hospital prior to any data extraction or statistical analysis. At the time of their clinical consultations, all participating outpatients had already signed a routine institutional informed consent form agreeing to undergo standardized psychological scale assessments as an integral component of their routine diagnostic evaluation and clinical management. Consequently, since this cross-sectional study strictly utilized these existing medical records and all extracted dataset profiles were fully anonymized to safeguard patient privacy, additional study-specific consent was deemed unnecessary by the ethics committee under the approved protocol which adhered to the institutional data privacy regulations and the ethical guidelines of the Declaration of Helsinki.
This study was conducted and reported in accordance with the Strengthening the Reporting of Observational Studies in Epidemiology guidelines. The completed Strengthening the Reporting of Observational Studies in Epidemiology checklist is available as Supplementary File 1.
Instruments and Measurements
Indicator Variables for Latent Profile Analysis
To identify distinct psychosocial phenotypes among tinnitus patients, the LPA was conducted. Guided by the biopsychosocial model, we posited that a patient’s overall psychological burden is collectively shaped by their baseline emotional state, external environmental stressors, and available psychosocial buffering resources. Therefore, seven specific continuous variables spanning these three core dimensions were selected as the indicators for the LPA model.
The first dimension, emotional status, was quantified using the total scores of the Self-Rating Anxiety Scale (SAS) and the Self-Rating Depression Scale (SDS) to evaluate the severity of anxiety and depressive symptoms, respectively.20,21 The second dimension, environmental stressors, was assessed using the Life Events Scale (LES). Specifically, the positive and negative life event scores were extracted separately to distinguish the distinct psychological impacts of favorable versus adverse recent life changes. The third dimension, psychosocial buffering, was evaluated using the Social Support Rating Scale (SSRS). This dimension incorporated three distinct subscale scores: subjective support, objective support, and support utilization. These three variables comprehensively capture the perceived level of care, the actual material or social assistance received, and the patient’s active engagement with available support networks.
All seven aforementioned indicator variables were collected at baseline and directly incorporated into the LPA modeling to uncover the underlying unobserved patient clusters.
Measurement of Psychosocial Indicator Variables
Self-Rating Anxiety Scale
Anxiety symptoms were assessed using the SAS, developed by Zung.20 The SAS is widely used in mental health research to evaluate the severity of anxiety symptoms. The scale consists of 20 items measuring the frequency of anxiety symptoms experienced recently. Each item is rated on a 4-point Likert scale (1 = “none or a little of the time,” 2 = “some of the time,” 3 = “a good part of the time,” and 4 = “most or all of the time”), with five items reverse-scored. The raw sum score ranges from 20 to 80, and is typically multiplied by 1.25 to obtain the standardized score. A standardized score ≥50 is commonly used as the cutoff for clinically significant anxiety symptoms, with higher scores indicating greater severity. In this study, the Cronbach’s α coefficient for the SAS was 0.872, indicating good internal consistency.
Self-Rating Depression Scale
Depressive symptoms were assessed using the SDS, also developed by Zung.21 The SDS is widely used to measure the severity of depressive symptoms. The scale comprises 20 items assessing the frequency of depressive mood and related symptoms experienced recently. Each item is rated on a 4-point Likert scale (1 = “none or a little of the time,” 2 = “some of the time,” 3 = “a good part of the time,” and 4 = “most or all of the time”), with ten items reverse-scored. The raw sum score ranges from 20 to 80, and is multiplied by 1.25 to derive the standardized score. A standardized score ≥53 is generally considered indicative of clinically significant depressive symptoms, with higher scores reflecting greater severity. In this study, the Cronbach’s α coefficient for the SDS was 0.907, demonstrating good internal consistency.
Social Support Rating Scale
Social support was measured using the SSRS, which remains one of the most widely used assessment tools for social support in China. The scale consists of 10 items comprising three distinct subscales: objective support, subjective support, and support utilization. Rather than using an aggregated total score, we specifically extracted these three independent subscale scores as indicator variables for the LPA. This approach allows for a more granular evaluation of the patients’ multidimensional support networks. Higher scores on these respective subscales indicate greater levels of actual material assistance received, perceived emotional backing, and active utilization of available support resources. Specifically, within this self-report instrument, objective support is operationally assessed through factual indicators regarding the patient’s observable social structures and tangible help such as living arrangements and concrete sources of emergency financial aid, whereas subjective support measures the patient’s internal emotional perceptions of being respected, understood, and supported by family or colleagues, and support utilization reflects the active behaviors of the patient in seeking and leveraging these available resources. In this study, the Cronbach’s α coefficient for the SSRS was 0.855, suggesting good internal consistency.
Life Events Scale (LES)
Life events were assessed using LES.22 The LES evaluates important life events experienced over the past 12 months and their psychosocial impact, covering multiple domains including family life, work/study, and social interactions. Participants were asked to report whether specific events had occurred and to evaluate the nature and impact of these events.
The scale first records whether participants have experienced relevant life events. If an event occurred, participants classified it as either positive or negative based on their judgment, and assessed its impact. Finally, positive and negative life event scores were calculated according to the scale’s scoring rules, with higher scores indicating greater psychological impact from the respective type of life events. In this study, the positive life event score reflected the perceived psychosocial impact associated with favorable life events, whereas the negative life event score reflected the psychological burden associated with adverse life events. Both scores were included as continuous variables in the LPA model. The Cronbach’s α coefficient for the LES was 0.891.
Predictor Variables for Model Development
To enhance the clinical interpretability and predictive value of the identified phenotypes, easily accessible baseline predictors from the outpatient setting were incorporated. These candidate predictors were comprehensively extracted from the standardized clinical data form and classified into three primary categories: sociodemographic characteristics, tinnitus-related clinical characteristics, and personality traits. Sociodemographic characteristics included age stratified into three exact ranges: 21–39 years, 40–60 years, and 61–74 years, sex (male or female), educational level recategorized into three explicit tiers: low education (no education, primary school, junior high school), medium education (senior high school, technical secondary school), and high education (college, postgraduate and above), and marital status categorized as unmarried, married, divorced, or widowed. Tinnitus-related clinical characteristics encompassed tinnitus duration (included in the analysis as a continuous variable measured in years), tinnitus laterality classified as left ear, right ear, or bilateral, and the presence of accompanying vertigo. To capture stable individual differences in psychological and behavioral patterns, self-reported personality traits were systematically assessed using the Eysenck Personality Questionnaire,23 a well-validated and widely used instrument for personality evaluation in clinical and epidemiological research. Based on the two core dimensions of extraversion (E) and neuroticism (N) from the EPQ, participants were categorized into four classic, mutually exclusive temperament typologies: choleric (high extraversion, high neuroticism), sanguine (high extraversion, low neuroticism), phlegmatic (low extraversion, low neuroticism), and melancholic (low extraversion, high neuroticism). Hearing loss was defined as a pure-tone average of air conduction thresholds ≥ 25 dB HL at 0.5, 1, 2, and 4 kHz, measured in a sound-attenuated booth using a calibrated clinical audiometer by a certified audiologist. Patients were dichotomized into two groups: normal hearing (PTA < 25 dB HL) and hearing loss (PTA ≥ 25 dB HL).
Outcome Variables for Validation
To externally validate the clinical relevance and severity of the identified psychosocial phenotypes, two highly recognized clinical assessment tools were employed as primary outcome variables. The first outcome variable was the Tinnitus Handicap Inventory, which was utilized to evaluate the impact of tinnitus on patients’ daily lives and their self-perceived severity of the symptom. It is a standardized and self-administered questionnaire that comprehensively measures the functional, emotional, and catastrophic dimensions of tinnitus-related disability. The total score ranges from 0 to 100, with higher scores indicating a more profound subjective burden and greater impairment in the patient’s quality of life. In this study, differences in these scores were compared across the latent profiles to verify whether the most psychologically vulnerable groups experienced the highest objective disease burden.24
Furthermore, given the robust correlation between tinnitus and sleep disorders, the Insomnia Severity Index was independently administered to assess the nature, severity, and impact of insomnia. This seven-item scale captures patients’ subjective distress regarding sleep onset, sleep maintenance, early awakening, and daytime fatigue. The total score ranges from 0 to 28, where higher scores signify more severe sleep disturbances. Incorporating this index as an external validation metric allowed us to corroborate the broader somatic and psychosocial impact of the specific tinnitus phenotypes beyond auditory symptoms alone.25
Statistical Analysis
Latent Profile Analysis
Our total sample size of 534 participants aligns well with the recommended guidelines for mixture modeling. Previous methodological and simulation studies have indicated that a sample size of approximately 500 is generally adequate to achieve sufficient statistical power and stability in latent profile analysis for correctly enumerating the true number of latent classes, even when incorporating multiple continuous indicators.26,27 Prior to identifying the latent profiles of psychosocial characteristics, it was imperative to standardize the continuous indicator variables to eliminate dimensional differences and scale variances among the different psychometric tools. All seven psychosocial indicators were transformed into standard Z-scores using the formula

where X represents the raw score,  is the sample mean, and
  is the standard deviation. This essential standardization step ensured that variables with inherently larger numeric ranges, such as the Life Events Scale, did not disproportionately dominate the variance in the clustering algorithm. Following this transformation, the latent profile analysis was executed using R software to explore the unobserved population heterogeneity. The optimal number of profiles was rigorously determined by comprehensively evaluating multiple fit indices and classification quality metrics detailed in Table 1. These evaluated metrics included the Log-Likelihood, Akaike Information Criterion (AIC), Bayesian Information Criterion (BIC), Sample-Size-Adjusted BIC, Approximate Weight of Evidence, Entropy, the minimum class assignment probability, and the Bootstrap Likelihood Ratio Test (BLRT). Generally, lower values of the information criteria indicate a superior model fit with optimal parsimony, while Entropy values closer to 1 reflect higher classification accuracy.
 |
Table 1 Fit Indices of Latent Profile Analysis Models with Different Numbers of Classes |
Between-Group Comparisons and Factor Selection
Following the identification of latent profiles, participants were assigned to their most likely profile, which served as the grouping variable for subsequent between-group comparisons and factor selection. Differences in clinical characteristics and outcome validation variables (THI and ISI scores) across the identified profiles were examined using univariate analysis. For continuous variables, the choice of test was determined by their distribution: analysis of variance was used for approximately normally distributed variables, while the Kruskal–Wallis test was applied for skewed distributions. Categorical variables were compared using the chi-squared test or Fisher’s exact test, as appropriate.
Subsequently, a specific target profile of interest (eg., a pre-defined high-distress profile such as Class 2) was used as the binary dependent variable in a multivariable logistic regression analysis. Candidate variables that were statistically significant in univariate analyses or considered clinically meaningful were entered into a stepwise selection process to identify independent risk factors. Odds ratios (ORs) with their 95% confidence intervals (CIs) were calculated.
Nomogram Development and Validation
A visualized nomogram was constructed using the rms package in R, based on the regression coefficients from the multivariable logistic regression model, to provide individualized risk estimates for the target outcome. This nomogram is designed to predict the risk of the high‑distress psychosocial phenotype (Severe Anxiety Isolated class) in tinnitus patients. Candidate variables that were statistically significant in univariate analyses or considered clinically meaningful were entered into a backward stepwise selection process based on the AIC to minimize the risk of overfitting and identify independent predictors.
For model validation, the total sample (N = 534) was randomly split into a training set (70%) and a validation set (30%). The training set was used for model fitting and nomogram construction, while the validation set was used to independently assess the model’s generalizability. Model discrimination was evaluated using the ROC curve and the area under the curve (AUC). To enhance clinical applicability, the optimal predicted probability cut-off was determined by maximizing Youden’s index, allowing for the calculation of corresponding sensitivity and specificity values. Model calibration was assessed by plotting calibration curves and examining the agreement between predicted probabilities and observed outcomes. To rigorously mitigate the risk of overfitting inherent in single-center studies, internal validation and model stability were further examined using intensive bootstrapping with 1000 resamples. This technique is widely recommended as a robust internal validation alternative when an external cohort is unavailable. Furthermore, the decision curve analysis (DCA) was performed to evaluate the clinical utility of the nomogram by quantifying the net benefit across different threshold probabilities in clinical decision-making scenarios.
Results
Latent Profile Analysis and Optimal Class Determination
As demonstrated in the supplementary analysis, the Bayesian Information Criterion reached its lowest point at the four-class model with a value of 9283 and subsequently increased to 9309 in the five-class model, strongly penalizing over-parameterization. Furthermore, the four-class model exhibited a remarkably high Entropy of 0.938 and a robust minimum class probability of 0.942. In stark contrast, extracting five or six classes resulted in a precipitous drop in both Entropy and assignment probabilities, indicating severe model fragmentation and unreliable classification. Crucially, the BLRT for the four-class model was highly significant (P < 0.001), providing the gold-standard statistical justification for its retention over a three-class solution. Although the identified fourth class (Class 4) represented a relatively small proportion of the cohort (n = 49, 9.1%), this subgroup size comfortably exceeds the established methodological threshold of 5% required to maintain structural stability in latent profile models. Because this profile captures a clinically distinct and highly vulnerable phenotype that is practically crucial for targeted interventions, its retention is both statistically and theoretically sound. By meticulously balancing these objective statistical parameters with clinical interpretability, the four-class model was definitively selected as the optimal phenotypic classification for all subsequent analyses.
A total of 534 eligible patients were included in the final analysis. Latent profile analysis was performed using standardized psychometric and social support indicators, including anxiety symptoms, depressive symptoms, positive and negative life event scores, and multidimensional social support scores. Based on model-fit indices and clinical interpretability, the four-class model was selected as the optimal solution, as visually represented in Figure 2. Class 1 was defined as the Chronic Vulnerable phenotype, comprising 100 patients or 18.73% of the cohort. This class was characterized by moderate anxiety and depression alongside the highest support utilization score of 7.23, suggesting persistent psychological vulnerability with active use of available support resources. Class 2 represented the Severe Anxiety Isolated phenotype, including 150 patients or 28.09% of the cohort. This class was distinctly characterized by extreme anxiety, with a mean SAS score of 65.1, the highest negative life event score of 48.69, and the lowest total social support score of 26.75, indicating a high-distress subgroup with pronounced psychological burden and insufficient social support. Class 3 was labeled as the Well Adapted Healthy phenotype, including the majority of the sample, with 234 patients or 43.82% of the cohort. This class was distinguished by the lowest baseline anxiety and depression levels and minimal negative life event burden, suggesting relatively favorable psychosocial adaptation. Class 4 was labeled as the High Positive Life Events Resilient phenotype, consisting of 49 patients or 9.18% of the cohort. This class exhibited a uniquely high positive life event score of 17.29 while maintaining robust total social support at 37.86 and normal psychological well-being, suggesting a resilient psychosocial pattern despite substantial life-event-related psychosocial stimulation.
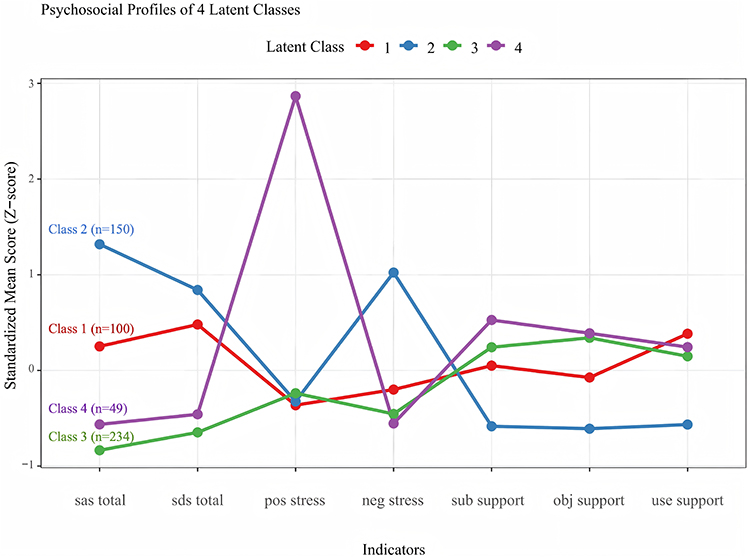 |
Figure 2 Psychosocial profiles of the four latent classes identified by latent profile analysis. The y-axis represents the standardized mean Z-scores, where 0 indicates the sample mean. Values above 0 represent scores higher than the average, and values below 0 represent scores lower than the average. Indicators include: sas_total (anxiety), sds_total (depression), pos_stress (positive life events/coping), neg_stress (negative life events), and three dimensions of social support (sub_support, obj_support, use_support). |
Baseline Characteristics Across Latent Subgroups
Between-group comparisons revealed significant heterogeneity in baseline demographic and clinical characteristics across the four profiles as detailed in Table 2. The High Positive Life Events Resilient cohort was the oldest with a mean age of 53.31 (SD 14.72) years, whereas the Well Adapted Healthy cohort was the youngest at 43.37 (SD 12.59) years (P < 0.001). Educational attainment varied significantly among subgroups, with the High Positive Life Events Resilient and Well Adapted Healthy groups exhibiting higher rates of high education category compared to the distressed cohorts (P < 0.001). Regarding clinical features, the Severe Anxiety Isolated group experienced the longest average tinnitus duration of 2.91 (SD 1.21) years, while the Chronic Vulnerable group reported the highest prevalence of accompanying vertigo at 43.0% (both P < 0.05). Psychological distress and life event perceptions demonstrated profound intergroup disparities. The Severe Anxiety Isolated group bore the heaviest overall burden, recording the highest mean scores on both the Self-Rating Anxiety Scale at 65.07 (SD 6.99) and the Self-Rating Depression Scale at 52.42 (SD 13.71), alongside extreme perceived stress from family problems at 29.11 (SD 20.78) and work or study problems at 10.93 (SD 15.84) (all P < 0.001). In direct contrast, the Well Adapted Healthy group maintained optimal mental well-being and reported the lowest corresponding anxiety and depression indicators.
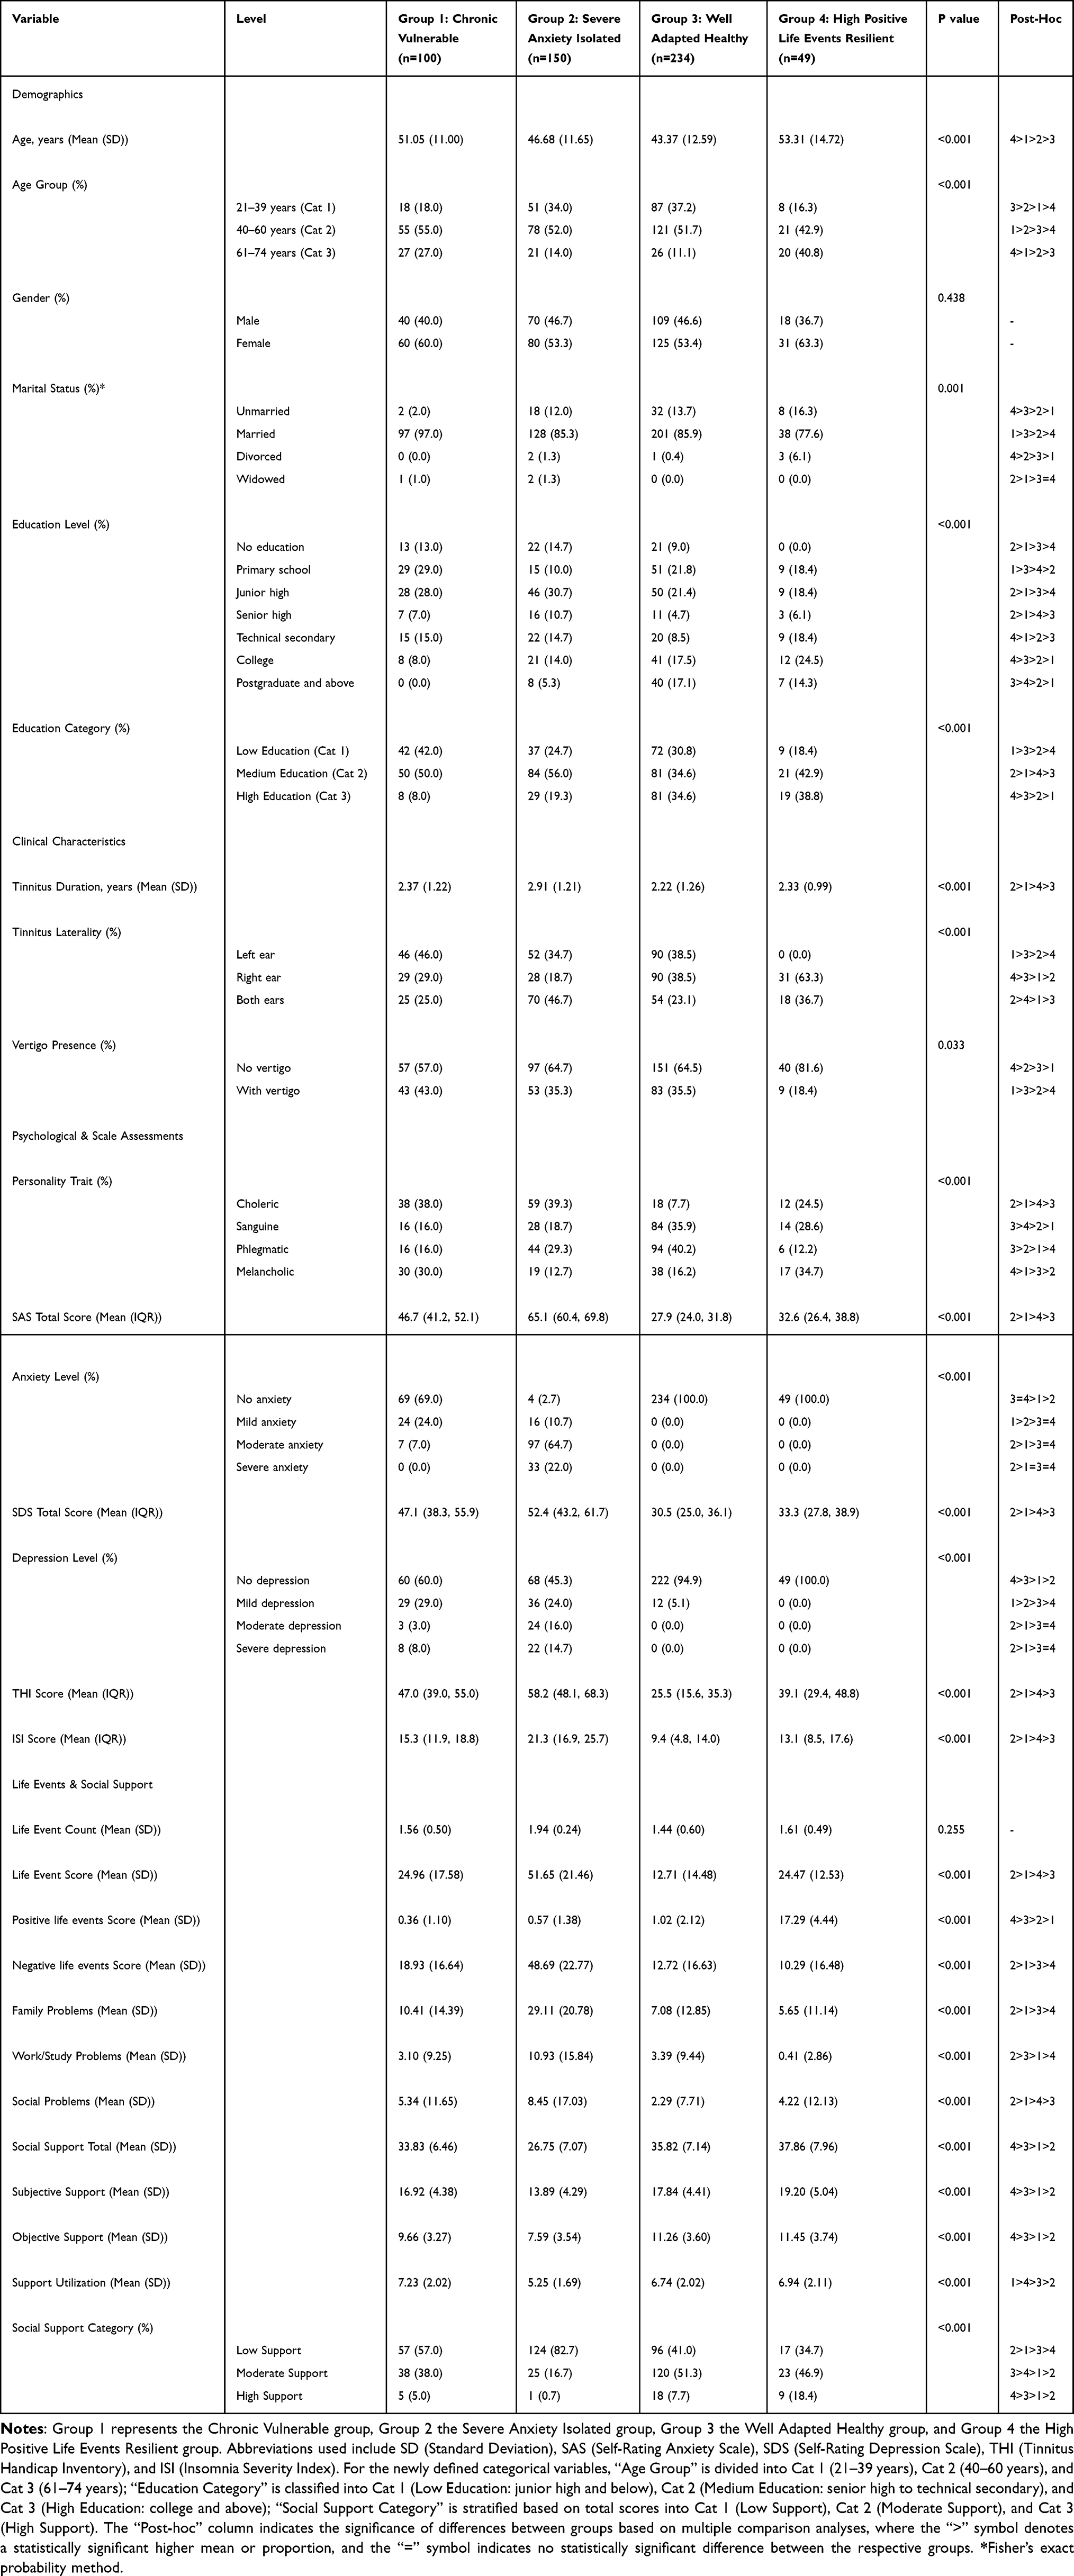 |
Table 2 Baseline Characteristics of Study Participants by Latent Class Subgroups |
Independent Predictive Value of Psychosocial Subtypes for THI
Prior to model fitting, all premise assumptions of linear regression were verified: all VIF values of independent variables in the fully adjusted model were <3, indicating no significant multicollinearity; the Shapiro–Wilk test confirmed the normal distribution of residuals (P = 0.237); and the Breusch-Pagan test verified the homogeneity of residual variance (P = 0.312).
As visually presented in Figure 3, the core clinical outcomes of insomnia severity and tinnitus handicap exhibited highly significant gradients across the four psychosocial latent classes, with indicated intergroup comparisons reaching statistical significance at P < 0.001. Specifically, the Severe Anxiety Isolated phenotype endured the most profound clinical burden, recording the highest overall scores on both the Insomnia Severity Index and the Tinnitus Handicap Inventory, whereas the Well Adapted Healthy phenotype consistently demonstrated the mildest symptom severity.
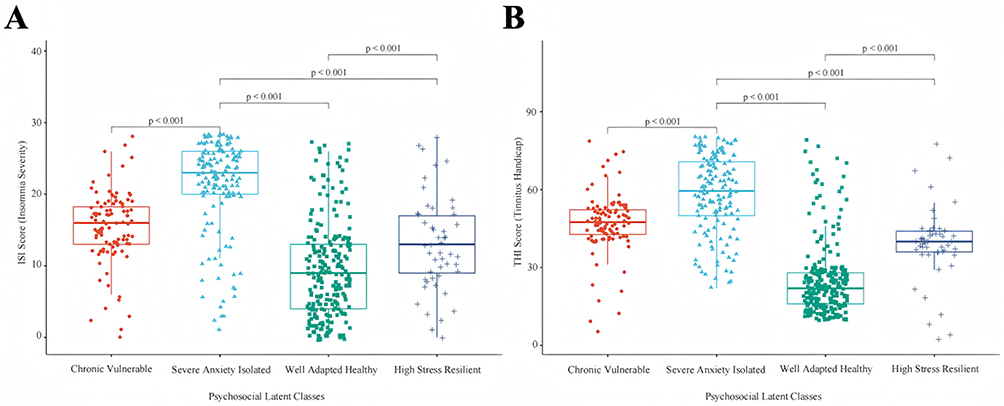 |
Figure 3 Validation of insomnia severity and tinnitus handicap across the four psychosocial latent classes. (A) Intergroup comparison of Insomnia Severity Index scores. (B) Intergroup comparison of Tinnitus Handicap Inventory scores. Horizontal lines within the boxes represent medians, and upper/lower whiskers represent 1.5 times the interquartile range. Individual data points are plotted as jitters. Significance levels were determined by the Kruskal–Wallis H-test followed by Dunn’s post-hoc test for pairwise comparisons. All pairs exhibited highly significant differences (p < 0.001). |
To evaluate the independent predictive value of psychosocial subtypes (LPA classes) for tinnitus severity, we constructed hierarchical multiple linear regression models (Table 3). After fully adjusting for demographic and clinical baseline characteristics, including age, gender, tinnitus duration, hearing loss, and vertigo (Model 2), and further incorporating personality traits as confounding factors (Model 3), the LPA classes remained robust independent predictors of the THI score. In the fully adjusted model (Model 3), compared with the Class 3 (Well Adapted Healthy), patients in Class 2 (Severe Anxiety Isolated) exhibited an independent increase of 33.54 in their THI scores (95% CI: 30.33–36.75, P < 0.001). Similarly, the THI scores of patients in Class 1 (Chronic Vulnerable) and Class 4 (High Positive Life Events Resilient) independently and significantly increased by 22.24 (95% CI: 18.62–25.86, P < 0.001) and 13.64 (95% CI: 8.97–18.31, P < 0.001), respectively.
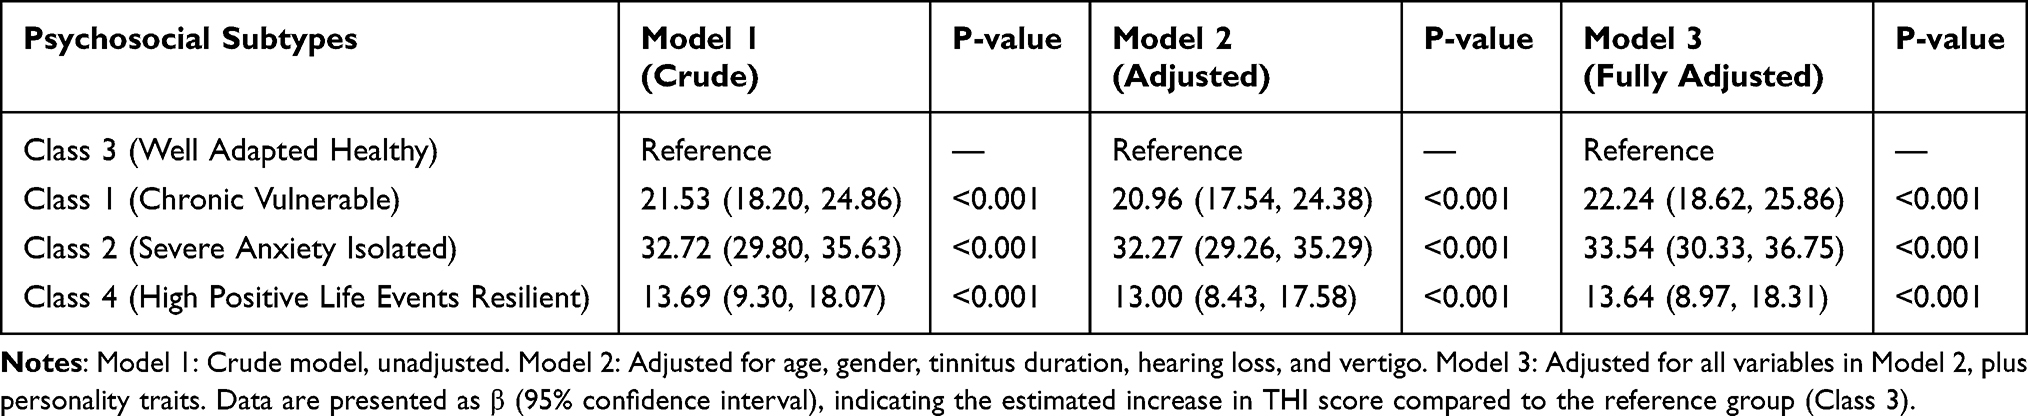 |
Table 3 Independent Association Between Psychosocial Subtypes (LPA Classes) and Tinnitus Severity |
Construction and Efficacy Evaluation of a Nomogram for Predicting High-Risk Subtypes
To elucidate the independent clinical and psychological factors associated with membership in the Class 2 Severe Anxiety Isolated phenotype, candidate variables were subjected to multivariable logistic regression analysis, with Class 2 membership coded as the binary dependent outcome. In this context, odds ratios below 1 were interpreted as indicating lower odds of belonging to the Class 2 Severe Anxiety Isolated phenotype, whereas odds ratios above 1 were interpreted as indicating higher odds of belonging to this high-distress phenotype. Following a backward stepwise selection process based on the Akaike Information Criterion, five variables emerged as the optimal subset of independent predictors: age group, tinnitus duration, presence of vertigo, tinnitus laterality, and specific personality traits (Table 4). Compared with patients aged 21–39 years, patients aged 40–60 years and 61–74 years had significantly lower odds of belonging to the Class 2 Severe Anxiety Isolated phenotype, with odds ratios of 0.254 (95% CI: 0.132–0.479) and 0.190 (95% CI: 0.082–0.425), respectively. Conversely, longer tinnitus duration was associated with higher odds of belonging to the Class 2 Severe Anxiety Isolated phenotype (OR: 1.262, 95% CI: 1.157–1.411), as was the concurrent presence of vertigo (OR: 1.599, 95% CI: 1.073–2.641). Regarding tinnitus laterality, bilateral tinnitus was associated with higher odds of Class 2 membership compared with unilateral left-sided tinnitus (OR: 2.254, 95% CI: 1.279–4.016), whereas right-sided tinnitus was associated with lower odds of belonging to Class 2 (OR: 0.318, 95% CI: 0.174–0.568). Notably, personality traits demonstrated substantial predictive value. Compared with a phlegmatic temperament, a choleric temperament was associated with markedly higher odds of belonging to the Class 2 Severe Anxiety Isolated phenotype (OR: 4.628, 95% CI: 2.328–9.429).
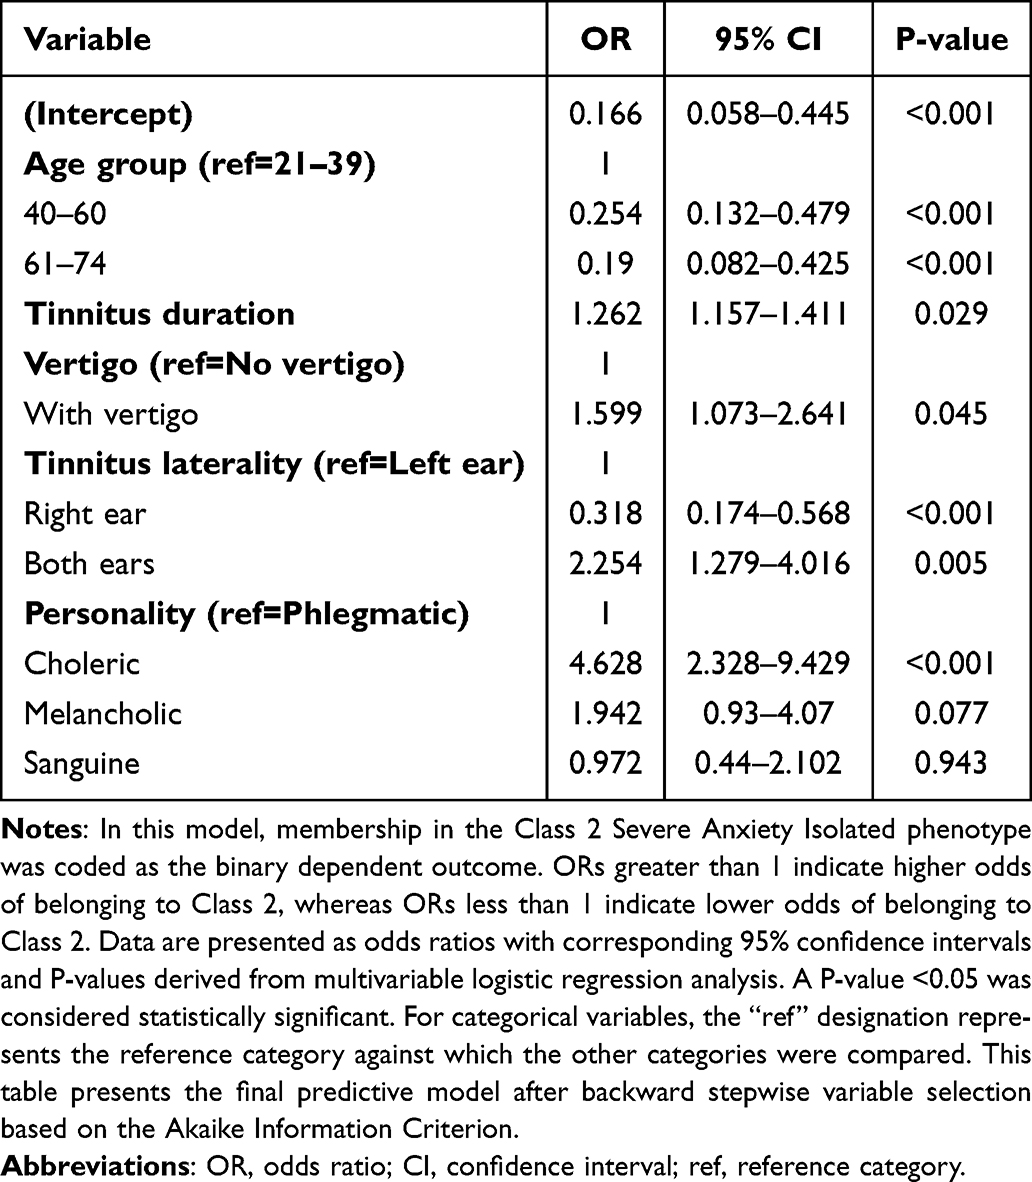 |
Table 4 Multivariate Logistic Regression Analysis of Class2 |
Based on these five identified independent prognostic factors, a clinical prediction nomogram was constructed to visualize and quantify the individualized risk of developing the Severe Anxiety Isolated phenotype (Figure 4). Within this scoring system, each predictor corresponds to a specific point value on a primary axis ranging from 0 to 100 based on its regression coefficient. Consistent with the multivariable analysis, bilateral tinnitus and a choleric temperament dictate the highest individual scores approaching 100 points, while the youngest age category contributes approximately 80 points. By summing the points across all five variables, clinicians can locate a total score on a secondary axis ranging from 0 to 300, which directly translates to a predicted incidence probability between 10% and 70%. For instance, a highly vulnerable clinical profile comprising a young adult aged 21 to 39 years with a prolonged tinnitus duration, concurrent vertigo, bilateral symptoms, and a choleric temperament would accumulate a cumulative score of approximately 280 points, yielding a predicted high-risk probability of nearly 70%. In stark contrast, a patient presenting with an optimal protective profile such as being older with no vertigo and possessing a baseline phlegmatic disposition would score near zero, corresponding to a baseline risk probability of approximately 10%.
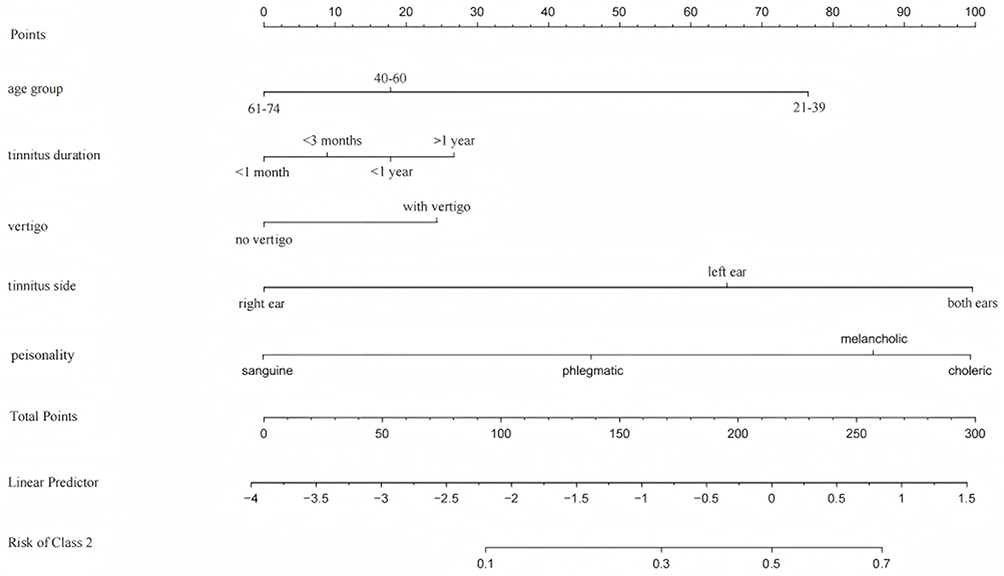 |
Figure 4 Visualized nomogram model for predicting Class 2 membership (Severe Anxiety Isolated phenotype). The nomogram integrates five independent risk factors: age group, tinnitus duration, vertigo, Tinnitus laterality, and personality trait. To utilize this tool, locate a patient’s specific value for each predictor and draw a vertical line upwards to the “Points” axis to assign a score. The scores for all predictors are summed to obtain the “Total Points”. Finally, draw a vertical line down from the total points through the “Linear Predictor” to the “Risk of Class 2” axis to determine the individualized probability of belonging to the Severe Anxiety Isolated class. |
Furthermore, the established nomogram demonstrated robust predictive performance. ROC analysis yielded an AUC of 0.756 in the training set and 0.737 in the independent testing set (Supplementary Figure 1). Based on the optimal balance of Youden’s index, the predicted probability cut-off was determined to be approximately 34.2%, providing a sensitivity of 72.6% and a specificity of 71.4%. Calibration curves confirmed excellent agreement between predicted and observed probabilities, with a minimal mean absolute error of 0.033 (Supplementary Figure 2). Finally, DCA demonstrated that utilizing this nomogram yields a superior net clinical benefit across a wide threshold probability range (approximately 1% to 65%) compared to “treat-all” or “treat-none” strategies (Supplementary Figure 3), firmly establishing its pragmatic value for early risk stratification.
Discussion
To elucidate the psychosocial heterogeneity among patients with subjective tinnitus, this study applied a person-centered latent profile analysis to identify distinct patient phenotypes. Guided by the biopsychosocial model, our profiling of 534 patients identified four distinct psychosocial phenotypes encompassing the Chronic Vulnerable, Severe Anxiety Isolated, Well Adapted Healthy, and High Positive Life Events Resilient groups. Consistent with our hypothesis, the findings indicated that the subjective severity of tinnitus and accompanying insomnia were significantly associated with these underlying psychosocial configurations. The Severe Anxiety Isolated phenotype emerged as the most vulnerable cohort, exhibiting the highest clinical burden characterized by severe anxiety and depressive symptoms alongside low social support. To translate these subtyping findings into clinical practice, we developed and internally validated a predictive nomogram. This tool estimates the individual probability of developing the Severe Anxiety Isolated phenotype using five readily accessible outpatient indicators encompassing age, tinnitus duration, vertigo, symptom laterality, and personality traits, thereby providing an objective reference for early identification and targeted intervention.
This study identified four different psychosocial phenotypes, including Chronic Vulnerable phenotype, Severe Anxiety Isolated phenotype, Well Adapted Healthy, and High Positive Life Events Resilient populations, indicating that tinnitus distress is formed by a complex interaction of emotional states, life events, and social resources, rather than just auditory symptoms. It is particularly worth noting the stark contrast between the Severe Anxiety Isolated cohort and the High Positive Life Events Resilient group. Patients in the Severe Anxiety Isolated cohort faced high negative life stress and reported the lowest levels of social support, which corresponded with the most severe tinnitus handicap and insomnia. Conversely, patients in the High Positive Life Events Resilient phenotype experienced significant life stressors but maintained normal psychological well-being and much lower tinnitus severity. This stark difference highlights the crucial buffering role of social support in the pathway of tinnitus disability.28,29 However, an alternative explanation should also be considered: the High Positive Life Events Resilient phenotype showed a higher positive life-event score, and such positive experiences may have contributed to more adaptive coping, better emotional appraisal, or greater perceived resilience, thereby partly explaining their relatively favorable psychological outcomes.
For instance, a qualitative evaluation of peer interaction demonstrated that fostering social connectedness and a shared identity significantly build psychological resilience against tinnitus-related distress.30 Furthermore, a recent structural equation modeling study confirmed that social support indirectly alleviates tinnitus handicap through the full mediating effects of fostering positive psychological qualities, specifically resilience and self-esteem.14 The resilient patients actively utilized their high levels of subjective and objective support to cope with external pressures.14 Psychological stress theories suggest that effective social networks provide both emotional comfort and practical assistance, which helps prevent patients from developing catastrophic thoughts about their symptoms.31 When these social buffering mechanisms are absent, as observed in the isolated cohort, patients are left highly vulnerable to a vicious cycle where unmanaged daily stress and anxiety directly amplify the perceived severity of their tinnitus.31 Consequently, clinical management of subjective tinnitus should prioritize the evaluation of patients’ social support systems to facilitate early risk stratification and targeted psychosocial interventions. Furthermore, it is crucial to recognize that the “Severe Anxiety Isolated” phenotype comprises approximately 28% of our study cohort. While not a “rare” subpopulation, this substantial prevalence accurately reflects the epidemiological reality of chronic tinnitus, where severe psychiatric comorbidities are highly prevalent. Nevertheless, this proportion should be interpreted in the context of an outpatient, help-seeking clinical sample rather than as a general-population prevalence estimate, because patients attending specialist tinnitus clinics are more likely to have greater symptom burden and psychological distress than community-based individuals with tinnitus.32
From a public health and health economics perspective, identifying a high-risk cohort of this magnitude is of paramount clinical importance. Because this group accounts for a disproportionately large share of tinnitus-related disability and healthcare utilization, utilizing our nomogram to efficiently screen this substantial 28% of vulnerable patients enables the targeted allocation of intensive psychological resources where they are most urgently needed.
To translate these psychosocial profiles into clinical utility, our nomogram identified five independent risk factors driving patients toward the Severe Anxiety Isolated phenotype, revealing several critical mechanistic pathways. Intriguingly, our study demonstrated that the youngest patient cohort, aged 21 to 39 years, exhibited a significantly higher risk compared to older populations. This finding fundamentally subverts the traditional clinical assumption that older age inherently correlates with greater tinnitus severity. Younger individuals typically navigate intense occupational and familial pressures, making them exceptionally vulnerable to the profound sense of lost control induced by a chronic symptom. A previous study indicated that younger working-age tinnitus patients frequently report higher levels of catastrophic thinking and severe occupational interference, which rapidly deplete their psychological resilience.33 Alongside prolonged tinnitus duration acting as a cumulative chronicity stressor, specific somatic symptom profiles, including bilateral tinnitus and the concurrent presence of vertigo, emerged as potent predictors. The simultaneous burden of bilateral auditory hyperstimulation and vestibular dysfunction profoundly exacerbates perceptual overload within the central nervous system.34 Related research has shown that such multimodal sensory disturbances compromise spatial orientation and cognitive processing, significantly amplifying the subjective sense of physical destabilization and triggering acute anxiety responses.35 Finally, maladaptive psychological traits, specifically an irritable or easily agitated personality, demonstrated the strongest predictive value in our model. These neurotic dispositions inherently predispose patients to emotional hyperarousal. Neuroscientific studies have demonstrated that such traits facilitate the pathological overactivation of the limbic system, effectively trapping the patient in a vicious negative feedback loop where emotional distress continuously amplifies the perceived intensity of the auditory signal.36
It is essential to distinguish between stable characteristics and acute clinical presentations in our model. While the nomogram incorporates stable, standardized personality traits as core predictors, the LPA-derived phenotypes are based on indicators of acute anxiety, depression, and recent life events. In this framework, personality traits may represent a relatively stable baseline disposition or vulnerability, whereas anxiety and depressive symptoms capture the patient’s current acute distress state during the clinical encounter. Consequently, these phenotypes primarily reflect a highly distressing, transient psychosocial “state” at the time of the initial clinical encounter, rather than an enduring disease trajectory. However, from a clinical perspective, this distinction does not diminish the model’s utility. Even if a severe distress profile is exacerbated by recent adverse events or acute mood fluctuations, this acute psychological burden significantly amplifies tinnitus-related disability. By utilizing the nomogram to stratify patients based on their current acute state, clinicians can implement immediate, targeted interventions (eg., crisis intervention, acute stress management, or cognitive behavioral therapy) precisely when the patients are most vulnerable.
Our findings are consistent with and extend previous efforts to subtype tinnitus patients and develop individualized prediction tools. Niemann et al identified distinct chronic tinnitus phenotypes using questionnaire-based cluster analysis and emphasized the value of visualizing subgroup characteristics for stratified management.37 Similarly, Hobeika et al developed predictive models for tinnitus presence and severity and demonstrated that psychological and behavioral factors, including mood, neuroticism, and sleep, were particularly important for tinnitus severity and progression.38 Building on this literature, our study extends tinnitus phenotyping by focusing specifically on multidimensional psychosocial profiles and translating the high-distress phenotype into a practical nomogram for outpatient risk stratification. Beyond elucidating the underlying psychosocial mechanisms, the ultimate objective of this study is to facilitate actionable clinical translation through the developed nomogram. Historically, the clinical evaluation of tinnitus has been predominantly confined to pure audiological assessments, which frequently fail to capture the profound psychological dimensions that dictate actual disease severity. Our predictive model empowers clinicians to transcend these traditional diagnostic limitations by providing a highly pragmatic and time-efficient screening tool tailored for fast-paced outpatient environments. Rather than relying entirely on cumbersome psychological batteries for initial triage, otolaryngologists can utilize this visual nomogram to rapidly synthesize minimalist, routinely collected indicators encompassing patient age, tinnitus duration, symptom laterality, concurrent vertigo, and basic personality traits. By seamlessly translating these accessible clinical variables into a quantified probability of developing the high-burden Severe Anxiety Isolated phenotype, the tool facilitates immediate and objective risk stratification. Consequently, clinicians can proactively identify highly vulnerable individuals at the earliest stage and promptly integrate targeted multidisciplinary interventions, such as early psychiatric consultation or customized cognitive behavioral therapy, long before a catastrophic psychological crisis occurs. Ultimately, the routine application of this predictive framework represents a critical step toward actualizing genuine precision medicine in tinnitus care, ensuring that therapeutic resources are efficiently allocated based on multidimensional individual risk profiles rather than isolated acoustic symptoms.
Study Limitations
Methodologically, the major strength of our study lies in utilizing advanced latent profile analysis to transcend traditional purely audiological paradigms and avoid reliance on generalized average effects, thereby systematically revealing hidden psychosocial phenotypes. Furthermore, the robustness of these models is deeply rooted in the high quality of our clinical cohort, which underwent strict quality control to minimize data noise and bias. Clinically, transforming these comprehensive indicators into an intuitive nomogram ensures our findings are not merely theoretically robust but directly translatable into rapid risk-screening tools for routine outpatient practice.
Nevertheless, several limitations should be acknowledged. First, the cross-sectional design limits our ability to establish definitive causal relationships, meaning that the identified profiles likely reflect patients’ current psychosocial states rather than enduring traits, which highlights the value of future longitudinal validations. Second, the inclusion of participants exclusively from outpatient departments suggests a help-seeking population, which may introduce selection bias and mean our findings might not fully represent individuals with similar psychological profiles who do not seek clinical care. Third, while our sample size is methodologically adequate for mixture modeling, extracting a relatively small sub-phenotype using seven continuous indicators within a single-center cohort may slightly constrain statistical stability and the external generalizability of these predictions requires further validation in larger multicenter cohorts. Fourth, relying on self-report measures introduces subjective bias, particularly potential recall or memory bias when participants report historical life events, which may affect the precise quantification of these stressors. Fifth, although the Eysenck Personality Questionnaire is a well validated instrument, its classification into four temperament types represents a simplified typology that may not capture the full dimensional variability of extraversion and neuroticism so future studies could examine continuous personality dimensions or alternative models. Finally, although we could not account for all potential unmeasured covariates, we effectively mitigated this by systematically incorporating a comprehensive array of sociodemographic, clinical, and psychological indicators into our robust models.
Conclusions
In summary, we investigated the psychosocial phenotypes of tinnitus patients using the LPA. The findings indicated that the subjective severity of tinnitus and accompanying insomnia were significantly associated with these underlying psychosocial configurations. Specifically, the Severe Anxiety Isolated phenotype was associated with the greatest disease burden and the most severe sleep impairment, whereas the High Positive Life Events Resilient phenotype exhibited a relatively stable and healthy mental state along with a lower tinnitus-related burden. These findings highlight the mediating role of social support and emotional status in the clinical course of tinnitus, suggesting that psychosocial assessment should be integrated into the routine protocol of comprehensive tinnitus management in clinical practice.
Abbreviations
AIC, Akaike Information Criterion; AUC, Area Under the Curve; ANOVA, Analysis of Variance; BIC, Bayesian Information Criterion; CIs, Confidence Intervals; DCA, Decision Curve Analysis; EPQ, Eysenck Personality Questionnaire; ISI, Insomnia Severity Index; LES, Life Events Scale; LPA, Latent Profile Analysis; ORs, Odds Ratios; ROC, Receiver Operating Characteristic; SAS, Self-Rating Anxiety Scale; SDS, Self-Rating Depression Scale; SSRS, Social Support Rating Scale; THI, Tinnitus Handicap Inventory.
Data Sharing Statement
The data that support the findings of this study are available from the corresponding author, Fang Liu, upon reasonable request.
Acknowledgments
Yan’an University Affiliated Hospital and all patients’ support for this project. This work was supported by the Xi’an Science and Technology Plan Project (No. 24YXYJ0166) and Demonstration Project for Public Hospital Reform and High-Quality Development.
Author Contributions
All authors made a significant contribution to the work reported, whether that is in the conception, study design, execution, acquisition of data, analysis and interpretation, or in all these areas; took part in drafting, revising or critically reviewing the article; gave final approval of the version to be published; have agreed on the journal to which the article has been submitted; and agree to be accountable for all aspects of the work.
Disclosure
The authors declare that they have no competing interests.
References
1. Baguley D, McFerran D, Hall D. Tinnitus. Lancet. 2013;382:1600–18. doi:10.1016/S0140-6736(13)60142-7
2. Jarach CM, Lugo A, Scala M, et al. Global prevalence and incidence of tinnitus: a systematic review and meta-analysis. JAMA Neurol. 2022;79:888–900. doi:10.1001/jamaneurol.2022.2189
3. Sherlock LP, Ballard-Hernandez J, Boudin-George A, et al. Clinical practice guideline for management of tinnitus: recommendations from the US VA/DOD clinical practice guideline work group. JAMA Otolaryngol Head Neck Surg. 2025;151:513–520. doi:10.1001/jamaoto.2025.0052
4. Huppert D, Gerb J, Filippopulos F. Tinnitus: well known in antiquity, highly relevant today. J Neurol. 2026;273:142. doi:10.1007/s00415-026-13650-2
5. Icoz Ö, Sendesen E. Investigation of mental fatigue in individuals with tinnitus. Laryngoscope. 2026;136:1487–1494. doi:10.1002/lary.70198
6. Jiang Y, Liu Q, Ding Y, Sun Y. Systematic review and meta-analysis of the correlation between tinnitus and mental health. Am J Otolaryngol. 2025;46:104611. doi:10.1016/j.amjoto.2025.104611
7. Boecking B, Steinmetzger K, Brueggemann P, Rose M, Mazurek B. Transdiagnostic dimensions of psychopathology in chronic tinnitus patients with and without hearing loss. Sci Rep. 2026;16:2618. doi:10.1038/s41598-025-32526-5
8. Elgoyhen AB, Langguth B, De Ridder D, Vanneste S. Tinnitus: perspectives from human neuroimaging. Nat Rev Neurosci. 2015;16:632–642. doi:10.1038/nrn4003
9. Adjamian P, Hall DA, Palmer AR, Allan TW, Langers DRM. Neuroanatomical abnormalities in chronic tinnitus in the human brain. Neurosci Biobehav Rev. 2014;45:119–133. doi:10.1016/j.neubiorev.2014.05.013
10. Mazurek B, Böcking B, Dobel C, Rose M, Brüggemann P. Tinnitus and influencing comorbidities. Laryngorhinootologie. 2023;102:S50–S58. doi:10.1055/a-1950-6149
11. Zhang L, Du H, You H. Correlation between the degree of hearing loss and the levels of anxiety and depression in patients with tinnitus. Noise Health. 2023;25:195–201. doi:10.4103/nah.nah_46_23
12. Giliberto G, Palacio MI, Cartocci G, et al. Listening effort and stress in tinnitus: a multidimensional approach. Front Neurosci. 2025;19:1591622. doi:10.3389/fnins.2025.1591622
13. Devos JVP, Janssen MLF, Janssen AML, Hellingman CA, Smit JV. A prospective self-report survey-based cohort study on factors that have an influence on tinnitus. Audiol Res. 2024;14:875–892. doi:10.3390/audiolres14050074
14. Wang X, Qi M, Zeng X, et al. Social support and tinnitus distress: the importance of developing positive psychological qualities in patients with chronic tinnitus. Audiol Neurootol. 2021;26:246–256. doi:10.1159/000511254
15. Rey-Martí A, Sendra-Pons P, Garzón D, Mas-Tur A. A comprehensive conceptual and bibliometric study of person-centered methodologies. Qual Quant. 2022;56:3665–3683. doi:10.1007/s11135-021-01304-6
16. Yuan H, Ma P-W, Chen J-W, et al. Analysis of clinical characteristics and predictive model for effective treatment of tinnitus in patients with transient compound sound therapy. Front Neurol. 2024;15:1515953. doi:10.3389/fneur.2024.1515953
17. Gu D, Wu L, Tang D. Development of a prognostic nomogram for modified tinnitus relieving sound therapy for subjective tinnitus. Otolaryngol Head Neck Surg. 2024;170:1066–1073. doi:10.1002/ohn.611
18. Park SY. Nomogram: an analogue tool to deliver digital knowledge. J Thorac Cardiovasc Surg. 2018;155:1793. doi:10.1016/j.jtcvs.2017.12.107
19. Efthimiou O, Seo M, Chalkou K, Debray T, Egger M, Salanti G. Developing clinical prediction models: a step-by-step guide. BMJ. 2024;386:e078276. doi:10.1136/bmj-2023-078276
20. Zung WW. A rating instrument for anxiety disorders. Psychosomatics. 1971;12:371–379. doi:10.1016/S0033-3182(71)71479-0
21. Zung WW. A self-rating depression scale. Arch Gen Psychiatry. 1965;12:63–70. doi:10.1001/archpsyc.1965.01720310065008
22. Yang D, Zhang Y. Life Event Scale (LES). In: Wang X, Wang X, Ma H, editors. Handbook of Mental Health Rating Scales. Beijing: Chinese Mental Health Journal; 1999:106–110.
23. Eysenck personality questionnaire - mor - major reference works - wiley online library, (n.d.). Available from: https://onlinelibrary.wiley.com/doi/abs/10.1002/9780470479216.corpsy0340.
24. Newman CW, Jacobson GP, Spitzer JB. Development of the tinnitus handicap inventory. Arch Otolaryngol Head Neck Surg. 1996;122:143–148. doi:10.1001/archotol.1996.01890140029007
25. Bastien CH, Vallières A, Morin CM. Validation of the insomnia severity index as an outcome measure for insomnia research. Sleep Med. 2001;2:297–307. doi:10.1016/s1389-9457(00)00065-4
26. Tein J-Y, Coxe S, Cham H. Statistical power to detect the correct number of classes in latent profile analysis. Struct Equation Model. 2013;20:640–657. doi:10.1080/10705511.2013.824781
27. Nylund-Gibson K, Garber AC, Carter DB, et al. Ten frequently asked questions about latent transition analysis. Psychol Methods. 2023;28:284–300. doi:10.1037/met0000486
28. Musleh A, Alharthy AKH, Alzahrani MYM, et al. Psychological impact and quality of life in adults with tinnitus: a Cross-Sectional Study. Cureus. 2024;16:e51976. doi:10.7759/cureus.51976
29. Mancini PC, Tyler RS, Smith S, Ji H, Perreau A, Mohr A-M. Tinnitus: how partners can help? Am J Audiol. 2019;28:85–94. doi:10.1044/2018_AJA-18-0046
30. Pryce H, Moutela T, Bunker C, Shaw R. Tinnitus groups: a model of social support and social connectedness from peer interaction. Br J Health Psychol. 2019;24:913–930. doi:10.1111/bjhp.12386
31. Cima RFF, Crombez G, Vlaeyen JWS. Catastrophizing and fear of tinnitus predict quality of life in patients with chronic tinnitus. Ear Hear. 2011;32:634–641. doi:10.1097/AUD.0b013e31821106dd
32. Rademaker MM, Stegeman I, Brabers AEM, De Jong JD, Stokroos RJ, Smit AL. Differences in characteristics between people with tinnitus that seek help and that do not. Sci Rep. 2021;11:22949. doi:10.1038/s41598-021-01632-5
33. Hackenberg B, Döge J, O’Brien K, et al. Psychosocial work stress, resilience and the risk of tinnitus-results from a Population-Based Cohort Study. Medicina. 2025;61:2079. doi:10.3390/medicina61122079
34. Demarquay G, Mauguière F. Central nervous system underpinnings of sensory hypersensitivity in migraine: insights from neuroimaging and electrophysiological studies. Headache. 2016;56:1418–1438. doi:10.1111/head.12651
35. Shoham N, Lewis G, McManus S, Cooper C. Common mental illness in people with sensory impairment: results from the 2014 adult psychiatric morbidity survey. BJPsych Open. 2019;5:e94. doi:10.1192/bjo.2019.81
36. Rauschecker JP, Leaver AM, Mühlau M. Tuning out the noise: limbic-auditory interactions in tinnitus. Neuron. 2010;66:819–826. doi:10.1016/j.neuron.2010.04.032
37. Niemann U, Brueggemann P, Boecking B, et al. Phenotyping chronic tinnitus patients using self-report questionnaire data: cluster analysis and visual comparison. Sci Rep. 2020;10:16411. doi:10.1038/s41598-020-73402-8
38. Hobeika L, Fillingim M, Tanguay-Sabourin C, et al. Tinnitus risk factors and its evolution over time. Nat Commun. 2025;16:4244. doi:10.1038/s41467-025-59445-3
 © 2026 The Author(s). This work is published and licensed by Dove Medical Press Limited. The
full terms of this license are available at https://www.dovepress.com/terms
and incorporate the Creative Commons Attribution
- Non Commercial (unported, 4.0) License.
By accessing the work you hereby accept the Terms. Non-commercial uses of the work are permitted
without any further permission from Dove Medical Press Limited, provided the work is properly
attributed. For permission for commercial use of this work, please see paragraphs 4.2 and 5 of our Terms.
© 2026 The Author(s). This work is published and licensed by Dove Medical Press Limited. The
full terms of this license are available at https://www.dovepress.com/terms
and incorporate the Creative Commons Attribution
- Non Commercial (unported, 4.0) License.
By accessing the work you hereby accept the Terms. Non-commercial uses of the work are permitted
without any further permission from Dove Medical Press Limited, provided the work is properly
attributed. For permission for commercial use of this work, please see paragraphs 4.2 and 5 of our Terms.
Recommended articles
Development and Validation of a Nomogram for Predicting Risk of Emergency Department Revisits in Chinese Older Patients
Fan L, Xue H, Wang Q, Yan Y, Du W
Risk Management and Healthcare Policy 2022, 15:2283-2295
Published Date: 6 December 2022
Coping Profiles and Differences in Psychological Distress and Quality of Life in Clients Undergoing Assisted Reproductive Techniques: A Latent Profile Analysis
Bai J, Zheng J, Guo N, Dong Y, Wang K, Cheng C, Jiang H, Qian L
Journal of Multidisciplinary Healthcare 2024, 17:533-540
Published Date: 5 February 2024
Integrated SIRI and Lipid Profile for Early Prediction of Bloodstream Infection in AML During Induction Chemotherapy
Luo G, Zeng S, Zhao H
Infection and Drug Resistance 2025, 18:6979-6990
Published Date: 27 December 2025
Development of a Risk Prediction Model for Preoperative Pre-Frailty in Elderly Patients with Gastric Cancer
Yin C, Yin M, Zhen J, Xue C, Zhu Z
Clinical Interventions in Aging 2025, 20:2763-2772
Published Date: 28 December 2025
Machine Learning Analysis of Risk Factors for Catheter-Associated Urinary Tract Infections in Stroke Patients and Their Impact on Healthcare Quality
Lu L, Li X, Cai D, Mei C, Hong X, Xie J
International Journal of General Medicine 2026, 19:591432
Published Date: 8 April 2026