Back to Journals » Diabetes, Metabolic Syndrome and Obesity » Volume 18
Development and Validation of a Nomogram-Based Risk Prediction Model for Diabetic Retinopathy in Elderly Adults with Type 2 Diabetes Mellitus
Authors Chen M, Niu T, Sun Y, Chang M, Liu S, Xu T, Cui H ![]()
Received 28 April 2025
Accepted for publication 7 July 2025
Published 25 July 2025 Volume 2025:18 Pages 2509—2523
DOI https://doi.org/10.2147/DMSO.S530424
Checked for plagiarism Yes
Review by Single anonymous peer review
Peer reviewer comments 2
Editor who approved publication: Dr Rebecca Baqiyyah Conway
Meitong Chen,1,2 Tongtong Niu,2 Yan Sun,2 Meisong Chang,2 Shanshan Liu,2 Tiantian Xu,2 Huixia Cui3
1School of Nursing, Jinzhou Medical University, Jinzhou, Liaoning Province, 121001, People’s Republic of China; 2Department of Ophthalmology, Shenyang Fourth People’s Hospital, Shenyang, Liaoning Province, 11000, People’s Republic of China; 3School of Nursing, Wannan Medical College, Wuhu City, Anhui Province, 241002, People’s Republic of China
Correspondence: Huixia Cui, School of Nursing, Wannan Medical College, No. 22 Wenchang West Road, Higher Education Park, Wuhu City, Anhui Province, 241002, People’s Republic of China, Email [email protected]
Purpose: Diabetic retinopathy (DR) is a significant comorbidity with Type 2 Diabetes Mellitus (T2DM), however, risk prediction for DR remains understudied in the elderly population. This study aimed to develop and validate a nomogram for identifying individuals at high risk of DR among elderly T2DM patients to guide early clinical intervention.
Patients and Methods: A retrospective cohort of 1912 T2DM patients (aged ≥ 60 years) was enrolled from 2018 to 2024. Sociodemographic, biochemical, and health-related variables were extracted. The cohort was randomly stratified into derivation (70%) and validation (30%) sets. Least Absolute Shrinkage and Selection Operator (LASSO) regression was applied to identify key predictors, followed by multivariate logistic regression to construct the nomogram. Model performance was evaluated via Receiver Operating Characteristic-Area Under the Curve (ROC-AUC), calibration plots, Hosmer–Lemeshow (H-L) tests, and decision curve analysis (DCA). External validation was performed using an independent cohort (n = 476).
Results: Among 1912 patients, 655 (34.3%) were diagnosed with DR. Independent predictors included T2DM duration, glycosylated hemoglobin (HbA1c), platelet-to-lymphocyte ratio (PLR), estimated glomerular filtration rate (eGFR), and neutrophil percentage to albumin ratio (NPAR) (all p < 0.05). The nomogram demonstrated robust discrimination, with AUCs of 0.823 (95% CI: 0.805– 0.851) and 0.808 (95% CI: 0.770– 0.846) in the derivation and internal validation sets, respectively. Calibration plots demonstrated strong agreement between predicted and observed risks (H-L test: p = 0.807 [derivation], p = 0.374 [validation]). DCA indicated favorable clinical utility across threshold probabilities, and external validation confirmed generalizability (AUC=0.788) and readiness for clinical deployment.
Conclusion: This rigorously validated nomogram, integrating clinical accessible variables, provided a pragmatic tool for early DR risk stratification in elderly T2DM patients. Implementation of this model in clinical practice may enable personalized risk mitigation strategies to reduce DR incidence in this vulnerable population.
Keywords: nomogram, predictive model, diabetic retinopathy, elderly adults, T2DM
Introduction
Type 2 diabetes mellitus (T2DM) is a complex metabolic disorder characterized by insulin resistance and impaired insulin secretion. Globally, an estimated 537 million adults were living with diabetes in 2021, of whom 90–95% had T2DM, underscoring its significant public health burden.1 China has witnessed a significant rise in diabetes prevalence, affecting nearly 11% of the adult population, with a substantial proportion remaining undiagnosed.2 Diabetic Retinopathy (DR), a prevalent microvascular complication of diabetes, is a leading cause of vision impairment and blindness worldwide, impacting approximately 30–40% of diabetic individuals.3 Clinically, DR is categorized into two stages: non-proliferative DR (NPDR) and proliferative DR (PDR), distinguished by the presence of retinal neovascularization. While DR is typically asymptomatic in its early stage, delayed treatment can lead to severe vision loss or irreversible blindness.4 Early prediction and detection of DR through effective screening tools are critical to mitigating diabetes-related vision impairment and improving patient quality of life.
DR presents a significant concern among elderly T2DM adults due to the combined effects of aging and prolonged diabetes duration. In 2020, approximately 2.9 million cases of vision impairment among adults ≥ 50 years were attributed to DR.5 It is commonly acknowledged that age-related physiological decline is associated with progressive functional impairment and increased vulnerability to morbidity and mortality, further exacerbating diabetes-related complications.6 Additionally, prior studies have established key risk factors for DR progression, such as gender, poor glycemic control, hypertension, and hyperlipidemia. Despite robust evidence supporting these associations, clinicians often face challenges in systematically integrating the range of relevant biomarkers into targeted clinical decision-making.7 Recent advancements in predictive modeling have enabled risk stratification for DR across diverse diabetic populations, thereby supporting early intervention and personalized management strategies.8–10 However, existing models often fail to adequately address the distinct impact of aging on DR pathogenesis. Consequently, there remains an unmet need for a validated age-specific risk prediction tool to improve early detection and tailored screening strategies for elderly T2DM adults.
The Least Absolute Shrinkage and Selection Operator Regression Model (LASSO) is a machine learning technique that integrates variable selection and regularization to optimize predictive accuracy while maintaining model interpretability. By applying an L1 penalty, LASSO reduces nonessential regression coefficients to zero, thereby retaining only the most clinically relevant predictors and mitigating overfitting. Complementarily, a nomogram serves as a graphical calculator that quantifies the risk of clinical outcomes by incorporating multiple predictors, allowing clinicians to efficiently visualize individualized risk probabilities. Although recent studies have validated LASSO-nomogram frameworks for DR risk prediction in general T2DM populations,11,12 limited evidence exists regarding risk factors specific to elderly adults or the model’s performance in this demographic. To address this gap, this study aimed to develop and validate an interpretable, clinically practical DR risk prediction model by integrating LASSO regression with a nomogram. This dual approach facilitates robust variable selection alongside intuitive risk stratification, offering clinicians a tool to enhance early detection and personalized management of DR in elderly adults with T2DM.
Patients and Methods
Study Design and Participants
A multicenter, retrospective, cross-sectional study was conducted to identify independent risk factors for DR in elderly adults with T2DM. Data from 2388 patients aged ≥60 years with T2DM were extracted from electronic medical records at two tertiary hospitals in Northeast China, spanning the period from 2018 to 2024. The derivation and internal validation cohorts comprised 1912 patients recruited from Shenyang Fourth People’s Hospital (Shenyang, China) between February 2018 and January 2024, divided into derivation (70%) and internal validation (30%) sets through random partitioning. An external validation cohort included 476 patients from the First Affiliated Hospital of Jinzhou Medical University (Jinzhou, China), with data collected between December 2021 and January 2024. Inclusion criteria included: (1) aged ≥60 years; (2) T2DM diagnosis for ≥1 year; (3) completion of a comprehensive ophthalmologic examination, including clear fundus imaging; and (4) availability of clinical and laboratory records. Exclusion criteria included: (1) patients with T1DM or secondary diabetes; (2) history ocular surgeries (eg, cataract extraction, retinal laser therapy); (3) comorbid retinal or optic nerve pathologies (eg, age-related macular degeneration, polypoid choroidal vasculopathy); (4) life-threatening systemic conditions (eg, malignant tumors, end-stage renal disease, severe hepatic impairment, autoimmune diseases); (5) acute diabetic complications (eg, diabetic ketoacidosis, hyperosmolar hyperglycemia syndrome); (6) incomplete clinical data > 10%; or (7) inadequate fundus image quality for definitive DR diagnosis.
Sample Size
Sample size estimation was performed using the “10 events per variable (10 EPV)” rule of thumb:13 The formula was defined as: minimum sample size = number of predictors × 10 EPV/event rate. Preliminary analyses identified 10 candidate predictor variables, and based on an anticipated diabetic retinopathy (DR) incidence of 30.1% in Chinese populations,14 a minimum of 333 participants was required for robust model development and validation. The final cohort included 1912 patients, exceeding this threshold to ensure adequate statistical power for both model construction and internal validation (Figure 1). For external validation, guidelines recommend a minimum of 100 events and 100 non-events for binary outcomes,15 at least 333 participants were required. Accordingly, this requirement was met by enrolling 476 individuals in the external validation cohort (Figure 1).
 |
Figure 1 Study participant flow diagram. Abbreviations: DR, diabetic retinopathy; T1DM, type 1 diabetes mellitus; T2DM, type 2 diabetes mellitus; LASSO, least absolute shrinkage and selection operator; ROC, receiver operating characteristic curve; DCA, decision curve analysis. |
Ethics Statement
This study was approved by the Institutional Review Board of Jinzhou Medical University (IRB approval No. JZMULL2024097, approval data: February 7, 2024) and in accordance with the principles of the Declaration of Helsinki. Informed consent was waived due to the retrospective design of this study. All data were fully anonymized prior to analysis and handled in strict compliance with confidentiality principles. This study adhered to the Transparent Reporting of a Multivariable Prediction Model for Individual Prognosis or Diagnosis (TRIOPD) reporting guidelines.
Diagnosis Criteria of DR
DR, a microvascular complication of chronic hyperglycemia, is characterized by retinal damage that may progress to vision loss if left untreated. Diagnosis was based on the Chinese standards of care for T2DM,16 requiring at least one of the following clinical signs: microaneurysms, intraretinal hemorrhages, hard exudates, cotton wool spots, venous beading or dilation, neovascularization, vitreous hemorrhage, or retinal detachment. All participants underwent standardized ophthalmic evaluations conducted by certified ophthalmologists. Examinations included: (1) visual acuity and diopter measurement via automated optometry; (2) intraocular pressure assessment using non-contact tonometry; (3) external and anterior segment evaluation via slit-lamp biomicroscopy; and (4) retinal imaging through optical coherence tomography and fundus fluorography were employed to supplement slit-lamp biomicroscopy findings, particularly when clinical signs were ambiguous or difficult to interpret solely through slit-lamp biomicroscopy. If imaging of one eye was deemed uninterpretable, diagnostic conclusions were drawn from the evaluable eye.
Data Collection
Patients’ demographics, clinical information, and health-related parameters were retrospectively extracted from electronic medical records. Demographical variables included age (≥ 60 years old), gender (male and female), body mass index (BMI, kg/m2), residence location (urban/rural), current smoking status (no/yes), alcohol consumption (no/yes), T2DM duration (years), T2DM treatment regimen (diet control/oral anti-diabetes drugs/insulin injection/oral agents with insulin injection), family history of T2DM (no/yes), systolic blood pressure (SBP), and diastolic blood pressure (DBP). Comorbidities comprised hypertension, hyperlipidemia (defined as triglycerides [TG] ≥ 1.7 mmol/L, total cholesterol [TC] ≥ 5.2 mmol/L, low-density lipoprotein cholesterol [LDL-C] ≥ 3.4 mmol/L, high-density lipoprotein cholesterol [HDL-C] ≤ 1.0 mmol/L in males and ≤ 1.3 mmol/L in females, or use of cholesterol-lowering medications),17 cancer, cardiovascular diseases (CVD), osteoporosis, stroke, diabetic peripheral neuropathy (DPN), diabetic nephropathy (DN), diabetic foot ulcer (DFU). Fasting laboratory measurements included fasting blood glucose (FBG) levels, hemoglobin (HGB), glycated hemoglobin (HbA1c), TC, TG, aspartate aminotransferase (AST), alanine aminotransferase (ALT), total bilirubin (TBIL), serum creatinine (Scr), serum cystatin C (SCysC), albumin (ALB), HDL-C, LDL-C, uric acid (UA), blood urea nitrogen (BUN), high sensitivity C-reactive protein (Hs-CRP), neutrophil percentage (%), while blood cell counts (WBC, ×109/L), monocyte counts (×109/L), platelet counts (×109/L), neutrophil counts (×109/L), and lymphocyte counts (×109/L). Monocyte-to-lymphocyte ratio (MLR), platelet-to-lymphocyte ratio (PLR), neutrophil-to-lymphocyte ratio (NLR), neutrophil percentage-to-albumin levels (NPAR) were measured in the same blood samples. The estimated glomerular filtration rate (eGFR) was calculated using the Chronic Kidney Disease Epidemiology Collaboration (CKD-EPI) Creatinine- Cystatin C equation:18 eGFR = 135 × min (Scr/κ, 1)α × max (Scr/κ, 1)−0.544 × min (Scys/0.8, 1)−0.323 × max (Scys/0.8, 1)−0.778 × 0.9961Age × 0.963 (if female), where κ = 0.7 for females and 0.9 for males; α = −0.219 for females and −0.144 for males.
Statistical Analysis
Statistical analyses were conducted using SPSS version 23.0 (IBM Corp., New York, NY, USA) and R4.4.2 (R foundation for Statistical Computing, Vienna, Austria). Continuous variables were described using median with interquartile range (IQR), and group comparisons were assessed via the Mann–Whitney U-test (for two groups) or the Kruskal–Wallis test (for three groups). Categorical data were expressed as frequencies and percentage (%), with differences evaluated using Pearson’s Chi-squared test or Fisher’s exact test. A p-value of < 0.05 (two-tailed) was considered statistically significant. Missing data were addressed using the multiple imputation method in SPSS.
The LASSO regression model using the “glmnet” package in R was performed to identify optimal predictors of DR. To determine the penalization parameter (λ) that balances model parsimony and predictive accuracy, a 10-fold cross-validation utilizing the 1-standard error (1-SE) rule was applied in the derivation cohort. This approach minimizes overfitting by selectively shrinking the coefficients of redundant variables to zero, thereby retaining only the most contributive features. Variables selected through LASSO regression were subsequently included in a multivariate logistic regression analysis (using the “rms” package in R) to establish independent predictors of DR. Adjusted odds ratios (ORs) with corresponding 95% confidence intervals (CIs) were computed to quantify the strength of associations. A nomogram (using the “rms” and “regplot” packages in R) was then constructed to estimate individualized probabilities of DR occurrence in elderly patients with T2DM by incorporating the final set of significant predictors.
Model discrimination was evaluated using the receiver operating characteristic (ROC) curve and the area under the curve (AUC) (using the “pROC” package in R), where values closer to 1.0 indicate superior predictive performance. Calibration accuracy, reflecting the agreement between predicted probabilities and observed outcomes, was assessed via calibration plots (using the “calibrate” package in R) and the Hosmer-Lemeshow (H-L) test (using the “HLtest,R” source in R). In calibration plots, the y-axis represents observed probabilities, while the x-axis represents predicted probabilities, proximity of plotted points to the 45-degree reference line signifies strong calibration. For the H-L test, a non-significant result (p > 0.05) indicates an adequate model fit. Clinical utility was evaluated using decision curve analysis (DCA) (using the “rmda” package in R), wherein the net benefit (y-axis) quantifies the clinical value of the model across threshold probabilities (x-axis)—the likelihood at which clinicians would initiate interventions. The DCA curve was compared against the treat-all and treat-none strategies; a curve above these reference lines signifies a superior net benefit at specific thresholds.19
Results
Baseline Characteristics of the Study Population
This study included a cohort of 1912 eligible elderly adults with T2DM for model development. Participants had a median age of 67.0 years (63.0, 72.0) and comprised 1023 males (53.5%) and 889 females (46.5%). DR was diagnosed in 34.3% (655/1912) of the cohort (Table 1). Patients were randomly allocated to derivation (n = 1340, including 458 DR cases) and internal validation (n = 572, including 197 DR cases) cohorts. Baseline demographic, clinical, and laboratory characteristics were comparable between the derivation and internal validation cohorts, with no statistically significant differences observed (all p > 0.05, Table 1).
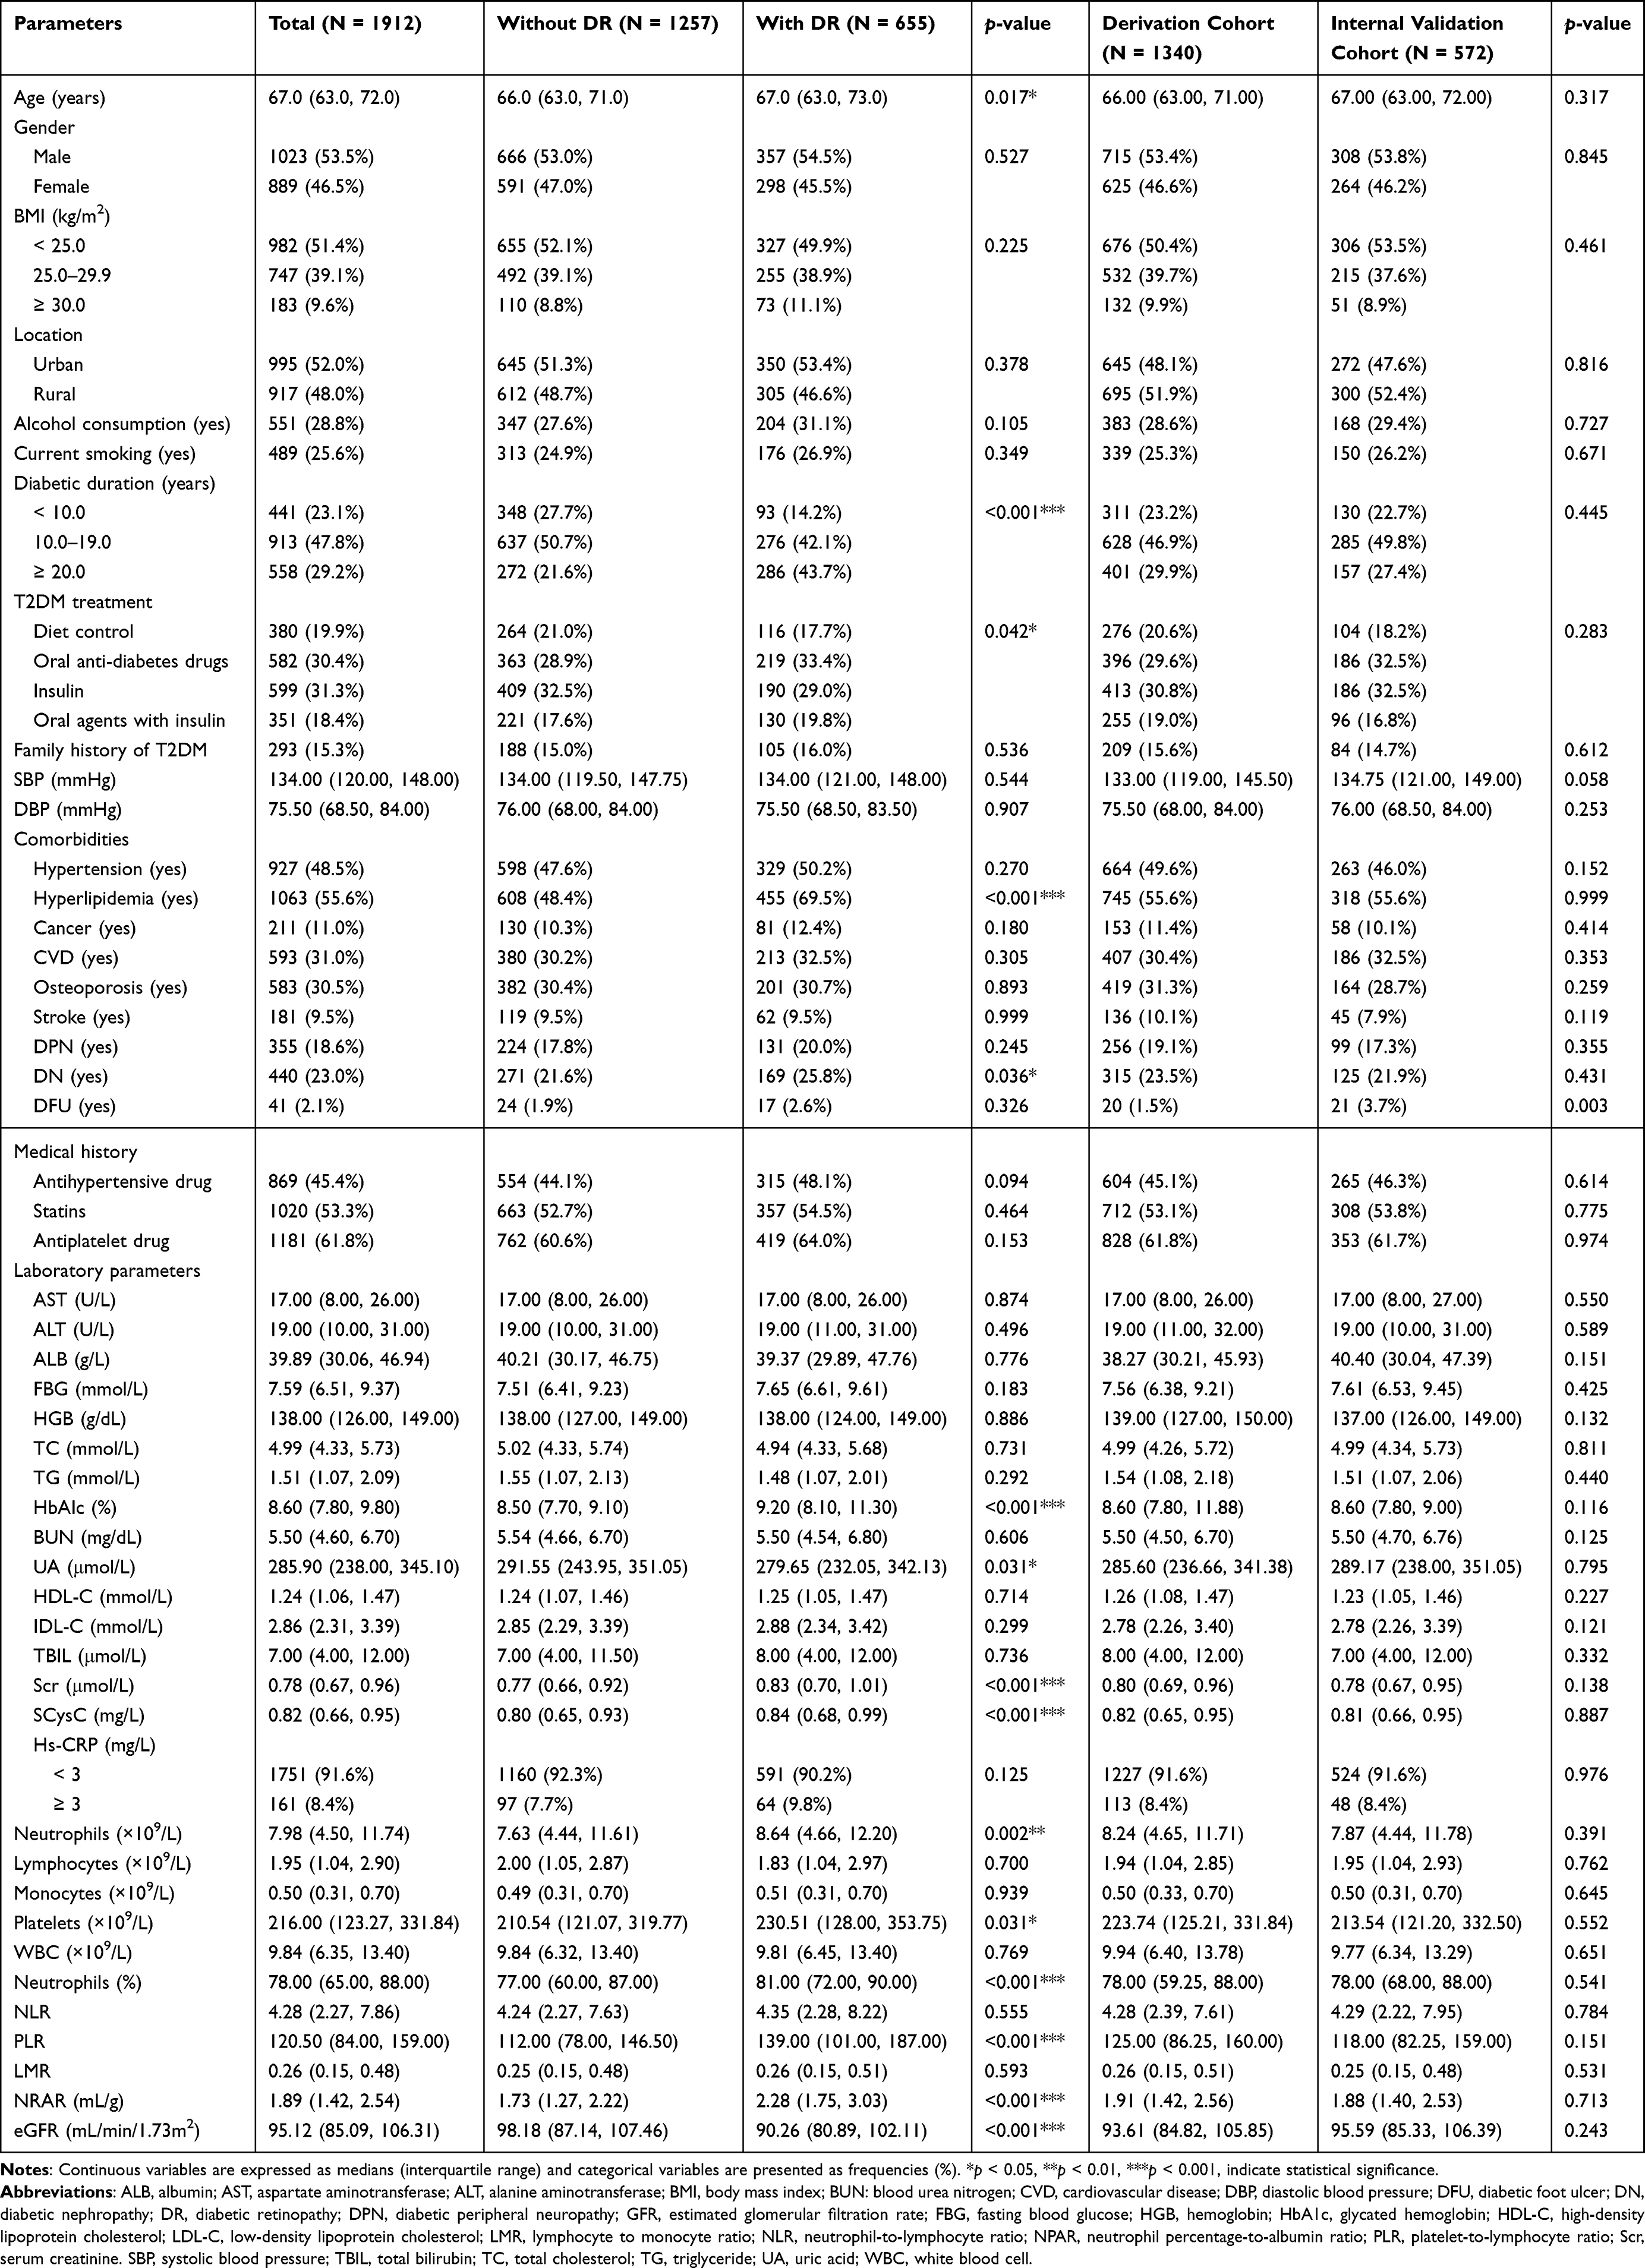 |
Table 1 Demographical and Clinical Parameters of Participants with or Without DR (N = 1912) |
For external validation, an independent dataset of 476 eligible participants was analyzed, of whom 161 (33.8%) had DN. Comparative analyses of baseline characteristics between the model development and external validation cohort were detailed in Supplementary Table S1. Overall, variable distributions across derivation, internal validation, and external validation cohorts were largely consistent. However, DFU, ALB, IDL-C, and Hs-CRP demonstrated statistically significant heterogeneity (all p < 0.05, Supplementary Table S1).
Predictor Screening
Univariate analysis revealed significant differences in clinical and laboratory parameters between elderly patients with and without DR. Compared to the non-DR group, those in the DR group were older age (p = 0.017), had longer T2DM duration (p < 0.001), a higher frequency of combined oral antihyperglycemic and insulin therapy (p = 0.042), a higher prevalence of hyperlipidemia (p < 0.001), and a higher rate of DN (p = 0.036). Laboratory findings indicated elevated levels of HbA1c (p < 0.001), UA (p = 0.031), neutrophil (absolute counts: p = 0.002; percentage: p < 0.001), platelets (p = 0.031), Scr (p < 0.001), and SCysC (p < 0.001). Furthermore, the DR group demonstrated higher PLR (p < 0.001) and NPAR (p < 0.001), while exhibiting a reduced eGFR (p < 0.001) compared to the non-DR group (Table 1).
The LASSO regression model was employed to identify key predictors of DR while mitigating overfitting. Neutrophil (absolute counts and percentages), monocytes, platelets, and lymphocytes were excluded from the LASSO regression model to prevent multicollinearity. Figure 2 illustrated the LASSO regularization process for variable selection. In the coefficient solution path diagram (Figure 2A), each colored line represented the trajectory of the standardized coefficient as the λ increases. With escalating λ values, the coefficients shrink towards zero. At λ.1-SE = 0.0319 (log(λ) = −3.445), six predictors retained non-zero coefficients: T2DM duration, HbA1c, hyperlipidemia, PLR, eGFR, and NPAR. All other variables were excluded, resulting in a parsimonious model with clinical interpretability (Figure 2B). A subsequent multivariate logistic regression model confirmed these variables as independent predictors of DR. ORs were as follows: T2DM duration (OR = 2.125, 95% CI: 1.747–2.586, p < 0.001), HbA1c (OR = 1.363, 95% CI: 1.275–1.457, p < 0.001), hyperlipidemia (OR = 2.494, 95% CI: 1.877–3.314, p < 0.001), PLR (OR = 1.010, 95% CI: 1.008–1.012, p < 0.001), eGFR (OR = 0.973, 95% CI: 0.965–0.980, p < 0.001), and NPAR (OR = 2.207, 95% CI: 1.880–2.592, p < 0.001) (Figure 3).
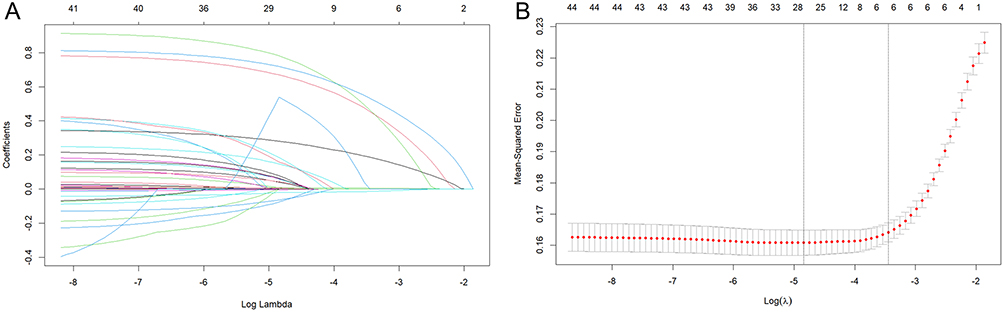 |
Figure 2 Predictor selection using LASSO regression. (A) Coefficient shrinkage profiles for all candidate variables. (B) 10-fold cross-validation for optimal penalty parameter (λ) determination. Vertical dashed lines denote λ.min (left) and λ.1-SE (right), corresponding to the values yielding minimal mean cross-validated error and the simplest model within 1-SE of the minimum, respectively. Abbreviations: λ, lambda; SE, standard error; LASSO, least absolute shrinkage and selection operator. |
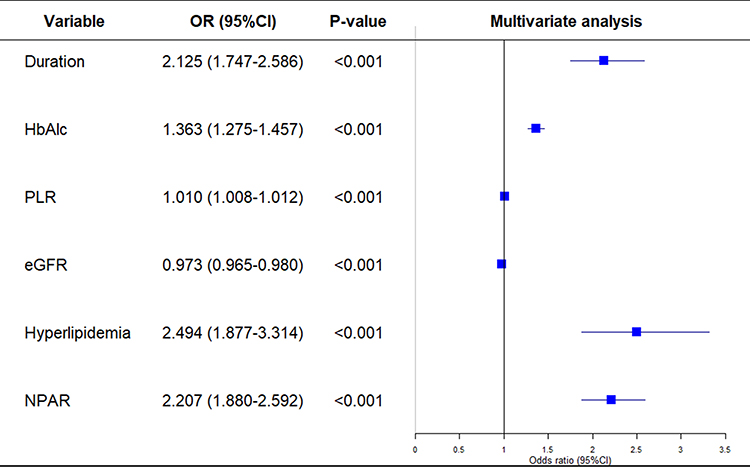 |
Figure 3 Forest plot illustrating the multivariate logistic regression model. p < 0.05, indicating statistical significance. Abbreviations: OR, odds ratio; CI, confidence interval; HbA1c, glycosylated hemoglobin; PLR, platelet-to-lymphocyte ratio; eGFR, estimated glomerular filtration rate. |
Nomogram Development
A nomogram-based risk prediction model was constructed based on the six identified predictors (T2DM duration, HbA1c, hyperlipidemia, PLR, eGFR, and NPAR) to quantitatively assess the risk of DR in elderly patients with T2DM (Figure 4). Each predictor was assigned a score based on its corresponding scale at the top of the nomogram. The total score, obtained by summing the individual predictor scores, was translated into a probability of DR using the risk scale at the bottom (Figure 4A). For instance, a 63-year-old patient with hyperlipidemia, a T2DM duration ≥20 years, an eGFR of 101.12 mL/min/1.73m2, a PLR of 178.00, and a NPAR of 3.34 would achieve a total score of 3.22 points, corresponding to an estimated 76.6% risk of DR (as indicated by the red arrow in Figure 4B).
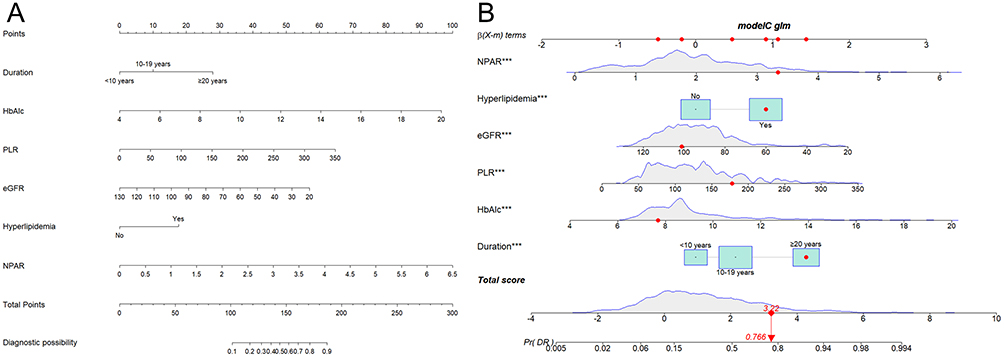 |
Figure 4 Nomogram for individualized DR risk prediction in elderly adults with T2DM. (A) Scoring system integrating six clinically accessible parameters: T2DM duration, HbA1c, hyperlipidemia, PLR, eGFR, and NPAR. The probability axis represents the clinically observed range (100–180 points). The total points scale extends to theoretical maximum values to account for rare cases. (B) Clinical application example: A 63-year-old patient with hyperlipidemia, T2DM duration ≥20 years, eGFR of 101.12 mL/min/1.73 m², PLR of 178.00, and NPAR of 3.34 achieved a cumulative score of 3.22 points (indicated by arrows), corresponding to a 76.6% predicted DR risk. An asterisk (***) denotes the significant variables identified by multivariate logistic regression analysis. Abbreviations: DR, diabetic retinopathy; T2DM, type 2 diabetes mellitus; HbA1c, glycosylated hemoglobin; PLR, platelet-to-lymphocyte ratio; eGFR, estimated glomerular filtration rate. |
Model Performance
The discriminative ability of the nomogram was evaluated using ROC analysis (Figure 5A). The AUC values were 0.828 (95% CI: 0.805–0.851) and 0.808 (95% CI: 0.770–0.846) for the derivation and internal validation cohorts, respectively. Furthermore, calibration plots demonstrated a strong association between the model’s predicted probabilities and observed outcomes, with the calibration curve (black line) closely aligning with the ideal reference line (diagonal line) in both cohorts (Figure 5B). Moreover, the H-L tests further confirmed model fit, yielding non-significant Chi-square statistics of 6.305 (p = 0.807) and 9.711 (p = 0.374) for the derivation and internal validation cohorts, respectively. Additionally, the DCA plot revealed that the nomogram provided greater net clinical benefit across a wide range of risk thresholds (3.4–99% for derivation and 9–86% for validation cohort, respectively) compared to the “treat all” (gray curve) and “treat none” (green line) strategies, thereby underscoring its superior practical utility (Figure 5C).
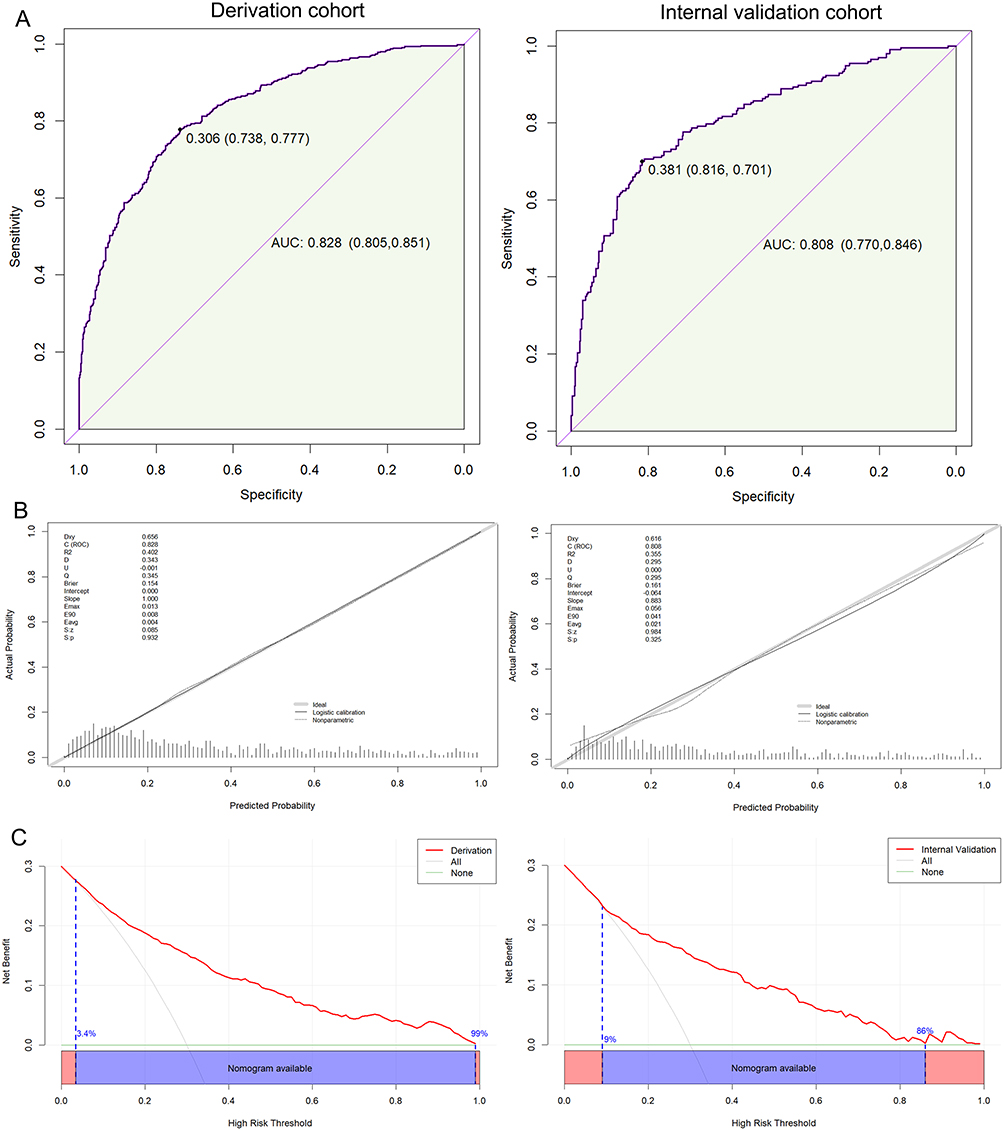 |
Figure 5 Predictive performance of the nomogram model. The ROC-AUC plot (A), calibration curve plot (B), and DCA curve (C) of the nomogram for predicting DR in the derivation and internal validation cohorts. Abbreviations: DCA, decision curve analysis; ROC-AUC, receiver operating characteristic-area under the curve. |
External Validation of the Nomogram Model
To evaluate generalizability, an independent external cohort comprising 476 elderly patients with T2DM was recruited from a geographically distinct region. The demographic and clinical characteristics of this cohort, including key predictors (T2DM duration, HbA1c, hyperlipidemia, PLR, eGFR, and NPAR), were summarized in Table 2. All predictor variables maintained statistical significance (all p < 0.05), confirming their robustness across diverse populations. The nomogram demonstrated discriminative ability in the external cohort, with an AUC of 0.788 (95% CI: 0.745–0.831) (Figure 6A). Calibration analysis revealed excellent alignment between predicted probabilities and observed outcomes, as evidenced by the proximity of the calibration curve to the ideal reference line (Figure 6B). The H-L test further validated model fit, yielding a non-significant Chi-square statistic of 11.778 (p = 0.226). DCA curve confirmed the monogram’s clinical utility, showing that its application provided substantial net clinical benefit across a wide range of threshold probabilities (3–82%) compared to alternative management strategies (Figure 6C). Collectively, these findings underscore the model’s reproducibility and reliability in predicting the risk of DR among elderly individuals with T2DM, supporting its potential integration into clinical practice.
 |
Table 2 Predictive Model-Relevant Parameters for External Cohorts (N = 476) |
 |
Figure 6 External validation of the nomogram. (A) Accuracy assessed through ROC-AUC, (B) calibration precision via the Hosmer-Lemeshow test, and (C) clinical utility via DCA in an independent cohort. Abbreviations: DCA, decision curve analysis; ROC-AUC, receiver operating characteristic-area under the curve. |
Discussion
Despite well-established recommendations for timely detection and treatment of diabetic retinopathy (DR) to prevent vision-threatening complications in individuals with diabetes, significant barriers hinder the implementation of effective global screening programs. Limited access to specialized medical resources and DR screening services, combined with substantial financial burdens, remains a critical challenge across all income settings.20 Furthermore, diabetes management in elderly populations presents unique complexities, as this group is particularly susceptible to both traditional diabetes-related complications and age-associated comorbidities.21 These factors underscore the urgent need for cost-effective, simplified screening strategies tailored to older adults. In this study, DR was diagnosed in 34.3% (655/1912) of elderly patients with T2DM, a prevalence consistent with prior reports (eg, 30.0% in adults aged ≥65 years),22 further emphasizing the elevated risk of DR in this demographic. LASSO regression identified six significant variables associated with DR: T2DM duration, HbA1c, hyperlipidemia, PLR, eGFR, and NPAR, which was further corroborated by multivariate logistic regression analysis. The nomogram demonstrated robust predictive performance, with strong discriminative ability, well-calibrated probabilities, and clinically meaningful net benefits in DCA. By integrating readily available clinical and laboratory parameters, this model addresses a critical gap in DR risk stratification for elderly T2DM patients, offering a pragmatic tool to optimize screening prioritization in resource-constrained settings.
This study identified T2DM duration and HbA1c were independent risk factors for DR. HbA1c, a well-established biomarker of long-term glycemic control,23 reflects cumulative exposure to hyperglycemia. Elevated HbA1c levels and prolonged disease duration synergistically exacerbate sustained hyperglycemia, which promotes retinal microvascular damage through mechanisms involving advanced glycation end products, oxidative stress, chronic inflammation, and aberrant neovascularization, ultimately driving DR pathogenesis in this population.24 Consistent with prior evidence,25 our analysis demonstrated that T2DM duration exceeding 10 years significantly increased DR risk compared to shorter disease courses, underscoring its critical role in DR progression. These findings align with existing research: Li et al developed a nomogram model incorporating T2DM duration and HbA1c to stratify DR risk in 2381 Chinese patients with T2DM, achieving robust discrimination across both derivation and external validation cohort.26 Similarly, a retrospective cohort study by Zhang et al established a dynamic prediction model leveraging systemic risk factors-including T2DM duration and HbA1c-that demonstrated clinical applicability for early detection of DR.27 Additionally, a cross-sectional study involving 168 Iranian patients with T2DM identified an HbA1c threshold of 8.15% as the optimal predictor of DR (prevalence rate of 29.8%).28 Collectively, these studies highlight the necessity of systematic DR screening in elderly patients with T2DM, particularly those with extended disease duration, as retinopathy frequently progresses asymptomatically during its early stages. Moreover, stringent glycemic control remains paramount for mitigating both the incidence and severity of DR in this high-risk demographic.
The current analysis identifies hyperlipidemia—defined as the presence of at least one abnormal lipid threshold—as a significant contributor to DR development and progression in elderly adults with T2DM.17 Although previous studies have documented associations between dyslipidemia and DR, inconsistencies persist, particularly concerning specific lipid parameters. For example, a recent meta-analysis correlated hyperlipidemia, defined by elevated serum lipid thresholds, with an increased risk of DR in T2DM patients.29 Conversely, our univariate analysis did not demonstrate significant associations of DR with isolated lipid fractions, such as TC, TG, HDL-C, and LDL-C. This discrepancy may arise from methodological differences, as individual lipid measurements are inherently susceptible to variability due to transient dietary influences, lipid-lowering therapies (such as statins), or acute metabolic fluctuations that can destabilize serum lipid profiles at the time of assessment.30,31 In contrast, hyperlipidemia, as a composite clinical variable, acts as a proxy for sustained dysregulation, encompassing cumulative exposure to dysmetabolic stress, thereby exacerbating microvascular pathology.32,33 This observation aligns with evidence suggesting that composite lipid variables more accurately reflect chronic metabolic derangements contributing to DR, including endothelial dysfunction, retinal lipid exudation, and ischemic damage.34 Therefore, while transient lipid levels lack prognostic specificity in cross-sectional analyses, hyperlipidemia remains significant in our nomogram as a marker of persistent dysmetabolic burden, especially in elderly adults predisposed to age-related vascular vulnerability. Future research incorporating serial lipid assessments and standardized dietary controls is warranted to clarify these temporal and mechanistic relationships.
This study identified reduced eGFR as an independent predictor of DR risk in elderly adults with T2DM. As a key biomarker of renal function, eGFR reflects systemic microvascular integrity, and its association with DR underscores the shared pathophysiology of diabetic microangiopathy. Declining kidney function, characterized by diminished eGFR, may exacerbate DR progression through mechanisms such as activation of the renin-angiotensin-aldosterone system (RAAS) and endothelial dysfunction, which mirrors retinal capillary damage, ischemia, and neovascularization.35 Consequently, longitudinal monitoring of eGFR provides critical insights into DR risk stratification and early intervention.36 Supporting this, a cohort study by Mori et al demonstrated that T2DM patients with lower baseline eGFR experienced accelerated DR progression, suggesting systemic microvascular deterioration serves as a unifying pathway.37 Similarly, a risk prediction model for vision-threatening DR identified eGFR <60 mL/min/1.73 m2 as a significant prognostic factor, particularly in patients with long-standing diabetes.38 Our model corroborated these findings, confirming eGFR as an independent risk factor for DR in elderly patients with T2DM. Notably, age-related physiological decline in renal function, compounded by chronic hyperglycemia, renders elderly T2DM populations uniquely vulnerable to concurrent microvascular complications.39 Thus, preserving renal function through stringent glycemic control and routine monitoring of eGFR is imperative to mitigate DR incidence and progression in this high-risk demographic.
The current study revealed that the PLR, a novel marker of systemic inflammation, was significantly elevated in patients with DR compared to non-DR counterparts and emerged as an independent predictor of DR in elderly adults with T2DM.40 In elderly populations, the aging process is associated with chronic low-grade inflammation, which synergizes with vascular stiffening, diminished immune resolution, and impaired tissue repair mechanisms to accelerate DR progression.7,41,42 Notably, a recent cross-sectional study involving 719 males with T2DM developed a nomogram model integrating PLR, demonstrating robust diagnostic accuracy for DR.43 Our findings further identified the NPAR as an independent predictor of DR in elderly T2DM patients. This aligned with a large-scale investigation by He et al, wherein elevated NPAR correlated with an increased risk of DR among 5850 individuals with diabetes.44 The prognostic utility of NPAR likely arises from its dual representation of inflammatory activity and nutritional-metabolic derangements: increased neutrophil percentages signify amplified inflammatory responses, driving oxidative stress and endothelial injury, while hypoalbuminemia reflects malnutrition or chronic inflammation, impairing antioxidant defenses and vascular stability.45,46 Both pathways are mechanistically implicated in retinal microvascular damage. Importantly, PLR and NPAR exhibit greater stability than conventional inflammatory markers such as CRP, leukocyte, or lymphocyte counts during physiological or pathological fluctuations, underscoring their clinical feasibility and cost-effectiveness for risk stratification of DR in resource-limited settings.47
Practice Implications and Future Perspectives
Early identification of DR risk in elderly adults with T2DM—a population characterized by high frailty and multimorbidity—is critical for implementing preventive interventions and mitigating vision-threatening complications. The proposed nomogram, which incorporates routinely measured clinical variables such as T2DM duration, HbA1c, hyperlipidemia, PLR, eGFR, and NPAR, offers a practical tool for risk stratification across diverse clinical settings, including those with restricted accesses to retinal imaging infrastructure. To integrate this nomogram into clinical practice effectively, healthcare systems should consider establishing multidisciplinary diabetes care teams focused on optimizing the management of these critical parameters. For high-risk subgroups, such as patients with HbA1c >7%, prolonged diabetes duration, or declining eGFR, structured lifestyle counseling and optimization of pharmacotherapy for glycemic control should be prioritized. Routine ophthalmic evaluations are essential for preserving both retinal and renal function. Furthermore, individuals identified with hyperlipidemia or elevated PLR or NPAR may benefit from lipid-lowering therapies, anti-inflammatory agents, or personalized nutritional support aimed at reducing endothelial dysfunction and inflammation, thereby potentially decreasing the incidence of DR. In resource-constrained settings, the nomogram may serve as a triage tool to identify candidates requiring urgent referral to ophthalmology services. Currently, a significant challenge in implementing this nomogram is the unfamiliarity of clinicians with its interpretation. To address this issue, institutions should develop training strategies for clinicians and integrate the nomogram into electronic health record systems to automatically calculate retinopathy risk scores during routine visits. Additionally, for elderly patients experiencing cognitive decline, mobility limitations, and low adherence to therapy, tailored aids and caregiver-involved education may enhance adherence to screening and lifestyle interventions. By addressing these knowledge gaps, the nomogram may become a cornerstone of precision medicine for managing diabetes-related complications in aging populations.
Limitations
This study has several limitations that warrant acknowledgment. First, the cross-sectional design of the predictive model may introduce bias by misinterpreting correlational factors as causal determinants of DR. Future validation through longitudinal studies is essential for establishing temporal relationships and confirm causality. Second, although internal and external validation were performed, both datasets originated from northeastern China, leading to geographical homogeneity that may compromise generalizability to other ethnic or regional populations. Multicenter validation across diverse cohorts is necessary to assess the model’s reproducibility and clinical utility. Third, discrepancies exist between the risk factors identified in this elderly cohort and those reported in prior models developed for diabetic populations of all ages. These variations may arise from differences in participant demographics or sample sizes, underscoring the need for multivariate analyses in larger cohorts to refine risk factor selection. Fourth, although aging was excluded from the final nomogram despite its significant association in univariate analysis, the role of aging in the pathogenesis of DR remains controversial and unresolved. Further investigations are imperative to elucidate age-related mechanisms, such as inflammation, microvascular senescence, and epigenetic changes, which may indirectly influence DR occurrence. Finally, while the nomogram incorporates accessible clinical parameters, additional biomarkers (eg, advanced glycation end products, systemic inflammatory cytokines, and oxidative stress markers) could enhance predictive accuracy and warrant exploration in future iterations.
Conclusions
In summary, this study developed and validated a clinically practical risk prediction model for DR in elderly adults with T2DM utilizing six readily obtainable parameters: T2DM duration, HbA1c, hyperlipidemia, eGFR, and NPAR. These biomarkers were identified as independent predictors of DR, and the composite model demonstrating robust diagnostic utility. This cost-effective and user-friendly tool offers significant clinical value, particularly in resource-limited settings where access to specialized retinal screening remains constrained. By enabling providers to triage high-risk individuals for prioritized interventions—such as glycemic optimization, anti-inflammatory therapies, or nutritional support—the model facilitates early DR detection and targeted management. These strategies not only mitigate the risk of vision-threatening complications but also optimize long-term diabetes care, thereby improving health outcomes and quality of life for this vulnerable population. The future implementation of this tool may enhance systemic diabetes management frameworks while addressing critical disparities in access to ophthalmic healthcare for elderly patients with T2DM.
Data Sharing Statement
The data underlying this article will be obtained on reasonable request to the corresponding author.
Ethics Statement
This study was approved by the Institutional Review Board of Jinzhou Medical University (IRB approval No. JZMULL2024097, approval data: February 7, 2024), and in accordance with the Helsinki Declaration. Informed consent was waived due to the retrospective design of this study. All data were fully anonymized prior to analysis and handled in strict compliance with confidentiality principles.
Author Contributions
All authors made a significant contribution to the work reported, whether that is in the conception, study design, execution, acquisition of data, analysis and interpretation, or in all these areas; took part in drafting, revising or critically reviewing the article; gave final approval of the version to be published; have agreed on the journal to which the article has been submitted; and agree to be accountable for all aspects of the work.
Funding
There is no funding to report.
Disclosure
The authors report no conflicts of interest in this work.
References
1. Luo W, Zhang Z, Zhang W, et al. The association of homocysteine and diabetic retinopathy in homocysteine cycle in Chinese patients with type 2 diabetes. Front Endocrinol. 2022;13:883845. doi:10.3389/fendo.2022.883845
2. Ma R. Epidemiology of diabetes and diabetic complications in China. Diabetologia. 2018;61(6):1249–1260. doi:10.1007/s00125-018-4557-7
3. Tan T, Wong T. Diabetic retinopathy: looking forward to 2030. Front Endocrinol. 2023;13:1077669. doi:10.3389/fendo.2022.1077669
4. Vujosevic S, Aldington S, Silva P, et al. Screening for diabetic retinopathy: new perspectives and challenges. Lancet Diabetes Endocrinol. 2020;8(4):337–347. doi:10.1016/S2213-8587(19)30411-5
5. Steinmetz JD, Bourne RRA, Briant PS, Collaborators. GBaVI, Study. VLEGotGBoD. Causes of blindness and vision impairment in 2020 and trends over 30 years, and prevalence of avoidable blindness in relation to VISION 2020: the right to sight: an analysis for the global burden of disease study. Lancet Glob Health. 2021;9(2):e144–e160. doi:10.1016/S2214-109X(20)30489-7
6. Tang H, Luo N, Zhang X, et al. - Association between biological aging and diabetic retinopathy. Sci Rep. 2024;14(1):10123. doi:10.1038/s41598-024-60913-x
7. Li Q, Wang M, Li X, Shao Y. Aging and diabetic retinopathy: inherently intertwined pathophysiological processes- Aging and diabetic retinopathy: inherently intertwined pathophysiological. Exp Gerontol. 2023;175:112138. Epub 2023 Mar 24. doi:10.1016/j.exger.2023.112138
8. Li J, Guo C, Wang T, et al. Interpretable machine learning-derived nomogram model for early detection of diabetic retinopathy in type 2 diabetes mellitus: a widely targeted metabolomics study. Nutr Diabetes. 2022;12(1):36. doi:10.1038/s41387-022-00216-0
9. Chen X, Xie Q, Zhang X, Lv Q, Liu X, Rao H. Nomogram prediction model for diabetic retinopathy development in type 2 diabetes mellitus patients: a retrospective cohort study. J Diabetes Res. 2021;14(21):3825155.
10. Shan Y, Wang Q, Zhang Y, et al. High remnant cholesterol level is relevant to diabetic retinopathy in type 2 diabetes mellitus. Lipids Health Dis. 2022;21(1):12. doi:10.1186/s12944-021-01621-7
11. Mo R, Shi R, Hu Y, Hu F. Nomogram-based prediction of the risk of diabetic retinopathy: a retrospective study. J Diabetes Res. 2020;2020:7261047. doi:10.1155/2020/7261047
12. Wang Q, Zeng N, Tang H, et al. Diabetic retinopathy risk prediction in patients with type 2 diabetes mellitus using a nomogram model. Front Endocrinol. 2022;13:993423. doi:10.3389/fendo.2022.993423
13. Concato J, Peduzzi P, Holford TR, Feinstein AR. Importance of events per independent variable in proportional hazards analysis I. Background, goals, and general strategy. J Clin Epidemiol. 1995;48(12):1495–1501. doi:10.1016/0895-4356(95)00510-2
14. Li M, Wang Y, Liu Z, et al. Females with type 2 diabetes mellitus are prone to diabetic retinopathy: a twelve-province cross-sectional study in China. J Diabetes Res. 2020;2020:5814296. doi:10.1155/2020/5814296
15. Vergouwe Y, Steyerberg E, Eijkemans M, Habbema J. Substantial effective sample sizes were required for external validation studies of predictive logistic regression models. J Clin Epidemiol. 2005;58(5):475–483. doi:10.1016/j.jclinepi.2004.06.017
16. Jia W, Weng J, Zhu D, et al. Standards of medical care for type 2 diabetes in China 2019. Diabetes Metab Res Rev. 2019;35(6):e3158. doi:10.1002/dmrr.3158
17. Zhao M, Zhang D, Zhang Q, et al. Association between composite dietary antioxidant index and hyperlipidemia: a cross-sectional study from NHANES (2005-2020). Sci Rep. 2024;14(1):15935. doi:10.1038/s41598-024-66922-0
18. Inker L, Eneanya N, Coresh J, et al. New creatinine- and cystatin C-based equations to estimate GFR without race. N Engl J Med. 2021;385(19):1737–1749. Epub 2021 Sep 23. doi:10.1056/NEJMoa2102953
19. Fitzgerald M, Saville B, Lewis R. Decision curve analysis. JAMA. 2015;313(4):409–410. doi:10.1001/jama.2015.37
20. Piyasena M, Murthy G, Yip J, et al. Systematic review on barriers and enablers for access to diabetic retinopathy screening services in different income settings. PLoS One. 2019;14(4):e0198979. doi:10.1371/journal.pone.0198979.eCollection2019
21. Huang E, Laiteerapong N, Liu J, John P, Moffet H, Karter A. Rates of complications and mortality in elderly patients with diabetes mellitus: the diabetes and aging study. JAMA Intern Med. 2014;172(2):251–258. doi:10.1001/jamainternmed.2013.12956
22. Ahmad A, Rehman M. Efficacy of injecting intra-vitreal moxifloxacin in acute post-operative endophthalmitis. J Ayub Med Coll Abbottabad. 2023;35(1):164–168. doi:10.55519/JAMC-01-11011
23. Matsushita Y, Takeda N, Nakamura Y, et al. A comparison of the association of fasting plasma glucose and HbA1c levels with diabetic retinopathy in Japanese Men. J Diabetes Res. 2020;2020(3214676):1–6. doi:10.1155/2020/3214676
24. Stitt A. AGEs and diabetic retinopathy. Invest Ophthalmol Vis Sci. 2010;51(10):4867–4874. doi:10.1167/iovs.10-5881
25. Bek T. Systemic risk factors contribute differently to the development of proliferative diabetic retinopathy and clinically significant macular oedema. Diabetologia. 2020;63(11):2462–2470. Epub 2020 Jul 21. doi:10.1007/s00125-020-05234-0
26. Li Y, Hu B, Lu L, et al. Development and external validation of a predictive model for type 2 diabetic retinopathy. Ci Rep. 2024;14(1):16741. doi:10.1038/s41598-024-67533-5
27. Zhang C, Zhou L, Ma M, Yang Y, Zhang Y, Zha X. Dynamic nomogram prediction model for diabetic retinopathy in patients with type 2 diabetes mellitus. BMC Ophthalmol. 2023;23(1):186. doi:10.1186/s12886-023-02925-1
28. Setareh J, Hoseinzade G, Khoundabi B, et al. Can the level of HbA1C predict diabetic retinopathy among type II diabetic patients? BMC Ophthalmol. 2022;22(1):415. doi:10.1186/s12886-022-02608-3
29. Li Z, Yuan Y, Qi Q, Wang Q, Feng L. Relationship between dyslipidemia and diabetic retinopathy in patients with type 2 diabetes mellitus: a systematic review and meta-analysis. Syst Rev. 2023;12(1):148. doi:10.1186/s13643-023-02321-2
30. Tan H, Fu X, Wang Y, Chen Y, Chen D. Hyperlipidemia and lipid-lowering therapy in diabetic retinopathy (DR): a bibliometric study and visualization analysis in 1993-2023. Heliyon. 2023;9(10):e21109. doi:10.1016/j.heliyon.2023.e21109
31. Zhang H, Wang J, Ying G, Shen L, Zhang Z. Serum lipids and other risk factors for diabetic retinopathy in Chinese type 2 diabetic patients. J Zhejiang Univ Sci B. 2013;14(5):392–399. doi:10.1631/jzus.B1200237
32. Chou Y, Ma J, Su X, Zhong Y. Emerging insights into the relationship between hyperlipidemia and the risk of diabetic retinopathy. Lipids Health Dis. 2020;19(1):241. doi:10.1186/s12944-020-01415-3
33. Lee H, Park M, Won Y. AI machine learning-based diabetes prediction in elderly adults in South Korea: cross-sectional analysis. JMIR Form Res. 2025;9:e57874. doi:10.2196/57874
34. Yang Y, Tan J, He Y, et al. Predictive model for diabetic retinopathy under limited medical resources: a multicenter diagnostic study. Front Endocrinol. 2023;13:1099302. doi:10.3389/fendo.2022.1099302
35. Gao L, Xue C, Cui J, et al. Diabetic retinopathy and chronic kidney disease: associations and comorbidities in a large diabetic population - The tongren health care study. Am J Nephrol. 2024;55(2):175–186. doi:10.1159/000535059
36. Neelamegam V, Surya R, Venkatakrishnan P, Sharma T, Raman R. Association of eGFR with stages of diabetic retinopathy and age-related macular degeneration in Indian population. Indian J Ophthalmol. 2024;72(7):968–975. doi:10.4103/IJO.IJO_2558_23
37. Mori T, Hanai K, Yamamoto Y, Yoshida N, Murata H, Nakagami T. Association of diabetic retinopathy with kidney disease progression according to baseline kidney function and albuminuria status in individuals with type 2 diabetes. Clin Exp Nephrol. 2024;29:607–615. doi:10.1007/s10157-024-02599-z
38. Liang Y, Zhang X, Mei W, et al. Predicting vision-threatening diabetic retinopathy in patients with type 2 diabetes mellitus: systematic review, meta-analysis, and prospective validation study. J Glob Health. 2024;14:04192. doi:10.7189/jogh.14.04192
39. Russo G, De Cosmo S, Viazzi F, et al. Diabetic kidney disease in the elderly: prevalence and clinical correlates. BMC Geriatr. 2018;18(1):38. doi:10.1186/s12877-018-0732-4
40. Wang R, Wen W, Jiang Z, et al. The clinical value of neutrophil-to-lymphocyte ratio (NLR), systemic immune-inflammation index (SII), platelet-to-lymphocyte ratio (PLR) and systemic inflammation response index (SIRI) for predicting the occurrence and severity of pneumonia in patients with intracerebral hemorrhage. Front Immunol. 2023;14:1115031. doi:10.3389/fimmu.2023.1115031
41. Forrester J, Kuffova L, Delibegovic M. The role of inflammation in diabetic retinopathy. Front Immunol. 2020;11:583687. doi:10.3389/fimmu.2020.583687
42. Howcroft T, Campisi J, Louis G, et al. The role of inflammation in age-related disease. Aging. 2013;5(1):84–93. doi:10.18632/aging.100531
43. Chen H, Chen H. Construction of a nomogram model to predict the development of retinopathy in type 2 diabetes mellitus based on systemic inflammatory indicators. J Men Health. 2024;20(5):102–111. doi:10.22514/jomh.2024.076
44. He X, Dai F, Zhang X, Pan J. The neutrophil percentage-to-albumin ratio is related to the occurrence of diabetic retinopathy. J Clin Lab Anal. 2022;36(4):e24334. doi:10.1002/jcla.24334
45. Jing Y, Tian B, Deng W, et al. The neutrophil percentage-to-albumin ratio as a biomarker for all-cause and diabetes-cause mortality among diabetes patients: evidence from the NHANES 1988-2018. J Clin Lab Anal. 2024;38(21):e25110. doi:10.1002/jcla.25110
46. Li X, Gu Z, Gao J. Elevated neutrophil percentage-to-albumin ratio predicts increased all-cause and cardiovascular mortality among individuals with diabetes. Sci Rep. 2024;14(1):27870. doi:10.1038/s41598-024-79355-6
47. He Y, Yuan Y, Tan Q, Zhang X, Liu Y, Xiao M. Development and validation of a risk prediction model for 30-day readmission in elderly type 2 diabetes patients complicated with heart failure: a multicenter, retrospective study. Front Endocrinol. 2025;16:1534516. doi:10.3389/fendo.2025.1534516
 © 2025 The Author(s). This work is published and licensed by Dove Medical Press Limited. The
full terms of this license are available at https://www.dovepress.com/terms
and incorporate the Creative Commons Attribution
- Non Commercial (unported, 4.0) License.
By accessing the work you hereby accept the Terms. Non-commercial uses of the work are permitted
without any further permission from Dove Medical Press Limited, provided the work is properly
attributed. For permission for commercial use of this work, please see paragraphs 4.2 and 5 of our Terms.
© 2025 The Author(s). This work is published and licensed by Dove Medical Press Limited. The
full terms of this license are available at https://www.dovepress.com/terms
and incorporate the Creative Commons Attribution
- Non Commercial (unported, 4.0) License.
By accessing the work you hereby accept the Terms. Non-commercial uses of the work are permitted
without any further permission from Dove Medical Press Limited, provided the work is properly
attributed. For permission for commercial use of this work, please see paragraphs 4.2 and 5 of our Terms.
Recommended articles
Development and Validation of a Predictive Nomogram with Age and Laboratory Findings for Severe COVID-19 in Hunan Province, China
Jiang J, Zhong W, Huang W, Gao Y, He Y, Li X, Liu Z, Zhou H, Fu Y, Liu R, Zhang W
Therapeutics and Clinical Risk Management 2022, 18:579-591
Published Date: 17 May 2022
Construction of Predictive Model for Type 2 Diabetic Retinopathy Based on Extreme Learning Machine
Liu L, Wang M, Li G, Wang Q
Diabetes, Metabolic Syndrome and Obesity 2022, 15:2607-2617
Published Date: 24 August 2022
Establishment and Validation of a Model for Disease-Free Survival Rate Prediction Using the Combination of microRNA-381 and Clinical Indicators in Patients with Breast Cancer
Shen J, Wang M, Li F, Yan H, Wang R, Zhou J
Breast Cancer: Targets and Therapy 2022, 14:375-389
Published Date: 30 November 2022
A Visualized Mortality Prediction Score Model in Hematological Malignancies Patients with Carbapenem-Resistant Organisms Bloodstream Infection
Qian C, Wu Q, Ruan Z, Liu F, Li W, Shi W, Ma L, Peng D, Yin H, Yao L, Li Z, Hong M, Xia L
Infection and Drug Resistance 2023, 16:201-215
Published Date: 7 January 2023
Construction of a Nomogram-Based Prediction Model for the Risk of Diabetic Kidney Disease in T2DM
Wang X, Liu X, Zhao J, Chen M, Wang L
Diabetes, Metabolic Syndrome and Obesity 2024, 17:215-225
Published Date: 12 January 2024