Back to Journals » Diabetes, Metabolic Syndrome and Obesity » Volume 15
Construction of Predictive Model for Type 2 Diabetic Retinopathy Based on Extreme Learning Machine
Authors Liu L, Wang M, Li G, Wang Q
Received 20 May 2022
Accepted for publication 18 August 2022
Published 24 August 2022 Volume 2022:15 Pages 2607—2617
DOI https://doi.org/10.2147/DMSO.S374767
Checked for plagiarism Yes
Review by Single anonymous peer review
Peer reviewer comments 2
Editor who approved publication: Professor Ming-Hui Zou
Lei Liu,1 Mengmeng Wang,1 Guocheng Li,2 Qi Wang1,3
1Graduate School of Bengbu Medical College, Bengbu Medical College, Bengbu City, People’s Republic of China; 2School of Finance & Mathematics, West Anhui University, Lu’an City, People’s Republic of China; 3Department of Endocrinology, Lu’an Hospital of Anhui Medical University, Lu’an City, People’s Republic of China
Correspondence: Qi Wang, Department of Endocrinology, Lu’an Hospital of Anhui Medical University, No. 21, Wanxi West Road, Lu’an City, People’s Republic of China, Tel +86-13966299858, Email [email protected]
Purpose: The common cause of blindness in people with type 2 diabetes (T2D) is diabetic retinopathy (DR). Early fundus examinations have been shown to prevent vision loss, but routine ophthalmic screenings for patients with diabetes present significant financial and material challenges to existing health-care systems. The purpose of this study is to build a DR prediction model based on the extreme learning machine (ELM) and to compare the performance with the DR prediction models based on support machine vector (SVM), K proximity (KNN), random forest (RF) and artificial neural network (ANN).
Methods: From January 1, 2020 to November 31, 2021, data were collected from electronic inpatient medical records at Lu’an Hospital of Anhui Medical University in China. An extreme learning machine (ELM) algorithm was used to develop a prediction model based on demographic data and blood testing and urine test results. Several metrics were used to evaluate the model’s performance: (1) classification accuracy (ACC), (2) sensitivity, (3) specificity, (4) Precision,(5) Negative predictive value (NPV), (6) Training time and (7) area under the receiver operating characteristic (ROC) curve (AUC).
Results: In terms of ACC, Sensitivity, Specificity, Precision, NPV and AUC, DR prediction model based on SVM and ELM is better than DR prediction model based on ANN, KNN and RF. The prediction model for diabetic retinopathy based on elm is the best among them in terms of ACC, Precision, Specificity, Training time and AUC, with 84.45%, 83.93%, 93.16%,1.24s, and 88.34%, respectively. The DR prediction model based on SVM is the best in terms of sensitivity and NPV, which are, respectively, 70.82% and 85.60%.
Conclusion: According to the findings of this study, the model based on the extreme learning machine presents an outstanding performance in predicting diabetic retinopathy thus providing technological assistance for screening of diabetic retinopathy.
Keywords: type 2, diabetic retinopathy, extreme learning machine, predictive model
Introduction
In 2021, 536.6 million people with diabetes were reported worldwide. Among adults, diabetes afflicts more than 10% of the world’s population.1 Almost all of them (90%–95%) have type 2 diabetes (T2D).2 Diabetic retinopathy (DR) is a diabetic microvascular condition that is a significant cause of vision loss and blindness.3 Early detection and treatment, according to evidence, are critical in preventing visual loss.4 The current gold standard of DR screening is fundus photography.5 The American Diabetes Association recommends annual fundus examinations for diabetics, but about half of diabetics do not undergo any tests to diagnose DR.6 In addition, fundus examinations require experienced ophthalmologists to perform them. However, ophthalmologists are scarce in poor nations.7 These limitations have resulted in low DR screening rate and large investment of resources, both of which pose serious challenges to the healthcare system in developing countries. Therefore, various DR prediction models have become popular. Artificial intelligence (AI) and machine learning (ML) may perform better than traditional prediction models in order to continue to play a role in DR screening.8–11 Thus far, numerous ML algorithms for screening DR have been proposed.12 Most algorithms show good performances. In investigations, support vector machine (SVM) and artificial neural network (ANN) models were shown to improve DR prediction performance for the diabetic American population.13 This finding has prompted further interest in the application of machine algorithms to DR. However, common ML algorithms, such as ANN, support machine vector (SVM), K proximity (KNN), and random forest (RF), have two common shortcomings. Many network parameters must be properly set, which significantly increases the learning time.14–16 The input weights and hidden deviations were chosen at random using an extreme learning machine (ELM) algorithm, while the output weights were computed through the Moore Penrose generalized inverse analysis.17 As a result, compared with SVM, RF, ANN and KNN, ELM learns quicker and uses fewer fine-tuned parameters while still achieving high generalization results. Based on these findings, the ELM model is projected to provide a new and accurate tool for detecting DR. Design of this study Adhere to TRIPOD-PROBAST/TRIPOD-AI PROBAST-AI.
Data and Methods
Patient Selection
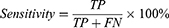
Patients (n = 1309) admitted from January 1, 2020 to November 31, 2021 to Lu’an Hospital of Anhui Medical University, China, were selected as study subjects. Inclusion criteria included patients: (1) Patients diagnosed with type 2 diabetes according to the diagnostic and classification criteria for diabetes published by who in 1990, (2) The eye department has been consulted to determine whether there is diabetes retinopathy after completing the fundus examination. Exclusion criteria included several parameters: (1) previous diagnosis (2) incomplete data, (3) patients with hepatobiliary, hematological, or inflammatory diseases, (4) patients with unclear fundus due to refractive media turbidity. We finally got 1093 samples through strict data preprocessing (Figure 1).
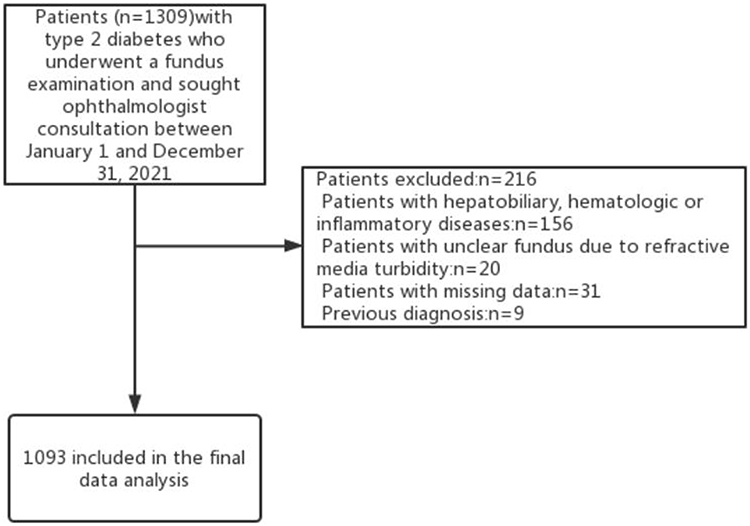 |
Figure 1 Data screening flow chart. Notes: Patients with missing data: Delete samples with one or more missing variables; fundus examination: if there is any characteristic lesion, it is diagnosed as DR: microaneurysm, hemorrhage, cotton wool spot, abnormal microvascular in retina, hard exudate, venous hemorrhage, neovascularization. |
Data Processing
A total of 1093 patients (377 patients with DR, accounting for approximately 34.5% of the patients) were extracted using the above criteria, and their age, sex, diabetes course (DC), body mass index (BMI), and other demographic information were obtained. Blood testing and urine test results measured on fasting on the second day of admission were measured. Values for the presence of DR (yes = 2, no = 1), urinary protein (yes = 2, no = 1), and sex (female = 2, male = 1) were assigned (Table 1 and Supplementary Table 1).
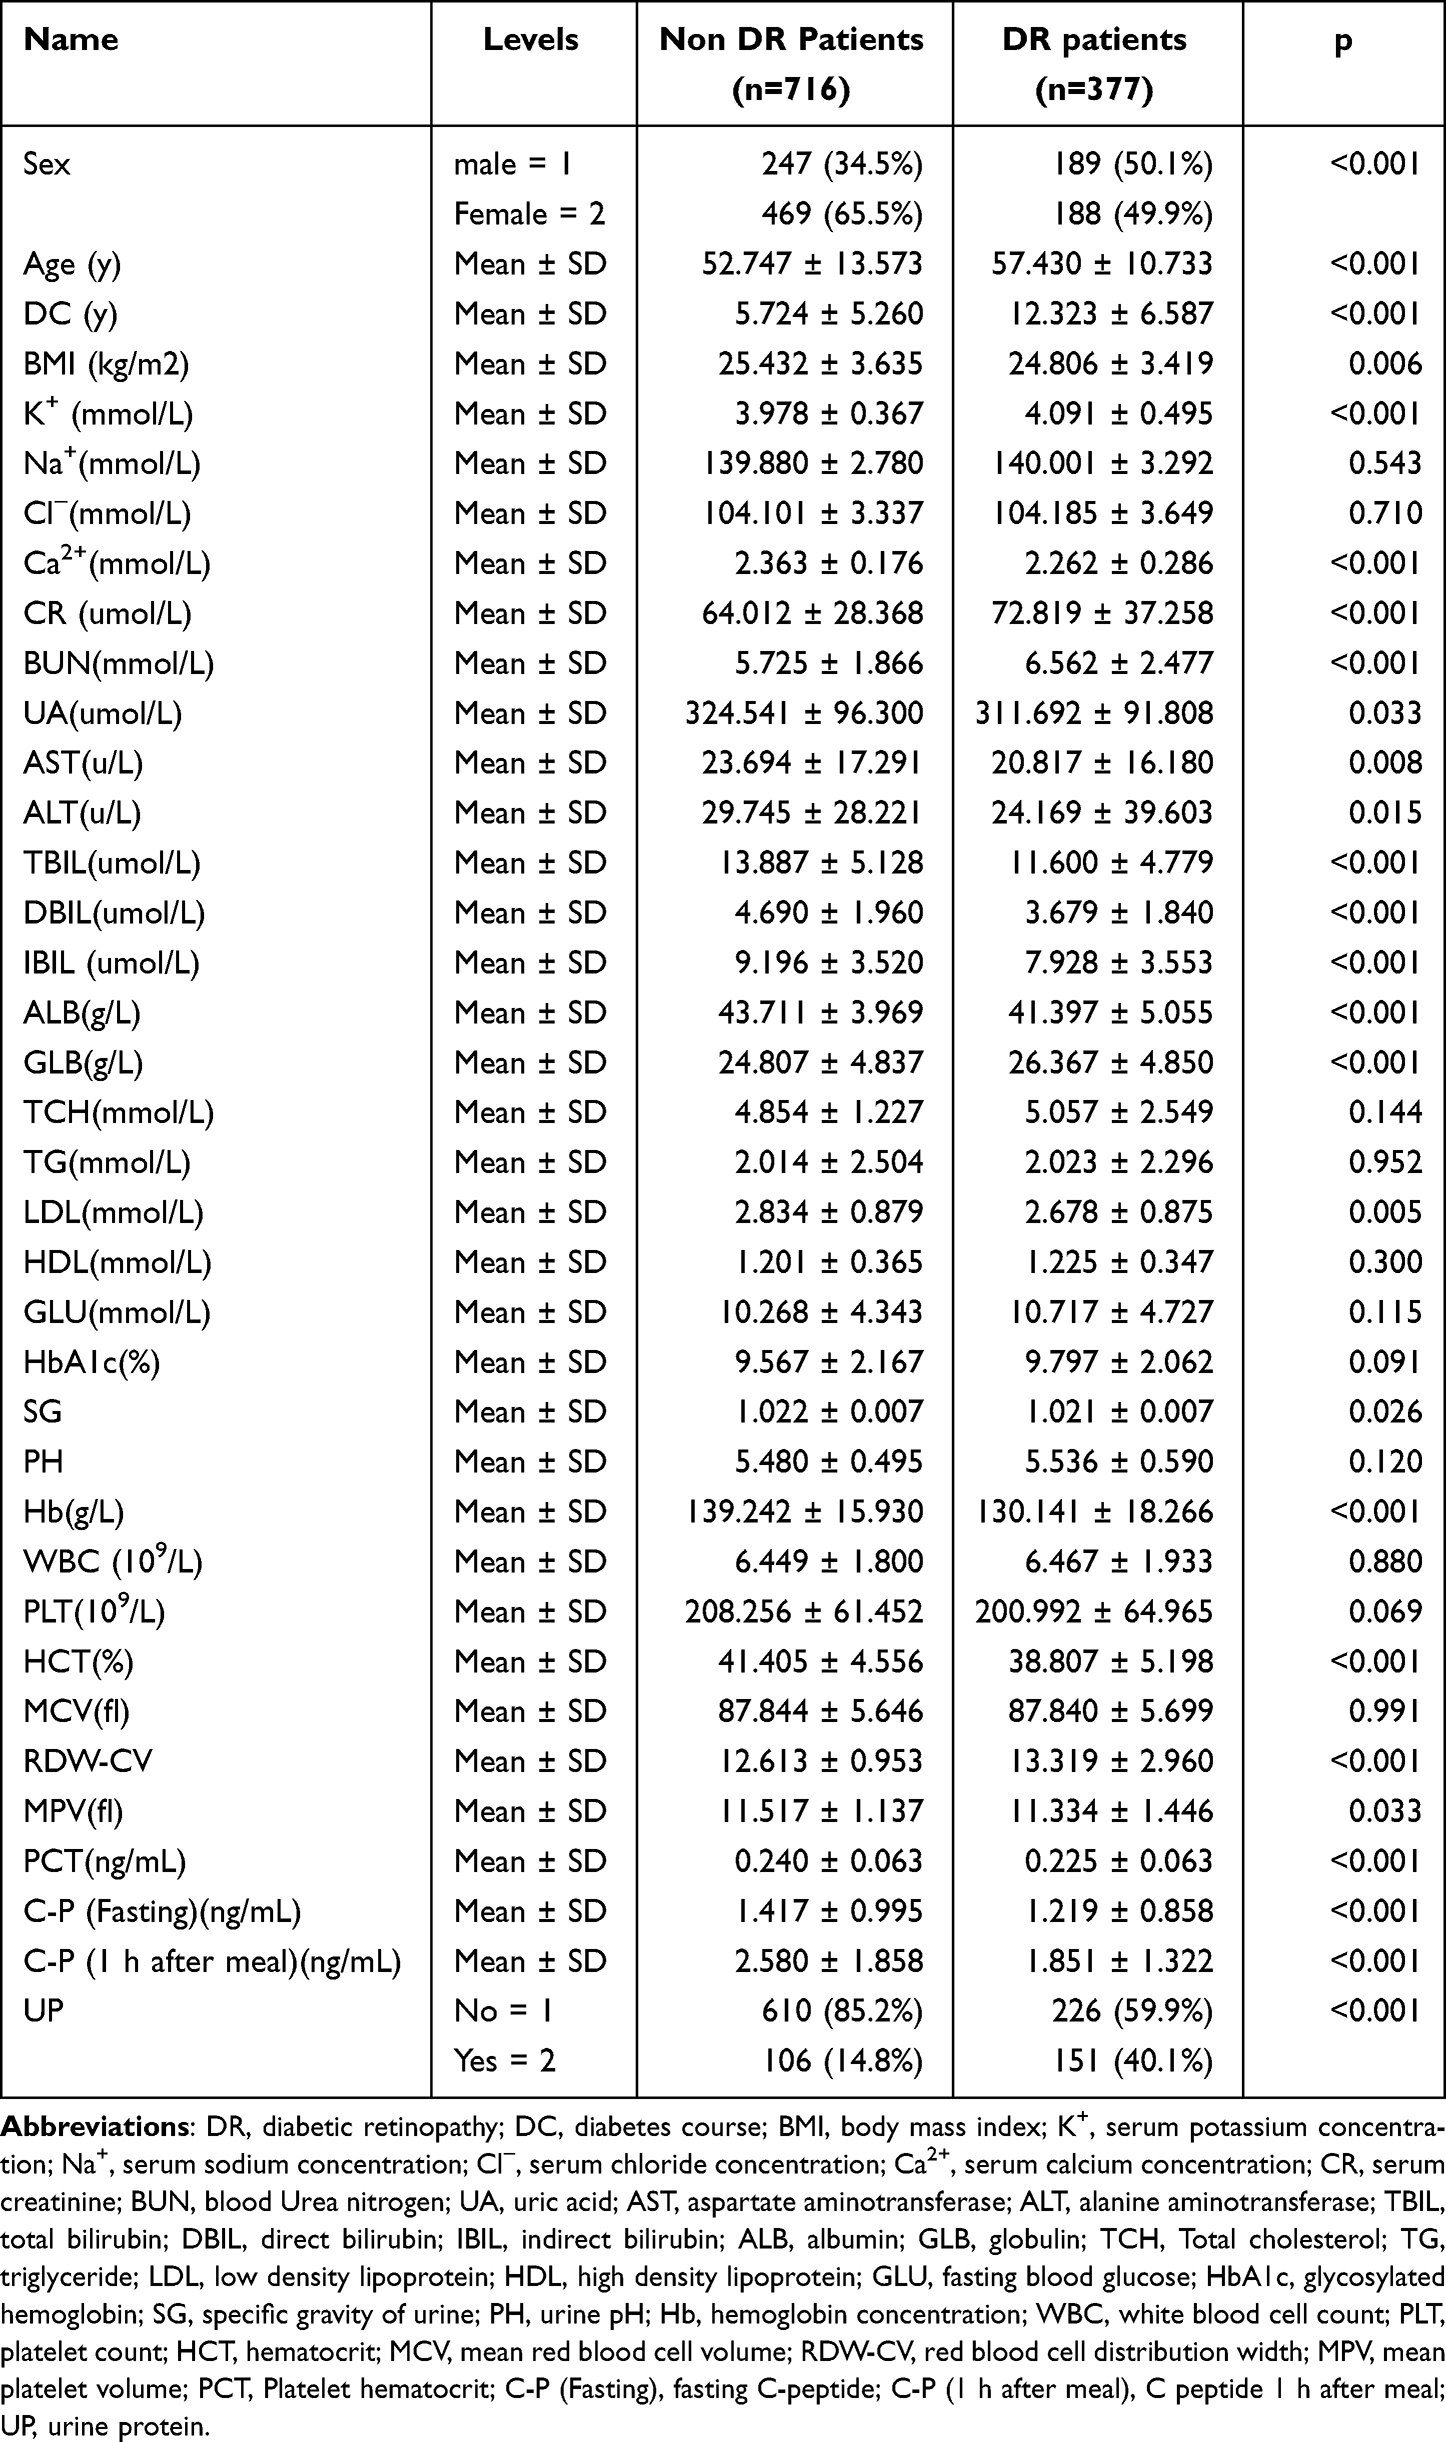 |
Table 1 DR Dataset |
Extreme Learning Machine
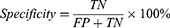
A single hidden layer neural network, an ELM, can be applied for classification, regression, and grouping.18 Different than other traditional neural networks that use error back propagation, the input layer coefficient of the ELM is constructed and fixed initially, and the output layer coefficient is directly calculated during training to use the input and output values of training data. The advantage of the ELM is its fast training speed, and its classification effect is better than that of ordinary SVM models. The image below depicts the principle of an extreme learning machine. Only one hidden layer in the neural network exists. In the figure, X represents the input feature vector of a sample, and the output of the ith node of the hidden layer is expressed as: hi(X)=G(ai, bi, x) for which ai and bi are input layer coefficients, and G(X) is a mapping function, such as  .
.
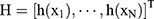
The vector 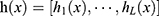 is formed from the output of L nodes in the hidden layer. The ELM produces
  as a result of its output, and
 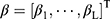 is the output layer’s coefficient. Three stages can also be used to train an extreme learning machine:
- Generate input layer coefficients randomly ai and bi,
- Calculate the
 output matrix for the hidden layer for which N represents the amount of training data, and
Assume that Y is the corresponding classification label vector of N samples. The optimal solution for calculating the number of output layers β should satisfy  . The beta optimal solution can be calculated by calculating
 for which the Moore-Penrose generalized inverse of the H matrix is denoted by H+. When the training is complete and the neural network’s input layer coefficients ai, bi and the output layer coefficients β have been determined, the ELM can categorize the test data (Figure 2).
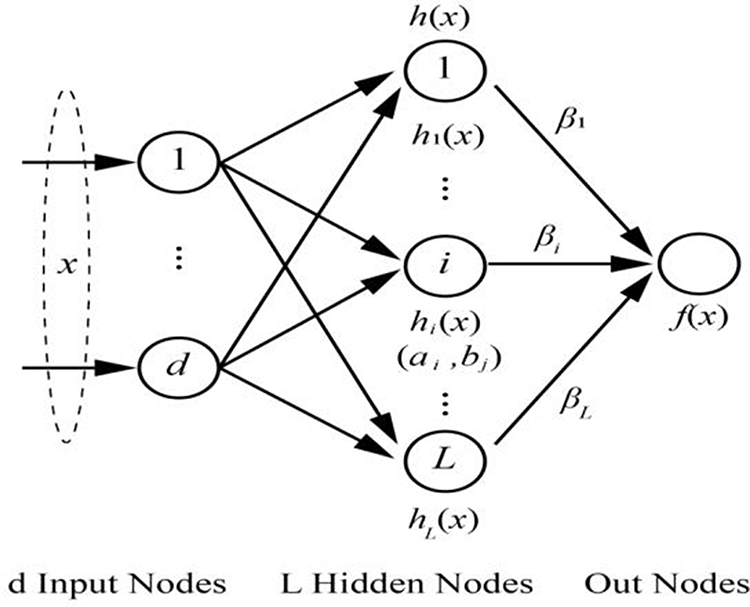 |
Figure 2 Basic principles of extreme learning machine (ELM). |
Ten-Fold Cross-Validation
All indicators in Table 1 are used to train the model. On average, the database was separated into 10 sections, nine of which were used for training the ELM and one for testing and diagnostics. The performance of the classifier was assessed on the test data after training, and the cycle was repeated 10 consecutive times until all objects had been utilized for one test.
Experimental Design
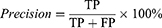
The most appropriate hidden neurons and activation functions should be solved to construct the ideal ELM model structure. Take 10-fold cross-validation to find the best model. The average of ten times was eventually chosen as the result to evaluate the model’s performance (Figure 3). The process was conducted on an AMD Athlon 64×2 Dual Core Processor 5000+ (2.6 GHz) with 4GB of RAM running Windows 7.
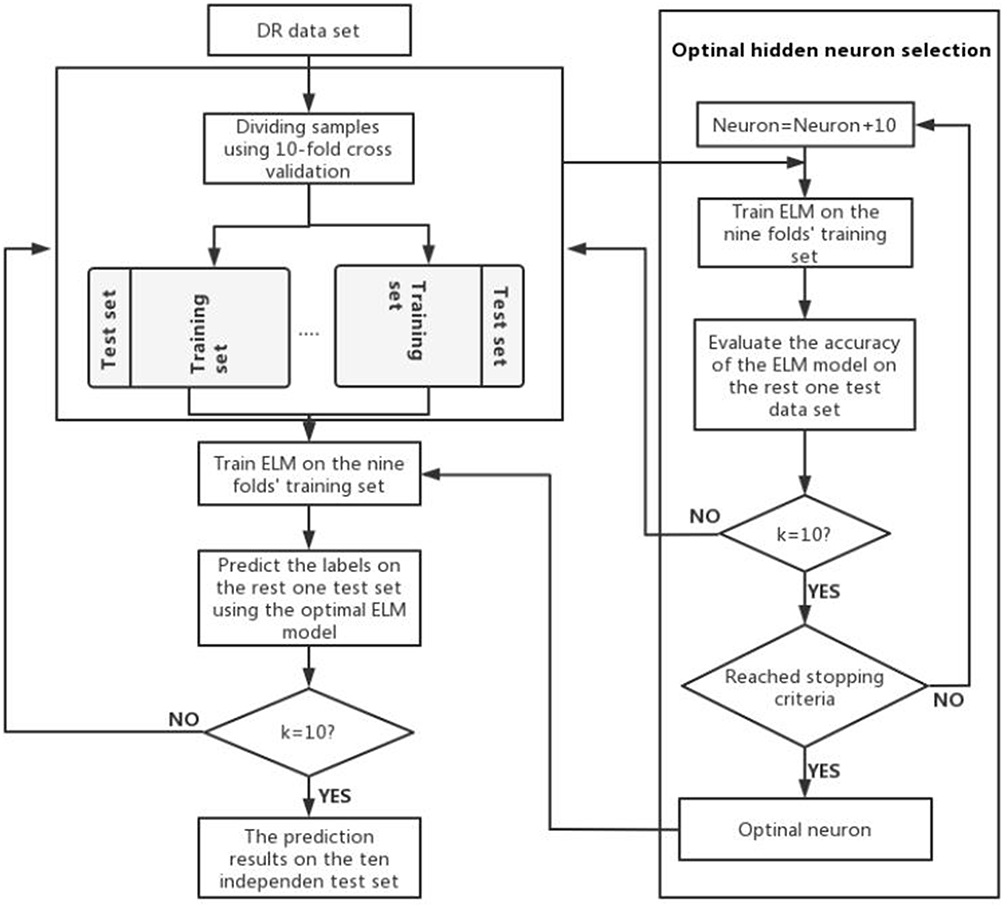 |
Figure 3 The Flow chart of prediction model. |
Evaluation Standard
Classification accuracy (ACC), sensitivity, specificity, Precision, Negative predictive value (NPV), Training time, and the area under the operating characteristic curve (ROC) of the subject (AUC) were used to evaluate the model’s quality.19 The definition is shown below:
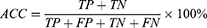
for which TP, FN, TN, and FP reflect the number of true positives, false negatives, true negatives, and false positives, respectively.
Results
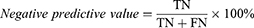
To develop the best classification model for DR, sigmoid (sig) activation functions that have shown good performance in previous disease diagnosis were selected for this study,20–22 and in the range of 10 to 200 hidden neurons, every 10 neurons was selected to build models. The ACC quality of the various models in the fold verification was checked separately for which ACC was the average value of each neuron independently running 30 times (Figure 4). This result shows that when the hidden neuron is 70, the model represented by ELM has the best performance. Finally, the activation function was chosen as sig, and hidden layer neuron 70 was employed to create the final model.
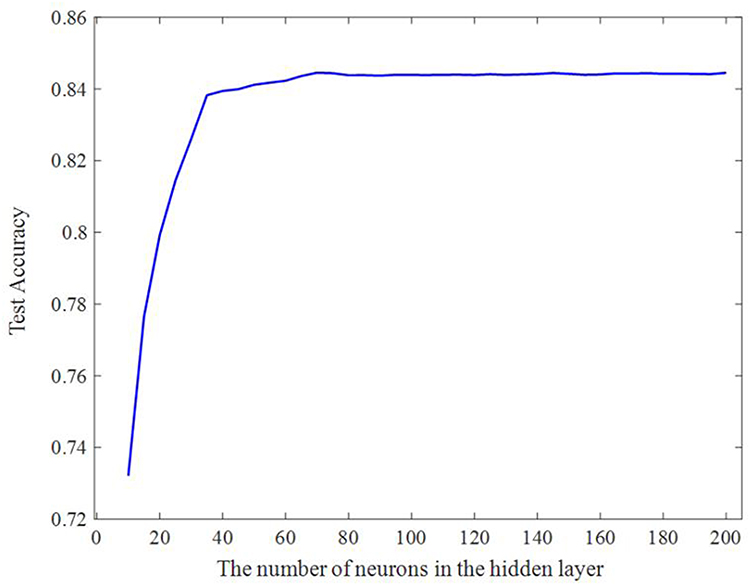 |
Figure 4 An association between classification accuracy (ACC) and number of distinct hidden neurons in the ELM (database of our hospital). |
The DR model classification performance was based on the ELM. The full findings under 10-CV are listed in table (Table 2). According to the table, this prediction model based on ELM consistently performed successfully with an ACC = 84.45%, Specificity = 93.16%, Precision = 83.93%, NPV = 84.64% and Sensitivity = 67.90%.
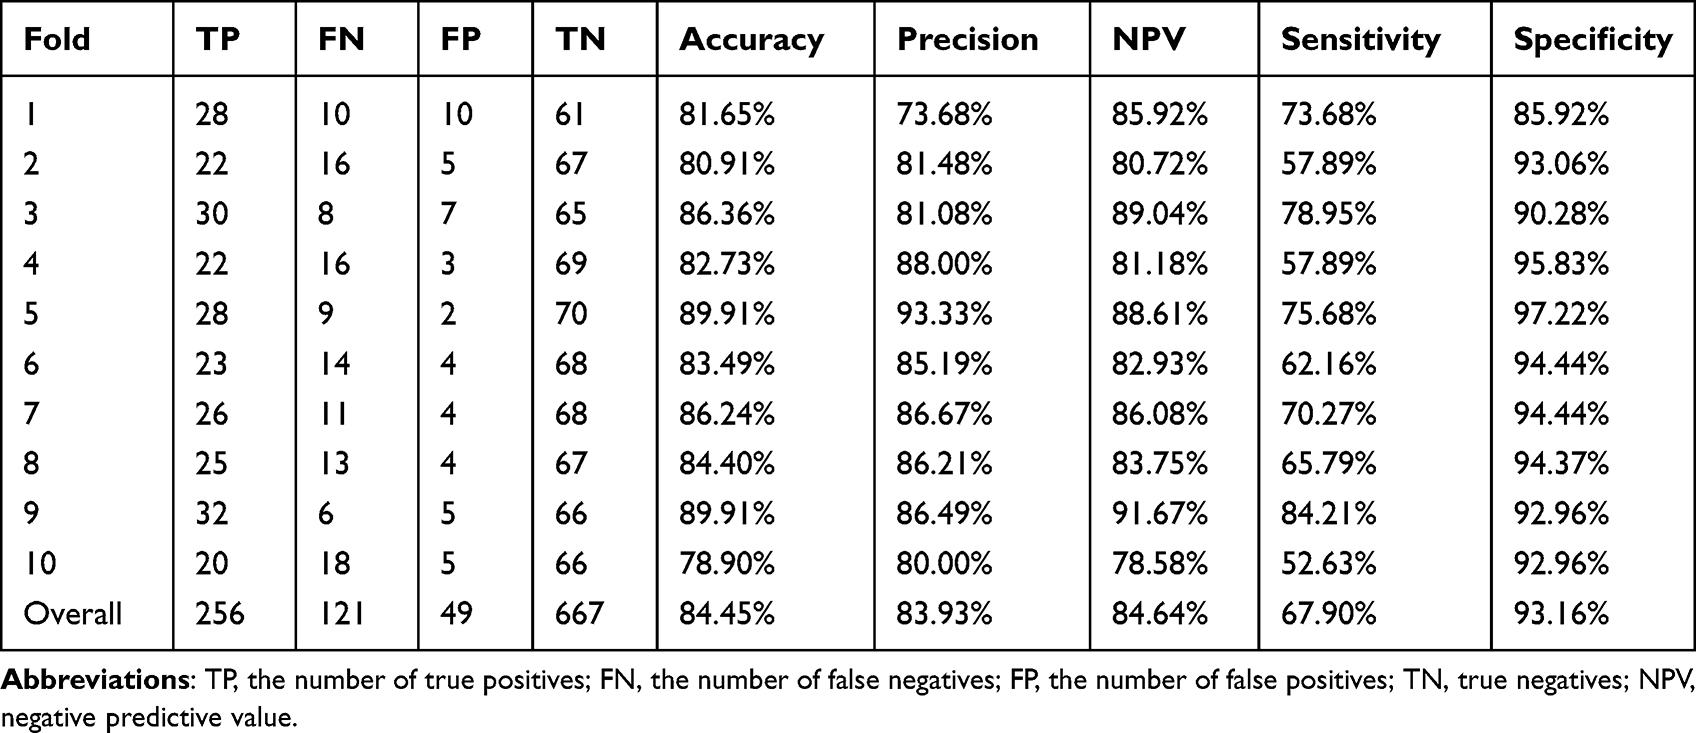 |
Table 2 The Extreme Learning Model (ELM) Model Produced Detailed Findings |
In order to better illustrate the predictive performance of elm based model for diabetes retinopathy, based on all the features of the same data set, we compared the prediction models based on KNN, ANN, SVM and RF by using the method of 10-CV. KNN, ANN, SVM and RF related parameters have been adjusted as follows: KNN: Number of nearest neighbors: 5, Distance: euclidean; ANN: Number of neurons in the hidden layer: 20, Type of activation function: purelin (line transfer function), epochs = 100; RF: Number of trees: 300; SVM: type of kernel function: radial basis function, the parameter of C-SVC C = 2.0, gamma = 0.3 in kernel function. The outcomes are shown in as table(Table 3), the DR prediction model based on ELM and SVM performed better with respect to ACC, Precision, NPV, Sensitivity and Specificity than KNN, ANN, and RF. Among them, the training time of DR prediction model based on elm is significantly better than that of Dr prediction model based on SVM. 1.24 s and 148.07s, respectively.
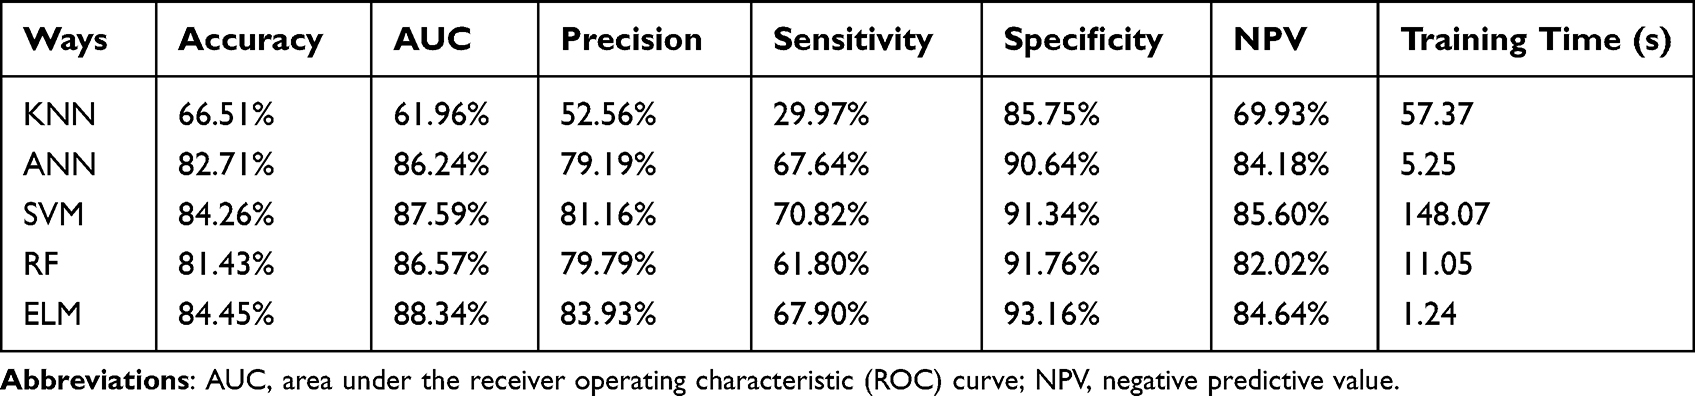 |
Table 3 Extreme Learning Machine, Support Vector Machine, Artificial Neural Network, Random Forest, and k-Nearest Neighbor (ELM, SVM, ANN, RF, and KNN, Respectively) Classification Performances Were Compared |
This research involves various prediction models using the AUC of performance as shown in Figure (Figure 5). The prediction model of DR based on ANN, RF, SVM, and ELM performed well with respect to AUC, among which the prediction model of DR based on ELM had the best overall performance, while the prediction model based on KNN had the worst performance.
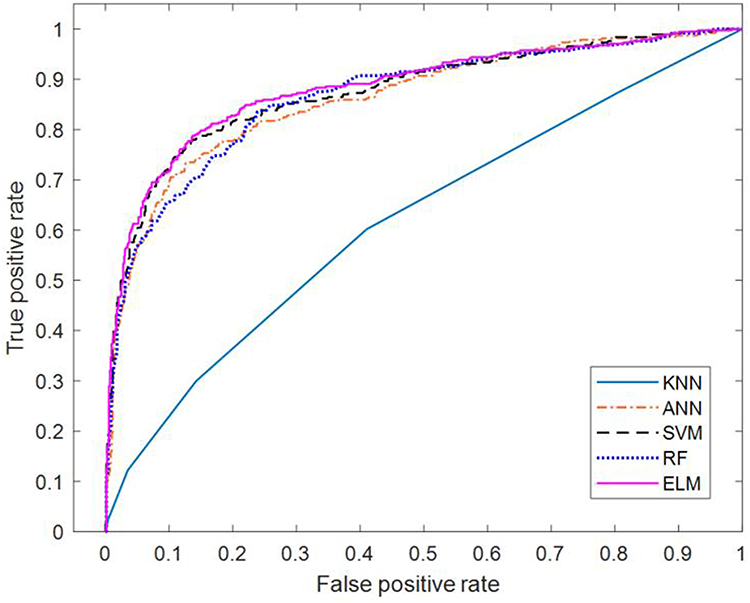 |
Figure 5 Receiver operating characteristic (ROC) curves corresponding to each model(database of our hospital). |
Discussion
Because of its quick learning speed, good generalization capabilities, and ease of application, ELM has stimulated interest of a wide range of sectors. This model has been applied in palmprint recognition,23 medical treatment,24–28 motion image classification,29 communication networks,30 environmental management,31 water quality detection,32 and agricultural production,33 and has a good performance. However, no reports about ELM applied to DR classification have been published.
Currently, the DR prediction models based on AI are mainly divided into two categories. (1) DR prediction model established based on fundus photo images. For example, researchers from Singapore published a very influential study and proposed a DR analysis machine learning system using fundus images. In that study, Ting’s team used about half a million retinal images for model building and validation. The sensitivity of the system for detecting DR was 90.5%, a result that was comparable to 91.5% for professional raters who evaluated the same data set.34 Casanova et al predicted DR using a double-cross-validated RF, and the results show an accuracy rate of 75%.35 RetmarkerDR software was developed in Portugal and has a CE marking indicating type IIa level of medical equipment. In 2011 in central Portugal, human classification based on the implementation of DR screening scheme was implemented. The scheme can accurately and precisely identify threats to vision resulting from DR complications. The installed automated method has the ability to minimize the personnel grading burden by 48.42%.36 Although the above DR prediction model has excellent performance and can reduce the need for human resources, the DR prediction model using retinal images still requires professional ophthalmologist and expensive medical equipment, and is only used for DR screening in some developed countries. China, as a developing country with the world’s highest diabetic population, is particularly vulnerable to the lack of such resources, especially in rural regions, and overall, is not equipped for this type of diabetes screening. (2) DR prediction model based on physiological and biochemical indicators, mainly using demographic data, medical history, and blood and urine test results. Published studies mostly use SVM, ANN, RF, and decision trees to classify DR. For example, Tsao et al used 10 characteristic indicators to compare various machine learning algorithms in 536 patients with diabetes and classified DR using a 5x cross validation. The accuracy of the SVM was found to be 79.5%, which was superior to decision tree, ANN, and logistic regression.37 A study in a community in northeast China enrolled 530 community members (including 107 non-diabetic individuals, 372 diabetic patients without DR, and 51 diabetic patients with DR) as study subjects and classified them using an ANN algorithm. The model’s AUC was 0.84, and its specificity was 0.83 according to the results. The model performed well in terms of DR prediction.38 In another study based on the KNHANES V-1 and KNHANESV-2 databases, the LASSO-based model effectively predicted DR using the physiological and biochemical indicators of 327 diabetic patients with an AUC of 0.82 and ACC of 0.752. These methods proved to be better than the DR prediction model based on SVM, ANN, RF, and KNN.39 When these findings were compared to our findings, it can be seen that with the exception of the KNN-based prediction model, other prediction models of DR show better performance among the DR prediction models based on various machine learning techniques used in this study. The differences might be attributed to more specific indicators, regional differences, varying sample sizes, and the fact that it only looked at type 2 diabetes.
Using the same datasets, DR prediction models based on KNN, ANN, SVM, and RF were compared. Results show that ELM was better than KNN, ANN, SVM, and RF in terms of ACC, Precision, Specificity, and AUC, especially for the recognition of non-DR patients. In addition, the time required for the training process of ELM, SVM, KNN, ANN, and RF was also recorded in this study. SVM takes 148.07 s, ANN 5.25 s, RF11.05s and ELM 1.24s. In conclusion, the ELM-based model of DR shows good classification accuracy, Precision, Specificity, AUC, and computational efficiency, making it suitable for clinical use. This model appears to be an efficient tool for the diagnosis of DR.
At present, although this model has good performance in accuracy, Precision, Specificity, AUC and computational efficiency, it still has some shortcomings. (1) The study sample size is not very big at present, particularly in individuals with DR, leading to lower sensitivity of the model when compared with other evaluation index performances. Additionally, this study was only a single center study, not a multicenter samples epidemiological survey; thus, the data from the same medical center also has case selection bias. In the follow-up research work, our research team intends to collaborate with other centers to further refine and increase the predictive value of the model utilizing their clinical data. (2) Furthermore, because in the age of evidence-based medicine, this model can be converted to medical practices in the future, several challenges, such as patient acceptability, ethics, and clinical deployment, still need to be addressed. Therefore, the following research should focus on the establishment of a user interface, ethical supervision, and the nature of the “black box” algorithm. A website or an Android app should then be created to make DR predictions for new patients. This process will certainly help reduce the pressure on ophthalmologists and minimize the cost of screening patients. A clinical decision support system based on our results could revolutionize the current disease diagnosis model in the future and make a significant contribution to screening of DR.
Conclusion
This research developed an ELM-based DR prediction model that was established using physiological and biochemical markers and performed well in DR prediction. In future, this type of system will play a crucial role in the screening of DR.
Ethical Statement
The ethics involved in the design of this study has been reviewed by the ethics committee of Lu’an Hospital of Anhui Medical University in China (Ethics Approval No:2021LL015), and all subjects signed informed consent. The Helsinki Declaration serves as the foundation for this research.
Data
The relevant database can be obtained from the corresponding author if necessary.
Acknowledgment
We thank the staff of the information department and medical records department of Lu’an Hospital of Anhui Medical University for their technical help.
Funding
There is no relevant fund for this study.
Disclosure
In the process of writing the paper, it was not affected by stakeholders and no potential conflict of interest was found.
References
1. Sun H, Saeedi P, Karuranga S., et al. IDF Diabetes Atlas: global, regional and country-level diabetes prevalence estimates for 2021 and projections for 2045. Diabetes Res Clin Pract. 2022;183:109119.
2. American Diabetes Association. 2. Classification and diagnosis of diabetes: standards of medical care in diabetes-2021. Diabetes Care. 2021;44(Suppl 1):S15–S33.
3. Calderon GD, Juarez OH, Hernandez GE, Punzo SM. De la Cruz ZD. Oxidative stress and diabetic retinopathy: development and treatment. Eye. 2017;31(8):1122–1130.
4. Liew G, Michaelides M, Bunce C. A comparison of the causes of blindness certifications in England and Wales in working age adults (16-64 years), 1999-2000 with 2009-2010. BMJ Open. 2014;4(2):e4015.
5. Viswanath K, McGavin DD. Diabetic retinopathy: clinical findings and management. Community Eye Health. 2003;16(46):21–24.
6. Abramoff MD, Niemeijer M, Suttorp-Schulten MS, Viergever MA, Russell SR, van Ginneken B. Evaluation of a system for automatic detection of diabetic retinopathy from color fundus photographs in a large population of patients with diabetes. Diabetes Care. 2008;31(2):193–198.
7. Resnikoff S, Felch W, Gauthier TM, Spivey B. The number of ophthalmologists in practice and training worldwide: a growing gap despite more than 200,000 practitioners. Br J Ophthalmol. 2012;96(6):783–787.
8. Shi R, Niu Z, Wu B, et al. Nomogram for the risk of diabetic nephropathy or diabetic retinopathy among patients with type 2 diabetes mellitus based on questionnaire and biochemical indicators: a cross-sectional study. Diabetes Metab Syndr Obes. 2020;13:1215–1229.
9. Chen X, Xie Q, Zhang X, Lv Q, Liu X, Rao H. Nomogram prediction model for diabetic retinopathy development in type 2 diabetes mellitus patients: a retrospective cohort study. J Diabetes Res. 2021;2021:3825155.
10. Grzybowski A, Brona P, Lim G, et al. Artificial intelligence for diabetic retinopathy screening: a review. Eye. 2020;34(3):451–460.
11. Wu JH, Liu T, Hsu WT, Ho JH, Lee CC. Performance and limitation of machine learning algorithms for diabetic retinopathy screening: meta-analysis. J Med Internet Res. 2021;23(7):e23863.
12. Tsao HY, Chan PY, Su EC. Predicting diabetic retinopathy and identifying interpretable biomedical features using machine learning algorithms. BMC Bioinform. 2018;19(Suppl 9):283.
13. Ogunyemi OI, Gandhi M, Tayek C. Predictive models for diabetic retinopathy from non-image teleretinal screening data. AMIA Jt Summits Transl Sci Proc. 2019;2019:472–477.
14. Goudarzi G, Hopke PK, Yazdani M. Forecasting PM2.5 concentration using artificial neural network and its health effects in Ahvaz, Iran. Chemosphere. 2021;283:131285.
15. Zhang Z. Introduction to machine learning: k-nearest neighbors. Ann Transl Med. 2016;4(11):218.
16. Svetnik V, Liaw A, Tong C, Culberson JC, Sheridan RP, Feuston BP. Random forest: a classification and regression tool for compound classification and QSAR modeling. J Chem Inf Comput Sci. 2003;43(6):1947–1958.
17. Chen H, Peng J, Zhou Y, Li L, Pan Z. Extreme learning machine for ranking: generalization analysis and applications. Neural Netw. 2014;53:119–126.
18. Saratchandran P. Extreme learning machine for regression and multiclass classification. IEEE Transactions Sys Man Cybernetics Part B. 2012;42(2):513–529.
19. Metz CE. Basic principles of ROC analysis. Semin Nucl Med. 1978;8(4):283–298.
20. Zhang R, Huang GB, Sundararajan N, Saratchandran P. Multi-category classification using an Extreme Learning Machine for microarray gene expression cancer diagnosis. IEEE/ACM Trans Comput Biol Bioinform. 2007;4(3):485–495.
21. Hu L, Hong G, Ma J, Wang X, Chen H. An efficient machine learning approach for diagnosis of paraquat-poisoned patients. Comput Biol Med. 2015;59:116–124.
22. Chen H, Yang B, Liu D, et al. Using blood indexes to predict overweight statuses: an extreme learning machine-based approach. PLoS One. 2015;10(11):e143003.
23. Lu L, Zhang X, Xu X. Hypercomplex extreme learning machine with its application in multispectral palmprint recognition. PLoS One. 2019;14(4):e209083.
24. Toprak A. Extreme Learning Machine (ELM)-Based Classification of Benign and Malignant Cells in Breast Cancer. Med Sci Monit. 2018;24:6537–6543.
25. Shi B, Ye H, Zheng L, et al. Evolutionary warning system for COVID-19 severity: colony predation algorithm enhanced extreme learning machine. Comput Biol Med. 2021;136:104698.
26. Zainuddin A, Mansor W, Lee KY, Mahmoodin Z. Comparison of Extreme Learning Machine and K-Nearest Neighbour Performance in Classifying EEG Signal of Normal, Poor and Capable Dyslexic Children. Annu Int Conf IEEE Eng Med Biol Soc. 2019;2019:4513–4516.
27. Kuppili V, Biswas M, Sreekumar A, et al. Extreme learning machine framework for risk stratification of fatty liver disease using ultrasound tissue characterization. J Med Syst. 2017;41(10):152.
28. Kanimozhi N, Singaravel G. Hybrid artificial fish particle swarm optimizer and kernel extreme learning machine for type-II diabetes predictive model. Med Biol Eng Comput. 2021;59(4):841–867.
29. Zhang L, Wen D, Li C, Zhu R. Ensemble classifier based on optimized extreme learning machine for motor imagery classification. J Neural Eng. 2020;17(2):26004.
30. Xie J, Liu S, Dai H. Distributed semi-supervised learning algorithm based on extreme learning machine over networks using event-triggered communication scheme. Neural Netw. 2019;119:261–272.
31. Yi HS, Park S, An KG, Kwak KC. Algal bloom prediction using extreme learning machine models at artificial weirs in the Nakdong River, Korea. Int J Environ Res Public Health. 2018;15:10.
32. Anmala J, Turuganti V. Comparison of the performance of decision tree (DT) algorithms and extreme learning machine (ELM) model in the prediction of water quality of the Upper Green River watershed. Water Environ Res. 2021;93(11):2360–2373.
33. Ali M, Deo RC, Xiang Y, et al. Coupled online sequential extreme learning machine model with ant colony optimization algorithm for wheat yield prediction. Sci Rep. 2022;12(1):5488.
34. Ting D, Cheung CY, Lim G, et al. Development and validation of a deep learning system for diabetic retinopathy and related eye diseases using retinal images from multiethnic populations with diabetes. JAMA. 2017;318(22):2211–2223.
35. Casanova R, Saldana S, Chew EY, Danis RP, Greven CM, Ambrosius WT. Application of random forests methods to diabetic retinopathy classification analyses. PLoS One. 2014;9(6):e98587.
36. Ribeiro L, Oliveira CM, Neves C, Ramos JD, Ferreira H, Cunha-Vaz J. Screening for diabetic retinopathy in the central region of Portugal. Added value of automated ‘Disease/No Disease’ grading. Ophthalmologica. 2014;1:548.
37. Tsao HY, Chan PY, Su EC. Predicting diabetic retinopathy and identifying interpretable biomedical features using machine learning algorithms. BMC Bioinform. 2018;19:283.
38. Yao L, Zhong Y, Wu J, et al. Multivariable logistic regression and back propagation artificial neural network to predict diabetic retinopathy. Diabetes Metab Syndr Obes. 2019;12:1943–1951.
39. Oh E, Yoo TK, Park EC. Diabetic retinopathy risk prediction for fundus examination using sparse learning: a cross-sectional study. BMC Med Inform Decis Mak. 2013;13:106.
 © 2022 The Author(s). This work is published and licensed by Dove Medical Press Limited. The
full terms of this license are available at https://www.dovepress.com/terms
and incorporate the Creative Commons Attribution
- Non Commercial (unported, 3.0) License.
By accessing the work you hereby accept the Terms. Non-commercial uses of the work are permitted
without any further permission from Dove Medical Press Limited, provided the work is properly
attributed. For permission for commercial use of this work, please see paragraphs 4.2 and 5 of our Terms.
© 2022 The Author(s). This work is published and licensed by Dove Medical Press Limited. The
full terms of this license are available at https://www.dovepress.com/terms
and incorporate the Creative Commons Attribution
- Non Commercial (unported, 3.0) License.
By accessing the work you hereby accept the Terms. Non-commercial uses of the work are permitted
without any further permission from Dove Medical Press Limited, provided the work is properly
attributed. For permission for commercial use of this work, please see paragraphs 4.2 and 5 of our Terms.
Recommended articles
Construction of a Nomogram-Based Prediction Model for the Risk of Diabetic Kidney Disease in T2DM
Wang X, Liu X, Zhao J, Chen M, Wang L
Diabetes, Metabolic Syndrome and Obesity 2024, 17:215-225
Published Date: 12 January 2024
Non-Linear Relationship Between Fasting C-Peptide and Retinopathy in Patients with Type 2 Diabetes Mellitus - A Retrospective Study
Ma J, Han C, Lv Y, Cai H
Diabetes, Metabolic Syndrome and Obesity 2025, 18:1035-1045
Published Date: 7 April 2025
Development and Validation of a Nomogram-Based Risk Prediction Model for Diabetic Retinopathy in Elderly Adults with Type 2 Diabetes Mellitus
Chen M, Niu T, Sun Y, Chang M, Liu S, Xu T, Cui H
Diabetes, Metabolic Syndrome and Obesity 2025, 18:2509-2523
Published Date: 25 July 2025