Back to Journals » Cancer Management and Research » Volume 14
Development and Validation of a Comprehensive Model for Predicting Distant Metastasis of Solid Lung Adenocarcinoma: 3D Radiomics, 2D Radiomics and Clinical Features
Authors Peng Z, Lin Z, He A, Yi L, Jin M, Chen Z, Tao Y, Yang Y, Cui C, Liu Y, Zuo M ![]()
Received 18 October 2022
Accepted for publication 19 November 2022
Published 13 December 2022 Volume 2022:14 Pages 3437—3448
DOI https://doi.org/10.2147/CMAR.S393058
Checked for plagiarism Yes
Review by Single anonymous peer review
Peer reviewer comments 2
Editor who approved publication: Professor Seema Singh
Zhiwei Peng,* Ze Lin,* Anjing He,* Li Yi, Mengni Jin, Zhiyong Chen, Yahong Tao, Yuhua Yang, Can Cui, Ying Liu, Minjing Zuo
Department of Radiology, The Second Affiliated Hospital of Nanchang University, Nanchang, People’s Republic of China
*These authors contributed equally to this work
Correspondence: Minjing Zuo, Email [email protected]
Objective: To develop and validate models for predicting distant metastases in patients with solid lung adenocarcinomas using 3D radiomic features, 2D radiomic features, clinical features, and their combinations.
Methods: This retrospective study included 253 eligible patients with solid adenocarcinoma of the lung diagnosed at our hospital between August 2018 and August 2021. 3D and 2D regions of interest were segmented from computed tomography-enhanced thin-slice images of the venous phase, and 851 radiomic features were extracted in each region. The Least Absolute Shrinkage and Selection Operator (LASSO) algorithm was used to select radiomic features and calculate radiomic scores, and logistic regression was used to develop the model. Development of a 3D radiomics model (model 1), a 2D radiomics model (model 2), a combined 3D radiomics and 2D radiomics model (model 3), a clinical model (model 4), and a comprehensive model (model 5) for the prediction of distant metastases in patients with solid lung adenocarcinomas. Nomograms were drawn to illustrate model 5, and receiver operating characteristic (ROC) curve, calibration curve, and decision curve analysis (DCA) were used for model evaluation.
Results: The AUC (area under the curve) of model 1, model 2, model 3, model 4, and model 5 in the test set was 0.711, 0.769, 0.775, 0.829, and 0.892, respectively. The Delong test showed that AUC values were statistically different between model 5 and model 1 (p=0.001), and there was no statistical difference in AUC between the other models. Based on a comprehensive review of DCA, ROC curve, and Akaike information criterion (AIC), Model 5 is demonstrated to have better clinical utility, goodness of fit, and parsimony.
Conclusion: A comprehensive model based on 3D radiomic features, 2D radiomic features, and clinical features has the potential to predict distant metastasis in patients with solid lung adenocarcinomas.
Keywords: computed tomography, radiomics, lung neoplasms, adenocarcinoma of lung, distant metastasis
Introduction
According to the Global Cancer Statistics Report 2020, lung cancer is the second most common cancer after breast cancer, and its mortality rate ranks first among all cancers.1 Adenocarcinoma of the lung is the most common pathological form of lung cancer and occurs in the lung tissue distal to the bronchi of the lung segment. Most imaging manifestations are peripheral lung carcinomas, and early symptoms are often not obvious.2 Pure ground-glass and partially solid lung adenocarcinomas rarely develop lymph node and distant metastases.3,4 Lung adenocarcinomas with a ground glass component have excellent survival rates compared with solid lesions.5,6 Solid lung adenocarcinomas are more prone to distant metastases and are usually unresectable, requiring chemoradiotherapy, targeted therapy, or immunotherapy.7 Therefore, accurately determining whether patients with solid lung adenocarcinomas have developed distant metastases prior to treatment is of great importance for clinical staging and treatment decisions.
Histopathologic examination is the gold standard for the diagnosis of distant metastases in lung cancer,8 but it is invasive and cannot be used for screening. Many non-invasive imaging modalities, such as computed tomography (CT), magnetic resonance imaging (MRI) and positron emission tomography/computed tomography (PET/CT), are widely used to evaluate distant metastases in lung cancer patients.9,10 CT and MRI are the most commonly used clinical examination modalities for the diagnosis of distant metastases, but they often require systemic examination of the head, neck, chest and abdomen. The radiation exposure, high cost, and high false-positive rate of PET/CT limit its wide clinical application.11 Therefore, there is an urgent need for a comprehensive, accurate, simple, and noninvasive method to assess distant metastasis in lung cancer patients.
In recent years, with the rapid development of artificial intelligence, radiomics has become established in the field of radiology. Radiomics refers to the extraction and analysis of quantitative image features, invisible to the naked eye, from medical images, combined with machine learning or deep learning algorithms to investigate their possible links to biological and clinical outcomes.12 Radiomics has been studied in the aspects of pathological detection, diagnosis prediction, gene mutation, treatment strategy, follow-up, efficacy evaluation, and prognosis of lung cancer.13 In addition, radiomics has obvious advantages in evaluating tumor heterogeneity and may be able to comprehensively and accurately predict distant metastasis of adenocarcinoma of the lung.
In some previous studies, Chen et al14 limited themselves to predicting brain metastases in lung adenocarcinomas, and Tao et al15 did not exclude subsolid lung carcinomas, which rarely have distant metastases. In addition, most previous studies extracted only three-dimensional radiomic features from CT images, and few studies extracted two-dimensional radiomic features. In the present study, we developed and validated a comprehensive model based on contrast-enhanced CT-based 3D and 2D radiomic features combined with clinical parameters to predict distant metastasis in patients with solid lung adenocarcinomas.
Methods
Patients and Clinical Parameters
This study retrospectively analyzed 1848 patients with lung adenocarcinoma who were pathologically diagnosed at our hospital between August 2018 and August 2021. Inclusion criteria: (1) patients with lung adenocarcinoma diagnosed by surgery or biopsy; (2) within 2 weeks before diagnosis, a contrast-enhanced chest CT examination was performed; (3) received brain CT/MRI, abdominal CT/MRI, and bone imaging within 2 weeks after chest examination. Exclusion criteria: (1) pure ground glass or partially solid lung adenocarcinoma; (2) multiple primary lung tumors or other malignant tumors; (3) venous phase images of the chest CT do not meet the conditions for segmentation (tumors with obstructive pneumonia or atelectasis, image artifacts, no thin-slice image or special scanning mode); (4) incomplete clinical data.
Finally, 253 patients with solid adenocarcinoma of the lung were included, and 123 patients (48.6%) developed distant metastases before treatment. A total of 175 patients before November 1, 2020, were classified as the training set, of which 87 patients had distant metastases and 88 patients did not. Seventy-eight patients after November 1, 2020, constituted the test set, of which 36 patients had distant metastases and 42 patients did not. Figure 1 shows the inclusion criteria, exclusion criteria, and grouping of patients.
 |
Figure 1 Patient recruitment process. Abbreviation: DM, distant metastases. |
In addition, the clinical parameters of the patients were recorded: Age, sex, smoking status, carcinoembryonic antigen (CEA), carbohydrate antigen 199 (CA199), location and largest diameter of the primary tumor, short diameter of the largest lymph node, clinical TNM stage, and CT semantic features (lobulation, burr, pleural indentation, cavity). The CT semantic features were observed and analyzed by two radiologists (with 4 and 8 years of professional experience, respectively) without knowledge of the results of distant metastases. Lobulation sign: defined as at least three arcuate depressions at the tumor margin; burr sign: defined as a line extending from the tumor margin to the surrounding parenchyma without reaching the pleura; pleural depression sign: referring to the tumor pulling the adjacent pleura; cavity: at least 5mm air shadow inside the tumor. Clinical TNM staging is based on the 8th edition of the TNM staging criteria for lung cancer published by the International Association for the Study of Lung Cancer (IASLC).16 Distant metastases are diagnosed based on histologic examination or apparent progression or shrinkage of lesions after antitumor treatment.
CT Image Acquisition
All patients underwent enhanced chest CT scan within 2 weeks before diagnosis. Scans were performed with the Siemens SOMATOM Definition Flash CT and GE REVOLUTION HD CT. The patient was examined in supine position. The scan was started after the patient stopped breathing at the end of inspiration, and the scan extended from the base of the lung to the level of the thoracic inlet. The slice thickness during image reconstruction was 1.0 or 1.25 mm. Other relevant scan parameters can be found in Supplementary Table 1.
Segmentation and Feature Extraction
The region of interest (ROI) of the primary tumor was segmented by a radiologist using 3D Slicer software (version 4.11; https://www.slicer.org/), and the ROI included bronchi, blood vessels, necrosis and calcification within the lesion, etc, but not normal lung tissue. Because the included lesions were solid lung adenocarcinomas, delineation was performed at the mediastinal window (window width 350, window level 40) and a 3D ROI was obtained by setting the lower threshold of the mediastinal window (−135HU) to delineate each layer of the lesion layer by layer semi-automatically; in combination with coronal and sagittal images, the largest cross-section of the lesion was selected to outline a 2D ROI. Radiomic feature extraction using PyRadiomics in the 3D slicer extension extracted 851 features per ROI, including 14 shape features, 18 first-order features, 24 Gray Level Co-occurrence Matrix (GLCM) features, 14 Gray Level Dependence Matrix (GLDM) features, 16 Gray Level Run Length Matrix (GLRLM) features, 16 Gray Level Size Zone Matrix (GLSZM) features, 5 Neighboring Gray Tone Difference Matrix (NGTDM) features, and 744 wavelet features (all feature names are listed in Supplementary Table 2).
The settings for image preprocessing are as follows: Gray level discretization (the bin width is fixed at 25), and the image is resampled into voxels of size 1*1*1.
To assess the reproducibility of the radiomics signature, we randomly selected 30 patients who were segmented by another radiologist 1 month later. None of them had information about clinical and pathologic details. Subsequently, the features extracted from the two segmentations were subjected to inter-rater correlation coefficient (ICC) analysis, and the features with an ICC ≥0.75 were selected. Figure 2 is a flowchart of this study.
 |
Figure 2 Flowchart of this study: 3D and 2D ROI segmentation (A), feature extraction (B), feature selection and model development (C), and model evaluation (D). |
Feature Selection, and Model Development and Validation
Radiomic features were normalized with the Z-score before feature screening. The 3D and 2D radiomic features were screened separately using the LASSO algorithm. Univariate analysis and multivariate logistic regression analysis were performed to search for meaningful clinical parameters. Training data were used for both feature screening and modeling. A 3D radiomics model (model 1), the 2D radiomics model (model 2), a combined 3D radiomics and 2D radiomics model (model 3), a clinical model (model 4), and a comprehensive model consisting of 3D radiomics, 2D radiomics, and clinical parameters (model 5) were developed.
To evaluate the predictive power of each model, the ROC curve was constructed and AUC, accuracy, sensitivity, specificity, positive predictive value (PPV), and negative predictive value (NPV) were calculated. Delong’s test was used to compare AUC between models. DCA was used to evaluate the clinical utility of each model.17,18 AIC is used to compare and rank multiple models and emphasizes comparison of the goodness of fit of the models, taking into account the principle of parsimony. In general, the smaller the AIC value, the better the model fit and the simpler the model.19 The nomogram is used to represent model 5. The value assigned to each variable is scored on a scale from 0 to 100. The total score is obtained by adding the scores for each variable. The risk of distant metastases in patients with solid adenocarcinoma of the lung can be predicted by mapping the total score to the probability of the bottom. The calibration curve is used to evaluate the calibration degree of model 5.
Statistical Analysis
Description of clinical statistical method: a chi-square test or Fisher’s exact test was used for the nominal variable and expressed by the number and proportion. Continuous variables conforming to normal distribution are expressed by two independent samples t-test and mean and standard deviation. For continuous variable with abnormal distribution, Mann–Whitney U-test was used and expressed by median and quartile. All statistical analysis for the present study were performed using R (version 4.0.4; https://www.r-project.org) and Python (version 3.5.6; https://www.python.org). A two-sided p-value <0.05 indicated statistical significance.
Results
Clinical Characteristics
The patient baseline data sheet showed that there were essentially no significant differences in clinical characteristics between the training and test sets (see Supplementary Table 3). The results of the univariate analysis of the training set showed that there were statistically significant differences in burr sign, T stage, N stage, age, CEA, CA199, the largest diameter of the tumor, and the short diameter of the largest lymph node (Table 1). Immediately thereafter, multivariate logistic regression results showed that N stage, age, and CEA were independent predictors of distant metastases (Table 2).
 |
Table 1 Univariate Analysis of the Training Set and the Test Set |
 |
Table 2 Multivariate Logistic Regression Analysis of the Training Set |
Consistency Test
ICC was applied to measure the consistency between the two image segmentation and feature extraction processes. The ICC cut-off values recommended by Koo et al20 are as follows: poor reliability: ICC < 0.5; moderate reliability: 0.5 ≤ ICC < 0.75; good reliability: 0.75 ≤ ICC < 0.9; excellent reliability: 0.9 ≤ ICC. Atotal of 815 (95.8%) 3D radiomic features and 620 (72.9%) 2D radiomic features had good reliability (ICC ≥0.75), indicating that the extracted radiomic features were well reproducible. The results for ICC are described in more detail in Supplemental Table 4.
Selection of Radiomic Features and Establishment of Five Models
A total of 815 reliable 3D radiomic features were screened using LASSO, and the remaining 3 features were used to create Model 1. These three radiomic features were original_gldm_DependenceEntropy, original_glszm_ZoneEntropy, and wavelet-LLL_glszm_ZoneEntropy.
A total of 620 reliable 2D radiomic features were screened using LASSO (Supplementary Figure 1), and the remaining 6 features were used to build Model 2. These six radiomic features were original_shape_Elongation, original_gldm_DependenceEntropy, original_glrlm_RunEntropy, wavelet-LHL_glcm_Contrast, wavelet-LHL_glrlm_RunVariance, wavelet-LHH_glcm_Imc2.
We combined the above three radiomic features used to construct model 1 and the six radiomic features used to construct model 2 to construct model 3, and calculated the combined radiomics score (c-radscore) according to the weighting coefficient of the features. For more details, see Supplemental Table 5 and Supplemental Figure 2.
N stage, age, and CEA with statistical significance in univariate and multivariate analysis were selected to build the model 4.
Select N stage, age, CEA, and c-radscore to build model 5.
Performance of the Five Models
In the training set and test set, the AUC values of model 1 for predicting distant metastasis were 0.708 (0.645, 0.773) and 0.711 (0.612, 0.804), respectively, and the AUC values of model 2 were 0.746 (0.682, 0.805) and 0.769 (0.681, 0.852), the AUC values of model 3 were 0.761 (0.701, 0.819) and 0.775 (0.686, 0.86), the AUC values of model 4 were 0.819 (0.763, 0.872) and 0.829 (0.752, 0.904), and the AUC values of model 5 were 0.857 (0.808, 0.901) and 0.892 (0.829, 0.949), respectively. The predictive performance of each model is shown in Table 3, and the ROC curve is shown in Figure 3.
 |
Table 3 Performance Evaluation of Five Models in the Training Set and the Test Set |
 |
Figure 3 Receiver operating characteristic curves of five models in training set (A) and test set (B). |
The Delong test showed that the AUC values of model 5 and model 1 were statistically different in the test set (p=0.001 < 0.05/10, corrected by Bonferroni method21), and there was no statistical difference in AUC between the other models (see Supplementary Table 6 for details). DCA was used to evaluate the clinical utility of five predictive models by calculating the net gains at different probability thresholds. DCA (Figure 4) shows that model 5 predicts a higher net benefit for distant metastases than the other four models and all or no treatment strategy in both training and test sets when the threshold probability is approximately between 10% and 90%. The AIC values of the five models were 228.521, 223.886, 224.871, 192.447, and 176.645, with the AIC value of model 5 being the smallest. Based on a comprehensive consideration of DCA, ROC curve and AIC, it is proved that model 5 has better clinical utility, goodness of fit and parsimony.
 |
Figure 4 Decision curve analysis for five models in training set (A) and test set (B). The y-axis represents the net benefit and the x-axis represents the threshold probability. The black, red, green, blue, and purple lines represent the net gains for model 1, model 2, model 3, model 4, and model 5, respectively. The gray line represents the assumption that all patients had distant metastases. The black line represents the assumption that all patients had no distant metastases. |
Therefore, we created a nomogram of model 5 to facilitate clinical application (Figure 5). In addition, the calibration curve for model 5 (Figure 6) showed good agreement between its prediction of distant metastases and the actual situation. The Hosmer–Lemeshow test showed that model 5 was a good fit and was not statistically different from the ideal perfect model (p=0.642 > 0.05).
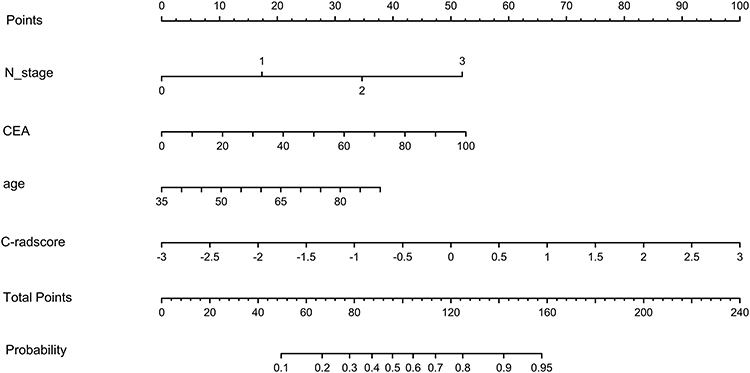 |
Figure 5 Nomogram for model 5. Abbreviation: c-radscore, radiomic score combining 3D and 2D radiomic features. |
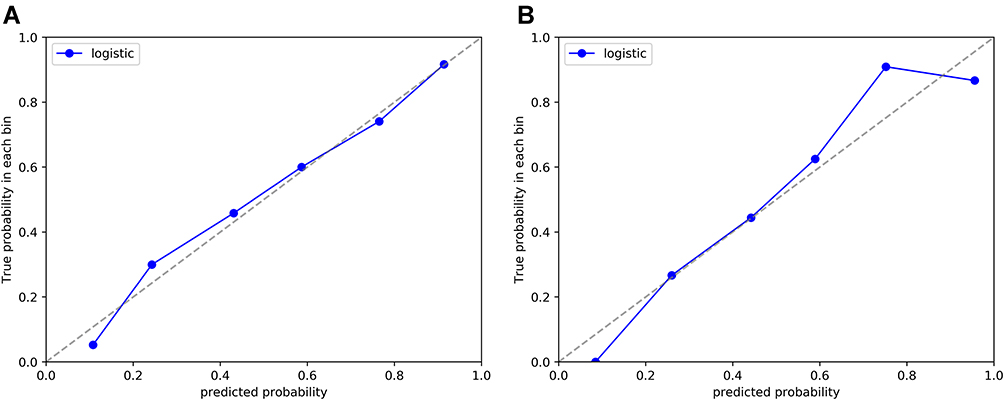 |
Figure 6 Calibration curves of model 5 in training set (A) and test set (B). |
Discussion
In this study, we developed five models for predicting distant metastasis in patients with solid lung adenocarcinoma based on 3D radiomics, 2D radiomics of contrast-enhanced CT, and clinical features and evaluated them with the test set. Based on a comprehensive consideration of DCA, the ROC curve and AIC, it is proved that model 5 has better clinical utility, goodness of fit and parsimony than the other four models, and a nomogram is constructed for the convenience of clinicians. In some previous studies, Chen et al14 retrospectively included 89 patients with T1 lung adenocarcinoma to predict the occurrence of brain metastases. The AUC of the combined model of radiomics and clinical parameters was 0.871, and the sample size of this study was small with only 10-fold cross-validation. Tao et al15 extracted radiomic features from preoperative CT images of 356 non-small cell lung cancer patients to predict distant metastases. The combined model of radiomic and clinical parameters had an AUC of only 0.77 in the test set. The study did not exclude subsolid lung cancers that rarely develop distant metastases.
Our study follows the recommendations of previous studies to avoid the fragility of radiomics model development22: (1) The code package for radiomic feature extraction is the Python-based code package PyRadiomics, which has been used by many studies and validated by research.23,24 (2) We combined 3D radiomic features, 2D radiomic features, and clinical parameters to create a more comprehensive model. (3) This study improved the repeatability of radiomic features by setting threshold for semi-automatic delineation. The studies by Cohen et al25 and Scholten et al26 also confirm the accuracy of segmentation using the threshold method. (4) Multiple segmentations are performed to further check the repeatability of the radiomic features and remove the radiomic features with poor repeatability. (5) Pre-process the images from CT to reduce the influence of different devices and different slice thicknesses. (6) Minimize features in model development to reduce the risk of overfitting. (7) Temporal validation: according to Transparent Reporting of a Multivariable Prediction Model for Individual Prognosis or Diagnosis (TRIPOD), temporal grouping is better than random grouping for evaluating model performance because it allows non-random variation between the two data sets.27,28 (8) This study was assessed using the Radiomics Quality Score (RQS), with a score of 19/36, higher than most studies.29,30
In consistency tests, we found considerable reliability in the extraction of radiomic features. Overall, good interobserver reliability (ICC ≥ 0.75) was achieved for 95.8% of 3D radiomic features and 72.9% of 2D radiomic features. This might reflect to some extent the stability and generalization of the radiomics model. According to the ICC results, the 3D radiomic features were more reproducible than the 2D radiomic features. However, according to the results of the DeLong test, the AUC values of model 1 and model 2 are not statistically different, which could be because the features with good reliability in the 2D radiomic features also have high predictive performance. Yang et al31 also demonstrated the predictive performance of 2D texture features in predicting angiolymphatic vessel invasion in lung adenocarcinoma with AUCs of 0.856 and 0.701 for 2D and 3D features in the test set, respectively. Wang et al32 combined the radiomic features of tumor 2D, tumor 3D, and peritumoral regions to predict recurrence-free survival in patients with stage IA solid non-small cell lung cancer. The 3-year and 5-year AUCs were 0.76 and 0.75, respectively, but our study combined 3D and 2D radiomic features and showed good predictive performance in predicting distant metastasis in patients with lung adenocarcinoma (model 3 had an AUC of 0.775 on the test set).
The histopathologic grade and number of lymph node metastases in patients with solid lung adenocarcinoma may be important predictors of distant metastasis. However, this information needs to be confirmed by surgery or biopsy and cannot be used as parameters to predict distant metastasis before treatment. Therefore, we collected as many pre-treatment clinical parameters of patients as possible: age, sex, smoking status, CEA, CA199, location and largest diameter of the primary tumor, short diameter of the largest lymph node, clinical T and N stage, and CT semantic features. The results of univariate analysis of the training set showed that there were statistically significant differences in burr sign, T stage, N stage, age, CEA, CA199, largest diameter of tumor, and short diameter of largest lymph node, which was relatively similar to the results of Tao et al.15 In multivariate analysis, N stage, age, and CEA were found to be independent predictors of distant metastasis in patients with solid lung adenocarcinomas. The constructed model 4 also showed good predictive performance with an AUC of 0.829 on the test set.
This study has some limitations. First, it is a retrospective study and selection bias may occur. Second, the data are from a single institution and the sample size was not very large, although we chose to use temporal grouping for validation. Third, we segmented only CT venous phase images that were more suitable for tumor boundary segmentation because of the workload. Fourth, the predictive performance of the model in different subgroups was not evaluated. In the future, prospective multicenter studies in more populations are needed to further validate our results.
Conclusion
This study demonstrates that a comprehensive model based on 3D radiomics, 2D radiomics, and clinical features has the potential to predict distant metastasis in patients with solid lung adenocarcinomas.
Abbreviations
CT, computed tomography; MRI, magnetic resonance imaging; 3D, three-dimensional; 2D, two-dimensional; LASSO, The Least Absolute Shrinkage and Selection Operator; ROC, receiver operating characteristic; AUC, area under the curve; CI, confidence interval; DCA, decision curve analysis; AIC, Akaike information criterion; ROI, region of interest; ICC, inter-rater correlation coefficient; c-radscore, combined radiomics score; CEA, carcinoembryonic antigen; CA199, carbohydrate antigen199.
Ethics Approval and Consent to Participate
This study was conducted with approval from the Second Affiliated Hospital of Nanchang University Medical Research Ethics Committee (The Examination and Approval No. Review 2018 No.031 and date of approval is June 10, 2018). This study was conducted in accordance with the declaration of Helsinki. As this study was a retrospective cohort study, the data were anonymous and informed consent was not required.
Acknowledgments
Thanks to all the authors for their contributions to the study.
Funding
This study was funded by the Key Project of Science and Technology Program of Jiangxi Provincial Department of Education (GJJ200106) and the Applied Research Cultivation Program of Jiangxi Provincial Department of Science and Technology (20212BAG70048).
Disclosure
The authors report no conflicts of interest in this work.
References
1. Sung H, Ferlay J, Siegel RL, et al. Global cancer statistics 2020: globocan estimates of incidence and mortality worldwide for 36 cancers in 185 countries. CA Cancer J Clin. 2021;71(3):209–249. doi:10.3322/caac.21660
2. Succony L, Rassl DM, Barker AP, et al. Adenocarcinoma spectrum lesions of the lung: detection, pathology and treatment strategies. Cancer Treat Rev. 2021;99:102237. doi:10.1016/j.ctrv.2021.102237
3. Ye T, Deng L, Wang S, et al. Lung adenocarcinomas manifesting as radiological part-solid nodules define a special clinical subtype. J Thorac Oncol. 2019;14(4):617–627. doi:10.1016/j.jtho.2018.12.030
4. Cho H, Lee HY, Kim J, et al. Pure ground glass nodular adenocarcinomas: are preoperative positron emission tomography/computed tomography and brain magnetic resonance imaging useful or necessary? J Thorac Cardiovasc Surg. 2015;150(3):514–520. doi:10.1016/j.jtcvs.2015.06.024
5. Zhang Y, Fu F, Chen H. Management of ground-glass opacities in the lung cancer spectrum. Ann Thorac Surg. 2020;110(6):1796–1804. doi:10.1016/j.athoracsur.2020.04.094
6. Shigefuku S, Shimada Y, Hagiwara M, et al. Prognostic significance of ground-glass opacity components in 5-year survivors with resected lung adenocarcinoma. Ann Surg Oncol. 2021;28(1):148–156. doi:10.1245/s10434-020-09125-x
7. Ettinger DS, Wood DE, Aisner DL, et al. NCCN guidelines insights: non-small cell lung cancer, version 2.2021. J Natl Compr Canc Netw. 2021;19(3):254–266. doi:10.6004/jnccn.2021.0013
8. Sica GL, Gal AA. Lung cancer staging: pathology issues. Semin Diagn Pathol. 2012;29(3):116–126. doi:10.1053/j.semdp.2012.06.001
9. Kandathil A, Kay FU, Butt YM, et al. Role of FDG PET/CT in the eighth edition of TNM Staging of non-small cell lung cancer. Radiographics. 2018;38(7):2134–2149. doi:10.1148/rg.2018180060
10. Sánchez DCJ, Hernández JH, López MF, et al. SEPAR guidelines for lung cancer staging. Arch Bronconeumol. 2011;47(9):454–465. doi:10.1016/j.arbres.2011.06.013
11. Liam CK, Andarini S, Lee P, et al. Lung cancer staging now and in the future. Respirology. 2015;20(4):526–534. doi:10.1111/resp.12489
12. Gillies RJ, Kinahan PE, Hricak H. Radiomics: images are more than pictures, they are data. Radiology. 2016;278(2):563–577. doi:10.1148/radiol.2015151169
13. Wu G, Jochems A, Refaee T, et al. Structural and functional radiomics for lung cancer. Eur J Nucl Med Mol Imaging. 2021;48(12):3961–3974. doi:10.1007/s00259-021-05242-1
14. Chen A, Lu L, Pu X, et al. CT-based radiomics model for predicting brain metastasis in category T1 lung adenocarcinoma. Am J Roentgenol. 2019;213(1):134–139. doi:10.2214/AJR.18.20591
15. Tao J, Lv R, Liang C, et al. Development and validation of a CT-based signature for the prediction of distant metastasis before treatment of non-small cell lung cancer. Acad Radiol. 2021. doi:10.1016/j.acra.2020.12.007
16. Travis WD, Asamura H, Bankier AA, et al. The IASLC lung cancer staging project: proposals for coding T categories for subsolid nodules and assessment of tumor size in part-solid tumors in the forthcoming eighth edition of the TNM classification of lung cancer. J Thorac Oncol. 2016;11(8):1204–1223. doi:10.1016/j.jtho.2016.03.025
17. Vickers AJ, Van Calster B, Steyerberg EW. Net benefit approaches to the evaluation of prediction models, molecular markers, and diagnostic tests. BMJ. 2016;352:i6. doi:10.1136/bmj.i6
18. Van Calster B, Wynants L, Verbeek J, et al. Reporting and interpreting decision curve analysis: a guide for investigators. Eur Urol. 2018;74(6):796–804. doi:10.1016/j.eururo.2018.08.038
19. Yates LA, Richards SA, Brook BW. Parsimonious model selection using information theory: a modified selection rule. Ecology. 2021;102(10):e3475. doi:10.1002/ecy.3475
20. Koo TK, Li MY. A guideline of selecting and reporting intraclass correlation coefficients for reliability research. J Chiropr Med. 2016;15(2):155–163. doi:10.1016/j.jcm.2016.02.012
21. Noble WS. How does multiple testing correction work? Nat Biotechnol. 2009;27(12):1135–1137. doi:10.1038/nbt1209-1135
22. Welch ML, McIntosh C, Haibe-Kains B, et al. Vulnerabilities of radiomic signature development: the need for safeguards. Radiother Oncol. 2019;130:2–9. doi:10.1016/j.radonc.2018.10.027
23. van Griethuysen J, Fedorov A, Parmar C, et al. Computational radiomics system to decode the radiographic phenotype. Cancer Res. 2017;77(21):e104–e107. doi:10.1158/0008-5472.CAN-17-0339
24. Bettinelli A, Marturano F, Avanzo M, et al. A novel benchmarking approach to assess the agreement among radiomic tools. Radiology. 2022;303(3):533–541. doi:10.1148/radiol.211604
25. Cohen JG, Goo JM, Yoo RE, et al. Software performance in segmenting ground-glass and solid components of subsolid nodules in pulmonary adenocarcinomas. Eur Radiol. 2016;26(12):4465–4474. doi:10.1007/s00330-016-4317-3
26. Scholten ET, Jacobs C, van Ginneken B, et al. Detection and quantification of the solid component in pulmonary subsolid nodules by semiautomatic segmentation. Eur Radiol. 2015;25(2):488–496. doi:10.1007/s00330-014-3427-z
27. Collins GS, Reitsma JB, Altman DG, et al. Transparent reporting of a multivariable prediction model for individual prognosis or diagnosis (TRIPOD): the TRIPOD statement. Eur Urol. 2015;67(6):1142–1151. doi:10.1016/j.eururo.2014.11.025
28. Moons KG, Altman DG, Reitsma JB, et al. Transparent reporting of a multivariable prediction model for individual prognosis or diagnosis (TRIPOD): explanation and elaboration. Ann Intern Med. 2015;162(1):W1–W73. doi:10.7326/M14-0698
29. Nardone V, Reginelli A, Grassi R, et al. Delta radiomics: a systematic review. Radiol Med. 2021;126(12):1571–1583. doi:10.1007/s11547-021-01436-7
30. Lambin P, Leijenaar RTH, Deist TM, et al. Radiomics: the bridge between medical imaging and personalized medicine. Nat Rev Clin Oncol. 2017;14(12):749–762. doi:10.1038/nrclinonc.2017.141
31. Yang G, Nie P, Zhao L, et al. 2D and 3D texture analysis to predict lymphovascular invasion in lung adenocarcinoma. Eur J Radiol. 2020;129:109111. doi:10.1016/j.ejrad.2020.109111
32. Wang T, She Y, Yang Y, et al. Radiomics for survival risk stratification of clinical and pathologic stage IA pure-solid non-small cell lung cancer. Radiology. 2022;302(2):425–434. doi:10.1148/radiol.2021210109
 © 2022 The Author(s). This work is published and licensed by Dove Medical Press Limited. The
full terms of this license are available at https://www.dovepress.com/terms
and incorporate the Creative Commons Attribution
- Non Commercial (unported, 3.0) License.
By accessing the work you hereby accept the Terms. Non-commercial uses of the work are permitted
without any further permission from Dove Medical Press Limited, provided the work is properly
attributed. For permission for commercial use of this work, please see paragraphs 4.2 and 5 of our Terms.
© 2022 The Author(s). This work is published and licensed by Dove Medical Press Limited. The
full terms of this license are available at https://www.dovepress.com/terms
and incorporate the Creative Commons Attribution
- Non Commercial (unported, 3.0) License.
By accessing the work you hereby accept the Terms. Non-commercial uses of the work are permitted
without any further permission from Dove Medical Press Limited, provided the work is properly
attributed. For permission for commercial use of this work, please see paragraphs 4.2 and 5 of our Terms.
Recommended articles
A Predictive Clinical-Radiomics Nomogram for Differentiating Tuberculous Spondylitis from Pyogenic Spondylitis Using CT and Clinical Risk Factors
Wu S, Wei Y, Li H, Zhou C, Chen T, Zhu J, Liu L, Wu S, Ma F, Ye Z, Deng G, Yao Y, Fan B, Liao S, Huang S, Sun X, Chen L, Guo H, Chen W, Zhan X, Liu C
Infection and Drug Resistance 2022, 15:7327-7338
Published Date: 13 December 2022
Integration of Multimodal Computed Tomography Radiomic Features of Primary Tumors and the Spleen to Predict Early Recurrence in Patients with Postoperative Adjuvant Transarterial Chemoembolization
Chen C, Liu J, Gu Z, Sun Y, Lu W, Liu X, Chen K, Ma T, Zhao S, Zhao H
Journal of Hepatocellular Carcinoma 2023, 10:1295-1308
Published Date: 8 August 2023
Preoperative Noninvasive Prediction of Recurrence-Free Survival in Hepatocellular Carcinoma Using CT-Based Radiomics Model
Dai T, Gu QB, Peng YJ, Yu CL, Liu P, He YQ
Journal of Hepatocellular Carcinoma 2024, 11:2211-2222
Published Date: 14 November 2024
A CT-Based Lung Radiomics Nomogram for Classifying the Severity of Chronic Obstructive Pulmonary Disease
Zhou T, Zhou X, Ni J, Guan Y, Jiang X, Lin X, Li J, Xia Y, Wang X, Wang Y, Huang W, Tu W, Dong P, Li Z, Liu S, Fan L
International Journal of Chronic Obstructive Pulmonary Disease 2024, 19:2705-2717
Published Date: 11 December 2024
Assessing Invasiveness of Ground-Glass Nodules Using Ternary-Class CT Radiomics Models: A Multi-Center Study with SHAP Explanations
Zhao P, Chen H, Gu H, Lin Y, Ma Y
Cancer Management and Research 2026, 18:602730
Published Date: 5 June 2026