Back to Journals » Cancer Management and Research » Volume 18

Assessing Invasiveness of Ground-Glass Nodules Using Ternary-Class CT Radiomics Models: A Multi-Center Study with SHAP Explanations
Authors Zhao P, Chen H, Gu H, Lin Y, Ma Y ![]()
Received 26 February 2026
Accepted for publication 20 May 2026
Published 5 June 2026 Volume 2026:18 602730
DOI https://doi.org/10.2147/CMAR.S602730
Checked for plagiarism Yes
Review by Single anonymous peer review
Peer reviewer comments 2
Editor who approved publication: Dr Javier-David Benitez-Fuentes
Pingshan Zhao,1,* Haoran Chen,2,* Hongxian Gu,3 Yi Lin,4 Yanqing Ma4
1Department of Radiology, Shaoxing Hospital of Traditional Chinese Medicine, Shaoxing, Zhejiang, People’s Republic of China; 2Department of Radiology, The First People’s Hospital of Tongxiang City, Tongxiang, Zhejiang, People’s Republic of China; 3Department of Radiology, People’s Hospital of Jianyang City, Jianyang, Sichuan, People’s Republic of China; 4Cancer Center, Department of Radiology, Zhejiang Provincial People’s Hospital, Affiliated Hospital of Hangzhou Medical College, Hangzhou, Zhejiang, People’s Republic of China
*These authors contributed equally to this work
Correspondence: Yanqing Ma, Cancer center, Department of Radiology, Zhejiang Provincial People’s Hospital, affiliated Hospital of Hangzhou Medical College, Hangzhou, Zhejiang, People’s Republic of China, Email [email protected]
Background: Ground-glass nodules (GGNs) exhibiting varying degrees of invasiveness necessitate distinct clinical management protocols and therapeutic interventions. This study aimed to construct ternary classification machine-learning models utilizing CT radiomics features to stratify GGNs into precursor glandular lesions (PGL), minimally invasive adenocarcinoma (MIA), and invasive adenocarcinoma (IAC).
Methods: This multi-center and retrospective study analyzed 1130 GGNs patients, comprising 858 cases (mean age: 57.635± 12.978 years) in the training set and 272 cases (mean age: 57.037± 11.683 years) in the testing set. Computed tomography (CT) based radiomics features were extracted and utilized for machine-learning model construction. Six ternary classification models were developed, including Logistic Regression, RandomForest, ExtraTrees, XGBoost, LightGBM, and multi-layer perceptron (MLP) models, to establish a comprehensive multi-class prediction framework. The area under the receiver operating characteristic curve (AUC) serves as a quantitative metric for evaluating model performance.
Results: The MLP-Model demonstrated superior predictive performance, with ternary classification accuracy reaching 0.712 in the training set and maintaining 0.658 in the testing set, surpassing the performance range of comparative models (training set: 0.590– 0.690; testing set: 0.577– 0.614). The MLP-Model achieved micro and macro AUCs of 0.877 (95% CI: 0.863– 0.890) and 0.861 (95% CI: 0.835– 0.886) in the training set, and 0.808 (95% CI: 0.776– 0.840) and 0.799 (95% CI: 0.740– 0.854) in the testing set.
Conclusion: Our study developed ternary machine-learning models, particularly the MLP-Model, effectively stratifies GGN invasiveness into PGL, MIA, and IAC subtypes, thereby optimizing clinical decision-making through precision therapeutic planning and personalized management strategies.
Keywords: ground glass nodule, computed tomography, radiomics, invasiveness, computed tomography, lung adenocarcinoma
Introduction
Lung cancer, being the most frequently diagnosed cancer and the primary cause of cancer-related mortality,1 is predominantly characterized by adenocarcinoma that often manifests as ground-glass nodules (GGNs) on computed tomography (CT) scans in its early stages. Pathologically, adenocarcinoma can be categorized into atypical adenomatous hyperplasia (AAH) and adenocarcinoma in situ (AIS), which were reclassified as precursor glandular lesions (PGL) in the new lung epithelial tumor classification system published by the World Health Organization in 2021,2 along with minimally invasive adenocarcinoma (MIA) and invasive adenocarcinoma (IAC). Despite previous reports suggesting a disease-free survival rate close to 100% for patients with PGL and MIA post-surgery,3 a large cohort study by Yotsukura et al demonstrated long-term outcomes after complete resection, revealing their differences in overall survival rates (95.3% and 97.8%, respectively) and the estimated incidence of metachronous second primary lung cancer at 10 years (5.6% and 7.7%, respectively).4 For IAC patients, the 5-year disease-specific survival rate is 73.5%, with a median survival of 13.5 years.5 These remarkable survival data and the varying degrees of anatomic invasion underscore the necessity to distinguish PGL, MIA, and IAC.
Nevertheless, discerning the various categories of GGNs to ascertain the optimal timing for therapeutic intervention represents a formidable clinical conundrum, given the imperative to avert the risks of over treatment and protracted diagnostic delays.6 At present, CT serves as an indispensable tool in the preoperative evaluation of the invasiveness of GGNs, playing a pivotal role in the stratification of patients with early-stage adenocarcinoma.7 CT-based radiomics has the potential to extract high-throughput data from medical images and is highly promising in identifying the heterogeneity inherent in GGNs.8 Prior investigations have substantiated the ability of radiomics-informed models to augment the efficacy of ascertaining the invasiveness of pulmonary nodules.9 However, the majority of studies,10,11 including our previous research,12 have been confined to binary classification analyses of pulmonary nodules, while corpus of research pertaining to the multi-class prediction of GGNs remains notably sparse. Compared with binary classification, ternary classification among PGL, MIA, and IAC is technically more challenging due to imbalanced sample sizes, overlapping radiological features between adjacent pathological subtypes, and more complex decision boundaries in high-dimensional feature space.
Thus, the objective of this study is to establish a ternary-class prediction model for assessing the invasiveness of GGNs, specifically differentiating PGL, MIA, and IAC, by leveraging CT radiomics and clinical characteristics. Furthermore, the model is interpreted through the shapley additive explanations (SHAP) method, an approach that systematically quantifies each input feature’s individual contribution to its specific output and thus delivers an interpretable, traceable analysis of feature impacts on its decision-making process.
Materials and Methods
This retrospective study was approved by the ethics review board of Zhejiang Provincial People’s Hospital, First People’s Hospital of Tongxiang City, and People’s Hospital of Jianyang City (Nos. 2026–009, 2025–003-01, and JYL202335, respectively). Given the retrospective nature of this study, the requirement for informed consent was formally waived by the ethics committees. The methods were conducted in accordance with relevant guidelines and regulations.
Study Population
From January 2017 to December 2024, 1130 patients showing as GGNs from three hospitals after searching the Picture Archiving and Communication System were enrolled. The inclusion criteria were as follows: (1) CT examinations were performed within two weeks prior to surgeries; (2) patients’ clinical data, including gender, age, tumor history, smoking history, and other relevant information, were complete; (3) CT images exhibited excellent quality, with no interference from motion or respiratory artifacts; (4) the long diameter of GGN is less than 30 mm. The exclusion criteria were as follows: (1) patients received preoperative treatments, such as radiotherapy and chemotherapy; (2) patients had a history of primary cancer and a high risk of metastasis; (3) patients with active infections or a history of certain infections. The process of patient enrollment is illustrated in Figure 1.
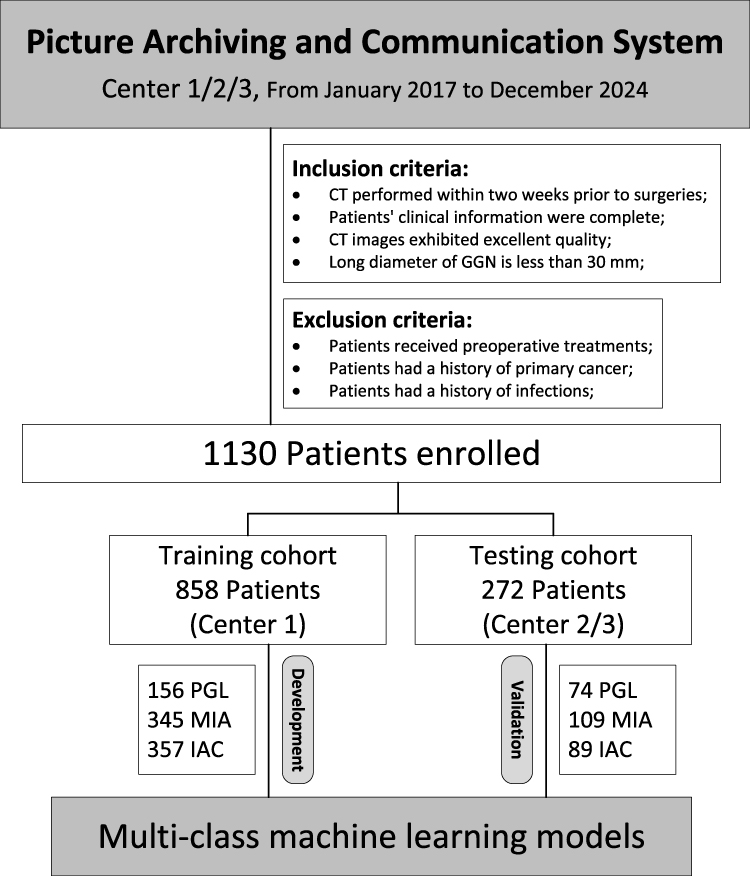 |
Figure 1 The process of patient enrollment. PACS: picture archiving and communication system. Abbreviations: GGN, ground-glass nodule; CT, computed tomography; PGL, pulmonary ground-glass lesion; MIA, minimally invasive adenocarcinoma; IAC, invasive adenocarcinoma. |
Finally, out of 1130 patients, 858 (mean age: 57.635±12.978 years) from Center 1 were used to construct multi-class machine learning models to differentiate PGL, MIA, and IAC, while the remaining 272 patients (mean age: 57.037±11.683 years) from Center 2/3 were used to validate these models. The synthetic minority over-sampling technique (SMOTE) was applied after train-test separation with k=5 nearest neighbors to balance class distribution in the training set and prevent data leakage. The clinical information include age, gender, diameter, location (superior/middle/inferior lobe of right lung, and superior/inferior lobe of left lung), smoke, drink, hypertension, diabetes, and tumor history.
CT Examination and VOI Segmentation
All the CT images were obtained as part of the routine clinical care using 64- or 128-slice CT scanners (Siemens Somatom Definition AS, Philips Incisive CT, GE Bright Speed, GE Revolution Maxima, and Canon Aquilion Prime). The scans, which cover the lung area from the apex to the level of the adrenal glands during inspiration, were conducted in the supine position with arms raised above the head, as is commonly done for lung CT scans. The scan parameters typically include a tube voltage of 120 kV, with automatic tube current adjustment, a slice thickness of 1–2 mm, reconstructed with standard soft-tissue kernels, and a reconstruction interval of 1–2 mm.
Potential variability arising from differences in scanner models, reconstruction kernels, tube current modulation, and acquisition protocols was recognized as a limitation of multi-center retrospective data. To minimize such effects, all images were processed with strict standardization: images were resampled to a uniform isotropic voxel size of 1*1*1 mm; lung window settings were fixed at width 1500 HU and level −600 HU; slice thickness and interval were restricted to 1–2 mm across all centers; and only lung-filtered reconstructions were included for analysis. Radiologists with 10 and 15 years of experience in CT diagnosis manually delineated the volume of interests (VOIs) of the preprocessed CT images, followed by consensus discussions and adjudication as necessary to finalize the results in ITK-SNAP software (Version 3.8.0).
Feature Extraction and Selection
The radiomics features were extracted using Python (Version 2.0.0) after implementing the PyRadiomics library from CT images. A total of 1561 radiomics features include 306 first-order statistic features, 374 gray-level co-occurrence matrix (GLCM) features, 238 gray-level dependence matrix (GLDM) features, 272 gray-level run length matrix (GLRLM) features, 272 gray-level zone matrix (GLSZM) features, 85 neighborhood gray tone difference matrix (NGTDM) features, and 14 shape features. For detailed information, please refer to http://PyRadiomics.readthedocs.io.
After calculating the radiomics features, normalization is applied, subsequently followed by univariate analysis utilizing analysis of variance (ANOVA), correlation analysis, maximal redundancy minimal relevance (mRMR) algorithm, and least absolute shrinkage and selection operator (LASSO) regression for feature selection (Figure 2). Feature normalization through Z-score standardization entails transforming each feature value by subtracting the feature’s mean and dividing by its standard deviation, thereby achieving a mean of zero and a standard deviation of one for each feature. Correlation analysis was carried out to pinpoint and subsequently eliminate redundant features, particularly those exhibiting a correlation coefficient exceeding 0.9. The application of the mRMR algorithm aimed to filter out unnecessary and redundant features. LASSO regression enhances model interpretability and performance by incorporating a penalty term that shrinks the coefficients of less important features to zero, thereby identifying only the most relevant features with non-zero coefficients, and further validating these through 5-fold cross-validation.
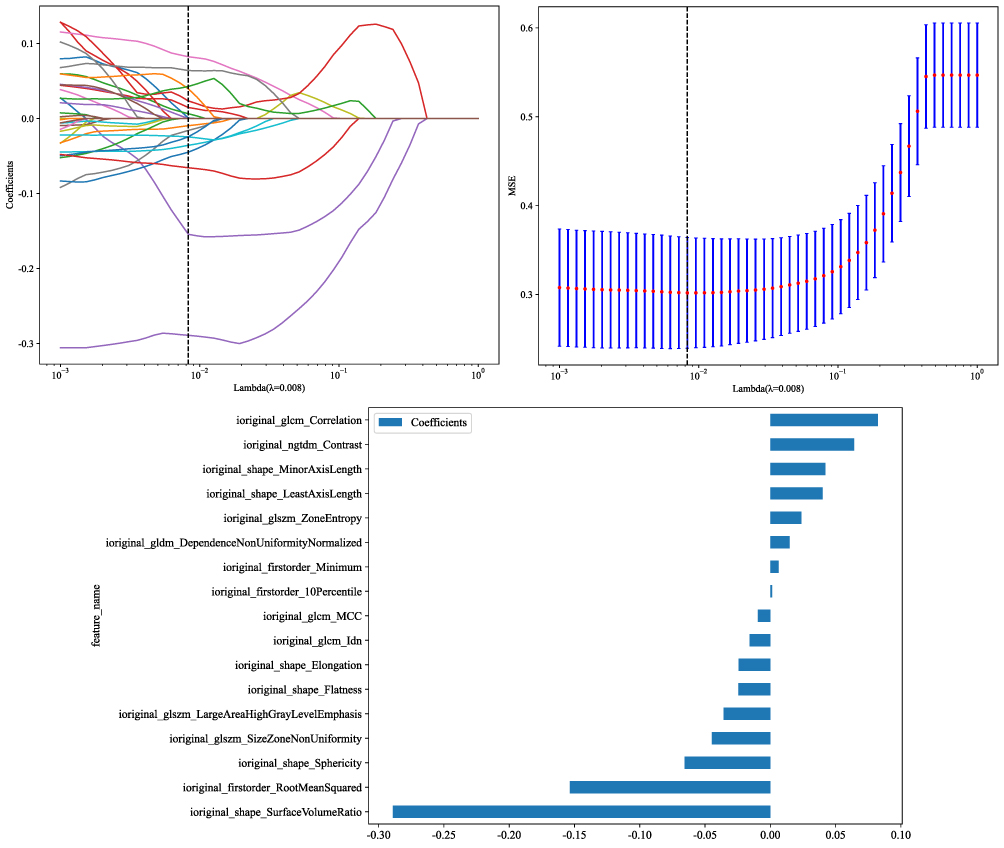 |
Figure 2 The method of LASSO for feature selection. Abbreviations: CT, computed tomography; LASSO, least absolute shrinkage and selection operator. |
Model Development and Evaluation
The optimal radiomics features of 858 patients from Center 1 were leveraged to construct multi-class models. These algorithms were selected to represent linear, tree-based ensemble, and neural network approaches for comprehensive and fair comparison in the ternary classification task. The models were developed using various machine learning algorithms, including Logistic Regression, RandomForest, ExtraTrees, XGBoost, LightGBM, and multi-layer perceptron (MLP). The models were then validated using data from 272 patients obtained from Centers 2 and 3. The performance of these multi-class machine learning models were rigorously evaluated across training and testing cohorts using an array of metrics, including accuracy, precision, sensitivity, specificity, positive predictive value (PPV), negative predictive value (NPV), recall, F1 score, and receiver operating characteristic (ROC) curves with area under the curve (AUC). The consistency of models were assessed using calibration curves, while decision curve analysis evaluated the potential net benefit. The framework of the study is presented in Figure 3. SHAP analysis was applied to interpret the ternary machine learning models (Figure 4). Detailed parameters for reproducibility, resampling, segmentation agreement, feature selection, and model optimization are provided in the Supplementary Material.
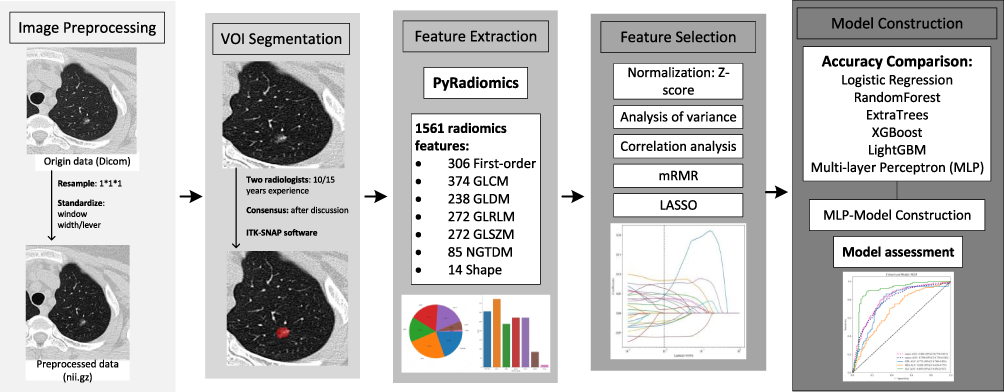 |
Figure 3 The framework of the study. Abbreviations: DICOM, digital imaging and communications in medicine; nii.gz, neuroimaging informatics technology initiative compressed format; VOI, volume of Interest; GLCM, gray level co-occurrence matrix; GLDM, gray level dependence matrix; GLRLM, gray level run length matrix; GLSZM, gray level size zone matrix; NGTDM, neighbouring gray tone difference matrix; mRMR, maximum relevance minimum redundancy; LASSO, least absolute shrinkage and selection operator; XGBoost, extreme gradient boosting; MLP, multi-layer perceptron. |
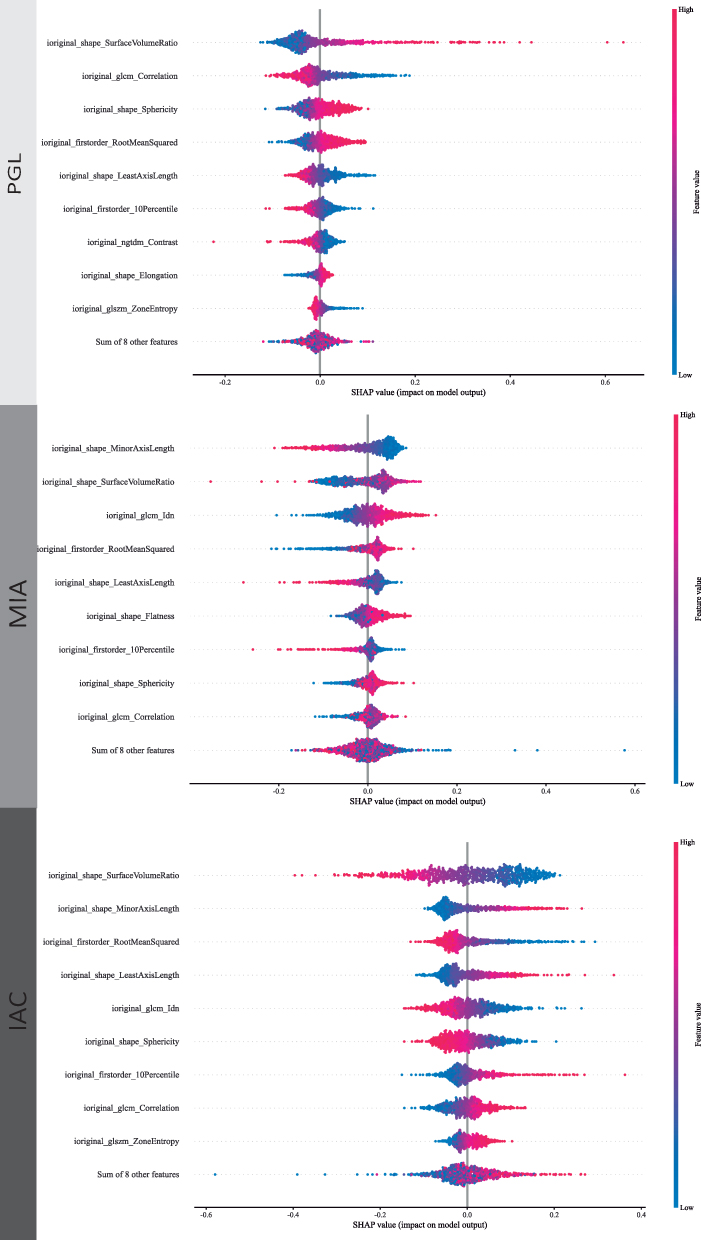 |
Figure 4 The SHAP explanation plot of MLP-based ternary classification model of GGNs. Abbreviations: SHAP, shapley additive explanations; PGL, pulmonary ground-glass lesion; MIA, minimally invasive adenocarcinoma; IAC, invasive adenocarcinoma. |
Statistical Analysis
Statistical analyses were conducted using IBM SPSS (Version 24.0.0, www.ibm.com/legal/copytrade.shtml), R software (Version 3.4.1, https://www.r-project.org), and Python (Version 3.7.12, https://www.python.org). Continuous variables are summarized as the mean±standard deviation (SD) for normally distributed data, and as the median (interquartile range) for non-normally distributed data, while categorical variables are expressed as frequencies (percentages). For three cohorts of clinical baseline data that meet the assumptions of normality and homogeneity, one-way analysis of variance (ANOVA) is selected for comparison; otherwise, the non-parametric Kruskal–Wallis h-test is utilized for analysis. Categorical variables were analyzed using the chi-square (X2) test. A P-value less than 0.05 (two-tailed) was deemed statistically significant.
Results
Clinical Baseline Information of Patients
A cohort comprising 858 patients from Center 1, which includes 156 cases of PGL, 345 cases of MIA, and 357 cases of IAC, as well as a cohort of 272 patients from Centers 2 and 3, consisting of 74 PGL cases, 109 MIA cases, and 89 IAC cases. Statistical significance was observed in the items of age (p<0.05), gender (p<0.05), diameter (p<0.05), smoke (p<0.05), drink (p<0.05), hypertension (p<0.05), and diabetes (p=0.003), whereas location (p=0.365) and tumor history (p=0.265) showed no significant significance. An overview of the patients’ demographic information in the training set and testing set are provided in Table 1.
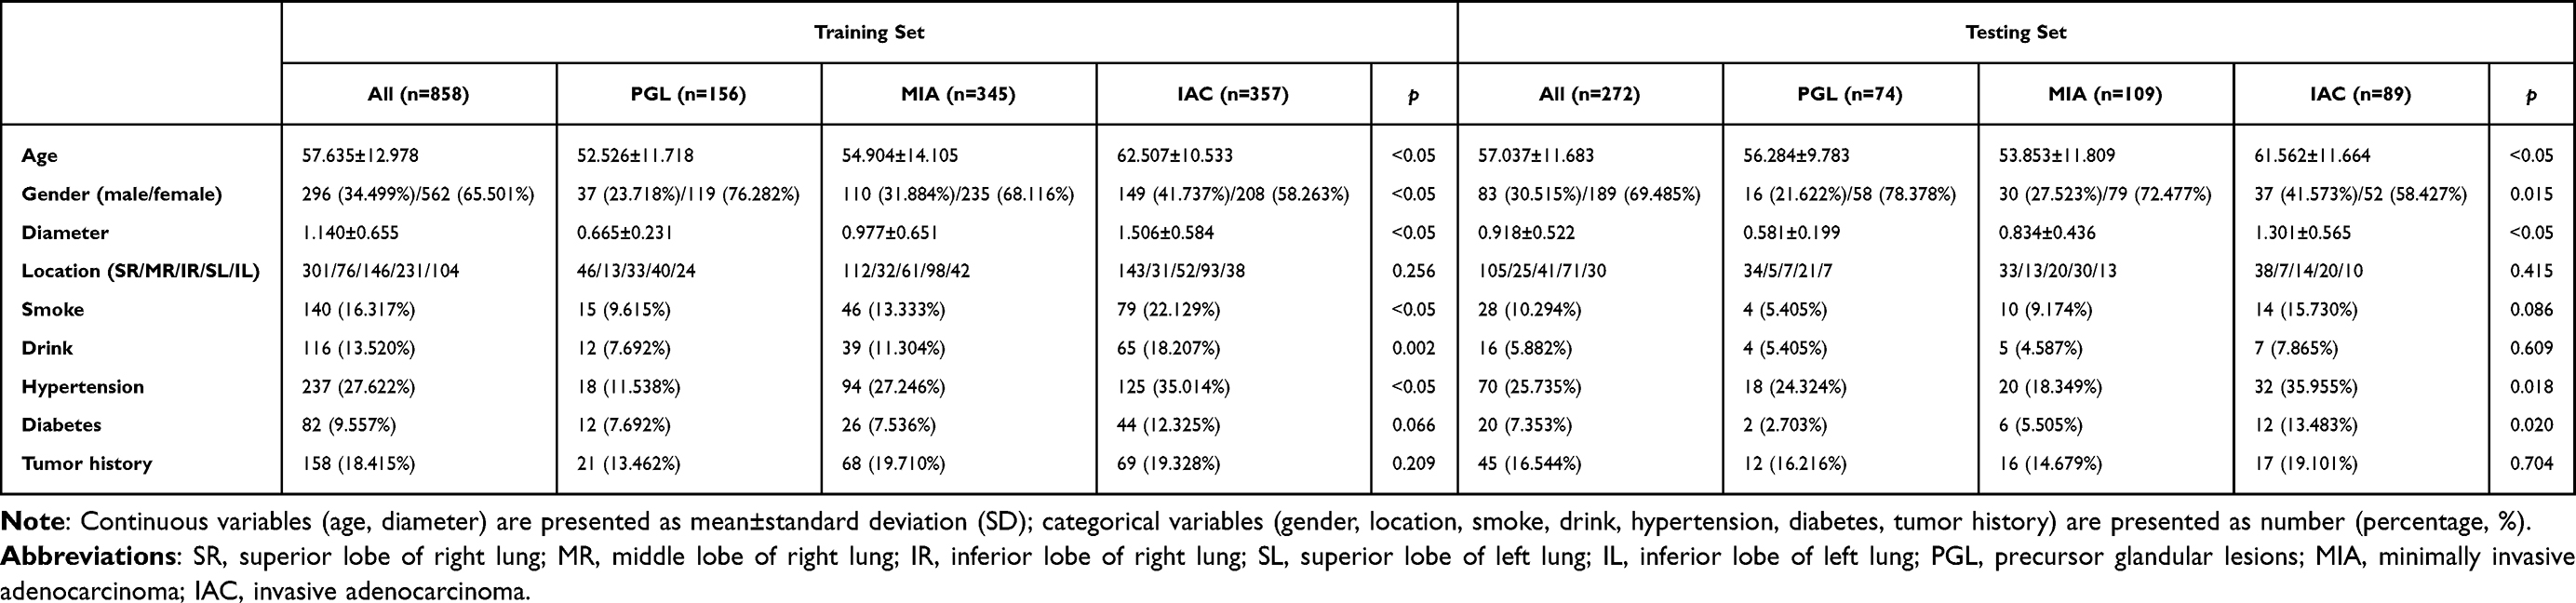 |
Table 1 Patients’ Demographic Information |
The Development and Comparison of Multi-Class Machine Learning Models
After the selection process, there were 17 radiomics features left to construct the multi-class machine learning models by the ways of Logistic Regression, RandomForest, ExtraTrees, XGBoost, LightGBM, and MLP. The MLP-Model exhibits a superior level of accuracy, achieving an accuracy of 0.712 in the training set and 0.658 in the testing set, which outperforms other models (training sets: 0.590 to 0.690; testing sets: 0.577 to 0.614) and underscores its enhanced predictive efficacy. Consequently, a more in-depth analysis of the MLP-Model was undertaken to classify the GGNs into three categories: PGL, MIA, and IAC.
The Performance of Multi-Class MLP-Model
The micro and macro AUCs of MLP-Model were 0.877 (95% CI: 0.863 to 0.890) and 0.861 (95% CI: 0.835 to 0.886) in the training set, and were 0.808 (95% CI: 0.776 to 0.840) and 0.799 (95% CI: 0.740 to 0.854) in the testing set (Figure 5). The micro sensitivity, specificity, positive predictive value (PPV), negative predictive value (NPV), precision, recall, and F1 score in the training/testing sets were 0.661/0.614, 0.878/0.851, 0.731/0.673, 0.838/0.815, 0.731/0.673, 0.661/0.614, and 0.694/0.642, respectively. The specific diagnostic performance metrics of the MLP-Model for the training and testing sets were presented in Table 2. The confusion matrix in Figure 6 illustrates the classification error and their quantity for ternary classification of GGNs into PGL, MIA, and IAC. Figure 7 presents the case data of a 59-year-old female patient with pulmonary nodules. This SHAP plot clearly demonstrates the contribution degree and direction of various radiomics features to the predictive value (f(x)=0.72) of the model for diagnosing IAC of the lung. It intuitively reflects the influence weight and action polarity of different radiomics features in the decision-making process of the model diagnosis.
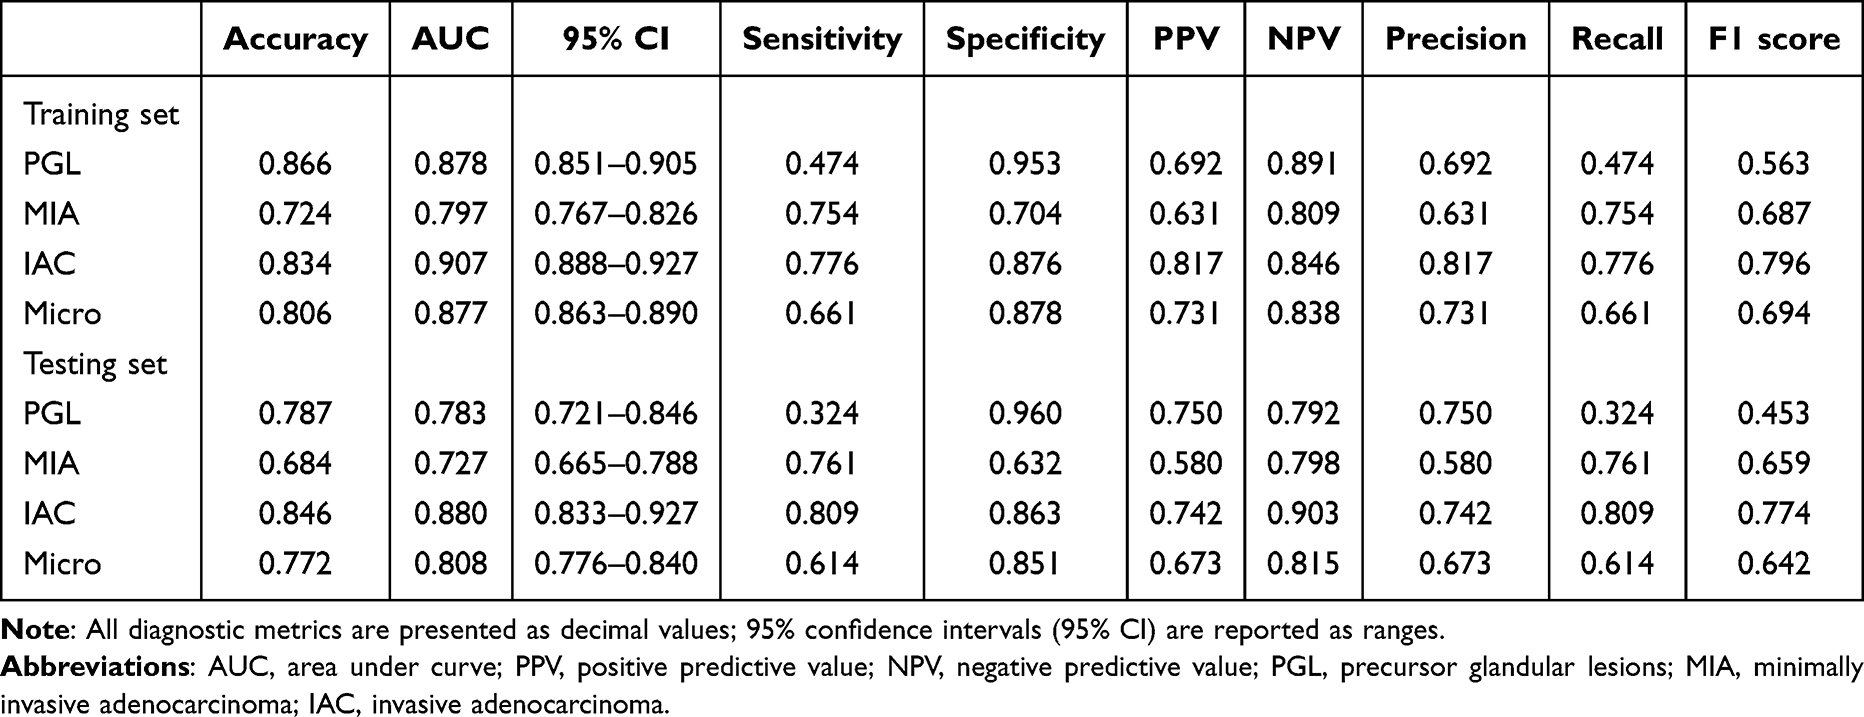 |
Table 2 Diagnostic Proficiency Metrics of MLP-Model for Training and Testing Sets |
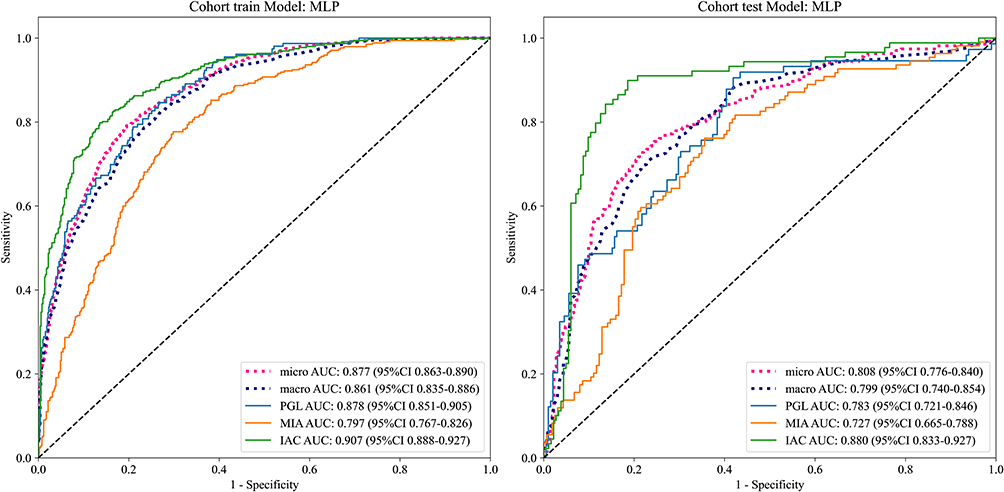 |
Figure 5 The specific AUC metrics of the MLP-Model for the training and testing sets. Abbreviations: MLP, multi-layer perceptron; AUC, area under the curve; micro-AUC, micro-averaged area under the curve; macro-AUC, macro-averaged area under the curve; CI, confidence interval; PGL, pulmonary ground-glass lesion; MIA, minimally invasive adenocarcinoma. |
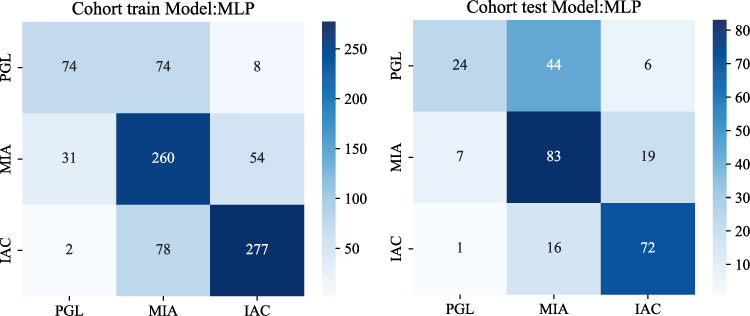 |
Figure 6 Confusion matrices of the MLP model for classifying GGNs into PGL, MIA, and IAC in the training (left) and test (right) cohorts. Rows: true class; columns: predicted class. Blue gradient color bars represent the number of cases per cell, with darker shades indicating higher counts. Values in cells show the exact case counts. Abbreviations, MLP, multi-layer perceptron; PGL, pulmonary ground-glass lesion; MIA, minimally invasive adenocarcinoma; IAC, invasive adenocarcinoma. |
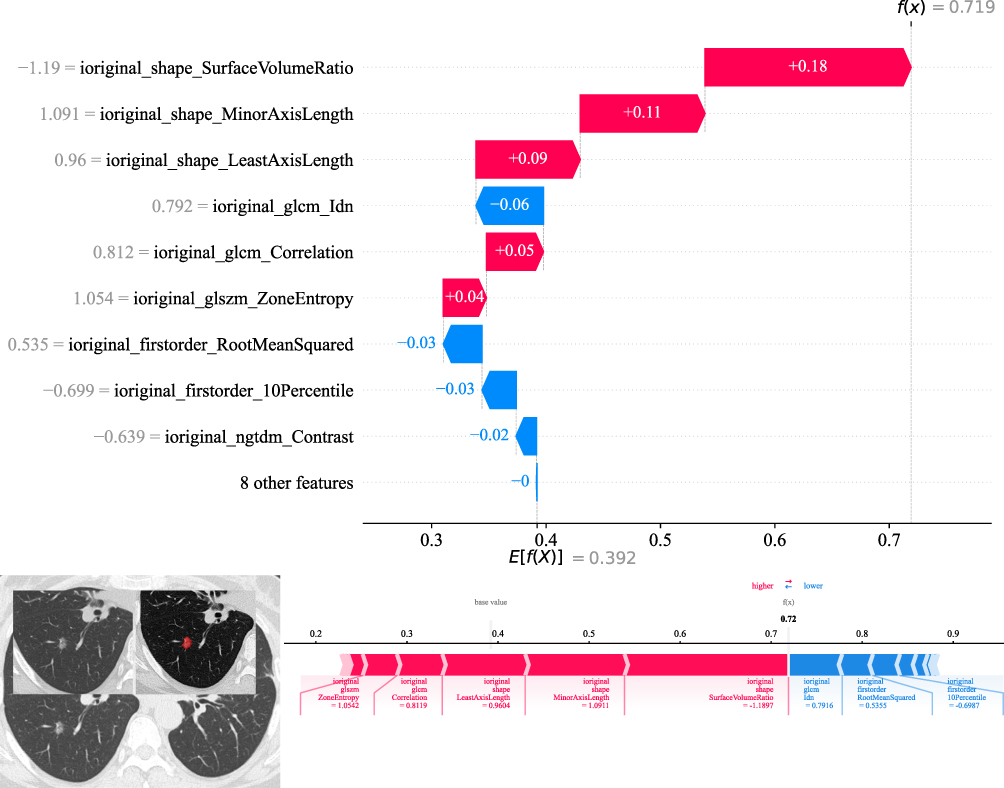 |
Figure 7 The SHAP waterfall plot (top) and force plot (bottom) explaining the multi-layer perceptron (MLP) model’s prediction for a pulmonary nodule in a 59-year-old female patient. Abbreviations, SHAP, shapley additive explanations; GLCM, gray level co-occurrence matrix; GLSZM, gray level size zone matrix; NGTDM, neighbourhood gray tone difference matrix. |
Discussion
Research on the multi-class machine-learning algorithms to predict the invasiveness of GGNs remains is still in its infancy. Our study developed ternary-class machine-learning models to classify GGNs into PGL, MIA, or IAC. Radiomics has recently emerged as a potent method for extracting quantitative features from medical images, potentially unveiling pathophysiological information pertinent to cancerous tissues.13 CT serves as the primary screening modality for pulmonary lesions.14 Several studies have utilized CT-based radiomics to assess the quantitative risk associated with the benign and malignant pulmonary nodules.9,15,16 However, the vast majority of these studies are binary classification research. Given that machine-learning methods have typically neglected the collaborative nature of radiologists’ reading strategies,17 which are crucial for classifying nodules and resolving discordant classifications, we developed ternary machine-learning models for invasiveness prediction. After comparing the accuracy of various machine-learning models, including Logistic Regression, RandomForest, ExtraTrees, XGBoost, LightGBM, and MLP, the MLP-Model demonstrated the highest accuracy in both the training (0.712) and testing (0.658) sets. The MLP model achieved acceptable performance in the external test set (micro AUC 0.808, macro AUC 0.799), with robust accuracy for IAC (0.846) and MIA (0.684), but relatively lower performance for PGL (accuracy 0.787, sensitivity 0.324), consistent with the difficulty of identifying pre-invasive lesions with minimal structural changes. While the model is promising as an auxiliary diagnostic tool, the current performance does not yet support fully independent clinical application, particularly for PGL classification. Our results support adopting this model as a decision-support aid to assist radiologists in stratification instead of replacing clinical judgment, given that the ternary classification of pulmonary adenocarcinoma into PGL, MIA, and IAC bears important clinical implications for precise prognostic stratification and therapeutic decision-making, with IAC showing markedly poorer outcomes,18 MIA exhibiting favorable prognosis,19 and PGL usually requiring surveillance monitoring.20 Notably, the model achieved a high specificity of 0.960 for identifying PGL lesions. This high specificity indicates that a low predicted PGL probability can reliably rule out non-PGL status, which provides practical reference value for clinical risk stratification and subsequent individualized management of pulmonary nodules.
The analysis of clinical baseline information found that among the three groups of patients with PGL, MIA, and IAC, all characteristics except for location and tumor history were statistically significant. The mean ages of IAC patients (62.318±10.761 years) were statistically higher than those of MIA (54.652±13.584 years) and PGL patients (53.735±11.249 years). As the degree of malignancy progresses, the lesion size demonstrates a corresponding increase, with IAC lesions (1.465±0.585 cm) presenting significantly larger diameters compared to MIA (0.943±0.609 cm) and PGL (0.638±0.224 cm). The lesions of IAC were more likely to occur in females (23.009%, p<0.05), and were associated with a history of smoke (8.230%, p<0.05), drink (6.372%, p<0.05), hypertension (13.894%, p<0.05), and diabetes (4.956%, p=0.003). Our results demonstrated certain discrepancies compared with the findings reported by Xie et al, whose analysis revealed no statistically significant inter-group differences in gender distribution, lesion localization, smoking history, vacuolar signs, or tumor-lung interface characteristics among these three cohorts.20 The observed heterogeneity in clinical baseline characteristics across different study cohorts21,22 underscores the critical complementary value of machine-learning driven radiomics approaches in advancing the precision of trichotomous classification systems. Finally, by means of SHAP plots, the contribution degree of each radiomics feature to the model’s prediction results is quantified, which clearly explains the decision-making role of each feature in the process of predicting lung nodule invasiveness using the three-class MLP model. The model outputs continuous class probability scores for PGL, MIA, and IAC, which are derived from the normalized output layer of the MLP model and reflect the predicted likelihood of each invasiveness subtype. Higher IAC probabilities support timely intervention, while higher PGL/MIA probabilities favor close surveillance. By adjusting thresholds based on clinical risk tolerance, the model can help individualize management and reduce both delayed treatment and overtreatment.
This study had some limitations. First, despite applying the SMOTE method to mitigate the class imbalance among PGL, MIA, and IAC samples in the training set, potential biases may persist due to the initial disproportionate sample sizes. Second, this retrospective study spanning multiple years is fundamentally constrained by chronological inconsistencies in research parameters, underscoring the necessity for subsequent longitudinal research with enhanced management of confounding variables to uncover supplementary prognostic factors for both neoplasm classification and clinical outcomes. Third, our study was limited to the collection of clinical baseline information, lacking both comprehensive analysis of conventional radiological characteristics and comparative assessments with ternary machine-learning models, which warrants further research. Forth, variations in CT protocols, reconstruction algorithms and scanner software across centers and timepoints may introduce batch effects and imaging heterogeneity. Although unified image preprocessing and feature extraction were applied to reduce such bias, residual confounding remained unavoidable. Moreover, multiple performance metrics were calculated for six models across three classes without Bonferroni or FDR correction, potentially elevating false-positive risk. Therefore, these results should be regarded as exploratory, and further external prospective validation is needed to verify model stability and generalizability.
Conclusions
In conclusion, our ternary-class machine learning framework based on CT radiomics and clinical features shows good performance in stratifying GGNs into PGL, MIA, and IAC, with the MLP model achieving the best overall performance. This approach shows potential as a supportive tool for preoperative noninvasive assessment of GGN invasiveness. Further validation in larger prospective cohorts is required before widespread clinical adoption.
Data Sharing Statement
The datasets generated during and/or analyzed during the current study are available from the corresponding author on reasonable request.
Ethical Approval and Consent to Participate
This retrospective and multi-center study was approved by the Medical Ethics Committee of Zhejiang Provincial People’s Hospital, First People’s Hospital of Tongxiang City, and People’s Hospital of Jianyang City (Nos. 2026-009, 2025-003-01, and JYL202335). All procedures were performed in accordance with the 1975 Declaration of Helsinki and its later amendments. Given that this research only involved retrospective collection and analysis of de-identified clinical imaging and medical data without any additional invasive examinations, interventions or direct contact with enrolled patients, written informed consent from individual participants was formally waived by all above-mentioned ethics committees. Meanwhile, all raw medical records and personal clinical information were strictly anonymized before data extraction. All patient-related sensitive information was fully desensitized, and relevant research data were stored confidentially and used solely for this academic study to fully protect patient privacy and data security.
Consent for Publication
All participants have indicated their consent.
Author Contributions
Yanqing Ma and Pingshan Zhao were responsible for the conceptualization of the project; Yanqing Ma and Haoran Chen took charge of project administration and developed the methodology; Hongxian Gu and Yi Lin provided supervision; All authors made a significant contribution to the work reported, whether that is in the conception, study design, execution, acquisition of data, analysis and interpretation, or in all these areas; took part in drafting, revising or critically reviewing the article; gave final approval of the version to be published; have agreed on the journal to which the article has been submitted; and agree to be accountable for all aspects of the work.
Funding
This study was supported by the Medical and Health Research Projects of Health Commission of Zhejiang Province (Nos. 2025HY0135, 2022KY040, and 2023KY472), 2025 Medical Education Research Projects by the Medical Education Branch of the Chinese Medical Association and the National Center for Medical Education Development (No. 2025B83), and Zhejiang Provincial Natural Science Foundation of China (No. LTGY24H180017).
Disclosure
The authors report no conflicts of interest in this work.
References
1. Bray F, Laversanne M, Sung H, et al. Global cancer statistics 2022: GLOBOCAN estimates of incidence and mortality worldwide for 36 cancers in 185 countries. CA Cancer J Clin. 2024;74(3):229–13. doi:10.3322/caac.21834
2. Nicholson AG, Tsao MS, Beasley MB, et al. The 2021 WHO classification of lung tumors: impact of advances since 2015. J Thorac Oncol. 2022;17(3):362–387. doi:10.1016/j.jtho.2021.11.003
3. Yoen H, Kim JH, Hur BY, et al. Prediction of tumor recurrence and poor survival of ampullary adenocarcinoma using preoperative clinical and CT findings. Eur Radiol. 2021;31(4):2433–2443. doi:10.1007/s00330-020-07316-4
4. Yotsukura M, Asamura H, Motoi N, et al. Long-term prognosis of patients with resected adenocarcinoma in situ and minimally invasive adenocarcinoma of the lung. J Thorac Oncol. 2021;16(8):1312–1320. doi:10.1016/j.jtho.2021.04.007
5. Ma Z, Wang Z, Li Y, et al. Detection and treatment of lung adenocarcinoma at pre-/minimally invasive stage: is it lead-time bias? J Cancer Res Clin Oncol. 2022;148(10):2717–2722. doi:10.1007/s00432-022-04031-z
6. Macmahon H, Naidich DP, Goo JM, et al. Guidelines for management of incidental pulmonary nodules detected on CT images: from the fleischner society 2017. Radiology. 2017;284:228–43.
7. Ma Y, Cao H, Li J, et al. Multi-instance learning based lung nodule system for assessment of CT quality after small-field-of-view reconstruction. Sci Rep. 2024;14(1):3109. doi:10.1038/s41598-024-53797-4
8. Kim RY, Oke JL, Pickup LC, et al. Artificial intelligence tool for assessment of indeterminate pulmonary nodules detected with CT. Radiology. 2022;304(3):683–691. doi:10.1148/radiol.212182
9. Kondo Y, Mikubo M, Ichinoe M, et al. Radiologic parameters predicting the histologic invasiveness of pure ground-glass nodules. Ann Thorac Surg Short Rep. 2024;2(3):464–468. doi:10.1016/j.atssr.2024.02.009
10. Meng F, Guo Y, Li M, et al. Radiomics nomogram: a noninvasive tool for preoperative evaluation of the invasiveness of pulmonary adenocarcinomas manifesting as ground-glass nodules. Transl Oncol. 2021;14(1):100936. doi:10.1016/j.tranon.2020.100936
11. Li C, Bao Y, Wang Y, et al. A comparative study on the diagnostic performance of multiple radiomics models in differentiating PGL and MIA in pulmonary ground-glass nodules. Acad Radiol. 2024.
12. Ma Y, Ma W, Xu X, et al. How does the delta-radiomics better differentiate pre-invasive GGNs from invasive GGNs? Front Oncol. 2020;16(10). doi:10.3389/fonc.2020.01017
13. Mayerhoefer ME, Materka A, Langs G, et al. Introduction to radiomics. J Nucl Med. 2020;61(4):488–495. doi:10.2967/jnumed.118.222893
14. Oudkerk M, Liu S, Heuvelmans MA, et al. Lung cancer LDCT screening and mortality reduction - evidence, pitfalls and future perspectives. Nat Rev Clin Oncol. 2021;18(3):135–151. doi:10.1038/s41571-020-00432-6
15. Zhao Y, Ye Z, Yan Q, et al. Predicting the invasiveness of ground-glass opacity predominant lung adenocarcinoma with clinical stage Ia: a CT-based semantic and radiomics analysis. J Thorac Dis. 2024;16(10):6713–6726. doi:10.21037/jtd-24-775
16. Lee G, Park H, Lee HY, et al. Tumor margin contains prognostic information: radiomic margin characteristics analysis in lung adenocarcinoma patients. Cancers. 2021;13(7):1676. doi:10.3390/cancers13071676
17. Moslemi A, Makimoto K, Tan WC, et al. Quantitative CT lung imaging and machine learning improves prediction of emergency room visits and hospitalizations in COPD. Acad Radiol. 2023;30(4):707–716. doi:10.1016/j.acra.2022.05.009
18. Matsuoka R, Shiba-Ishii A, Nakano N, et al. Heterotopic production of ceruloplasmin by lung adenocarcinoma is significantly correlated with prognosis. Lung Cancer. 2018;118:97–104. doi:10.1016/j.lungcan.2018.01.012
19. Pittaro A, Crivelli F, Orlando G, et al. Pulmonary low malignant potential adenocarcinoma: a validation of the proposed criteria for this novel subtype. Am J Surg Pathol. 2024;48(2):204–211. doi:10.1097/PAS.0000000000002151
20. Xie B, Wang R, Fu K, et al. The value of predicting the invasiveness and degree of infiltration of pulmonary ground-glass nodules based on computed tomography features and enhanced quantitative analysis. Quant Imag in Med Surg. 2024;14(9):6767–6779. doi:10.21037/qims-23-1708
21. Hong JH, Park S, Kim H, et al. Volume and mass doubling time of lung adenocarcinoma according to WHO histologic classification. Korean J Radiol. 2021;22(3):464–475. doi:10.3348/kjr.2020.0592
22. He S, Chen C, Wang Z, et al. The use of the mean computed-tomography value to predict the invasiveness of ground-glass nodules: a meta-analysis. Asian J Surg. 2023;46(2):677–682. doi:10.1016/j.asjsur.2022.07.031
 © 2026 The Author(s). This work is published and licensed by Dove Medical Press Limited. The
full terms of this license are available at https://www.dovepress.com/terms
and incorporate the Creative Commons Attribution
- Non Commercial (unported, 4.0) License.
By accessing the work you hereby accept the Terms. Non-commercial uses of the work are permitted
without any further permission from Dove Medical Press Limited, provided the work is properly
attributed. For permission for commercial use of this work, please see paragraphs 4.2 and 5 of our Terms.
© 2026 The Author(s). This work is published and licensed by Dove Medical Press Limited. The
full terms of this license are available at https://www.dovepress.com/terms
and incorporate the Creative Commons Attribution
- Non Commercial (unported, 4.0) License.
By accessing the work you hereby accept the Terms. Non-commercial uses of the work are permitted
without any further permission from Dove Medical Press Limited, provided the work is properly
attributed. For permission for commercial use of this work, please see paragraphs 4.2 and 5 of our Terms.
Recommended articles
A Predictive Clinical-Radiomics Nomogram for Differentiating Tuberculous Spondylitis from Pyogenic Spondylitis Using CT and Clinical Risk Factors
Wu S, Wei Y, Li H, Zhou C, Chen T, Zhu J, Liu L, Wu S, Ma F, Ye Z, Deng G, Yao Y, Fan B, Liao S, Huang S, Sun X, Chen L, Guo H, Chen W, Zhan X, Liu C
Infection and Drug Resistance 2022, 15:7327-7338
Published Date: 13 December 2022
Development and Validation of a Comprehensive Model for Predicting Distant Metastasis of Solid Lung Adenocarcinoma: 3D Radiomics, 2D Radiomics and Clinical Features
Peng Z, Lin Z, He A, Yi L, Jin M, Chen Z, Tao Y, Yang Y, Cui C, Liu Y, Zuo M
Cancer Management and Research 2022, 14:3437-3448
Published Date: 13 December 2022
Integration of Multimodal Computed Tomography Radiomic Features of Primary Tumors and the Spleen to Predict Early Recurrence in Patients with Postoperative Adjuvant Transarterial Chemoembolization
Chen C, Liu J, Gu Z, Sun Y, Lu W, Liu X, Chen K, Ma T, Zhao S, Zhao H
Journal of Hepatocellular Carcinoma 2023, 10:1295-1308
Published Date: 8 August 2023
Preoperative Noninvasive Prediction of Recurrence-Free Survival in Hepatocellular Carcinoma Using CT-Based Radiomics Model
Dai T, Gu QB, Peng YJ, Yu CL, Liu P, He YQ
Journal of Hepatocellular Carcinoma 2024, 11:2211-2222
Published Date: 14 November 2024
A CT-Based Lung Radiomics Nomogram for Classifying the Severity of Chronic Obstructive Pulmonary Disease
Zhou T, Zhou X, Ni J, Guan Y, Jiang X, Lin X, Li J, Xia Y, Wang X, Wang Y, Huang W, Tu W, Dong P, Li Z, Liu S, Fan L
International Journal of Chronic Obstructive Pulmonary Disease 2024, 19:2705-2717
Published Date: 11 December 2024