Back to Journals » International Journal of Chronic Obstructive Pulmonary Disease » Volume 21
Construction and Validation of Active Case-Finding Tool in Community Participants with Chronic Obstructive Pulmonary Disease Using an Interpretable Machine Learning Approach
Authors Tian H, Wu F ![]() , Sun C, Deng Z
, Sun C, Deng Z ![]() , Zhou Y, Ran P
, Zhou Y, Ran P
Received 5 February 2026
Accepted for publication 1 June 2026
Published 16 June 2026 Volume 2026:21 589883
DOI https://doi.org/10.2147/COPD.S589883
Checked for plagiarism Yes
Review by Single anonymous peer review
Peer reviewer comments 2
Editor who approved publication: Prof. Dr. Richard Russell
Heshen Tian,1,2,* Fan Wu,1,* Chuanqi Sun,1 Zhishan Deng,1 Yumin Zhou,1,3 Pixin Ran1,3
1State Key Laboratory of Respiratory Disease, National Clinical Research Center for Respiratory Diseases, National Center for Respiratory Medicine, Guangzhou Institute of Respiratory Health, The First Affiliated Hospital of Guangzhou Medical University, Guangzhou, People’s Republic of China; 2Department of Respiratory and Critical Care Medicine, The Second Affiliated Hospital of Zhejiang University School of Medicine, Hangzhou, People’s Republic of China; 3Guangzhou National Laboratory, Guangzhou, People’s Republic of China
*These authors contributed equally to this work
Correspondence: Pixin Ran, State Key Laboratory of Respiratory Disease & National Clinical Research Center for Respiratory Diseases & National Center for Respiratory Medicine & Guangzhou Institute of Respiratory Health, The First Affiliated Hospital of Guangzhou Medical University, Guangzhou National Laboratory, Guangzhou, People’s Republic of China, Email [email protected] Yumin Zhou, State Key Laboratory of Respiratory Disease & National Clinical Research Center for Respiratory Diseases & National Center for Respiratory Medicine & Guangzhou Institute of Respiratory Health, The First Affiliated Hospital of Guangzhou Medical University, Guangzhou National Laboratory, Guangzhou, People’s Republic of China, Email [email protected]
Purpose: Early diagnosis is an effective strategy in chronic obstructive pulmonary disease (COPD) prevention. Active case-finding is an effective approach, but traditional tools such as COPD-SQ are limited by outdated data, poor extrapolation, and singular binary prediction. This study aimed to develop an updated, convenient, and interpretable machine learning tool for COPD screening in community participants.
Patients and Methods: Data for model training and external validation were obtained from two community-based studies in Guangdong, China. PyCaret and R programming language were used to develop machine learning models. Thirty original items, including demographic data, clinical features, and risk factor data, were initially used. Eleven machine learning classification models were compared, and the least absolute shrinkage and selection operator was further used to shrink predictors. Model performance was evaluated using ROC, AUC, accuracy, sensitivity, specificity, and other metrics. Shapley Additive exPlanations were used to interpret the models.
Results: A total of 5381 and 2456 participants from the training and external validation cohorts were included, respectively. In predicting COPD, the AdaBoost model showed the best performance, with an accuracy of 0.846 and an AUC of 0.848. For GOLD classification prediction, the model achieved an overall accuracy of 0.822 and an AUC of 0.816, and identified 83% of moderate-to-severe COPD in the community. In regression analysis, the gradient boosting regression model showed good consistency between predicted and measured FEV1 %pred and FEV1/FVC values. The models also demonstrated good performance in the external validation cohort and were deployed online.
Conclusion: We constructed an active case-finding tool with integrated machine learning models for predicting COPD, COPD severity, and lung function parameters using limited clinical data. This tool may help prioritize high-risk individuals for confirmatory spirometry in community settings. Future implementation studies should evaluate its effect on referral efficiency, diagnostic yield, treatment uptake, and long-term outcomes.
Keywords: COPD, community screening, clinical prediction model, machine learning
Introduction
Chronic obstructive pulmonary disease (COPD) is presently the fourth leading cause of death worldwide and is projected to become the third leading cause by 2030.1 Early diagnosis is known as an effective strategy for COPD prevention at present.2,3 The diagnosis of COPD relies on the forced expiratory volume in one second (FEV1)/forced vital capacity (FVC) ratio. However, the prevalence rate and quality control of spirometry in primary care setting and community health institutions suffer from significant deficiencies (6.9% and 7.2%, respectively). The United States Preventive Services Task Force also does not recommend spirometry in community screening for asymptomatic individuals, suggesting the limitations of spirometry for COPD early diagnosis in China.4,5
Active case-finding as a screening method has become increasingly valuable for individuals with undiagnosed COPD or high risk of COPD.2 Simple tools such as questionnaires, sometimes combined with peak expiratory flow meters, are employed in large-scale screening. Subsequently, high-risk individuals will be recommended to undergo spirometry for diagnostic confirmation, which increases the medical cost-effectiveness and reduces disease burden.6–9 Our previous study has developed several native active case-finding tools such as COPD-Screening Questionnaire (COPD-SQ) and a Bayesian model.10,11 However, there are significant transformations in both lifestyle and the age distribution of patients with COPD within recent years. Whether there are uncovered prediction factors or changed pattern of them remains to study. Moreover, COPD-SQ have suffered limitations such as outdated data collection (2002–2006), and scoring systems formulated through artificial processes, leading to bias and poor extrapolation, especially in the young population aged 40–65 years old.12,13 Most importantly, traditional tools can only answer whether a person has or not have the COPD risk. In some remote regions without access to spirometry, the ability of directly predicting the probability, the classification or even lung function parameters of COPD will bring more benefit. So, there is an urgent requirement for making updated, more convenience and powerful tools in COPD prediction.
Artificial intelligence (AI) technologies have brought new breakthroughs in medical fields.14,15 Currently, machine learning is widely used in medical image recognition, tumour diagnosis and classification, as well as COVID-19 and asthma exacerbation risk prediction, achieving accuracy and good generalizability surpassing human experts and traditional models.16–18 However, there are still gaps in the application of AI for predicting COPD in high-risk individuals.19 Several studies have reported machine learning (ML) models for COPD prediction in the Chinese population. But the data used to train these models were based on International Classification of Diseases codes, computed tomography (CT) images, blood biomarker, or collected from disease-specific contexts.19–22 These models are not suitable for community individuals and cannot predict disease severity. Recently, a Korean scholar also found that ML could be used to estimate the FEV1/FVC value of patients with COPD through risk factors, suggesting that ML modeling has great potential. At present, there is no ML model that uses clinical data from real-world community survey sources to update prediction features and using lung function as the predictor variable in COPD prediction, which arouse our research interest.
In this study, based on our own survey and prospective cohort in Guangdong recently. We use ML method to develop and validate multi-factorial models for predicting COPD, Global initiative for chronic obstructive lung disease (GOLD) classification, and FEV1 %pred, FEV1/FVC values. The models rely on clinical data alone and have higher prediction effect for active case-finding in high-risk individuals or with undiagnosed COPD.
Methods
Study Population and Design
This study used data from two independent community-based studies in Guangdong Province, China. The development cohort was derived from the ECOPD study (ChiCTR1900024643, registered on July 19, 2019), which recruited community residents aged 40–80 years from Wengyuan County of Shaoguan, and Lianping County of Heyuan between 2019 and 2023. The external validation cohort was derived from a separate COPD screening project conducted under the “13th Five-Year” Science and Technology Support Program between 2015 and 2017, which recruited community residents aged 40–65 years from six urban communities in Guangzhou. Thus, the development and external validation cohorts were independent study populations (Figure 1). All procedures were approved by the Clinical Research Ethics Committee of The First Affiliated Hospital, Guangzhou Medical University. The basic characteristics of participants are listed in Table 1 and S1.
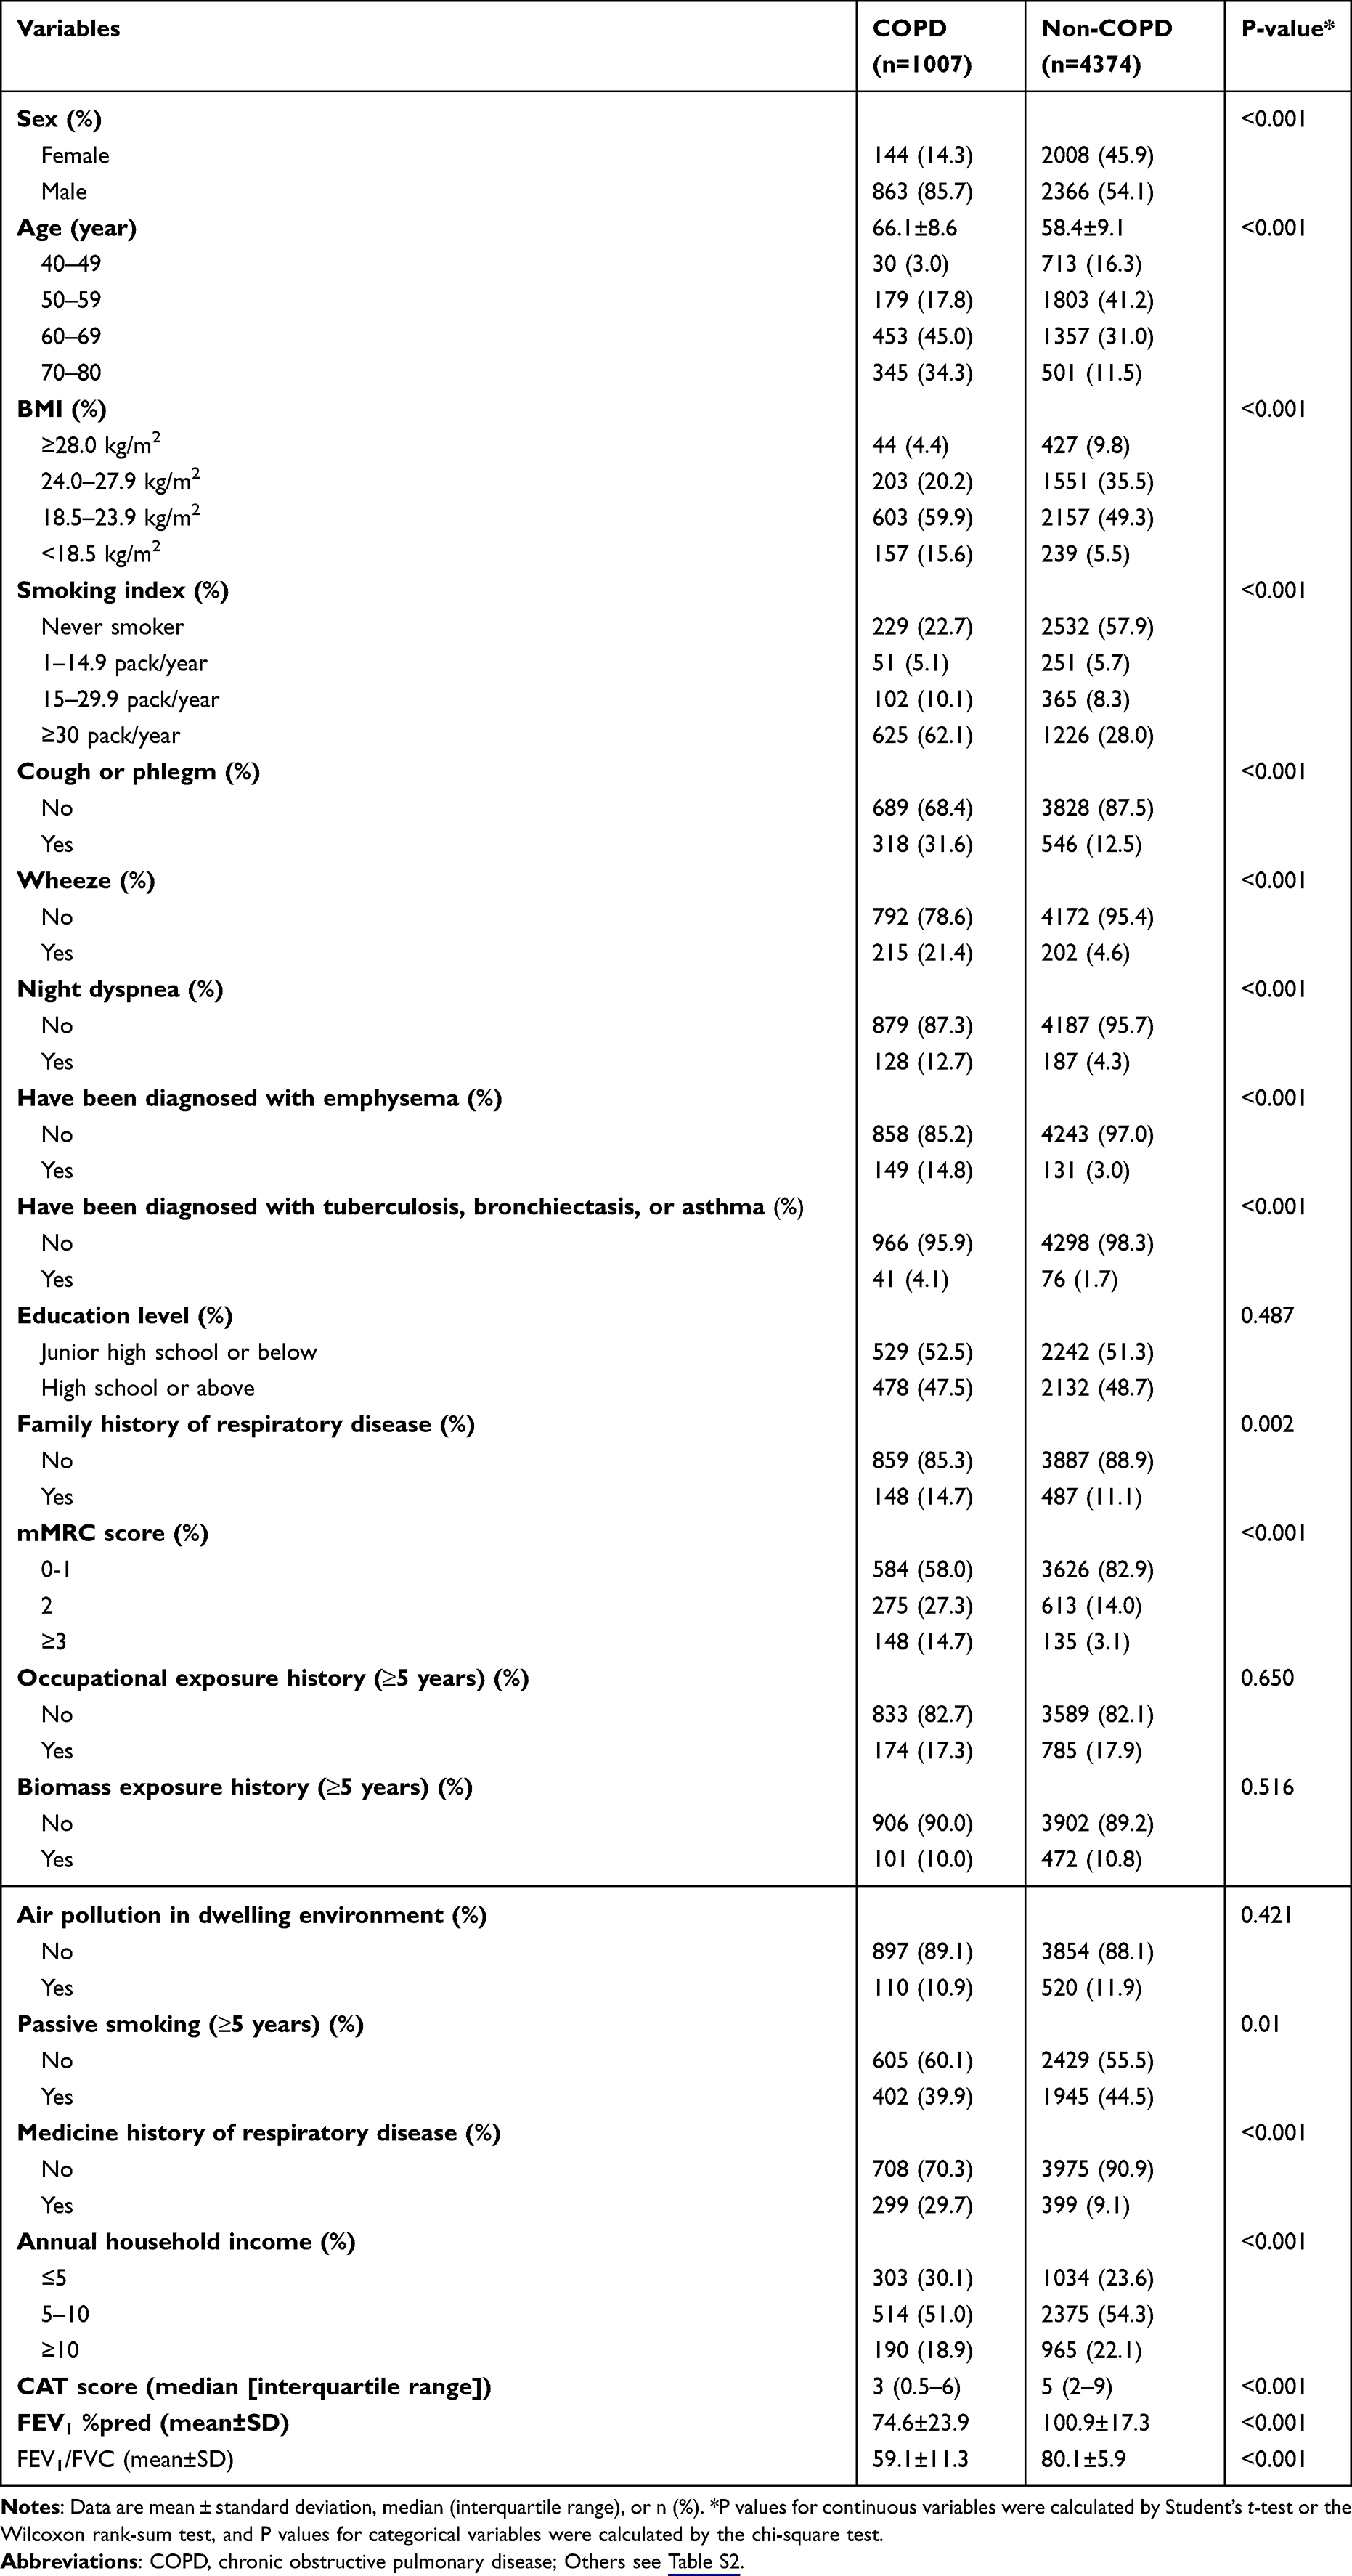 |
Table 1 The Characteristics of Training Cohort Participants |
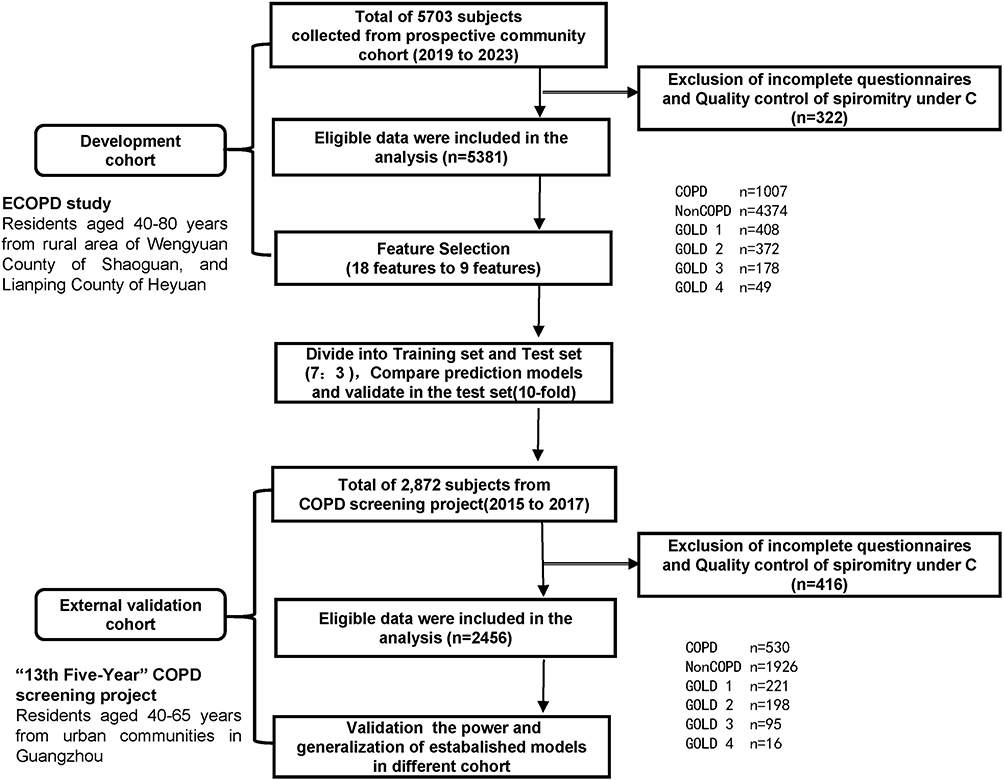 |
Figure 1 Flowchart of data sources and participant selection. The development cohort was derived from the ECOPD study, which recruited community residents aged 40–80 years from Wengyuan County of Shaoguan, and Lianping County of Heyuan between 2019 and 2023. The external validation cohort was derived from an independent COPD screening project conducted under the “13th Five-Year” Science and Technology Support Program, which recruited community residents aged 40–65 years from six urban communities in Guangzhou between 2015 and 2017. |
The clinical data was collected by an epidemiological questionnaire which developed based on Burden of Obstructive Lung Disease (BOLD) study and the previous 2007 Chinese epidemiological survey questionnaire of our research team. Mainly consist of: demographic data, respiratory symptoms, history of respiratory diseases/medication use, risk factors, etc. Spirometry, COPD, GOLD classification and LLN according to the previous report.22–24
Data Collection and Preprocessing
All participants were community residents aged 40–80 years; Those participants: (1) unable to complete the spirometry examination; (2) had active pulmonary tuberculosis or currently receiving anti-tuberculosis treatment; (3) newly diagnosed with or receiving treatment for tumors; (4) pregnant or lactating women were excluded.
We collected more than 30 raw data from the training cohort according to clinical significance and the convenience for community screening. Characteristic factors were extracted as: demographic data, symptoms data, exposure history, disease history, vital signs. Variables belonging to similar items or clinical types, but exhibited with different perspectives (such as “dyspnea”, “night dyspnea”, “morning dyspnea”, etc), were filtered by independent, combined, or merged analysis to get the least collinearity and the best generalization ability. Detailed classification, code and interpretation are listed in Table S2.
We next preprocessed the characteristic factors for the model’s establishment. All selected variables contained <30% missing values. Categorical variables were labeled with Arabic numerals 0–9. For missing values that could not be manually imputed, different imputation methods were applied to each feature using chained equations according to our previous report. In addition, all features were normalized to the range of 0 (mean) and 1 (SD) using the “normalize” parameter in PyCaret. The “combine_rare_levels” parameter in PyCaret was used for data combination to reduce classification and improve accuracy (Table S3).
Construction and Evaluation of Predictive Models
First, 1007 patients with COPD and 4374 control participants of training cohort were divided into the training sets and internal validation sets at the ratio of 7:3 randomly. Python-related libraries (PyCaret) were used to established prediction models. The ML algorithms considered in this study included: random forest (RF), support vector machine (SVM), logistic regression (LR), Light Gradient Boosting Machine (LightGBM), Decision Tree Classifier (DT), Adaptive Boosting (AdBoost), gradient boosting classifier (GBC), eXtreme Gradient Boosting (XGBoost), K-Nearest-Neighbors (KNN), Gaussian Naïve Bayes (GNB), linear discriminant analysis (LDA), and quadratic discriminant analysis (QDA) for categorical variables by “Pycaret.compare model” parameter. For continuous variables: Gradient Boosting Regressor (GBR), Bayesian Ridge (BR), Ridge Regression (ridge), Linear Regression were built by “Pycaret.regression” parameter. Ten-fold cross-validation (repeat 10 samples) was used to trained and tested the above models.
This study used the Recursive feature elimination and Cross Validation (RFECV) method to achieve feature screening, after importance evaluation, the optimal number of features is selected by cross validation. The performance of ML models is mainly evaluated using the area under the receiver operating characteristic (AU-ROC) curve, the area under the precision-recall (AU-PRC) curve, and the confusion matrix by “Pycaret.classification”: including Accuracy, Recall, Precision, F1-score, and Matthews correlation coefficient (MCC) and Kappa. Positive predictive value (PPV) and negative predictive value (NPV) were used to further evaluate the optimal models. For continuous variables, “Pycaret.regression” were used to evaluate mean absolute error (MAE), mean squared error (MSE), root mean squared error (RMSE), coefficient of determination (R2), root mean squared logarithmic error (RMSLE), mean absolute percentage error (RMSE). After all parameters and features are determined, we use “tune_model” to further optimize the model. Furthermore, R Studio (3.0.1+) was used to plot the decision curve analysis (DCA). R software (library glmnet) was used to conduct the least absolute shrinkage and selection operator (LASSO) regression. PyCaret and Python (shap0.39.0) was used to draw the SHAP interpretation. The external validation cohort was used to validate the performance of the models mentioned above by same ways.
Since this study focused on supervised prediction using structured clinical data, the limited support of PyCaret for deep learning and unsupervised learning was unlikely to affect the validity of the analysis. To reduce redundancy and instability in feature selection, clinically overlapping variables were first combined or filtered, and RFECV was complemented by LASSO regression to derive a parsimonious final predictor set.
Statistical Analyses
Statistical analysis was conducted using SPSS 25.0 (IBM Corp, Armonk, NY) and RStudio 3.5.1 (Solvusoft Corp, Los Angeles, CA) software. GraphPad Prism 7.0 (GraphPad Software Inc., San Diego, CA) was used for some data visualization. Comparison of parametric variables and categorical variables was performed using t-tests, non-parametric U-tests, or chi-square tests. The diagnostic value of the optimal model was evaluated using metrics such as accuracy, ROC, PPV, and NPV. Bland-Altman tests (MedCalc v20.0.1) were used to assess the consistency of continuous variables. A two-sided p-value < 0.05 was considered statistically significant.
Results
Participants Characteristics of Baseline
Table 1 shows the clinical characteristics, respiratory epidemiology data, spirometry of the training cohort based on the spirometry-defined COPD of GOLD standard. Participants were categorized into “COPD” and “Non-COPD” groups. There were significant differences in age, sex, smoking status, body mass index (BMI), respiratory symptom, income, modified British Medical Research Council (mMRC) score, COPD assessment test (CAT) score, FEV1/FVC and FEV1 between COPD patients and controls (P<0.001) in both the training and test sets. The education level, exposure history, and air pollution levels were similar between the two groups. The results indicated that patients with COPD were more likely to be older, male, and smokers, and the FEV1/FVC and FEV1 values were lower in the COPD group than in the control. Other characteristics information including comparison between development cohort and external validation cohort are shown in Table S7.
Machine Learning Algorithms for Model Comparison
Pre-process and normalized of all features are shown in Table S3. Within the training data set, a variety of machine learning models were trained and repeated 10 times, including AdaBoost, LR, RF, DT, three Gradient Boosting models (GBC, XGBoost, and LightGBM), SVM, KNN, GNB, QDA, and LDA. The discrimination criterion for classifying COPD is based on the GOLD standard. The model that demonstrated the optimal generalization capability in the testing set was selected, and the variable selection results of this model are presented.
Five models (AdBoost, LR, GBC, GBN, and LightGBM) obtained AUCs above 0.8, demonstrated good discriminative power (Table S4 and Figure S1). Compared these models with generalization capability and evaluation metrics such as Accuracy, Recall and F1-score. AdBoost had the optimal predictive performance with the average Accuracy over 10-fold cross-validation was 0.846 (95% confidence interval [Cl]: 0.834–0.858), and the AUC was 0.848 (95% Cl: 0.827–0.854). Therefore, AdBoost model was selected for further evaluation such as variable selection and feature ranking.
Features Selected in Model
As shown in Figure 2, the selection of the number of features is based on the Ada model algorithm, employing RFECV. Following recursive feature elimination and scoring, the optimal number of features was determined using 10-fold cross-validation (Figure S2). Ultimately, 18 input features were initially derived for model development (Figure 3). The RFECV results indicate that incorporating 12 features achieves maximum performance, while the remaining 6 variables do not significantly affect. So, these features were eliminated to reduce over-fitting. The principle for removing variables is based on the importance of the variable characteristics, as shown in Figure 3. Finally, the top of 12 important features were selected: Sidx, Age, mMRC3, S, Drugu, Wh, LD12, CP, B, Bio, Fh, LD345 (code see Table S3).
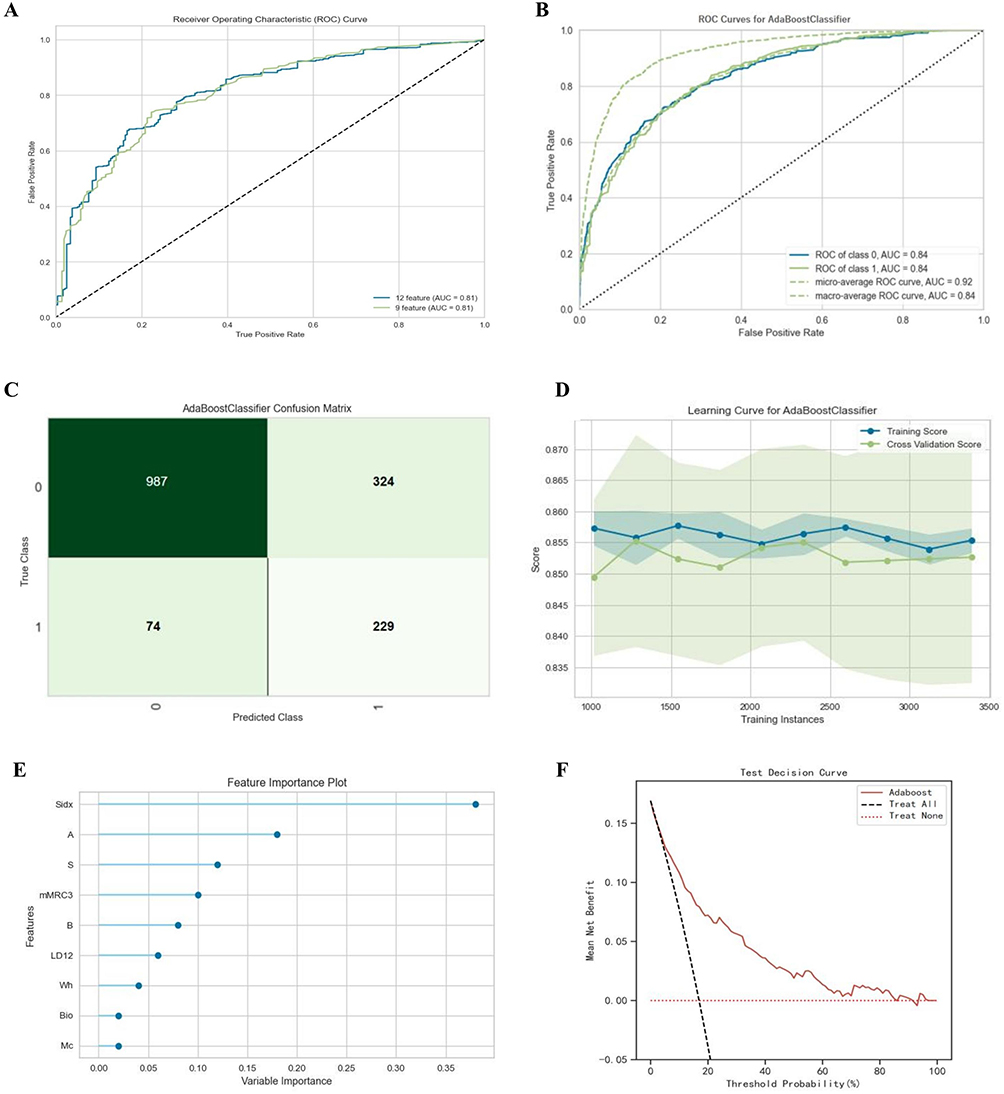 |
Figure 2 Optimal model construction and evaluation. (A) The plot of AUC-ROC by 12 variables and 9 variables, Z test showed that there was no significant difference in discrimination between the two groups (P>0.05); (B) AUC-ROC curve, values were taken as micro-average ROC curve; (C) Confusion matrix; (D) Learning curve; (E) Feature importance weight; (F) Decision curve analysis of four models plotting the net benefit at different threshold probabilities. |
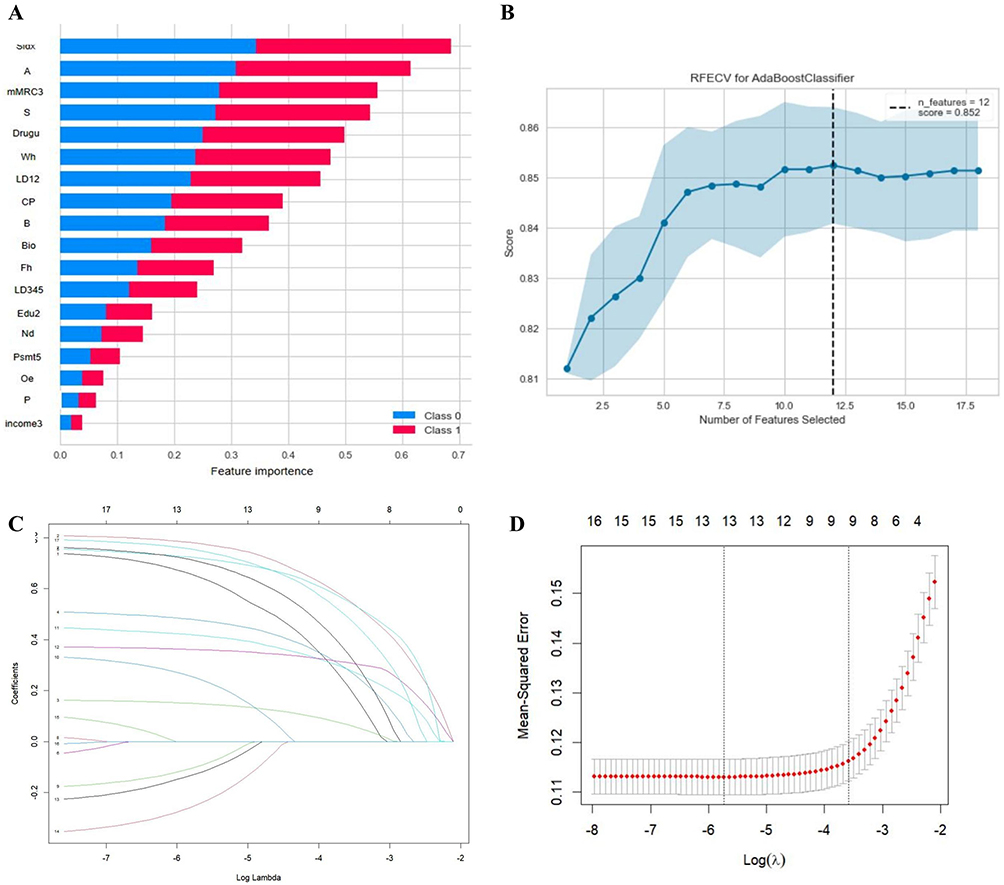 |
Figure 3 Feature selection procedure using RFECV and LASSO regression. (A) Feature importance ranking based on the initial machine-learning model. (B) Recursive feature elimination with cross-validation (RFECV) curve showing the selection of 12 candidate features. (C) LASSO coefficient profiles across different values of log(λ). (D) Cross-validation curve for the LASSO model. The vertical dotted lines indicate the λ value with the minimum mean squared error and the λ1se value, respectively. Both approaches supported a parsimonious model with nine predictors. |
It can be seen from Figure 3 that some of the 12 variables still contributed little to the AdBoost model. To validate the result of ML variable selection and make variables fewer, Lasso regression was conducted as an alternative approach. The results showed that the raw independent variables exhibited multicollinearity and were reduced to 9 (age, sex, BMI, cough and phlegm, wheeze, emphysema had been diagnosed, mMRC dyspnea index, smoking index, and drug use history of respiratory diseases (Table S5). When λ reached a certain value, further increasing the number of predictors by reducing λ did not substantially improve model performance (Figure 3). This result is highly consistent with machine learning screening, suggesting that variable selection is relatively reliable. Corresponding OR values and CIs are shown in Table S5.
The Optimal Models Building and Evaluation
First, following the GOLD-defined COPD criteria, we conducted pre-experiment with the aforementioned 12 variables and 9 variables, respectively, and plotted the ROC curves based on the optimal results (Figure 2). The AUCs were 0.844 (SE=0.10, 95% CI 0.831–0.858) and 0.841 (SE=0.07, 95% CI 0.827–0.855), respectively. The Z-test results showed P>0.05, indicating no significant difference in discriminative ability between the two groups. We ultimately used 9 features to build the model by dividing the training set and validation set at a ratio of 7:3 and conducted 10-fold cross-validation.
The results indicated that the model with the best generalization ability in the testing set was Adaboost. After model tuning, it showed an accuracy of 0.851, AUC of 0.84 (95% CI: 0.827–0.854), with the optimal threshold set at 0.802 based on the Youden index. Details are shown in Table 2. The learning curve showed that the model performance improved as the sample size increased, and it remained stable when the sample size was between 1500 and 3000. Smoking index contributed the most to the model, with an F-score of 0.27. The results above indicate that the model has a good overall fit and can predict the risk of COPD occurrence, thus improving lung function screening effectiveness. The ROC curve, precision–recall curve, calibration curve, confusion matrix, learning curve, and feature importance plot are shown in Figures 2 and S2.
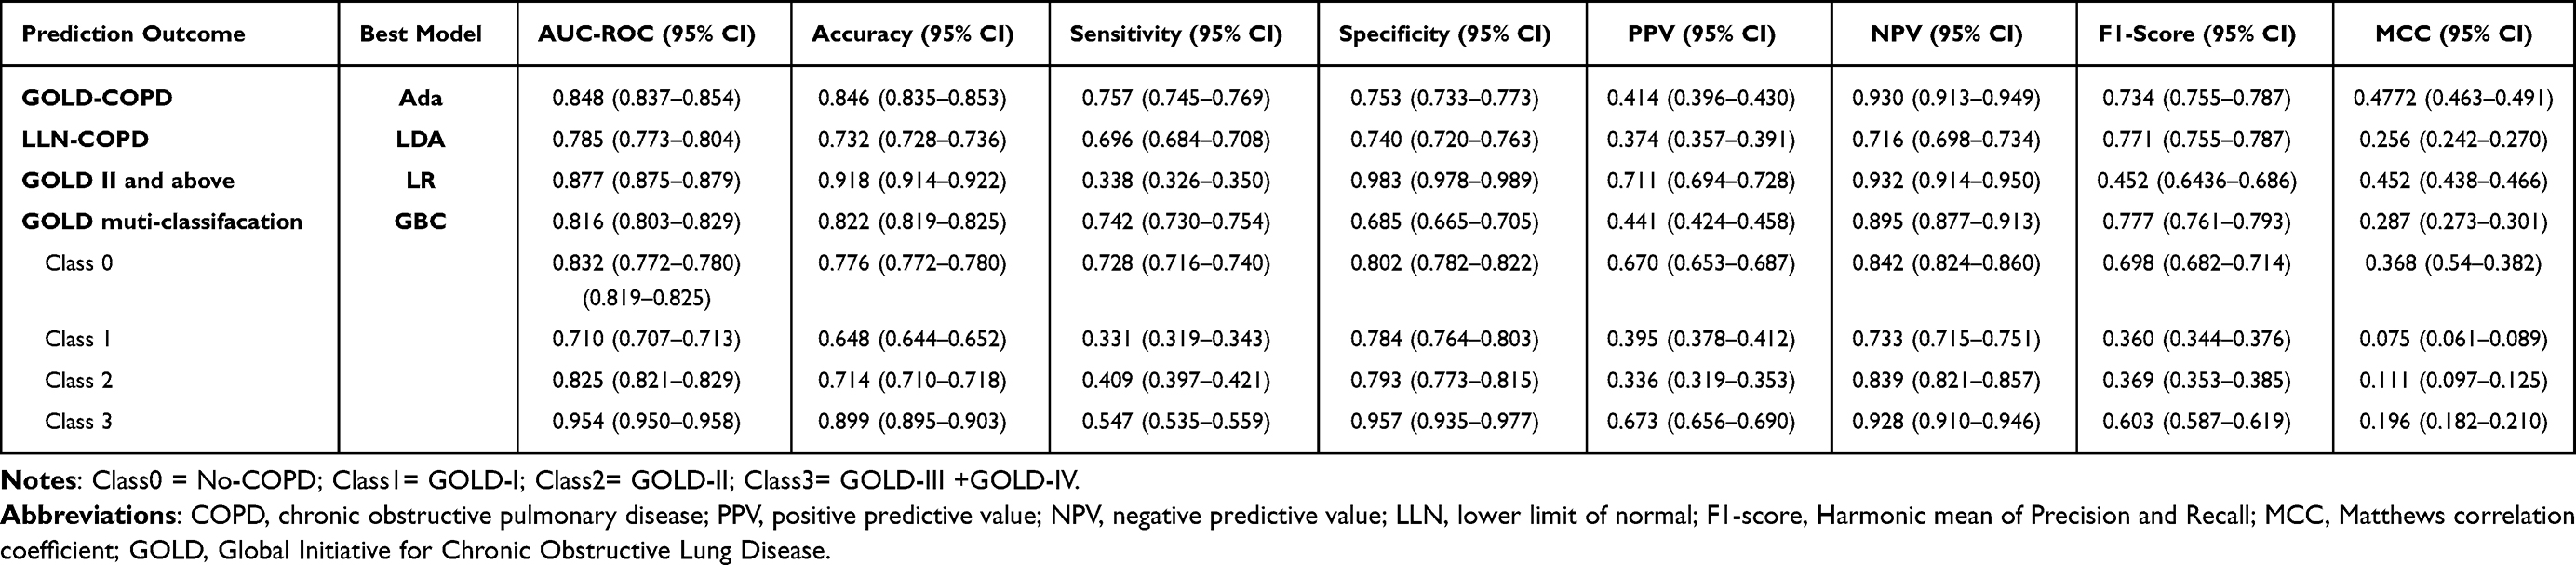 |
Table 2 Diagnostic Performance of the Testing Sets of the Machine Learning Model |
We also test the performance of model build with the same 9 features using LLN as the COPD standard. The results showed that the optimal model was LDA, with a maximum accuracy of 0.847, balanced accuracy of 0.732, and AUC of 0.785 (95% CI: 0.763–0.798). The ROC curve, feature importance plot, and detailed model performance are shown in Figures S4, S5 and Table S5.
Finally, we construct DCA curve to compare the net benefit and assess the clinical applicability of the models. According to the DCA results, the AdaBoost and LDA models showed a positive net benefit in the testing dataset across threshold probabilities of 0.2–0.8 (Figure 2) and 0.2–0.9 (Figure S3), respectively.
Interpretation of COPD Prediction Model with the SHAP Method
The global importance of each feature we estimated in SHAP was used to understand the general impact of various features across all samples. The variable importance plot lists the most significant variables in a descending order. Furthermore, to detect the positive and negative relationships of the predictors with the target result, SHAP values were applied to uncover risk factors of patients with undiagnosed COPD. As presented in Figure 4, the horizontal location shows whether the effect of that value is associated with a higher or lower prediction and the color shows whether that variable is high (in red) or low (in blue) for that observation; for example, it can be seen that increase in the age, smoking index and mMRC≥2 has a positive impact and push the prediction toward morbidity, whereas increase in sex (female) and BMI has a negative impact and push the prediction toward health.
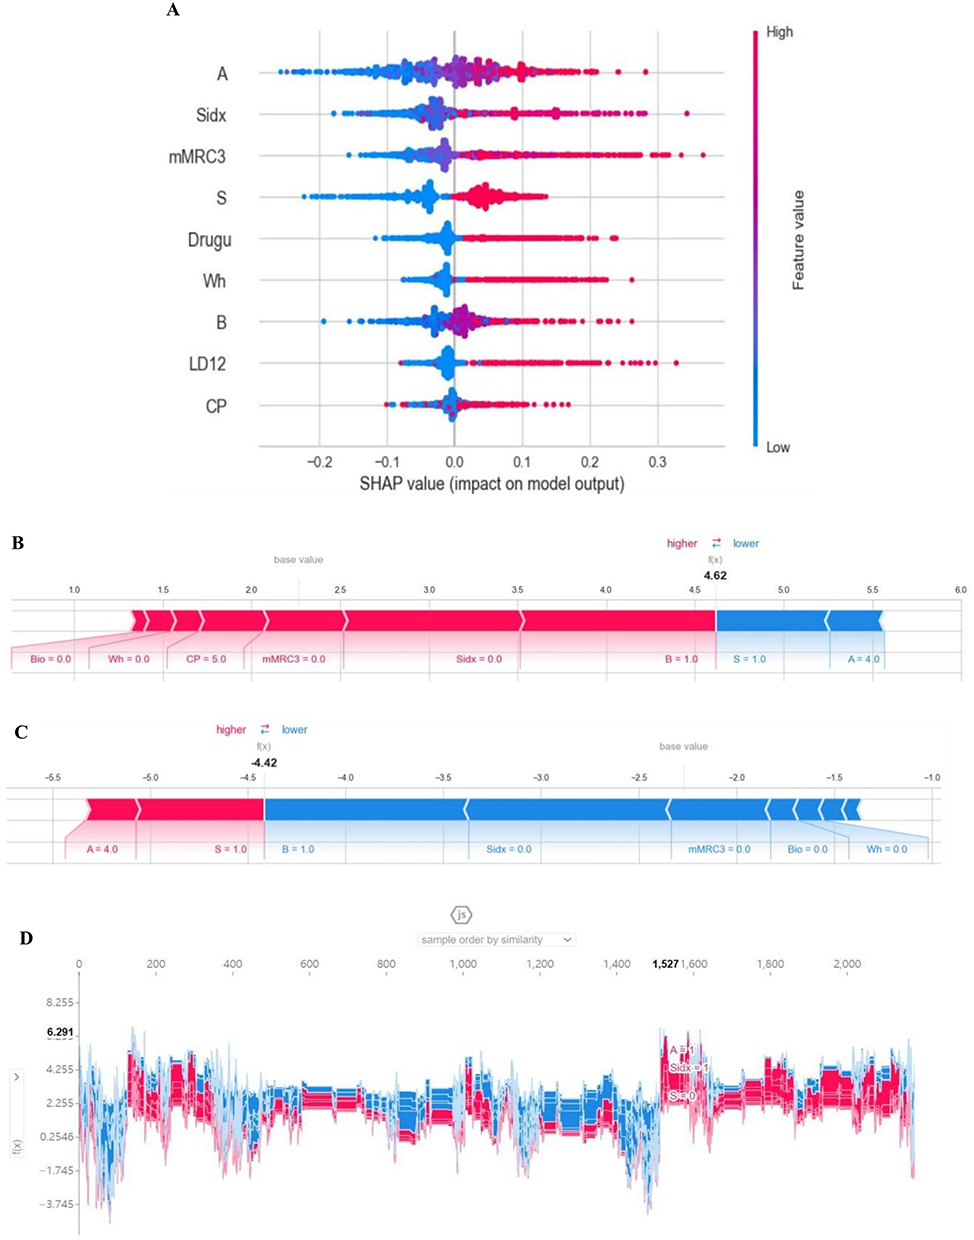 |
Figure 4 Model interpretation by SHAP method. (A) SHAP summary plot. A dot is created for each feature attribution value for the model of each subject, and thus one subject is allocated one dot on the line for each feature. Dots are colored according to the values of features for the respective patient and accumulate vertically to depict density. Red represents a high feature value, whereas blue represents a low feature value. The further away a point is from the baseline SHAP value of zero, the stronger its effect on the model output; (B and C) Shapley Additive exPlanations (SHAP) force plots for two selected outcomes. (B) for COPD, (C) for Non-COPD; (D) Similarity plot for each sample. |
In the summary plot, the presence of these indicators greatly contributed to the COPD. The individual force plots for participants with COPD and without COPD (Figure 4). The SHAP values indicate the prediction-related feature of individual patients and the contribution of each feature to the mortality prediction. The bold-faced numbers are the probabilistic predicted values (f(x)), whereas the base values are the values predicted without giving input to the model. The f(x) is the log odds ratio of each observation. The red features (on the left) indicate features that increase the morbidity risk, and the blue features indicate features that decrease the morbidity risk. The length of the arrows helps visualize the magnitude of the effect on the prediction. The longer the arrow, the larger the effect. SHAP similarity plot (Figure 4) illustrated the entire distribution of each feature’s impact on the model output. These indicators directly or indirectly reflect the history of respiratory medication, wheezing, smoking index, dyspnea, cough and sputum production, and body mass index were 6 of the 9 most important features.
The Performance of ML Algorithms in Predicting Multi-Classification of COPD and Lung Function Value
From the above results, we found that ML methods got great efficiency in predicting COPD of the community population based on few features. We further attempted to construct a multi-classification model and evaluate whether the above features can directly predict GOLD grades of COPD. The results showed that the model based on GBC model had an overall accuracy of 0.822 in predicting GOLD grades in the validation set, with an overall AUC of 0.816. The AUC for predicting non-COPD (class 0), GOLD 1 (class 1), GOLD 2 (class 2) and GOLD 3 and above (class 3) was 0.832, 0.710, 0.825, and 0.954, respectively (Figure 5 and Table 2).
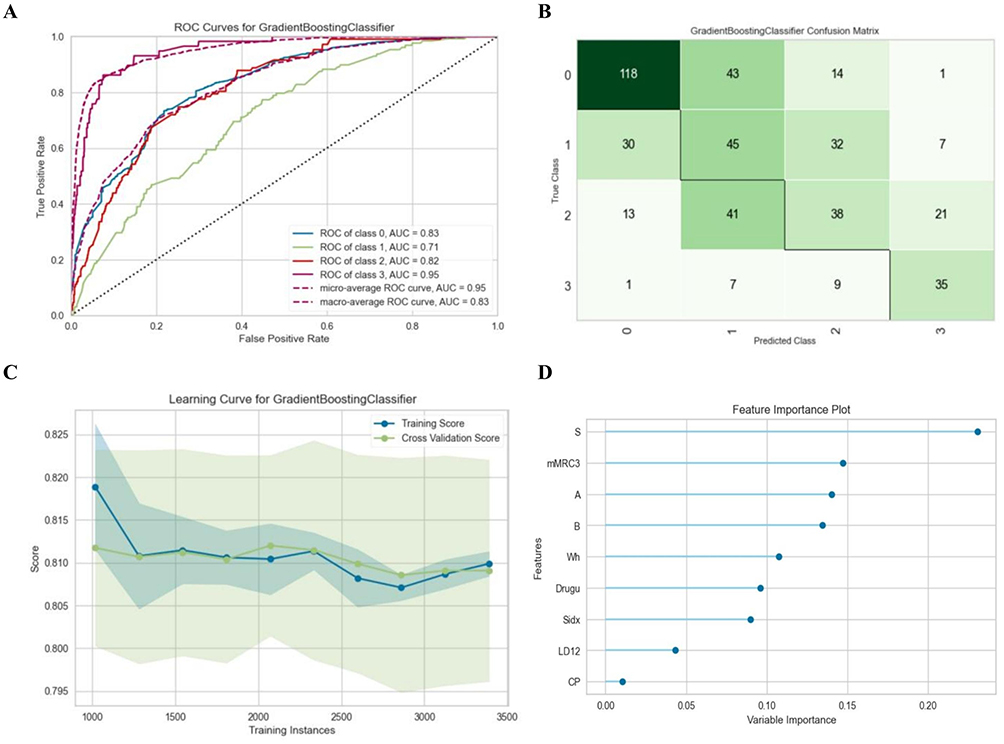 |
Figure 5 Performance of the GBC model in the testing datasets to predict GOLD standard COPD classification. (A) ROC curve and area under curve (AUC) of the model predicting different grades; (B) Confusion matrix: class0= non-COPD, class1=GOLD1, class2=GOLD2, class3=GOLD3+4. (C) Learning curve; (D) Feature importance weight. |
We further used the “Pycaret.regression” database to train models to directly predict the FEV1 %pred and the FEV1/FVC. Table 3 shows that the gbr model got the best performance in the testing set. Residual plots of FEV1%pred and FEV1/FVC (Figure 6) have shown that the residual distribution is random and uniform, there is no obvious under-fitting or over-fitting, and the systematic deviation of the model is low. Feature importance plots are shown in Figure 6. Bland-Altman consistency test results showed that 93.2% and 96.1% of the results for the true and predicted FEV1 %pred and FEV1/FVC values were within the mean ± 1.96 SD range, with a mean error of −0.4262 (−0.7022 to 0.1789) and 0.036 (−0.199 to 0.271), P (H0 mean = 0) of 0.2443 and 0.7443, indicating no significant difference and suggesting good consistency between the predicted and measured values. Other details are shown in Table S6.
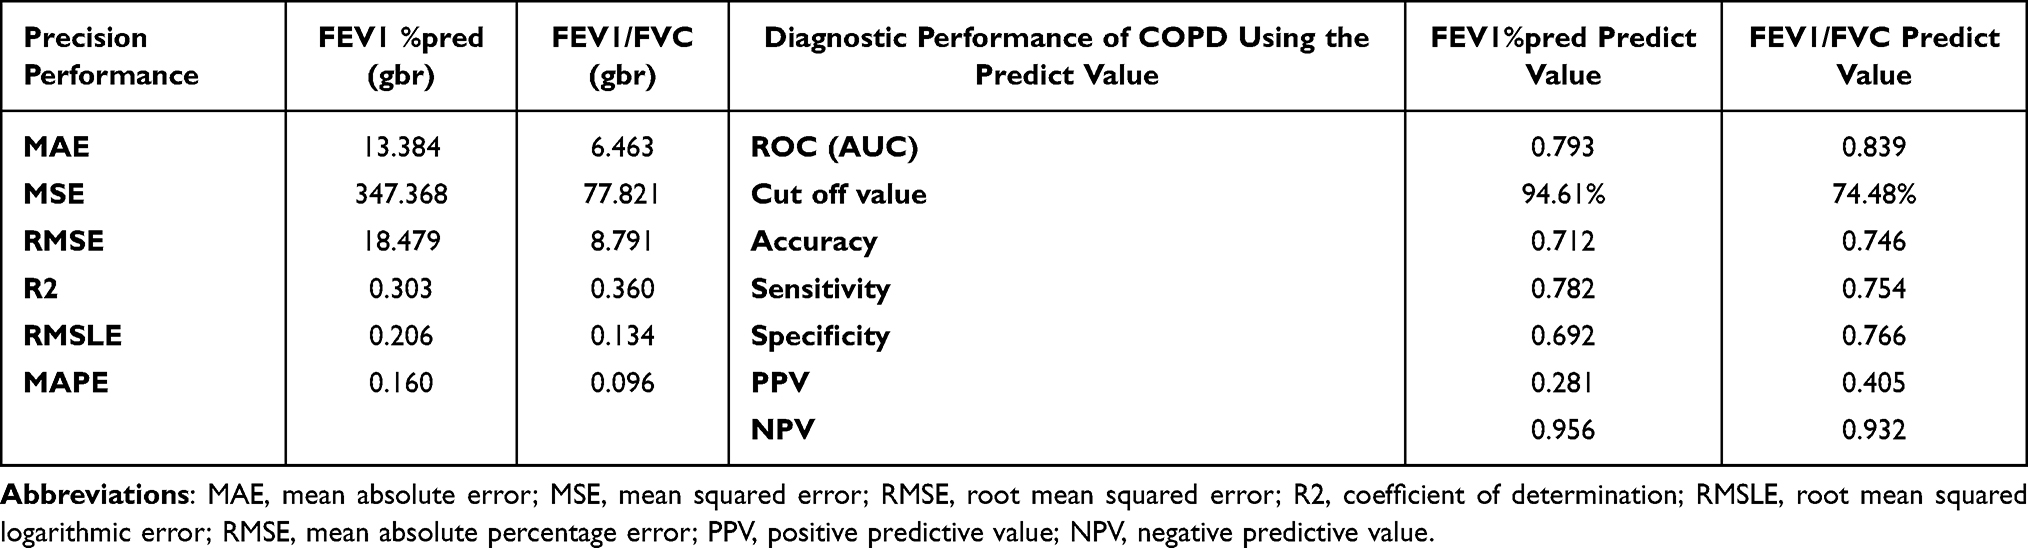 |
Table 3 Performance of the Testing Sets of the Regression Models in Development Cohort |
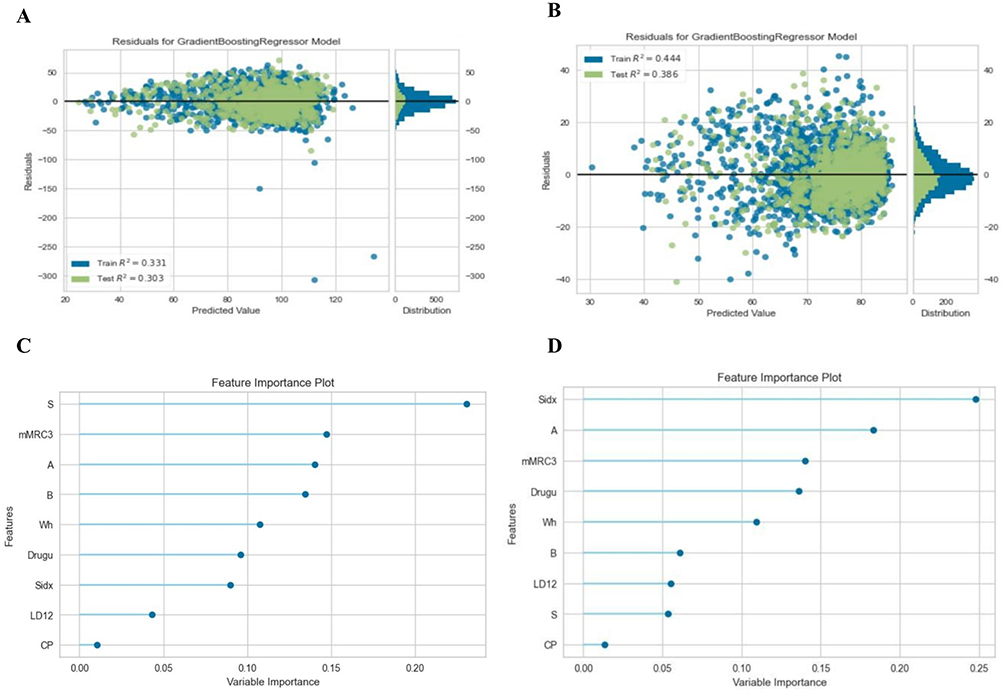 |
Figure 6 Performance of the GBR model in the testing datasets to predict continuous variable. (A) Residual plot of the gbr model FEV1 %pred and (B) FEV1/FVC; (C and D) Feature importance plots. |
External Validation
Comparison of variables between the training and external validation cohorts is shown in Table S7. Participants in the external validation cohort were older than those in the training cohort. Further, there were more patients with COPD in the external validation cohort than in the training cohort (21.5% vs 18.7%). Compared with the training cohort, patients in the external validation cohort had lower FEV1 %pred, FEV1/FVC, BMI, smoking index and more respiratory symptom, higher mMRC score. The preprocessing and input of the external dataset were the same as before. The GOLD-COPD, LLN-COPD, multi-classification and lung function value prediction models have good performance in the external validation cohort. Results and detailed information are shown in Tables S8 and S9.
Discussion
With a global underdiagnosis rate as high as 70–80%, early identification of COPD remains challenging.4 It is known that screening tools, such as questionnaires for active case-finding, are recognized as the most cost-effective method for community screening of COPD.24 Previous studies have shown that systematic targeted case-finding is more effective than routine care in identifying previously undiagnosed COPD, and evidence from China suggests that questionnaire-based screening combined with microspirometry is feasible in primary care.25,26 However, prior systematic reviews also indicate that the performance and feasibility of existing COPD case-finding tools vary across settings.27 Most current tools remain focused on binary risk identification and rely on fixed scoring rules or additional physiological measurements. With the development of artificial intelligence, the methods have been successfully used for disease diagnosis and prediction.14–18 The present study developed and validated ML models for COPD prediction in community subjects and improved the interpretability of the ML.
A meta-analysis summarized 13 domestic studies on COPD risk factors, including smoking, biomass fuel exposure, sex, age, low BMI, family history, history of respiratory diseases, and occupational exposure.28 Data show that 89.5% of residents over 40 years have at least one risk factor, which is of great significance for early recognition of COPD.8 But which indicator to use and how to combine them together to achieve better accuracy and generalizability remain to be studied. Recent studies show that 6.2–17% of the community population has chronic cough and sputum, while 1–6% has exertional dyspnea (mMRC ≥2). Most of them are potential individuals of pre-COPD or undiagnosed COPD.29,30 The emergence of acute exacerbations in high-risk or undiagnosed COPD is referred to as “acute respiratory events” with an incidence of about 3%. Individuals with this above characteristic exhibit disease burden and lung function decline similar to those with GOLD I–II stage COPD. However, it is difficult to identify “acute respiratory events” due to recall bias. Therefore, we replaced this item with “history of respiratory medication use” in last year, which would allow for inclusion of people who are misdiagnosed with chronic bronchitis, emphysema and other conditions that require regular use of respiratory medications better.31,32 It was found some inflammatory factors in blood (SNP, IL-8), and lung structure change on CT are also as significant predictors of COPD progression.33,34 Given that blood tests and high-resolution CT scans are not feasible for large-scale community case-finding, these were excluded from our models.
Based on these findings, the models initially used eighteen features with demographic data, respiratory symptoms, history of respiratory diseases/medication use, risk factors from questionnaire survey. Although numerous features improve the prediction accuracy, it may lead to over-fitting.12 So we try to reduce the features. Compared with manual feature selecting, ML has advantage at dealing with multidimensional or continuous variables, extraction of features and integrated them into the algorithm to optimize the prediction effect without subjectivity and under-fitting. The results show that ML reduced the initial eighteen variables to twelve, which were ranked by feature importance. However, the feather characteristic curve still showed that some variables had no effect on the score, which may remain multicollinearity between variables. We then used Lasso regression to further reduce the number of variables to nine, and the AUC in the validation set was not significant, when compared with before. So nine features were finally used in all of our models. It is interesting that biofuel exposure got a low weight in the selected features and was ultimately excluded from the model. This may be attributed to several reasons: (1) this study was not an epidemiological investigation, so it does not mean that biofuel exposure is not a COPD risk factor; (2) our research group has collaborated with the government on kitchen ventilation renovation projects and the promotion of clean energy in rural areas of northern Guangdong for several years, which may have significantly reduced local exposure levels. Nevertheless, there are few people using biofuels in urban so that excluding this variable has minimal impact on generalization of models.
In 2006, Douglas established an ML model containing 19 feature items, which had an AUC of 0.78 in the diagnosis of COPD in people over 40 years old, laying the foundation of predicting COPD by clinical data.13 In a retrospective cohort (2015) of 100,000 people (aged 40–80), demographic data, clinical data and medical resource usage data were used to train models (AUC of 0.75).19 Consistent with the above findings, our study also showed that five ML models effectively predict COPD (AdBoost, LR, GBC, GNB, and LightGBM; obtained AUCs above 0.8) (Table 2). It should be pointed out that the model performance is ranked based on comprehensive indicators. AUC is most commonly used in models ranking which reflect the discrimination, Ada performs best among the models with AUC of 0.86 and 0.84 in training and validating set, respectively. The model surpasses the COPD-SQ and other existing models.11 In addition, to cover more potential COPD population, the LLN standard was also used to construct the prediction model and have good performance as well.35–37
It has always been a challenge to interpret the ML model more comprehensively. Using SHAP values and plots to uncover the black box of ML, we demonstrated that the ML method could explain key features and establish a high-accuracy prediction model. First, Force plots visualized individual model prediction as a result of feature contribution, provides an intuitive way to guide clinicians’ and patients’ decision-making and improves their understanding of how the model makes a particular prediction. Second, the DCA curve was plotted for the clinical application of the Ada model. The net benefit had the maximum benefit across the reasonable threshold probabilities, which means the model is the optimal.
Given the good predictive performance of the model for binary outcomes (with COPD or not), we explored the ability of ML to predict multi-class outcomes. The results showed that the GBC model has a good ability to detect the four grade of COPD directly and to distinguish the four grade each other with an accuracy of 0.822. However, the relative low AUC of predicting GOLD 1 may be due to the fact that some mild COPD patients and non-COPD patients share similar symptoms, signs and risk factors, and 20% of GOLD-I stage patients may return to normal within 5 years,30,38 which leads to difficulty in distinguishing GOLD-I stage and non-COPD. We adjusted the model threshold appropriately to improve the predictive sensitivity for mild COPD. On the contrary, our model has a good perfomance in separating non-COPD and moderate-to-severe COPD (GOLD-II to IV) with a combined accuracy and AUC of 0.920 and 0.887. It will be very useful to reduce the underdiagnosis rate of GOLD-II and above, given the fact that previous study reported 44.0% of patients with moderate to severe airflow limitations had not been correctly diagnosed before.39 In other words, our models may have the ability to identify 83% of moderate to severe COPD patients accurately among community population. Recent studies report that FEV1 and FEV1/FVC could be predicted by demographic, lifestyle and disease history information.40–42 Our results also showed the high precision of the GBR models for predicting FEV1 %pred and FEV1/FVC. These models may guide treatment among those who could not complete or not available for lung function test.
Our models were further validated in an external cohort that included 2456 participants. Training cohort data were mainly from rural areas, aged 40–80 years; And the validation cohort was mainly from urban areas, aged 40–65 years, demonstrating good applicability of the models in different regions and demonstrating good performance in screening younger populations. We also established a web page for COPD prediction based on our finally tuned and fixed models. It can realize convenient screening in multiple scenarios such as community or medical institutions (Figure S6). https://fev1fvc-ch7jqosfvxgsv3d8paqvjl.streamlit.app/. From an implementation perspective, the proposed tool should be used for risk stratification and referral prioritization rather than as a replacement for spirometry-based diagnosis. Most final predictors can be collected through a brief standardized questionnaire, but their availability and recording quality may vary across healthcare systems. Therefore, local validation and linkage to confirmatory spirometry and guideline-based management are needed before routine implementation.
Advantage and Limitation
The results of this study were derived from a large-scale community survey and the baseline data of our prospective cohort. The ratio of COPD to non-COPD in the training dataset closely approximates that found in the real world, which enhances its practical value. To facilitate application, we included only nine clinical features, excluding more robust indicators such as CT data and blood or sputum biomarkers. To address potential instability, overfitting, underfitting, and correlated predictors associated with RFECV, we combined or filtered clinically overlapping variables and used LASSO regression as a complementary feature-selection method. The similar AUCs of the RFECV-derived 12-feature model and the final LASSO-refined 9-feature model supported the robustness and parsimony of the selected predictors. Because the predictors were collected using standardized community survey questionnaires rather than routine usual-care records, implementation in primary care would require standardized data collection. Although most final predictors can be obtained through a brief questionnaire, their availability and recording quality may vary across healthcare systems, and local validation is needed before routine use. Further exploration is needed to determine whether other indicators with higher specificity exist. The cohort is still under follow-up, and prognostic indicators for COPD have yet to be obtained. Therefore, the roles of multivariate and multi-type prediction models in evaluating the prognosis of COPD warrant further investigation.
Conclusions
Although the risk factors for COPD have changed over time, the prediction models for “active case finding” in the community have not been updated in decades. In this study, we constructed prediction models for COPD, especially severity level of COPD, and FEV1 %pred, FEV1/FVC values using standardized machine learning techniques and data from a large-scale community survey. ML is a novel and powerful technology in early identification of COPD. This tool may help prioritize high-risk individuals for confirmatory spirometry in community settings, but its effects on diagnostic yield, treatment uptake, and long-term outcomes require further prospective evaluation.
Data Sharing Statement
The datasets analysed during the current study are available from the corresponding author on reasonable request.
Ethics Approval and Consent to Participate
All procedures were in accordance with the Declaration of Helsinki and approved by the Clinical Research Ethics Committee of The First Affiliated Hospital, Guangzhou Medical University (No. 2018-53), and all participants signed written informed consent forms before enrollment.
Author Contributions
All authors made a significant contribution to the work reported, whether that is in the conception, study design, execution, acquisition of data, analysis and interpretation, or in all these areas; took part in drafting, revising or critically reviewing the article; gave final approval of the version to be published; have agreed on the journal to which the article has been submitted; and agree to be accountable for all aspects of the work.
Funding
This study was supported by the Foundation of Guangzhou National Laboratory (SRPG22-016), the Clinical and Epidemiological Research Project of State Key Laboratory of Respiratory Disease (SKLRD-L-202402), and the Major Clinical Research Project of Guangzhou Medical University’s Scientific Research Capability Improvement Plan (GMUCR2024-01012).
Disclosure
The authors report no conflicts of interest in this work.
References
1. GBD Chronic Respiratory Disease Collaborators. Prevalence and attributable health burden of chronic respiratory diseases, 1990–2017: a systematic analysis for the Global Burden of Disease Study 2017. Lancet Respir Med. 2020;8(6):585–17. doi:10.1016/S2213-2600(20)30105-3
2. Global initiative for chronic obstructive lung disease. Global strategy for the diagnosis, management, and prevention of chronic obstructive pulmonary disease (2024 REPORT). Available from: https://goldcopd.org/2024-gold-reports/.
3. Chronic Obstructive Pulmonary Disease Group of Chinese Thoracic Society; Chronic Obstructive Pulmonary Disease Committee of Chinese Association of Chest Physician. [Guidelines for the diagnosis and management of chronic obstructive pulmonary disease (revised version 2021)]. Zhonghua Jie He He Hu Xi Za Zhi. 2021;44(3):170–205. Chinese. doi:10.3760/cma.j.cn112147-20210109-00031
4. Lamprecht B, Soriano JB, Studnicka M, et al. Determinants of underdiagnosis of COPD in national and international surveys. Chest. 2015;148(4):971–985. doi:10.1378/chest.14-2535
5. Miravitlles M, Soriano JB, García-Río F, et al. Prevalence of COPD in Spain: impact of undiagnosed COPD on quality of life and daily life activities. Thorax. 2009;64(10):863–868. doi:10.1136/thx.2009.115725
6. Martinez CH, Mannino DM, Jaimes FA, et al. Undiagnosed obstructive lung disease in the United States. Associated factors and long-term mortality. Ann Am Thorac Soc. 2015;12(12):1788–1795. doi:10.1513/AnnalsATS.201506-388OC
7. Nishimura M, Makita H, Nagai K, et al. Annual change in pulmonary function and clinical phenotype in chronic obstructive pulmonary disease. Am J Respir Crit Care Med. 2012;185(1):44–52. doi:10.1164/rccm.201106-0992OC
8. Martinez FJ, Raczek AE, Seifer FD, et al. Development and initial validation of a self-scored COPD Population Screener Questionnaire (COPD-PS). COPD. 2008;5(2):85–95. doi:10.1080/15412550801940721
9. Enright P, Quanjer P. Spirometry for COPD is both underutilized and overutilized. Chest. 2007;132(2):368–370. doi:10.1378/chest.07-0994
10. Duvall K, Frank GW. Identifying chronic obstructive pulmonary disease in primary care of urban underserved patients: tools, applications, and challenges. J Natl Med Assoc. 2010;102(7):570–578. doi:10.1016/s0027-9684(15)30623-4
11. Zhou YM, Chen SY, Tian J, et al. Development and validation of a chronic obstructive pulmonary disease screening questionnaire in China. Int J Tuberc Lung Dis. 2013;17(12):1645–1651. doi:10.5588/ijtld.12.0995
12. Gonem S, Janssens W, Das N, Topalovic M. Applications of artificial intelligence and machine learning in respiratory medicine. Thorax. 2020;75(8):695–701. doi:10.1136/thoraxjnl-2020-214556
13. Mapel DW, Frost FJ, Hurley JS, et al. An algorithm for the identification of undiagnosed COPD cases using administrative claims data. J Manag Care Pharm. 2006;12(6):457–465.
14. Deo RC. Machine Learning in Medicine. Circulation. 2015;132(20):1920–1930. doi:10.1161/CIRCULATIONAHA.115.001593
15. Hamet P, Tremblay J. Artificial intelligence in medicine. Metabolism. 2017;69S:S36–S40. doi:10.1016/j.metabol.2017.01.011
16. Choi H, Jin KH; Alzheimer’s Disease Neuroimaging Initiative. Predicting cognitive decline with deep learning of brain metabolism and amyloid imaging. Behav Brain Res. 2018;344:103–109. doi:10.1016/j.bbr.2018.02.017
17. Liang W, Yao J, Chen A, et al. Early triage of critically ill COVID-19 patients using deep learning. Nat Commun. 2020;11(1):3543. doi:10.1038/s41467-020-17280-8
18. Zein JG, Wu CP, Attaway AH, Zhang P, Nazha A. Novel machine learning can predict acute asthma exacerbation. Chest. 2021;159(5):1747–1757. doi:10.1016/j.chest.2020.12.051
19. Moretz C, Zhou Y, Dhamane AD, et al. Development and validation of a predictive model to identify individuals likely to have undiagnosed chronic obstructive pulmonary disease using an administrative claims database. J Manag Care Spec Pharm. 2015;21(12):1149–1159. doi:10.18553/jmcp.2015.21.12.1149
20. Ma X, Wu Y, Zhang L, et al. Comparison and development of machine learning tools for the prediction of chronic obstructive pulmonary disease in the Chinese population. J Transl Med. 2020;18(1):146. doi:10.1186/s12967-020-02312-0
21. Castaldi PJ, Boueiz A, Yun J, et al. Machine learning characterization of COPD subtypes: insights from the COPDGene Study. Chest. 2020;157(5):1147–1157. doi:10.1016/j.chest.2019.11.039
22. Lin X, Lei Y, Chen J, Xing Z, Yang T, Wang Q. A case-finding clinical decision support system to identify subjects with chronic obstructive pulmonary disease based on public health data. Tsinghua Sci Technol. 2023;28(3):525–540. doi:10.26599/TST.2022.9010010
23. Stocks J, Sonnappa S. Early life influences on the development of chronic obstructive pulmonary disease. Ther Adv Respir Dis. 2013;7(3):161–173. doi:10.1177/1753465813479428
24. Zhou Y, Wu F, Shi Z, et al. Effect of high-dose N-acetylcysteine on exacerbations and lung function in patients with mild-to-moderate COPD: a double-blind, parallel group, multicentre randomised clinical trial. Nat Commun. 2024;15(1):8468. doi:10.1038/s41467-024-51079-1
25. Jordan RE, Adab P, Sitch A, et al. Targeted case finding for chronic obstructive pulmonary disease versus routine practice in primary care (TargetCOPD): a cluster-randomised controlled trial. Lancet Respir Med. 2016;4(9):720–730. doi:10.1016/S2213-2600(16)30149-7
26. Pan Z, Dickens AP, Chi C, et al. Accuracy and cost-effectiveness of different screening strategies for identifying undiagnosed COPD among primary care patients in China: a cross-sectional screening test accuracy study. BMJ Open. 2021;11(9):e051811. doi:10.1136/bmjopen-2021-051811
27. Schnieders E, Ünal E, Winkler V, et al. Performance of alternative COPD case-finding tools: a systematic review and meta-analysis. Eur Respir Rev. 2021;30(160):200350. doi:10.1183/16000617.0350-2020
28. Soriano JB, Zielinski J, Price D. Screening for and early detection of chronic obstructive pulmonary disease. Lancet. 2009;374(9691):721–732. doi:10.1016/S0140-6736(09)61290-3
29. Zhu B, Wang Y, Ming J, Chen W, Zhang L. Disease burden of COPD in China: a systematic review. Int J Chron Obstruct Pulmon Dis. 2018;13:1353–1364. doi:10.2147/COPD.S161555
30. Yin P, Zhang M, Li Y, Jiang Y, Zhao W. Prevalence of COPD and its association with socioeconomic status in China: findings from China Chronic Disease Risk Factor Surveillance 2007. BMC Public Health. 2011;11:586. doi:10.1186/1471-2458-11-586
31. Çolak Y, Nordestgaard BG, Vestbo J, Lange P, Afzal S. Prognostic significance of chronic respiratory symptoms in individuals with normal spirometry. Eur Respir J. 2019;54(3):1900734. doi:10.1183/13993003.00734-2019
32. Çolak Y, Afzal S, Nordestgaard BG, Vestbo J, Lange P. Prevalence, characteristics, and prognosis of early chronic obstructive pulmonary disease. The Copenhagen General Population Study. Am J Respir Crit Care Med. 2020;201(6):671–680. doi:10.1164/rccm.201908-1644OC
33. Tan WC, Bourbeau J, Hernandez P, et al. Exacerbation-like respiratory symptoms in individuals without chronic obstructive pulmonary disease: results from a population-based study. Thorax. 2014;69(8):709–717. doi:10.1136/thoraxjnl-2013-205048
34. Woodruff PG, Barr RG, Bleecker E, et al. Clinical significance of symptoms in smokers with preserved pulmonary function. N Engl J Med. 2016;374(19):1811–1821. doi:10.1056/NEJMoa1505971
35. Stockley RA, Halpin DMG, Celli BR, Singh D. Chronic obstructive pulmonary disease biomarkers and their interpretation. Am J Respir Crit Care Med. 2019;199(10):1195–1204. doi:10.1164/rccm.201810-1860SO
36. Tang LYW, Coxson HO, Lam S, Leipsic J, Tam RC, Sin DD. Towards large-scale case-finding: training and validation of residual networks for detection of chronic obstructive pulmonary disease using low-dose CT. Lancet Digit Health. 2020;2(5):e259–e267. doi:10.1016/S2589-7500(20)30064-9
37. Liu S, Zhou Y, Liu S, et al. Clinical impact of the lower limit of normal of FEV1/FVC on detecting chronic obstructive pulmonary disease: a follow-up study based on cross-sectional data. Respir Med. 2018;139:27–33. doi:10.1016/j.rmed.2018.04.011
38. Martinez FJ, Han MK, Allinson JP, et al. At the root: defining and halting progression of early chronic obstructive pulmonary disease. Am J Respir Crit Care Med. 2018;197(12):1540–1551. doi:10.1164/rccm.201710-2028PP
39. Calverley PMA, Mueller A, Fowler A, Metzdorf N, Wise RA. The effect of defining chronic obstructive pulmonary disease by the lower limit of normal of FEV1/FVC ratio in tiotropium safety and performance in respimat participants. Ann Am Thorac Soc. 2018;15(2):200–208. doi:10.1513/AnnalsATS.201703-194OC
40. Wan ES, Fortis S, Regan EA, et al. Longitudinal phenotypes and mortality in preserved ratio impaired spirometry in the COPDGene Study. Am J Respir Crit Care Med. 2018;198(11):1397–1405. doi:10.1164/rccm.201804-0663OC
41. Tinkelman DG, Price D, Nordyke RJ, Halbert RJ. COPD screening efforts in primary care: what is the yield? Prim Care Respir J. 2007;16(1):41–48. doi:10.3132/pcrj.2007.00009
42. Lee SC, An C, Yoo J, Park S, Shin D, Han CH. Development and validation of a nomogram to predict pulmonary function and the presence of chronic obstructive pulmonary disease in a Korean population. BMC Pulm Med. 2021;21(1):32. doi:10.1186/s12890-021-01391-z
 © 2026 The Author(s). This work is published and licensed by Dove Medical Press Limited. The
full terms of this license are available at https://www.dovepress.com/terms
and incorporate the Creative Commons Attribution
- Non Commercial (unported, 4.0) License.
By accessing the work you hereby accept the Terms. Non-commercial uses of the work are permitted
without any further permission from Dove Medical Press Limited, provided the work is properly
attributed. For permission for commercial use of this work, please see paragraphs 4.2 and 5 of our Terms.
© 2026 The Author(s). This work is published and licensed by Dove Medical Press Limited. The
full terms of this license are available at https://www.dovepress.com/terms
and incorporate the Creative Commons Attribution
- Non Commercial (unported, 4.0) License.
By accessing the work you hereby accept the Terms. Non-commercial uses of the work are permitted
without any further permission from Dove Medical Press Limited, provided the work is properly
attributed. For permission for commercial use of this work, please see paragraphs 4.2 and 5 of our Terms.
Recommended articles
Using Machine Learning to Predict Likelihood and Cause of Readmission After Hospitalization for Chronic Obstructive Pulmonary Disease Exacerbation
Bonomo M, Hermsen MG, Kaskovich S, Hemmrich MJ, Rojas JC, Carey KA, Venable LR, Churpek MM, Press VG
International Journal of Chronic Obstructive Pulmonary Disease 2022, 17:2701-2709
Published Date: 20 October 2022
A Macrophage-Related Gene Signature for Identifying COPD Based on Bioinformatics and ex vivo Experiments
Zhang Z, Yu H, Wang Q, Ding Y, Wang Z, Zhao S, Bian T
Journal of Inflammation Research 2023, 16:5647-5665
Published Date: 29 November 2023
Machine Learning-Based Mortality Risk Prediction Model in Patients with Sepsis
Zhang Y, Li C, Ji Y, Wei B, Guo S, Mei X, Wang J
Journal of Inflammation Research 2025, 18:6427-6437
Published Date: 19 May 2025
A Multi-Algorithm Machine Learning Model for Predicting the Risk of Preterm Birth in Patients with Early-Onset Preeclampsia
Xu Y, Zu Y, Zhang Y, Liang Z, Xu X, Yan J
International Journal of General Medicine 2025, 18:4195-4207
Published Date: 4 August 2025
Development and Interpretable Machine Learning-Based Prediction of Cardiovascular Disease Risk in Chinese COPD Patients: An Analysis of the CHARLS Database
Yuan Y, Zhu J, Zhao X, Huang Q, Li J, Wang Y, Liu W, Chen M, Li D, Wu B, Li W, Wu D
International Journal of Chronic Obstructive Pulmonary Disease 2026, 21:590631
Published Date: 25 May 2026