Back to Journals » Journal of Inflammation Research » Volume 16
A Macrophage-Related Gene Signature for Identifying COPD Based on Bioinformatics and ex vivo Experiments
Authors Zhang Z ![]() , Yu H, Wang Q, Ding Y, Wang Z, Zhao S
, Yu H, Wang Q, Ding Y, Wang Z, Zhao S ![]() , Bian T
, Bian T
Received 27 September 2023
Accepted for publication 21 November 2023
Published 29 November 2023 Volume 2023:16 Pages 5647—5665
DOI https://doi.org/10.2147/JIR.S438308
Checked for plagiarism Yes
Review by Single anonymous peer review
Peer reviewer comments 3
Editor who approved publication: Dr Tara Strutt
Zheming Zhang,1,2,* Haoda Yu,1,2,* Qi Wang,3 Yu Ding,1,2 Ziteng Wang,1,2 Songyun Zhao,1 Tao Bian1,2
1Wuxi Medical Center of Nanjing Medical University, Wuxi, People’s Republic of China; 2Department of Respiratory Medicine, Wuxi People’s Hospital, Nanjing Medical University, Wuxi, People’s Republic of China; 3Department of Gastroenterology, Affiliated Hospital of Jiangsu University, Zhenjiang, People’s Republic of China
*These authors contributed equally to this work
Correspondence: Tao Bian; Songyun Zhao, Email [email protected]; [email protected]
Background: This study aims to investigate the association between immune cells and the development of COPD, while providing a new method for the diagnosis of COPD according to the changes in immune microenvironment.
Methods: In this study, the “CIBERSORT” algorithm was used to estimate the tissue infiltration of 22 types of immune cells in GSE20257 and GSE10006. The “limma” package was used for differentially expressed analysis. The key modules associated with vital immune cells were identified using WGCNA. GO and KEGG enrichment analysis revealed the biological functions of the candidate genes. Ultimately, a novel diagnostic prediction model was constructed via machine learning methods and multivariate logistic regression analysis based on GSE20257. Furthermore, we examined the stability of the model on one internal test set (GSE10006), three external test sets (GSE8545, GSE57148 and GSE76925), one single-cell transcriptome dataset (GSE167295), macrophages (THP-M cells) and lung tissue from COPD patients.
Results: M0 macrophages (AUC > 0.7 in GSE20257 and GSE10006) were considered as the most important immune cells through exploring the immune microenvironment landscapes in COPD patients and healthy controls. The differentially expressed genes from GSE20257 and GSE10006 were divided into six and five modules via WGCNA, respectively. The green module in GSE20257 (cor = 0.41, P < 0.001) and the brown module in GSE10006 (cor = 0.67, P < 0.001) were highly correlated with M0 macrophages and were selected as key modules. Forty-one intersected genes obtained from two modules were primarily involved in regulation of cytokine production, regulation of innate immune response, specific granule, phagosome, lysosome, ferroptosis, and other biological processes. On the basis of the candidate genetic markers further characterized via the “Boruta” and “LASSO” algorithm for COPD, a diagnostic model comprising CLEC5A, FTL and SLC2A3 was constructed, which could accurately distinguish COPD patients from healthy controls in multiple datasets. GSE20257 as the training set has an AUC of 0.916. The AUCs of the internal test set and three external test sets were 0.873, 0.932, 0.675 and 0.688, respectively. Single-cell sequencing analysis suggested that CLEC5A, FTL and SLC2A3 were expressed in macrophages from COPD patients. The expressions of CLEC5A, FTL and SLC2A3 were up-regulated in THP-M cells and lung tissue from COPD patients.
Conclusion: According to the variations of immune microenvironment in COPD patients, we constructed and validated a novel macrophage M0-associated diagnostic model with satisfactory predictive value. CLEC5A, FTL and SLC2A3 are expected to be promising targets of immunotherapy in COPD.
Keywords: COPD, CLEC5A, FTL, SLC2A3, immune infiltration, WGCNA, machine learning, multivariate logistic regression
Introduction
Chronic obstructive pulmonary disease (COPD) is a respiratory disease characterized by progressive airflow limitation and chronic inflammation of the airway and lung parenchyma. It is the result of interactions between innate genetic factors, such as α1-antitrypsin deficiency, and acquired environmental factors, such as smoking.1–4 Whether in developed or developing countries, the high incidence, disability and mortality of COPD have brought heavy economic burden to patients and society.5,6 Diagnosis and timely treatment have critical clinical significance for slowing down the decline of pulmonary function and improving the long-term prognosis of patients.7 Nevertheless, relying solely on pulmonary function monitoring and imaging examination cannot fully identify the specific initial stage of COPD at present.8–10 Undoubtedly, the accurate clinical diagnosis of COPD has yet to be resolved which is the utmost important.
In recent years, increasing studies have proved the essential role of immune cell infiltration in the occurrence and development of various diseases.11,12 In the scope of COPD, Yang et al found that monocytes and M0 macrophages were up-regulated and CD8 T cells, activated NK cells, M2 macrophages, resting dendritic cells and resting mast cells were down-regulated in COPD lung tissues, while these differentially infiltrated immune cells were significantly associated with ferroptosis-related genes.13 Remarkably, even immune cells, such as monocytes, that have never been directly exposed to external stimuli, such as cigarette smoke or biomass smoke, have been observed to manifest defects in their function and regulation.14,15 The expressions of SLC27A3 and STAU1 which were identified as the diagnostic markers of COPD by Zhang et al were enhanced in COPD models, accompanied by the activation of immune infiltration.16 However, although many biomarkers have been developed to identify COPD, a novel diagnostic model that focused on the immune microenvironment associated with COPD has not been constructed. With the development of technology, the fusion of bioinformatics analysis and machine learning (ML) has been applied to identify the diagnostic or prognostic genes related to COPD.16–18 For example, Dhong et al identified TRPC6 as a diagnostic biomarker of Particulate matter- (PM-) induced COPD using machine learning models,19 but such studies still lacked validation of sufficient external datasets or relevant experiments to ensure stability.
In our investigation, two COPD microarray datasets were first extracted from NCBI Gene Expression Omnibus (GEO) database. Secondly, vital immune cells that were differentially infiltrated in COPD and healthy samples were identified and quantified by the cell-type identification by estimating relative subsets of RNA transcripts (“CIBERSORT”) algorithm, and a weighted gene co-expression network analysis (WGCNA) was used to screen out the key modules associated with these cells. Based on the candidate genes acquired from the intersection of key modules, we constructed a novel diagnostic prediction model using ML approaches and multivariate logistic regression analysis. Finally, we validated the diagnostic performance of our model on one internal test set, three external test sets, one single-cell transcriptome dataset, cigarette smoke extract- (CSE-) induced COPD models in vitro and lung tissue from COPD patients. This study aims to provide a new method for the diagnosis of COPD according to the changes in immune microenvironment, which is different from lung function and imaging examination.
Materials and Methods
Raw Data Acquisition
Datasets for three COPD airway tissues (GSE20257,20 GSE1000621 and GSE8545)22, two COPD lung tissues (GSE5714823–25 and GSE76925)26,27 were downloaded from GEO (https://www.ncbi.nlm.nih.gov/geo/). All datasets above are gene expression arrays and were generated using the GPL570 (HG-U133_Plus_2) Affymetrix Human Genome U133 Plus 2.0 Array. GSE20257, GSE10006, GSE8545 contains 53 healthy and 23 COPD samples, 22 healthy and 27 COPD samples, 18 healthy and 18 COPD samples, respectively. GSE20257 was used as the training set for airway tissue, while GSE10006 and GSE8545 were used as the validation set for airway tissue. GSE57148 and GSE76925 were used to model the effect of external validation of lung tissue. All GEO raw datasets were pre-processed by “affy” in R, including background calibration, normalization and log2 transformation.28 When multiple probes corresponded to a common gene, the average value was taken as its expression value.
Quantification of Immune Cells
The “CIBERSORT” inverse convolution algorithm (http://cibersort.stanford.edu/) was used to quantify 22 immune cells.29,30 The “CIBERSORT” algorithm combined vector regression and LM22 gene set to estimate cell type proportions, incorporating samples with p < 0.05 into this work. We compared the proportion of immune cells between COPD and healthy samples. Immune cells with differential distribution and high predictive abilities were identified by the area under the curve (AUC) calculated via the “pROC” software package.31
Differentially Expressed Analysis
The “limma” package was applied to the GEO cohorts to screen for differentially expressed genes (DEGs). P-value < 0.05 and |log2FC| > 0.5 was set as the cut-off point.32,33
Weighted Correlation Network Analysis
Weighted correlation network analysis (WGCNA) is a systems biology method for identifying gene relationship patterns across samples.34 We chose the optimal soft threshold power β through the function “pickSoftThreshold”, where scale-free topological fitting index R2 = 0.9. aij = |Sij|β (aij: adjacency matrix between gene i and gene j; Sij: similarity matrix, which is obtained by Pearson correlation of all gene pairs) was used to calculate the matrix composed of weighted correlation values between genes and genes, ie, the adjacency matrix. Next up, the adjacency matrix was transformed into the topological overlap measure (TOM) matrix to reflect the similarity of co-expressed genes. We obtained the highly similar co-expressed genes and merged them into modules via the “dynamic tree cutting” algorithm and the “merged dynamic” algorithm. The fractions of vital immune infiltrating cells in COPD patients were used as sample traits. We identified the key modules according to a high correlation between these co-expression gene modules and sample traits. Additionally, the genes in the important modules were the key genes, and the intersected key genes between GSE20257 and GSE10006 were included as candidate genes in our work.
Functional Enrichment Analysis
Functional enrichment analysis, including Gene Ontology (GO) and Kyoto Encyclopedia of Genes and Genomes (KEGG) analysis, was performed by the R software packages “clusterProfiler”, “circlize”, etc.35,36 The screening criteria for significance terms was P-value <0.05 after adjustment.
Construction of Protein–Protein Interaction (PPI) Network
We constructed the PPI network via STRING database (https://string-db.org/), and then the hub genes in the network were processed and visualized in “Cytoscape” software (version 3.9.1).37
Construction and Validation of a Diagnostic Model
In GSE20257, the Boruta algorithm with 500 maxRuns was used to further screen for significant genes among the 41 candidate genes using the “Boruta” package. The genes were classified into three categories, including confirmed, tentative and rejected. Meanwhile, we put the 41 candidate genes into the least absolute shrinkage and selection operator (LASSO).38 LASSO, a dimension reduction approach, shows superiority in evaluating high-dimensional data in comparison to regression analysis. LASSO analysis was implemented with a turning/penalty parameter utilizing a 10-fold cross-verification via glmnet package. The minimum lambda value was obtained by 10 times cross-validation. Nine genes identified as significant by Boruta as well as having non-zero regression coefficients were used for stepwise multivariate logistic regression analysis.39 We constructed a score based on the 3 genes with P < 0.05 in the stepwise multivariate logistic regression. Score = Constant + Gene1 × Coef1 + Gene2 × Coef2 + Gene3 × Coef3 + - - - + Genen × Coefn (Constant, constant; Gene, gene expression; Coef, regression coefficient). The airway sequencing datasets GSE10006 and GSE8545 were used to verify the stability of this signature.
Processing of Single Cell Sequencing Data
We downloaded 10×scRNA-seq data containing three samples with COPD lung tissue from GSE167295.40 Cells with fewer than 200 or more than 10,000 genes, fewer than 1000 molecules, and more than 20% mitochondrial and ribosomal genes were removed to retain high-quality cellular data. The remaining genes were expressed in at least three single cells. Above all, we used the “harmony” R package to remove batch effect between different samples41 and the “Seurat” R package to normalize the RNA-seq data via the function “NormalizeData”. After that, the standardized scRNA-seq data were transformed into Seurat objects and the top 2000 highly variable genes were identified using the function “FindVariableFeatures”. We applied the function “RunPCA” of the “Seurat” R package to perform principal component analysis (PCA) of the top 2000 genes based on dimensionality reduction of the RNA-Seq data. In the end, we employed “JackStraw” analysis to identify significant PCs and selected the top 15 PCs with the smallest p-value based on the proportion of variance for cell clustering analysis. The consolidated data were clustered using the functions “FindNeighbors” and “FindClusters”, and cell subsets were displayed via UAMP plot. The “SingleR” R package was used to annotate various cell subsets.42
Cell Culture and Treatment
HBE cells, an SV40-transformed, normal HBE cell line, were obtained from Chi Scientific (Jiangsu, China). THP-1 cells were purchased from the National Collection of Authenticated Cell Cultures. THP-1 cells were treated with 10 µM PMA for 48 h to form THP-1 macrophages (THP-M cells), and THP-M cells were seeded in a six-well plate at a density of 1×10⁶ cells per well. HBE cells were treated with 5% CSE for 24 h before they were cocultured with THP-M cells on 24 mm diameter inserts with 0.4 μm pores (#3412, Corning, USA).43
Preparation of CSE
CSE was prepared as previously reported with some modifications.43 Briefly, the smoke of a Da Qian Men (10 mg tar and 0.8 mg nicotine/cigarette, Shanghai, China) was bubbled through 10 mL of serum-free DMEM. The resulting suspension was adjusted to pH 7.4 and then filtered through a 0.22 μm pore filter (Merck Millipore, USA) to remove bacteria and large particles. The CSE was standardized by measuring the absorbance at 320 nm and defined as 100% CSE. The CSE was diluted to the desired concentration with medium and used in experiments within 30 min.
Determination of Cell Viability
Cell viability was assessed according to the instructions for Cell Counting Kit-8 kits (Beyotime, China). In short, 5000 cells per well were seeded in 96-well plates. 0, 2, 5, 10% CSE were added, and the preparations were incubated at 37°C and 5% CO2 for 0, 6, 12, 24, 48, 72 h. CCK-8 solution (10 μL) was added to each well, and, after incubation for 2 h, the absorbance was measured at 450 nm. For following experiments, we exposed HBE cells to 5% CSE for 24 h based on the outcome (Supplementary Figure 1).
RNA Extraction and Real-Time PCR
Total RNA was isolated by use of RNAiso Plus (9108/9109, Takara, Japan). Total RNA (1 μg) was transcribed into cDNA by use of PrimeScriptTM RT reagent kit with gDNA eraser (RR047A, Takara, Japan). The RT-PCR assay was performed with TB Green™ Premix Ex Taq™ II (RR820A, Takara, Japan) and ABI 9600 real-time PCR detection system (Applied Biosystems). GAPDH served as internal control for mRNA. Fold changes in expression of each gene were calculated by a comparative threshold cycle (Ct) method using the formula 2-ΔΔCT. The primer sequences are as follows (Table 1).
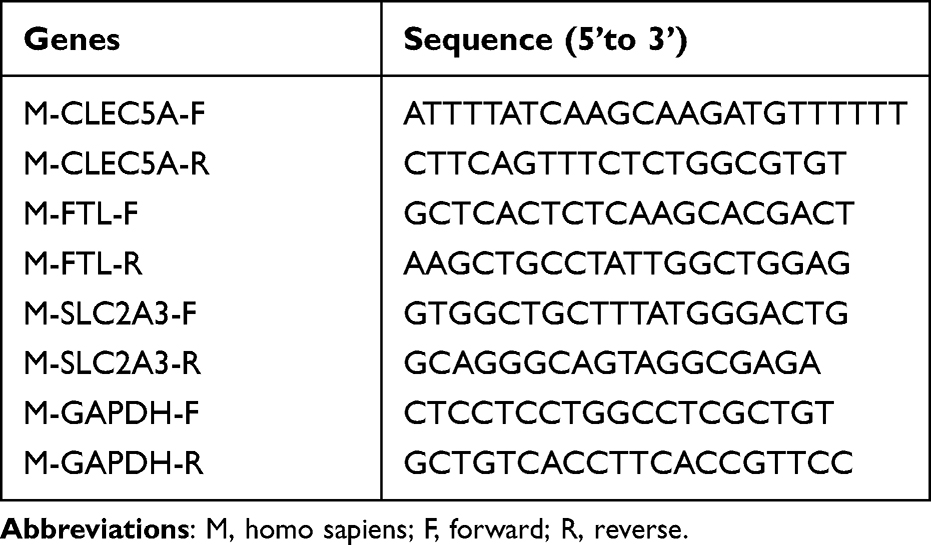 |
Table 1 Primer Sequences Used |
Western Blot Assay
Total lysates were prepared according to the manufacturer’s recommendations (Beyotime Institute of Biotechnology, Shanghai, China). Protein concentrations were measured with the BCA protein assay (Beyotime Institute of Biotechnology, Shanghai, China). Equal amounts (20 μg) of protein were separated by 10% sodium dodecyl sulphate–polyacrylamide gel electrophoresis and were transferred to polyvinylidene fluoride (PVDF) membranes (Millipore, Billerica, MA). Membranes were incubated overnight at 4°C with mouse anti-GAPDH antibody (ab8245, Abcam), goat anti-CLEC5A antibody (AF2384, R&D systems), rabbit anti-FTL antibody (10,727-1-AP, Proteintech) and rabbit anti-SLC2A3 antibody (ab41525, Abcam). After several washing steps, the membrane was incubated with secondary horseradish peroxidase (HRP)-conjugated antibody at room temperature for one hour. Detection was performed with the Immobilon ECL system (Millipore, S.p.A., Italy). The densitometric analyses of the bands were performed with ImageJ software.
Immunohistochemical Staining
The lung tissues were fixed with paraformaldehyde, then were embedded in paraffin and sectioned into sections. The lung sections were deparaffinized and rinsed at room temperature. The primary antibody used was the same as in Western Blot. After incubated with the appropriate HRP-conjugated secondary antibodies, the samples were incubated with a 3.39-diaminobenzidine-4HCl (DAB; Sigma, Missouri, USA)-H2O2 solution to visualize immunolabeling. The lung sections were mounted with a coverslip and observed under a microscope.
Statistical Analysis
All statistical analyses were performed in R (version 4.2.1). The predictive power of immune cells and the efficacy of the diagnostic model were assessed using receiver operating characteristic (ROC) curves. The Wilcoxon analysis is used to analyze the differences between the two groups, including the comparison of 22 immune cells and candidate signatures between COPD patients and healthy controls. Statistical significance was identified based on P < 0.05.
Results
Identification of Important Immune Cells in COPD
In order to explore immune microenvironment landscapes in healthy controls and COPD patients, we used the “CIBERSORT” algorithm to quantify the relative proportion of infiltrating immune cells in GSE20257 and GSE10006 (Figure 1A and B). The correlation between immune cells may provide clues to better understand the composition of the immune microenvironment in COPD (Supplementary Figure 2A, B). In GSE20257, the fraction of resting dendritic cells and M0 macrophages were significantly higher in the COPD patients than those in healthy controls, but lower proportion of M2 macrophages was found in COPD patients (Figure 1C, P < 0.05). In GSE10006, we found the healthy controls had a higher immune infiltrating level of plasma cells, follicular helper T cells, and gamma delta T cells compared to those in COPD patients, while lower proportions of M0 macrophages and resting dendritic cells were found in healthy controls (Figure 1D, P < 0.05). Obviously, the expression of M0 macrophages and resting dendritic cells was consistent throughout the two cohorts. In addition, receiver operating characteristic (ROC) curve showed that M0 macrophages had high predictive accuracy in GSE20257 (Figure 2A, AUC > 0.7). In GSE10006, plasma cells, follicular helper T cells, M0 macrophages, and resting dendritic cells all had good predictive values (Figure 2B, AUC > 0.7). However, as shown in Figure 1, M0 macrophages accounted for a significantly larger proportion of infiltrating immune cells than dendritic cells, follicular helper T cells, etc. Therefore, M0 macrophages were considered to be the most important immune cells of COPD in this work.
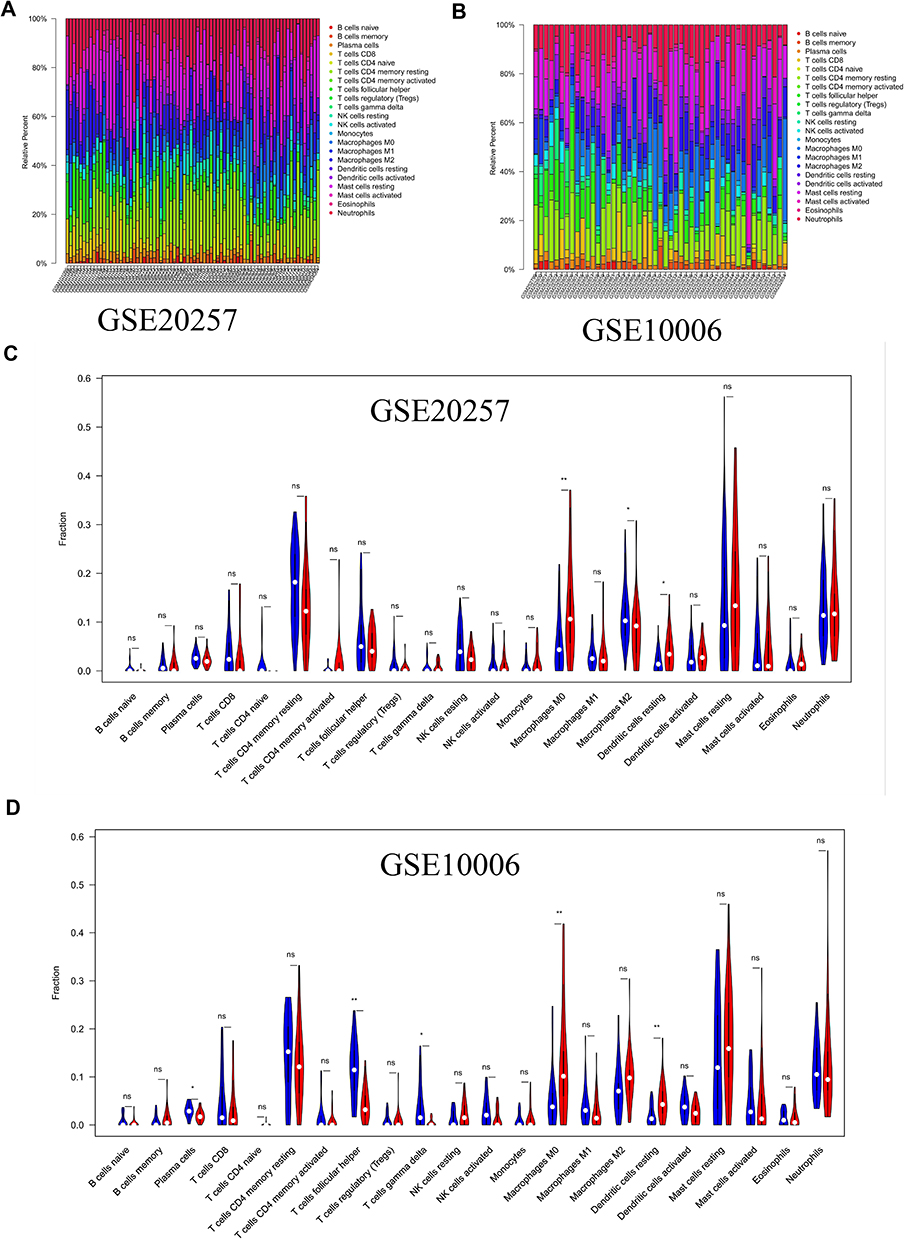 |
Figure 1 Immune microenvironment of airway tissues in healthy controls and COPD patients. (A) Relative proportions of infiltrating immune cells in GSE20257. (B) Relative proportions of infiltrating immune cells in GSE10006. (C) Differences of immune cells composition between healthy controls and COPD patients in GSE20257. (D) Differences of immune cells composition between healthy controls and COPD patients in GSE10006. Blue represents healthy controls; red represents COPD patients. ns, no significance; *P < 0.05, **P < 0.01. |
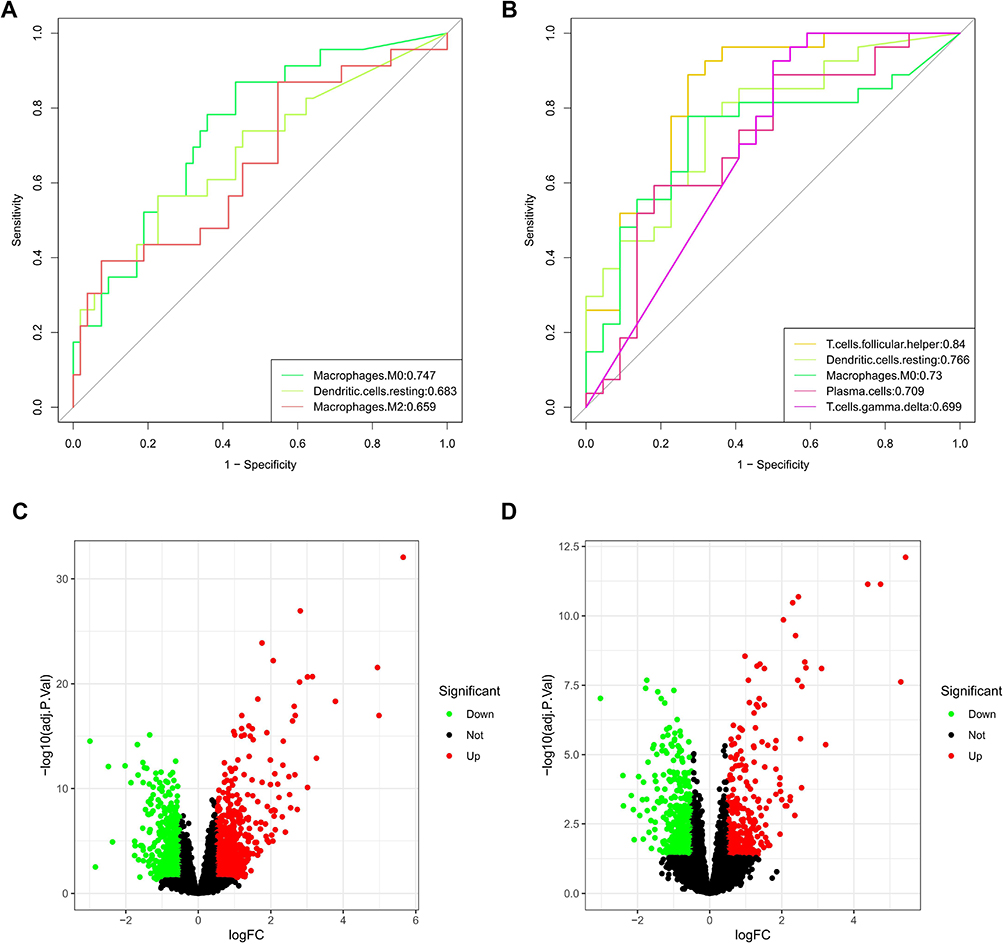 |
Figure 2 Identification of key immune cells and DEGs. (A) AUCs of three differentially distributed immune cells in GSE20257. (B) AUCs of five differentially distributed immune cells in GSE10006. (C) Volcano plot of DEGs in GSE20257. (D) Volcano plot of DEGs in GSE10006. |
Determination of Key Modules Associated with Important Immune Cells
The R package “limma” was utilized to analyze differential expression genes in the metadata cohorts (GSE20257 and GSE10006). As shown in Figure 2C, 773 up-regulated and 726 down-regulated DEGs were identified in GSE20257. In GSE10006, 348 up-regulated genes and 449 down-regulated genes were visualized by volcano plot (Figure 2D). Next, we took advantage of the above DEGs to determine the key modules associated with important immune cells in two data sets, respectively. When the soft threshold power β was 8, scale-free topology fitting index R2 reached 0.9 in GSE20257, then we acquired 6 modules using the “merged dynamic” algorithm (Figure 3A and C). We found that the green module had a good correlation with M0 macrophages (Figure 3E, cor = 0.41, P < 0.001). Similarly, in GSE10006, we chose β = 7 as the optimal β and acquired 5 modules (Figure 3B and D). The brown module was highly correlated with M0 macrophages among the modules (Figure 3F, cor = 0.67, P < 0.001). Hence, the green module in GSE20257 and the brown module in GSE10006 were chosen as key macrophage M0-related modules.
 |
Figure 3 Determination of key modules associated with important immune cells. (A) Scale Independence and average connectivity in GSE20257. (B) Scale Independence and average connectivity in GSE10006. (C) Cluster dendrogram in GSE20257. (D) Cluster dendrogram in GSE10006. (E) Heatmap of correlation between modules and important immune cells in GSE20257. (F) Heatmap of correlation between modules and important immune cells in GSE10006. |
Enrichment Analysis of Key Genes and Construction of PPI Network
We took the intersection of the genes between the above two modules and ultimately obtained 41 candidate genes (Figure 4A). The results of GO enrichment analysis, consist of 240 biological processes (BPs), 9 cellular components (CCs) and 14 molecular functions (MFs), indicated that these candidate genes were mainly involved in immune-related activities, including regulation of cytokine production, regulation of immune effector process, regulation of innate immune response, specific granule, secretory granule membrane and immune receptor activity (Figure 4B, Supplementary Table 1). The KEGG enrichment analysis exhibited that these genes mostly participated in phagosome, lysosome, neutrophil extracellular trap formation, B cell receptor signaling pathway, necroptosis and even ferroptosis (Supplementary Figure 3A, Supplementary Table 2). Finally, we explored the interactive relationship among the proteins encoded by candidate genes in STRING database, and the hub genes in the network were screened and visualized using “Cytoscape” software. The results existed 29 nodes and 134 edges in total (Supplementary Figure 3B, Supplementary Table 3).
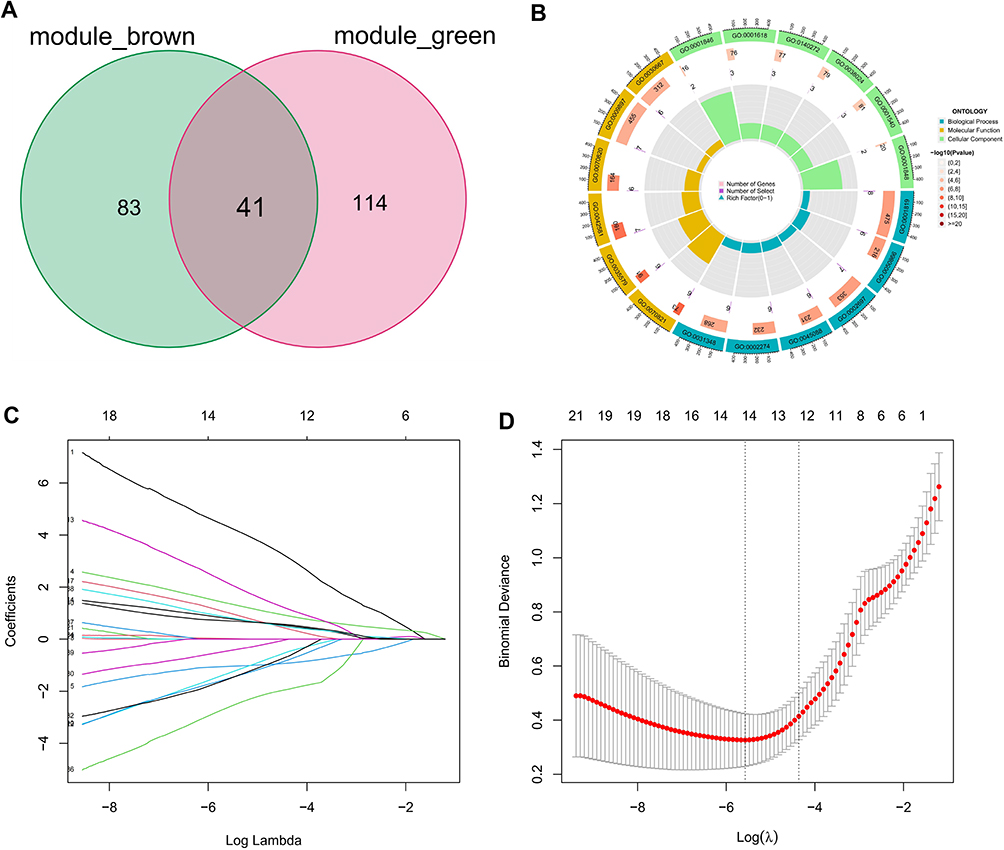 |
Figure 4 LASSO regression analysis for selection of trait genes. (A) 41 candidate genes were acquired via Venn diagram. (B) Donut plot of GO enrichment analyses. (C) Ten cross-validations of adjusted parameter selection in the LASSO model. Each curve corresponds to one gene. (D) LASSO coefficient analysis. Vertical dashed lines are plotted at the best penalty parameter. |
Construction and Validation of a Macrophage M0-Related Diagnostic Model
Firstly, 41 candidate genes were downscaled by the “Boruta” algorithm to classify them into two categories, including 15 confirmed genes and 26 rejected genes (Table 2). Next, to obtain higher accuracy, the 41 candidate genes were selected after ten cross-validations by the “LASSO” algorithm with an optimal penalty parameter of 0.0038. We selected the minimum criteria for building the LASSO classifier and identified 14 feature genes (Figure 4C and D, Table 2). Two machine learning yielded 9 genes that were used in our next step of stepwise multivariate logistic regression analysis (Table 2). Finally, based on the results of the stepwise multivariate logistic regression analysis, the P-values of three genes were less than 0.05, and we constructed a new model based on the expression values of these three genes and the coefficients of the stepwise multivariate logistic regression analysis. Score = −43.5741 + CLEC5A * 1.5158 + FTL * 4.7296 - SLC2A3 * 1.4324.
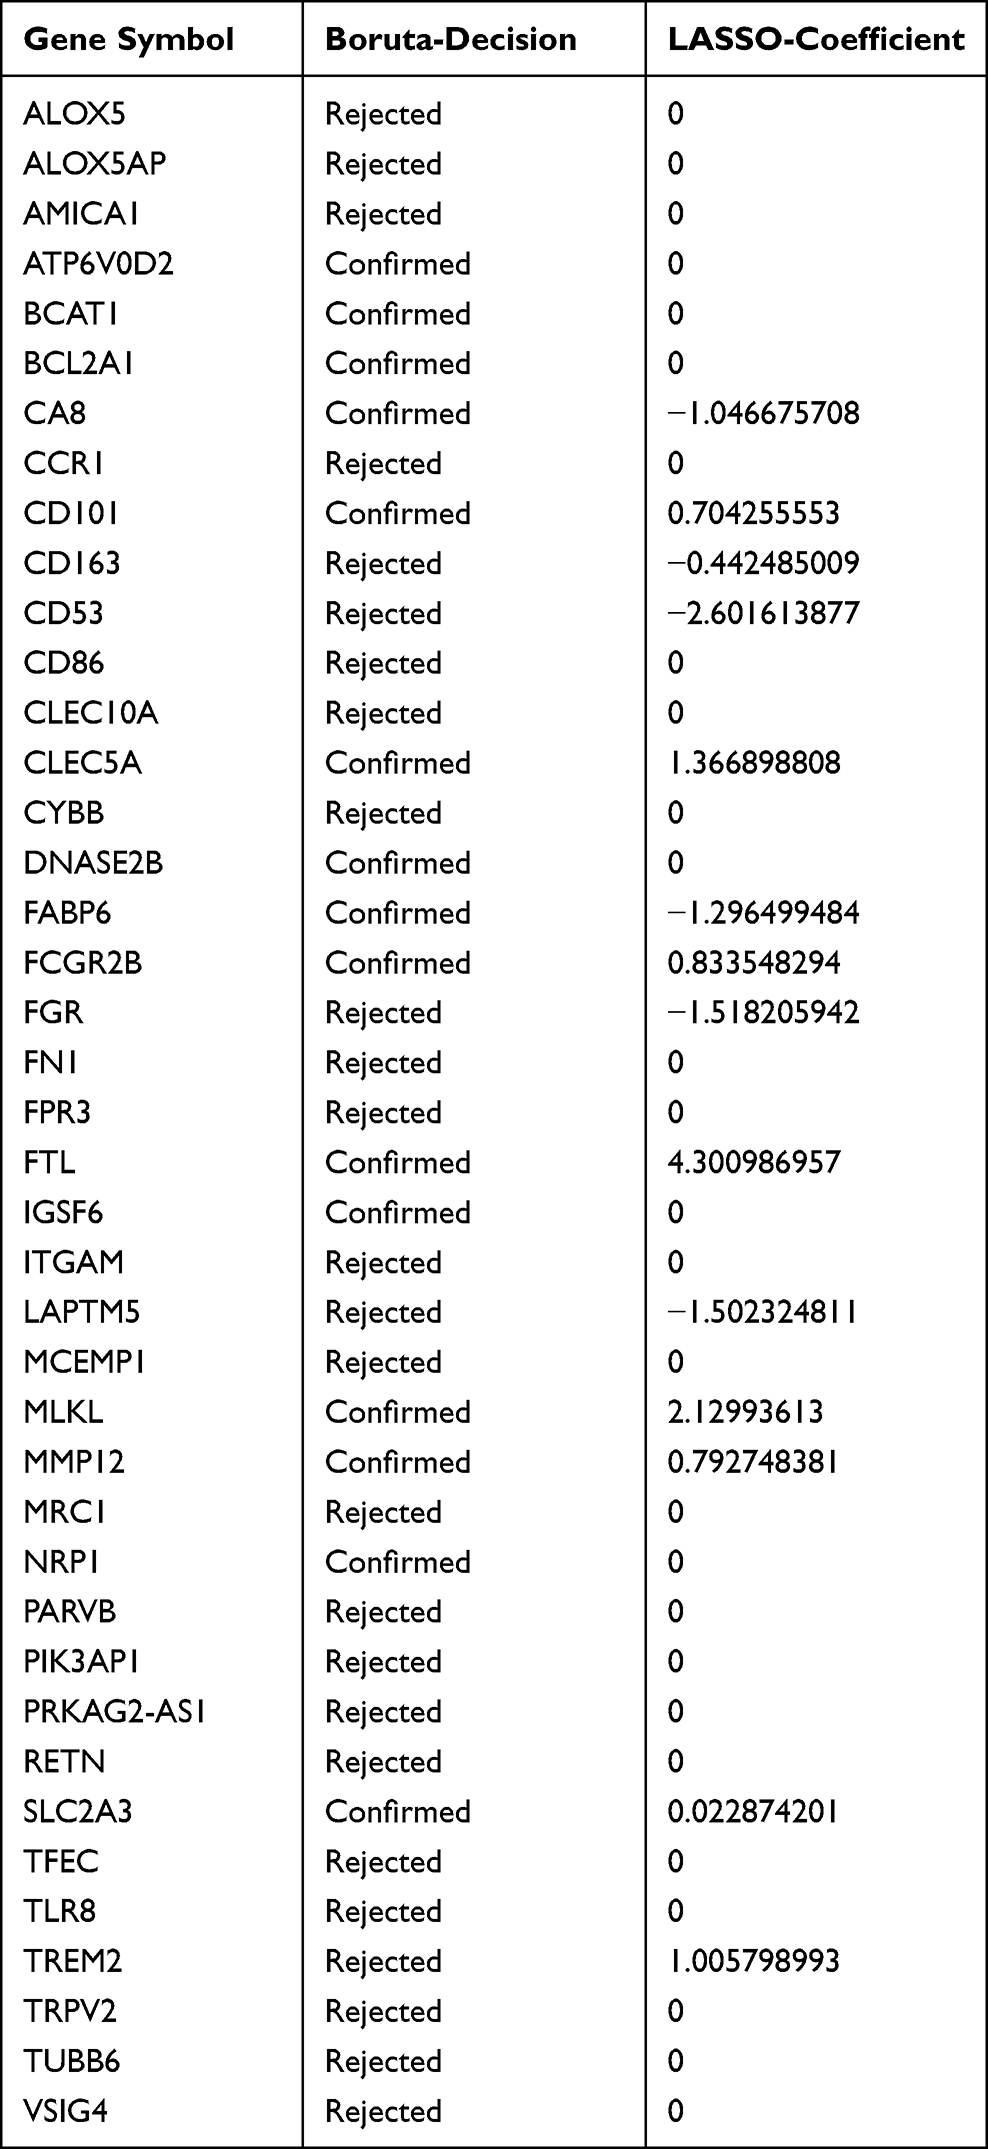 |
Table 2 Detailed Results of the Boruta and LASSO Algorithms |
Compared with healthy controls, COPD patients tended to have higher scores in training group (GSE20257) and two validation groups (GSE10006 and GSE8545). In other words, a higher score implied the higher expressions of CLEC5A, FTL and SLC2A3 and a greater likelihood of suffering from COPD (Figure 5A, D and G). Most of all, the AUC was 0.916, 0.873 and 0.932 in GSE20257 (Figure 5B), GSE10006 (Figure 5E) and GSE8545 (Figure 5H), respectively, indicating our model has an excellent value in diagnosing COPD. In these three GEO cohorts, the expressions of CLEC5A, FTL and SLC2A3 in COPD patients were all higher than the healthy controls (Figure 5C, F and I). To broaden the applicable value of this model, we used two lung tissue sequencing data (GSE57148 and GSE76925) for external verification. The AUCs were 0.675 in GSE57148 and 0.688 in GSE76925 (Supplementary Figure 4A–D). Obviously, our model still had certain predictive ability.
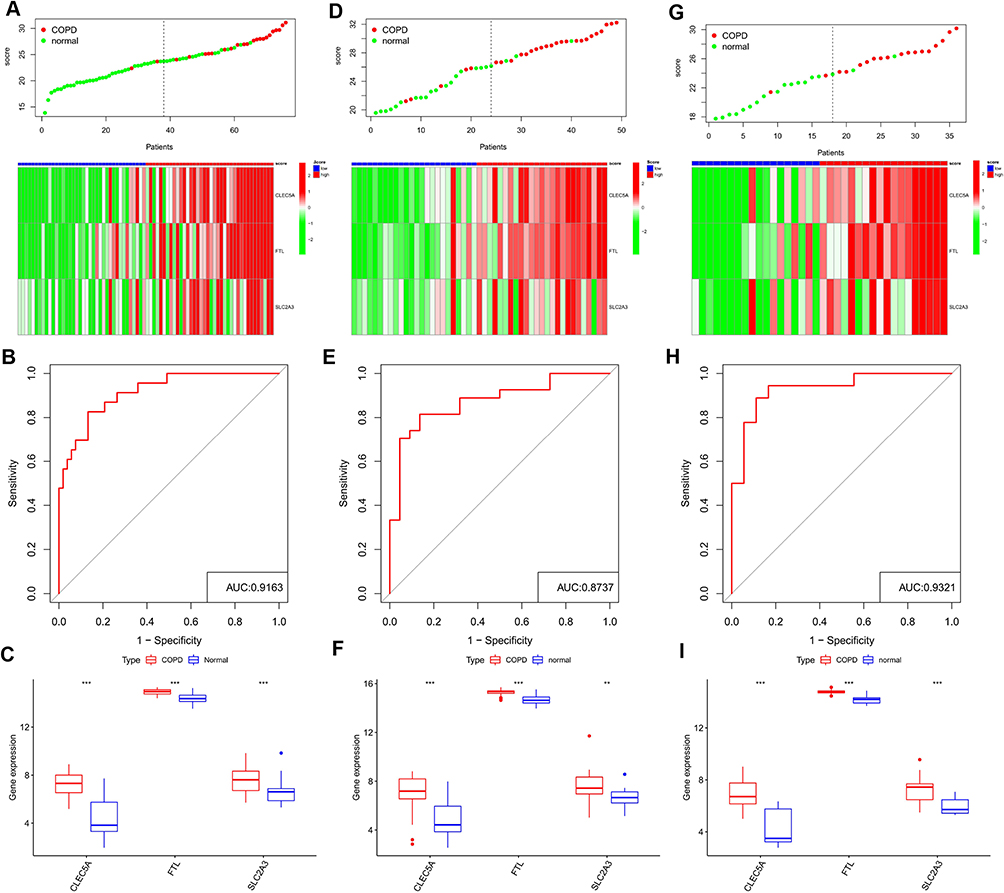 |
Figure 5 Identification of a 3-gene signature. Different results and expressions of CLEC5A, FTL and SLC2A3 between high- and low-score groups in GSE20257 (A), GSE10006 (D) and GSE8545 (G). AUC of predicted outcome in GSE20257 (B), GSE10006 (E) and GSE8545 (H). Expressions of CLEC5A, FTL and SLC2A3 in COPD patients and healthy controls in GSE20257 (C), GSE10006 (F) and GSE8545 (I). ns, no significance; **P < 0.01, ***P < 0.001. |
Expression Levels of CLEC5A, FTL and SLC2A3 in Single Cell Sequencing Data
Based on the scRNA-seq data of GSE167295, we obtained gene expression profile data of peripheral lung parenchymal tissue from three COPD patient samples for further analysis. After stringent quality control filtering to remove low-quality cells, the data were removed from batch effects and normalized. We used the “harmony” R package for batch effects (Supplementary Figure 5A and B). The PCA method was used to downscale, and the top 15 PCs were selected for further analysis based on P-values (Figure 6A). After obtaining each cell cluster, we combined the “singleR” algorithm to annotate cell subpopulations, and UMAP was used to display specific cell subpopulations (Figure 6B). The heatmap shows the relative expression of marker genes in each cell subpopulation (Figure 6C). The expression of CLEC5A, FTL and SLC2A3 in each cell subpopulation was displayed using featureplot function. The results showed that these three genes were indeed expressed in the macrophages from lung tissue of COPD patients: the expression level of CLEC5A was very low and was almost only expressed in macrophages; although FTL was expressed in all cell subsets, the expression intensity was highest in macrophages; while the expression of SLC2A3 was the highest in monocytes (Figure 6D and E).
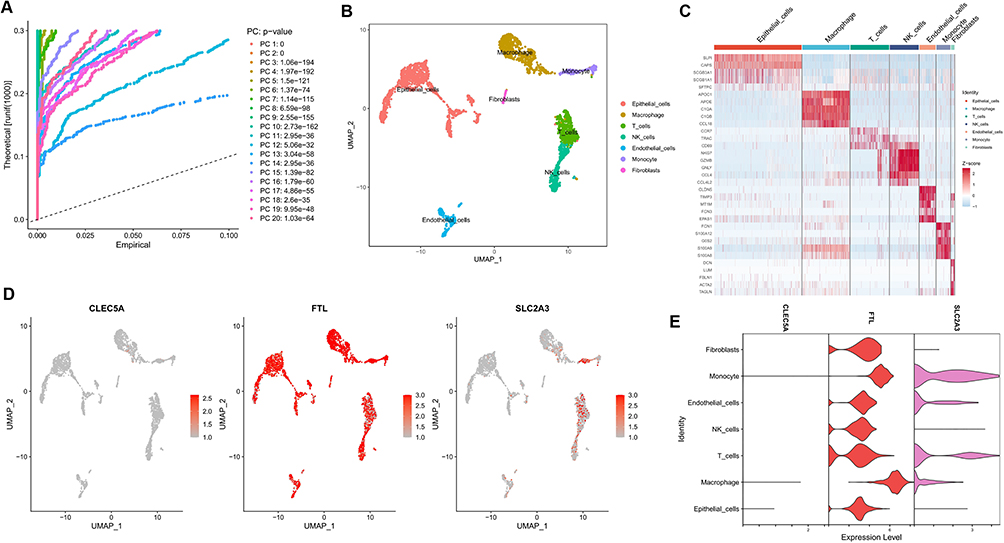 |
Figure 6 Analyses of single cell RNA sequencing data from lung tissue of COPD patients. (A) PCA was used for linear dimension reduction and the top 20 PCs were selected according to p-value. (B) UMAP plot of 9 cell subgroups shown by different colors. (C) Heat map showed the relative expression of marker genes for the 9 cell subgroups. Red represents high expression; blue represents low expression. (D and E) Expression of CLEC5A, FTL and SLC2A3 in the 9 cell subgroups. |
Expression of CLEC5A, FTL and SLC2A3 in vivo and in vitro
To simulate CSE-induced airway immune microenvironment, THP-M cells were differentiated from THP-1 monocytes and then co-cultured with 5% CSE-treated HBE cells for 24 h. The consequences of qRT-PCR and Western blot showed that the mRNA and protein levels of CLEC5A and SLC2A3 were up-regulated in a time-dependent manner in THP-M cells co-cultured with CSE-treated HBE cells, while the expression of FTL in protein level was up-regulated, but there was no significant change in mRNA level (Figure 7A–E).
 |
Figure 7 Expression of CLEC5A, FTL and SLC2A3 in THP-M cells co-cultured with CSE-treated HBE cells for 24 h. (A) Expression of CLEC5A mRNA. (B) Expression of FTL mRNA. (C) Expression of SLC2A3 mRNA. (D) Western blots. (E) Relative protein levels of CLEC5A, FTL and SLC2A3 were determined. The data are the mean ± SD (n=3). *P < 0.05. |
Not only that, but we evaluated CLEC5A, FTL, and SLC2A3 expression levels in the lung tissue of non-smokers, smokers, and COPD patients. The expression levels of these three proteins in the lungs of COPD patients, especially CLEC5A, were prominently higher than those of non-smokers and smokers (Figure 8A and B). Immunohistochemical staining results showed that CLEC5A, FTL and SLC2A3 were expressed in pulmonary macrophages from COPD patients with elevated expression levels compared with non-smokers or smokers (Figure 8C).
 |
Figure 8 Expression of CLEC5A, FTL and SLC2A3 in COPD patients. (A) Western blots. (B) Relative protein levels of CLEC5A, FTL and SLC2A3 in lung were determined. Con-NS, nonsmokers without COPD; Con-S, smokers without COPD; COPD, COPD patients. Data are mean ± SD (n = 3). *P < 0.05, ***P < 0.001. (C) Immunohistochemical staining for CLEC5A, FTL and SLC2A3 in non-smokers, smokers, and COPD patients. Positive protein staining appeared brown and nuclear staining appeared blue. Red arrows pointed macrophages. Scale bar = 50μm, original magnification: ×400. |
Discussion
Global initiative for chronic obstructive lung disease (2023 REPORT) first wrote the concept of “preserved-ratio impaired spirometry” (PRISm), that is, the one-second rate is normal (FEV1/FVC ≥ 0.7 after inhalation of bronchodilators) but lung ventilation function is impaired (FEV1% and/or FVC%<80% after inhalation of bronchodilators).44 Due to the mighty compensatory capacity of human lung and the absence of valuable biomarkers,85% of COPD patients in China have had moderate or above airflow limitation at the time of diagnosis. COPD will turn into the third leading cause of death in the world by 2030.45 It follows that there is an urgent demand to develop early diagnosis models for COPD. Variations in the pulmonary immune microenvironment have been considered to play a crucial role in the immunomodulatory response and the occurrence and development of COPD at present.12,46–48 Therefore, taking immune infiltration as the starting point, it has broad prospects to search for novel and effective signatures for COPD, which potentially consequence means of intervening early in diagnosis and treatment, thereby prolonging the survival of patients.
It is well known that pulmonary inflammation is the core pathogenesis of COPD, and smoking is considered to be the main incentive for COPD. Considering that the airway and even the alveolar are the sites directly exposed to cigarette smoke, we selected two airway tissue sequencing datasets (GSE20257 and GSE10006) for the study, where GSE20257 only contains sequencing data from small airways, while GSE10006 contains data from atmospheric ducts and small airways. We determined the infiltration of immune cells in samples from GSE20257 and GSE10006 via the “CIBERSORT” algorithm and the LM22 gene set. Through the differential analysis and evaluation of the ROC curve, we found that the fraction of M0 macrophages increased in COPD patients compared with healthy controls in both cohorts and M0 macrophages had satisfactory predictive value. Therefore, we considered M0 macrophages as the critical immune cells in COPD. Many studies have demonstrated that macrophages are the major inflammatory cell type in COPD, and the number of macrophages had a significant increase in sputum, bronchial biopsies and bronchoalveolar lavage fluid (BALF) of COPD patients.49 Macrophages are the main effector cells for uptake and processing of respiratory pathogens and inhalable particles. While COPD macrophages had defects in activity, adhesion, and phagocytosis, which was likely to promote further pulmonary recruitment of macrophages.50,51 Human rhinovirus (HRV) can impair the phagocytosis of COPD macrophages and enhance their responses to cytokines via the TLR3/IFN pathway, thereby preventing the resolution of inflammation and leading to prolonged exacerbations in COPD.52 Besides, there was also a great difference in the composition of macrophages between COPD patients, smokers, and non-smokers; the proportion of M1 macrophages in smokers and COPD patients was lower than that of M0 and M2 macrophages.53 The findings above further illustrated the importance of M0 macrophages to COPD. It should be noted that the differences in polarized macrophages between COPD patients and healthy controls were not statistically significant in this work. We considered that this result may be related to the failure to analyze the COPD patients according to age, smoking history, GOLD grade, disease phenotype, presence or absence of acute exacerbation, on account of lack of basic information and clinical data.
Forty-one candidate genes were obtained from the intersection of two key modules that are highly correlated with M0 macrophages. Functional enrichment analysis of these candidate genes revealed that almost all the biological function items obtained, such as regulation of cytokine production, regulation of innate immune response, specific granule, phagosome, lysosome, ferroptosis, etc., were related to the occurrence and development of COPD. For instance, Kearley et al found that after cigarette smoke exposure or viral infection, IL-33 can amplify the function of macrophages, causing them to produce more cytokines to aggravate local inflammation.54 CSE-treated neutrophils were effectively recognized and non-inflammatory phagocytosed by monocyte-derived macrophages, increased degranulation of which can affect the immune response of COPD patients.55 An increased number of alveolar macrophages with abnormal phagosome and lysosome functions was defined as a characteristic change in COPD. HRV16 can perturb phagocytosis in macrophages by downregulating the expression of Arpin, a key factor in targeted phagocytosis of macrophages.56 Furthermore, when macrophages ingested some toxic particles, such as cigarette smoke, it led lysosomes to release excessive proteases and other toxic enzymes into the cytoplasm, resulting in dying or dead macrophages.57 Previous study by our research group also found that NCOA4-mediated ferroptosis was involved in the polarization of COPD macrophages.43 Obviously, the functions of 41 candidate genes were associated with most macrophage M0-associated activities. To sum up, we speculated that these candidate genes may be involved in the occurrence and development of COPD through immune-related activities, and they may become the potential targets for diagnosing or treating COPD.
Finally, we constructed a predictive gene signature consisting of three genes (CLEC5A, FTL and SLC2A3) based on the gene expression profile in GSE20257, using ML approaches and multivariate logistic regression analysis. All three genes were highly expressed in COPD patients. C-Type lectin receptor 5A (CLEC5A), a spleen tyrosine kinase- (Syk-) coupled pattern recognition receptor to bacterial and viral infections, is involved in the innate immune response. Studies have revealed that extracellular vesicles released from activated platelets can amplify the inflammatory signal induced by dengue virus via CLEC5A/TLR2 on macrophages and promote macrophages to secrete proinflammatory mediators such as TNF-α and IL-6.58,59 Importantly, even under sterile conditions, once CLEC5A on non-inflammatory macrophages was targeted for activation, it would elicit a response similar to that against dengue virus and lead to a shift of myeloid cells to a proinflammatory phenotype.60 Besides, smoking can increase the expression of CLEC5A in immune cells.61 Wortham et al demonstrated that CLEC5A was highly expressed on alveolar macrophages in mouse models of COPD and human long-term smokers, while it was almost not expressed in macrophages of healthy controls,62 which was consistent with our findings. What’s interesting was that Sung et al found that thrombotic inflammation was attenuated dramatically in clec5a−/− mice,63 based on which we dared to speculate that perhaps the high expression of CLEC5A is a major risk factor for embolism in COPD patients. Ferritin light chain (FTL) has a powerful immunomodulatory function, which can prevent organ injury caused by excessive inflammatory response by inhibiting NF-κB activation.64 Meanwhile, FTL played a protective role in PM-induced lung injury by maintaining the stability of lysosomal function in macrophages.65 Tumor cells would produce FTL-rich vesicles to affect the recruitment of macrophages in hypoxic environment, so as to better escape host immunity.66 The encoding product of SLC2A3 gene (GLUT3) is a member of glucose transporter (GLUT) family, which is widely distributed in various human cells and closely related with glycometabolism. Numerous studies have confirmed that GLUT3 was highly expressed in pulmonary inflammatory diseases.67–69 Hochrein et al found that GLUT3 controlled T helper 17 cell-mediated inflammatory responses via glycolytic-epigenetic reprogramming.70 These results further emphasize the vital function of FTL and SLC2A3 in inflammation and immunity. Our macrophage M0-related diagnostic model achieved high AUCs in both the training set and the validation sets derived from airway tissue sequencing but was not well represented in the validation set from lung tissue. We considered that this may be related to the excessive complexity of cell groups in lung tissue and the small proportion of immune cells. To make the model more convincing, we further successfully demonstrated that CLEC5A, FTL and SLC2A3 are indeed expressed in the macrophages from COPD patients and at higher levels compared with smoking or non-smoking healthy controls by single-cell data analysis and experiments in vitro and in vivo. Overall, the three genes that make up our diagnostic model are able to serve as biomarkers to identify COPD patients.
Although the concept of M0/M1/M2 macrophages seems outdated in the omics era, the LM22 signature we used as a basis for the CIBERSORT algorithm to identify cell types does not include certain cell subsets that are known to play a role in COPD according to literature (like MDSCs) because it is derived from sorted human blood immune populations. We expect that more sophisticated concepts and analytical methods will emerge to construct relevant genetic models in the future. In addition, notwithstanding our model provides a method for the diagnosis of COPD that is different from lung function and imaging examination, the combination of genetic diagnosis model and analysis of important clinical data can effectively improve the sensitivity and specificity of disease identification.71 Limited by its lack of relevant information, our model should be further validated in large-scale clinical data to ensure the stability of the results and to determine whether it can be applied to the early diagnosis of COPD. As previous research has indicated that cigarette smoke can have a significant impact on the transcriptomics of tracheal epithelium. Notably, HBE cell lines are non-differentiated, and it would be valuable if we could continue to explore the impact of CSE on the expression of CLEC5A, FTL, and SLC2A3 in differentiated epithelium and compare it to undifferentiated epithelium (basal cells) in subsequent studies.72 Additionally, differences in gene expression between males and females in response to chronic injury in the airway epithelium could have implications on disease susceptibility, both in COPD and other respiratory diseases.73 Considering that there are certain differences in the therapy of COPD patients with different phenotypes.74,75 Our subsequent research will also focus on applying ML to the early differentiation of COPD phenotypes and assessing the sensitivity to glucocorticoid therapy in COPD patients with different phenotypes. At present, deep learning has been applied to drug development and vaccine design,76 and we should also keep an eye on this in order to find potential drugs that can benefit COPD patients. Finally, although we have discovered that CLEC5A, FTL, and SLC2A3 help to identify COPD, the specific mechanisms by which these three genes impact COPD remain to be explored.
Conclusion
To sum up, our study clearly revealed the relationship between COPD and immune cells, in which M0 macrophages were essential. More than anything, we constructed and validated a novel macrophage M0-associated diagnostic model with satisfactory predictive value. Immunoinfiltration has always been a research hotspot of novel therapies for COPD. CLEC5A, FTL and SLC2A3 are expected to be promising targets of immunotherapy in COPD.
Data Sharing Statement
The datasets analyzed for this study were obtained from the GEO website (https://www.ncbi.nlm.nih.gov/geo/).
Ethical Approval and Consent to Participate
This study was conducted in accordance with the Declaration of Helsinki, and the study involving human participants was reviewed and approved by the Research Ethics Committee of Wuxi People’s Hospital. Patients/participants provided written informed consent to participate in this study.
Acknowledgments
We thank all the participants involved in this study.
Author Contributions
All authors contributed significantly to the research that was published, whether it was in the conceptualization, research design, implementation, data gathering, analysis, and interpretation, or each of these areas separately; participated in the report’s drafting, revision, or detailed evaluation; approved the final version for publishing; decided upon the journal to which the manuscript has been submitted; and accept responsibility for all aspects of the project.
Funding
This work was supported by National Natural Science Foundation of China (82173472), and the Municipal Medical Development Discipline project of Wuxi City (FZXK-3).
Disclosure
The authors declare no conflicts of interest in this work.
References
1. Giordano L, Farnham A, Dhandapani PK, et al. Alternative oxidase attenuates cigarette smoke–induced lung dysfunction and tissue damage. Am J Respir Cell Mol Biol. 2019;60(5):515–522. doi:10.1165/rcmb.2018-0261OC
2. Silverman EK. Genetics of COPD. Annu Rev Physiol. 2020;82(1):413–431. doi:10.1146/annurev-physiol-021317-121224
3. Halpin DMG, Criner GJ, Papi A, et al. Global Initiative for the diagnosis, management, and prevention of chronic obstructive lung disease. The 2020 GOLD science committee report on COVID-19 and Chronic obstructive pulmonary disease. Am J Respir Crit Care Med. 2021;203(1):24–36. doi:10.1164/rccm.202009-3533SO
4. Hlapčić I, Hulina-Tomašković A, Somborac-Bačura A, et al. Extracellular adenosine triphosphate is associated with airflow limitation severity and symptoms burden in patients with chronic obstructive pulmonary disease. Sci Rep. 2019;9(1):15349. doi:10.1038/s41598-019-51855-w
5. May SM, Li JTC. Burden of chronic obstructive pulmonary disease: healthcare costs and beyond. Allergy Asthma Proc. 2015;36(1):4–10. doi:10.2500/aap.2015.36.3812
6. Qureshi H, Sharafkhaneh A, Hanania NA. Chronic obstructive pulmonary disease exacerbations: latest evidence and clinical implications. Ther Adv Chronic Dis. 2014;5(5):212–227. doi:10.1177/2040622314532862
7. Bai S, Ye R, Wang C, Sun P, Zhao L. Comparative analysis of pathophysiological parameters between emphysematous smokers and emphysematous patients with COPD. Sci Rep. 2020;10(1):420. doi:10.1038/s41598-019-57354-2
8. Litmanovich D, Boiselle PM, Bankier AA. CT of pulmonary emphysema - current status, challenges, and future directions. Eur Radiol. 2009;19(3):537–551. doi:10.1007/s00330-008-1186-4
9. Ostridge K, Williams N, Kim V, et al. Relationship between pulmonary matrix metalloproteinases and quantitative CT markers of small airways disease and emphysema in COPD. Thorax. 2016;71(2):126–132. doi:10.1136/thoraxjnl-2015-207428
10. Timmins SC, Diba C, Farrow CE, et al. The relationship between airflow obstruction, emphysema extent, and small airways function in COPD. Chest. 2012;142(2):312–319. doi:10.1378/chest.11-2169
11. Richmond BW, Mansouri S, Serezani A, et al. Monocyte-derived dendritic cells link localized secretory IgA deficiency to adaptive immune activation in COPD. Mucosal Immunol. 2021;14(2):431–442. doi:10.1038/s41385-020-00344-9
12. Jogdand P, Siddhuraj P, Mori M, et al. Eosinophils, basophils and type 2 immune microenvironments in COPD-affected lung tissue. Eur Respir J. 2020;55(5):1900110. doi:10.1183/13993003.00110-2019
13. Yang Y, Zhang M, Liu J, Jiang Y, Ji X, Qu Y. Identification of ferroptosis-related hub genes and their association with immune infiltration in chronic obstructive pulmonary disease by bioinformatics analysis. Int J Chron Obstruct Pulmon Dis. 2022;17:1219–1236. doi:10.2147/COPD.S348569
14. Ghosh B, Gaike AH, Pyasi K, et al. Bacterial load and defective monocyte-derived macrophage bacterial phagocytosis in biomass smoke-related COPD. Eur Respir J. 2019;53(2):1702273. doi:10.1183/13993003.02273-2017
15. Singh R, Belchamber KBR, Fenwick PS, et al. Defective monocyte-derived macrophage phagocytosis is associated with exacerbation frequency in COPD. Respir Res. 2021;22(1):113. doi:10.1186/s12931-021-01718-8
16. Zhang Y, Xia R, Lv M, et al. Machine-learning algorithm-based prediction of diagnostic gene biomarkers related to immune infiltration in patients with chronic obstructive pulmonary disease. Front Immunol. 2022;13:740513. doi:10.3389/fimmu.2022.740513
17. Yang Y, Cao Y, Han X, et al. Revealing EXPH5 as a potential diagnostic gene biomarker of the late stage of COPD based on machine learning analysis. Comput Biol Med. 2023;154:106621. doi:10.1016/j.compbiomed.2023.106621
18. Moll M, Qiao D, Regan EA, et al. Machine learning and prediction of all-cause mortality in COPD. Chest. 2020;158(3):952–964. doi:10.1016/j.chest.2020.02.079
19. Dhong K, Lee J, Yoon Y, Park H. Identification of TRPC6 as a novel diagnostic biomarker of PM-induced chronic obstructive pulmonary disease using machine learning models. Genes. 2023;14(2):284. doi:10.3390/genes14020284
20. Shaykhiev R, Otaki F, Bonsu P, et al. Cigarette smoking reprograms apical junctional complex molecular architecture in the human airway epithelium in vivo. Cell Mol Life Sci. 2011;68(5):877–892. doi:10.1007/s00018-010-0500-x
21. Carolan BJ, Harvey B, De BP, Vanni H, Crystal RG. Decreased Expression of intelectin 1 in the human airway epithelium of smokers compared to nonsmokers. J Immunol. 2008;181(8):5760–5767. doi:10.4049/jimmunol.181.8.5760
22. Ammous Z, Hackett NR, Butler MW, et al. Variability in Small airway epithelial gene expression among normal smokers. Chest. 2008;133(6):1344–1353. doi:10.1378/chest.07-2245
23. Kim WJ, Lim JH, Lee JS, Lee S, Kim JH, Oh Y. Comprehensive analysis of transcriptome sequencing data in the lung tissues of COPD subjects. Int J Genomics. 2015;2015:1–09. doi:10.1155/2015/206937
24. Vishweswaraiah S, George L, Purushothaman N, Ganguly K. A candidate gene identification strategy utilizing mouse to human big-data mining: “3R-tenet” in COPD genetic research. Respir Res. 2018;19(1):92. doi:10.1186/s12931-018-0795-y
25. Jeong I, Lim J, Oh DK, Kim WJ, Oh Y. Gene expression profile of human lung in a relatively early stage of COPD with emphysema. Int J Chron Obstruct Pulmon Dis. 2018;13:2643–2655. doi:10.2147/COPD.S166812
26. Morrow JD, Zhou X, Lao T, et al. Functional interactors of three genome-wide association study genes are differentially expressed in severe chronic obstructive pulmonary disease lung tissue. Sci Rep. 2017;7(1):44232. doi:10.1038/srep44232
27. Hobbs BD, Morrow JD, Wang X, et al. Identifying chronic obstructive pulmonary disease from integrative omics and clustering in lung tissue. BMC Pulm Med. 2023;23(1):115. doi:10.1186/s12890-023-02389-5
28. Irizarry RA. Exploration, normalization, and summaries of high density oligonucleotide array probe level data. Biostatistics. 2003;4(2):249–264. doi:10.1093/biostatistics/4.2.249
29. Zhao S, Zhang L, Ji W, et al. Machine learning-based characterization of cuprotosis-related biomarkers and immune infiltration in Parkinson’s disease. Front Genet. 2022;13:1010361. doi:10.3389/fgene.2022.1010361
30. Chen B, Khodadoust MS, Liu CL, Newman AM, Alizadeh AAS. Profiling Tumor Infiltrating Immune Cells with CIBERSORT. New York, NY; Springer New York. 2018. 243–259.
31. Robin X, Turck N, Hainard A, et al. pROC: an open-source package for R and S+ to analyze and compare ROC curves. BMC Bioinf. 2011;12(1):77. doi:10.1186/1471-2105-12-77
32. Ritchie ME, Phipson B, Wu D, et al. limma powers differential expression analyses for RNA-sequencing and microarray studies. Nucleic Acids Res. 2015;43(7):e47. doi:10.1093/nar/gkv007
33. Liu S, Wang Z, Zhu R, Wang F, Cheng Y, Liu Y. Three differential expression analysis methods for RNA sequencing: limma, EdgeR, DESeq2. J Visual Exper. 2021. doi:10.3791/62528
34. Langfelder P, Horvath S. WGCNA: an R package for weighted correlation network analysis. BMC Bioinf. 2008;9(1):559. doi:10.1186/1471-2105-9-559
35. Ashburner M, Ball CA, Blake JA, et al. Gene ontology: tool for the unification of biology. Nat Genet. 2000;25(1):25–29. doi:10.1038/75556
36. Kanehisa M. KEGG: Kyoto encyclopedia of genes and genomes. Nucleic Acids Res. 2000;28(1):27–30. doi:10.1093/nar/28.1.27
37. Yu G, Wang L, Han Y, He Q. clusterProfiler: an R package for comparing biological themes among gene clusters. Omics. 2012;16(5):284–287. doi:10.1089/omi.2011.0118
38. Engebretsen S, Bohlin J. Statistical predictions with glmnet. Clin Epigenetics. 2019;11(1):123. doi:10.1186/s13148-019-0730-1
39. McEligot AJ, Poynor V, Sharma R, Panangadan A. Logistic LASSO regression for dietary intakes and breast cancer. Nutrients. 2020;12(9):2652. doi:10.3390/nu12092652
40. Morse C, Tabib T, Sembrat J, et al. Proliferating SPP1/MERTK-expressing macrophages in idiopathic pulmonary fibrosis. Eur Respir J. 2019;54(2):1802441. doi:10.1183/13993003.02441-2018
41. Korsunsky I, Millard N, Fan J, et al. Fast, sensitive and accurate integration of single-cell data with Harmony. Nat Methods. 2019;16(12):1289–1296. doi:10.1038/s41592-019-0619-0
42. Aran D, Looney AP, Liu L, et al. Reference-based analysis of lung single-cell sequencing reveals a transitional profibrotic macrophage. Nat Immunol. 2019;20(2):163–172. doi:10.1038/s41590-018-0276-y
43. Liu J, Zhang Z, Yang Y, Di T, Wu Y, Bian T. NCOA4-mediated ferroptosis in bronchial epithelial cells promotes macrophage M2 polarization in COPD emphysema. Int J Chron Obstruct Pulmon Dis. 2022;17:667–681. doi:10.2147/COPD.S354896
44. Venkatesan P. GOLD COPD report: 2023 update. Lancet Respir Med. 2023;11(1):18. doi:10.1016/S2213-2600(22)00494-5
45. Terzikhan N, Verhamme KMC, Hofman A, Stricker BH, Brusselle GG, Lahousse L. Prevalence and incidence of COPD in smokers and non-smokers: the Rotterdam Study. Eur J Epidemiol. 2016;31(8):785–792. doi:10.1007/s10654-016-0132-z
46. Alter P, Baker JR, Dauletbaev N, et al. Update in chronic obstructive pulmonary disease 2019. Am J Respir Crit Care Med. 2020;202(3):348–355. doi:10.1164/rccm.202002-0370UP
47. Bu T, Wang LF, Yin YQ. How do innate immune cells contribute to airway remodeling in COPD progression? Int J Chron Obstruct Pulmon Dis. 2020;15:107–116. doi:10.2147/COPD.S235054
48. Cruz T, López-Giraldo A, Noell G, et al. Multi-level immune response network in mild-moderate Chronic Obstructive Pulmonary Disease (COPD). Respir Res. 2019;20(1):152. doi:10.1186/s12931-019-1105-z
49. Cosio MG, Guerassimov A. Chronic obstructive pulmonary disease. Am J Respir Crit Care Med. 1999;160(supplement_1):S21–25. doi:10.1164/ajrccm.160.supplement_1.7
50. Jubrail J, Kurian N, Niedergang F. Macrophage phagocytosis cracking the defect code in COPD. Biomed J. 2017;40(6):305–312. doi:10.1016/j.bj.2017.09.004
51. Xue J, Schmidt SV, Sander J, et al. Transcriptome-Based network analysis reveals a spectrum model of human macrophage activation. Immunity. 2014;40(2):274–288. doi:10.1016/j.immuni.2014.01.006
52. Finney LJ, Belchamber KBR, Fenwick PS, et al. Human Rhinovirus impairs the innate immune response to bacteria in alveolar macrophages in chronic obstructive pulmonary disease. Am J Respir Crit Care Med. 2019;199(12):1496–1507. doi:10.1164/rccm.201806-1095OC
53. Shen W, Wang S, Wang R, et al. Analysis of the polarization states of the alveolar macrophages in chronic obstructive pulmonary disease samples based on miRNA-mRNA network signatures. Ann Transl Med. 2021;9(16):1333. doi:10.21037/atm-21-3815
54. Kearley J, Silver JS, Sanden C, et al. Cigarette smoke silences innate lymphoid cell function and facilitates an exacerbated type I interleukin-33-dependent response to infection. Immunity. 2015;42(3):566–579. doi:10.1016/j.immuni.2015.02.011
55. Guzik K, Skret J, Smagur J, et al. Cigarette smoke-exposed neutrophils die unconventionally but are rapidly phagocytosed by macrophages. Cell Death Dis. 2011;2(3):e131. doi:10.1038/cddis.2011.13
56. Jubrail J, Africano Gomez K, Herit F, et al. Arpin is critical for phagocytosis in macrophages and is targeted by human rhinovirus. EMBO Rep. 2020;21(1):e47963. doi:10.15252/embr.201947963
57. Brain JD. Macrophage damage in relation to the pathogenesis of lung diseases. Environ Health Perspect. 1980;35:21–28. doi:10.1289/ehp.803521
58. Sung P, Huang T, Hsieh S, Koch M. Extracellular vesicles from CLEC2-activated platelets enhance dengue virus-induced lethality via CLEC5A/TLR2. Nat Commun. 2019;10(1):10. doi:10.1038/s41467-019-10360-4
59. Teng O, Chen S, Hsu T, et al. CLEC5A-mediated enhancement of the inflammatory response in myeloid cells contributes to influenza virus pathogenicity in vivo. J Virol. 2017:91. doi:10.1128/JVI.01813-16
60. Tosiek MJ, Groesser K, Pekcec A, Zwirek M, Murugesan G, Borges E. Activation of the innate immune checkpoint CLEC5A on myeloid cells in the absence of danger signals modulates macrophages’ function but does not trigger the adaptive T cell immune response. J Immunol Res. 2022;2022:1–22. doi:10.1155/2022/9926305
61. Nowak J, Dybska E, Adams A, Walkowiak J. Immune cell-specific smoking-related expression characteristics are revealed by re-analysis of transcriptomes from the CEDAR cohort. Cent Eur J Immunol. 2022;47(3):246–259. doi:10.5114/ceji.2022.120618
62. Wortham BW, Eppert BL, Flury JL, et al. Cutting Edge: CLEC5A mediates macrophage function and chronic obstructive pulmonary disease pathologies. J Immunol. 2016;196(8):3227–3231. doi:10.4049/jimmunol.1500978
63. Sung P, Yang S, Peng Y, Sun C, Tao M, Hsieh S. CLEC5A and TLR2 are critical in SARS-CoV-2-induced NET formation and lung inflammation. J Biomed Sci. 2022;29(1):52. doi:10.1186/s12929-022-00832-z
64. Zarjou A, Black LM, McCullough KR, et al. Ferritin light chain confers protection against sepsis-induced inflammation and organ injury. Front Immunol. 2019;10:10. doi:10.3389/fimmu.2019.00131
65. Yan L, Chen S, Hou C, et al. Multi-omics analysis unravels dysregulated lysosomal function and lipid metabolism involved in sub-chronic particulate matter-induced pulmonary injury. Sci Total Environ. 2022;836:155642. doi:10.1016/j.scitotenv.2022.155642
66. Park JE, Dutta B, Tse SW, et al. Hypoxia-induced tumor exosomes promote M2-like macrophage polarization of infiltrating myeloid cells and microRNA-mediated metabolic shift. Oncogene. 2019;38(26):5158–5173. doi:10.1038/s41388-019-0782-x
67. Wang ZG, Yu MM, Han Y, et al. Correlation of Glut-1 and Glut-3 expression with F-18 FDG uptake in pulmonary inflammatory lesions. Medicine. 2016;95(48):e5462. doi:10.1097/MD.0000000000005462
68. Na KJ, Choi H, Oh HR, et al. Reciprocal change in glucose metabolism of cancer and immune cells mediated by different glucose transporters predicts immunotherapy response. Theranostics. 2020;10(21):9579–9590. doi:10.7150/thno.48954
69. Mochizuki T, Tsukamoto E, Kuge Y, et al. FDG uptake and glucose transporter subtype expressions in experimental tumor and inflammation models. J Nucl Med. 2001;42(10):1551–1555.
70. Hochrein SM, Wu H, Eckstein M, et al. The glucose transporter GLUT3 controls T helper 17 cell responses through glycolytic-epigenetic reprogramming. Cell Metab. 2022;34(4):516–532. doi:10.1016/j.cmet.2022.02.015
71. Liu T, Siegel E, Shen D. Deep learning and medical image analysis for COVID-19 diagnosis and prediction. Annu Rev Biomed Eng. 2022;24(1):179–201. doi:10.1146/annurev-bioeng-110220-012203
72. Ghosh B, Park B, Bhowmik D, et al. Strong correlation between air-liquid interface cultures and in vivo transcriptomics of nasal brush biopsy. Am J Physiol Lung Cell Mol Physiol. 2020;318(5):L1056–62. doi:10.1152/ajplung.00050.2020
73. Ghosh B, Chengala PP, Shah S, et al. Cigarette smoke-induced injury induces distinct sex-specific transcriptional signatures in mice tracheal epithelial cells. Am J Physiol Lung Cell Mol Physiol. 2023;325(4):L467–76. doi:10.1152/ajplung.00104.2023
74. Singh D, Roche N, Halpin D, Agusti A, Wedzicha JA, Martinez FJ. Current controversies in the pharmacological treatment of chronic obstructive pulmonary disease. Am J Respir Crit Care Med. 2016;194(5):541–549. doi:10.1164/rccm.201606-1179PP
75. van der Molen MC, Hartman JE, Vermeulen CJ, et al. Determinants of lung fissure completeness. Am J Respir Crit Care Med. 2021;204(7):807–816. doi:10.1164/rccm.202102-0260OC
76. Yin C, Udrescu M, Gupta G, et al. Fractional dynamics foster deep learning of COPD stage prediction. Adv Sci. 2023;10(12):2203485. doi:10.1002/advs.202203485
 © 2023 The Author(s). This work is published and licensed by Dove Medical Press Limited. The
full terms of this license are available at https://www.dovepress.com/terms
and incorporate the Creative Commons Attribution
- Non Commercial (unported, 3.0) License.
By accessing the work you hereby accept the Terms. Non-commercial uses of the work are permitted
without any further permission from Dove Medical Press Limited, provided the work is properly
attributed. For permission for commercial use of this work, please see paragraphs 4.2 and 5 of our Terms.
© 2023 The Author(s). This work is published and licensed by Dove Medical Press Limited. The
full terms of this license are available at https://www.dovepress.com/terms
and incorporate the Creative Commons Attribution
- Non Commercial (unported, 3.0) License.
By accessing the work you hereby accept the Terms. Non-commercial uses of the work are permitted
without any further permission from Dove Medical Press Limited, provided the work is properly
attributed. For permission for commercial use of this work, please see paragraphs 4.2 and 5 of our Terms.
Recommended articles
Using Machine Learning to Predict Likelihood and Cause of Readmission After Hospitalization for Chronic Obstructive Pulmonary Disease Exacerbation
Bonomo M, Hermsen MG, Kaskovich S, Hemmrich MJ, Rojas JC, Carey KA, Venable LR, Churpek MM, Press VG
International Journal of Chronic Obstructive Pulmonary Disease 2022, 17:2701-2709
Published Date: 20 October 2022
Identification of Neutrophil Extracellular Trap-Related Gene Expression Signatures in Ischemia Reperfusion Injury During Lung Transplantation: A Transcriptome Analysis and Clinical Validation

Gao J, Zhang Z, Yu J, Zhang N, Fu Y, Jiang X, Xia Z, Zhang Q, Wen Z
Journal of Inflammation Research 2024, 17:981-1001
Published Date: 12 February 2024
Identification of Potential Drug Targets for the Treatment of Severe Burn Wounds from a Multi-Omics Perspective
Zhu G, Li J, Xu J, Guo G, Zhu F
Journal of Inflammation Research 2024, 17:11275-11289
Published Date: 19 December 2024
Murine Model Insights: Identifying Dusp15 as a Novel Biomarker for Diabetic Cardiomyopathy Uncovered Through Integrated Omics Analysis and Experimental Validation
Zhu L, Dong Y, Guo H, Qiu J, Guo J, Hu Y, Pan C
Diabetes, Metabolic Syndrome and Obesity 2025, 18:515-527
Published Date: 19 February 2025
Development and Interpretable Machine Learning-Based Prediction of Cardiovascular Disease Risk in Chinese COPD Patients: An Analysis of the CHARLS Database
Yuan Y, Zhu J, Zhao X, Huang Q, Li J, Wang Y, Liu W, Chen M, Li D, Wu B, Li W, Wu D
International Journal of Chronic Obstructive Pulmonary Disease 2026, 21:590631
Published Date: 25 May 2026