Back to Journals » Journal of Inflammation Research » Volume 18
Comprehensive Analysis and Experimental Validation of Immune-Related Biomarkers and Immune Microenvironment in Diabetic Nephropathy
Authors Zhou W, Zeng Z, Li X, Yang M ![]()
Received 3 June 2025
Accepted for publication 25 September 2025
Published 3 October 2025 Volume 2025:18 Pages 13711—13726
DOI https://doi.org/10.2147/JIR.S541886
Checked for plagiarism Yes
Review by Single anonymous peer review
Peer reviewer comments 2
Editor who approved publication: Dr Quan Zhang
Weini Zhou,1,* Ziyang Zeng,2,* Xunjia Li,3– 5 Mei Yang1
1Department of Endocrinology, The People’s Hospital of Chongqing Liang Jiang New Area, The Affiliated Liang Jiang Hospital of Chongqing Medical University, Chongqing, 401121, People’s Republic of China; 2Department of Anesthesiology, The First Affiliated Hospital of Chongqing University of Chinese Medicine, Chongqing Traditional Chinese Medicine Hospital, Chongqing, 400021, People’s Republic of China; 3Department of Nephrology, The First Affiliated Hospital of Chongqing University of Chinese Medicine, Chongqing Traditional Chinese Medicine Hospital, Chongqing, 400021, People’s Republic of China; 4The Second Affiliated Hospital of Chongqing Medical University, Chongqing, 400010, People’s Republic of China; 5Department of Research and Development, Chongqing Precision Medical Industry Technology Research Institute, Chongqing, 400000, People’s Republic of China
*These authors contributed equally to this work
Correspondence: Mei Yang, Department of Endocrinology, The People’s Hospital of Chongqing Liang Jiang New Area, The Affiliated Liang Jiang Hospital of Chongqing Medical University, Chongqing, 401121, People’s Republic of China, Email [email protected] Xunjia Li, Department of Nephrology, The First Affiliated Hospital of Chongqing University of Chinese Medicine, Chongqing Traditional Chinese Medicine Hospital, Chongqing, 400021, People’s Republic of China, Email [email protected]
Background: The molecular mechanism of diabetic nephropathy (DN) is still not fully understood. There is ample evidence that the immune system plays a crucial role in the progression of DN. Further exploration of immune-related genes (IRGs) for DN diagnosis is therefore of significant clinical value.
Methods: Gene expression data from DN patients were obtained from the GEO database, and a weighted gene co-expression network analysis (WGCNA) was constructed. The overlapping IRGs derived by the least absolute shrinkage and selection operator (LASSO) and recursive feature elimination (RF) algorithms were identified as DN diagnostic biomarkers. A nomogram model was established to evaluate the diagnostic ability of feature biomarkers. The expression levels of the screened IRGs were validated in vitro using qRT-PCR. Type 2 diabetes mellitus (T2DM) mouse model with DN was also established to confirm the consistency with bioinformatic predictions.
Results: Three IRG-related DN characteristic diagnostic biomarkers (CCL9, EDN1 and HSPA1L) were identified. After verifying the DN diagnostic capability with nomogram model, pathway enrichment analysis, immunoinfiltration characteristics and correlation analysis were used to comprehensively analyze the potential effects of selected IRGs on DN. The differential expressions of screened IRGs were further confirmed by cell line and T2DM mouse model.
Conclusion: Our findings nominate CCL9, EDN1, and HSPA1L as key mediators of DN progression and unveil their potential as diagnostic biomarkers. Although prospective validation in human cohorts is a prerequisite for clinical translation, these IRGs represent a compelling foundation for a precision medicine tool. This tool could transform patient management by facilitating pre-symptomatic diagnosis and informing tailored interventions to halt DN development.
Keywords: diabetic nephropathy, immune related genes, diagnostic biomarker, immune infiltration, machine learning
Introduction
The global prevalence of type 1 diabetes mellitus (T1DM) and type 2 diabetes mellitus (T2DM) has increased rapidly in the past few decades.1,2 Diabetic nephropathy (DN) is the most common complication of type 1 and type 2 diabetes, affecting about one-third of all diabetics.3 Generally, about 50% of DN cases progresses to end-stage renal disease (ESRD).3,4 Epidemiological studies have shown that improved diabetes education strategies and management have significantly reduced the incidence of certain diabetes-related events in recent decades. However, these strategies have had a negligible effect on the incidence of ESRD.5 The main known causes of DN include glucose metabolism disorder, oxidative stress and renal hemodynamic changes.6,7 The specific molecular mechanisms remain unclear, and effective treatments are still lacking. A deeper understanding of the underlying pathogenesis of DN is urgently needed in clinical work to identify better therapies for DN patients.8,9
Inflammation is associated with the pathogenesis of diabetes, and elevated serum inflammatory biomarkers could be observed in patients with DM.10 Previous study has revealed the central role of innate and adaptive immune-mediated inflammation in DN.11–13 In patients with diabetes, biological processes including oxidative stress, oxidized lipids and reactive oxygen species (ROS) caused by high blood glucose and lipid levels damage kidney cells, leading to the release of damage-related molecular patterns (DMAPs) that ultimately trigger pro-inflammatory signaling pathways.14 The activation of the complement system in DN and its triggering of pathogenic pro-inflammatory signaling has also been better understood.15 Multiple immune cell types contribute to DN pathogenesis. For instance, persistent hyperglycemia, immune complex deposition in glomeruli, and increased chemokine production promote the recruitment and activation of macrophages in the kidney, leading to inflammation and fibrosis.16 Regulatory T cells (Tregs) have been shown to improve insulin resistance and attenuate DN progression in mice by exerting anti-inflammatory effects and suppressing CD8+ T cell infiltration in renal and adipose tissues.17,18 Meanwhile, as important effectors of the immune system, a variety of cytokines, adhesion molecules and chemokines are also involved in the process of DN.19 There is ample evidence that the immune system plays a crucial role in the progression of DN.20–22 Therefore, multiple clinical and preclinical therapies targeting the immune system for DN are currently underway.23
Despite these advances, the specific immune-related genes (IRGs) that drive DN progression and their potential as diagnostic biomarkers remain poorly characterized.24,25 Most previous studies have focused on individual immune components rather than providing a comprehensive analysis of the immune-related transcriptional landscape in DN.26,27 Furthermore, there is a lack of integrated approaches that combine bioinformatic identification of candidate IRGs with experimental validation in disease models.28,29 To address these knowledge gaps, this study aimed to: (1) identify novel IRG-based diagnostic biomarkers for DN through integrated bioinformatics analysis of human DN datasets; (2) explore the immune infiltration characteristics associated with these biomarkers; (3) validate the expression patterns of these candidate biomarkers in in vivo model of DN. Our study provides a comprehensive analysis of the immune-related molecular features in DN and identifies three potential IRG biomarkers with diagnostic value. Pathway enrichment analysis and immune infiltration analysis were used to explore the mechanism of the prognostic model. Validation using a T2DM mouse model supported the robustness of our bioinformatic findings. These findings not only enhance our understanding of the immunopathogenesis of DN but also offer new insights for developing more targeted diagnostic strategies and immunomodulatory therapies.
Materials and Methods
Data Collection and Differential Expression Genes (DEGs) Analysis
The transcriptome datasets GSE30122 and GSE96804 were downloaded from the Gene Expression Omnibus (GEO) database (https://www.ncbi.nlm.nih.gov/gds/). To reduce potential batch effects between datasets, the “SVA” R package was applied. Raw expression data were subsequently normalized using the “normalizeBetweenArrays” function from the limma R package to ensure comparability across samples. Gene symbol annotation for each dataset was performed according to the corresponding microarray platform using custom Perl scripts. Differential expression analysis between healthy control (HC) and diabetic nephropathy (DN) groups was conducted using the limma package, with significance thresholds set at adjusted p-value < 0.05 and fold change > 1.
Collection of Immune-Related Genes (IRGs)
The IRGs were collected from the IMMPORT database (https://www.immport.org/). A total of 2483 IRGs were collected for the next analysis (Supplementary Box 1). R package “limma” was used to extract the expression of IRGs from the GEO dataset.
Weighted Gene Co-Expression Network Analysis
Weighted gene co-expression network analysis (WGCNA) was performed using the “WGCNA” R package to identify modules of highly correlated genes. Initially, all samples were included to construct the network and detect potential outlier samples based on hierarchical clustering; any identified outliers were excluded from subsequent analysis. Next, the soft-thresholding power (β) was determined to achieve a scale-free topology, with a criterion of R² > 0.85. The adjacency matrix was then transformed into a topological overlap matrix (TOM) to measure gene connectivity. Gene modules were identified using the dynamic tree cut method, and similar modules were merged based on module eigengene correlation. Finally, correlation analysis was performed to evaluate the relationships between clinical traits and module eigengenes for HC and DN groups. Modules showing significant correlations with clinical features were considered for further analysis.
Machine Learning to Select Feature Diagnostic Biomarkers
We used multiple machine learning algorithms to identify the feature diagnostic biomarkers for DN. Firstly, the overlapping genes of WGCNA, DEGs and IRGs were defined as key differential expressed IRGs (DE-IRGs). The least absolute shrinkage and selection operator (LASSO) method was used to select the characteristic DE-IRGs via R package “glmnet”. A recursive feature elimination (RF) algorithm was adopted to calculate the importance of DE-IRGs via R package “randomForest”. In this study, an importance value > 2 was considered indicative of a feature diagnostic biomarker. Finally, the intersection genes of LASSO and RF algorithms was identified as diagnostic biomarkers for DN.
Functional Enrichment Analysis and Gene Set Enrichment Analysis (GSEA)
Differentially expressed immune-related genes (DE-IRGs) were subjected to functional enrichment analysis using the “clusterProfiler” R package. Gene Ontology (GO) enrichment analysis was performed to identify significantly overrepresented biological processes (BP), cellular components (CC), and molecular functions (MF). Kyoto Encyclopedia of Genes and Genomes (KEGG) pathway analysis was conducted to explore potential signaling pathways associated with DE-IRGs. In addition, Gene Set Enrichment Analysis (GSEA) was applied to compare the enrichment of KEGG pathways between HC and DN groups according to the “c2.cp.kegg.v7.4.symbols”. Pathways with a q-value (adjusted p-value) < 0.05 were considered statistically significant.
Diagnostic Ability Evaluation and Nomogram Construction
Based on the expression levels of the identified feature diagnostic biomarkers, a nomogram model was constructed to assess their diagnostic performance using the “rms” R package. The nomogram score for each sample was calculated using the following formula: HSPA1L x −6.13 + CCL19 x 0.171 + EDN1 x 2.766. The predictive accuracy of the nomogram model was evaluated by generating receiver operating characteristic (ROC) curves, and the area under the curve (AUC) was calculated to quantify the diagnostic power of each feature biomarker and the combined model.
Cell Culture
Human glomerular mesangial cells (HGMCs) were purchased from the American Type Culture Collection (ATCC) and maintained in RPMI-1640 medium with either normal glucose (NG, 5.5 mM D-glucose) or high glucose (HG, 25 mM D-glucose), supplemented with 10% fetal bovine serum. The cells were incubated at 37°C in an atmosphere of 5% CO2 and 95% air.
RNA Isolation and Quantitative Real-Time PCR (qRT-PCR)
The Total RNA was extracted from HGMCs using TRIzol regent (Invitrogen), and the PrimeScript RT reagent kit (Takara) was used to reverse transcribed to cDNA according to the manufacturer’s protocol. Quantitative real-time PCR was performed with SYBR Ex Taq (TaKaRa). The 2−ΔΔCq method was performed to determine the relative quantification of gene expression. All target genes examined were normalized against GAPDH.
Analysis of Immune Infiltration Landscape
The relative proportions of 22 immune cell types were estimated using the “CIBERSORT” algorithm via the “CIBERSORT” R package. Analyses were performed according to the CIBERSORT R script v1.03, employing the LM22 gene signature matrix to deconvolute the transcriptome data for each sample. The algorithm was run with 100 permutations to increase robustness of the results, and only samples with CIBERSORT p-value < 0.05 were included in downstream analyses. To assess the relationships between identified feature diagnostic biomarkers and immune cell infiltration, Spearman’s rank correlation analysis was performed in R, with adjust.p-value < 0.05 considered statistically significant.
Reagents
Antibodies for HSPA1L (ab154409), CCL19 (ab192871) and β-actin (ab8226) were purchased from Abcam. Antibody for EDN1 (12,191-1-AP) was purchased form Proteintech. A high-fat diet (HFD, 45% kcal from fat) and a high-sugar high-fat feed (12451M) was purchased from Boaigang Biotechnology Co., Ltd.
Type 2 Diabetes Mellitus Mouse Model Establishment
Male C57BL/6J mice (7–8 weeks old, SPF-grade) were housed under controlled conditions (temperature: 21–26°C, humidity: 40–70%, 12 h light/dark cycle) with free access to water. After 1 week of acclimatization, mice were randomly divided into control (Con) and model (DN) groups. The DN group was fed a high-fat diet (HFD) for 6 weeks to induce insulin resistance. Subsequently, a single intraperitoneal injection of streptozotocin (STZ) (100 mg/kg) was administered. After the injection, the mice continued to be fed the HFD until sample collection. Control mice received standard chow and equivalent citrate buffer injections. Fasting blood glucose (FBG) levels were measured weekly via tail vein blood sampling using a glucometer. Mice with FBG ≥11.2 mmol/L for three consecutive measurements were defined as successful T2DM models. At 7 weeks post-modeling, mice were euthanized under anesthesia. Bilateral kidneys were excised and weighed. The left kidney was longitudinally bisected: one half was fixed in 4% paraformaldehyde (PFA) for histopathology, and the other half was homogenized in RIPA lysis buffer for protein quantification.
Western Blot Analysis
Total protein was extracted from tissues using RIPA lysis buffer containing protease inhibitors. Protein concentrations were quantified via BCA assay. Equal amounts of protein were separated by 10% SDS-PAGE and transferred onto PVDF membranes. Membranes were blocked with 5% non-fat milk in TBST for 1 h at room temperature, followed by incubation with primary antibodies overnight at 4°C. The following antibodies were used: HSPA1L (1:1000), CCL19 (1:1000), EDN1 (1:1000), and β-actin (1:5000) as a loading control. After washing with TBST, membranes were incubated with HRP-conjugated secondary antibodies (1:5000) for 1 h at room temperature. Protein bands were visualized using ECL Prime Western Blotting Detection Reagent and quantified by ImageJ software.
Statistical Analysis
R software (version 3.6.0) and Perl scripts were used to deal with the raw data. GraphPad Prism (version 8.0.1) was used to visualize the boxplot of mRNA expression using the student’s t test. In addition, the statistics of the two groups were carried out using the Wilcoxon rank-sum test method if the data not conform to a normal distribution. A multiple testing correction method, controlling the false discovery rate (FDR), was applied to adjust the p-values, ensuring the exclusion of false positive and statistical significance was set at adjust. P-value < 0.05.
Results
Identification of DEGs and WGCNA Analysis
A total of 96 samples (46 HC samples and 50 DN samples) were collected from the GEO database. The raw data of each sample were normalized prior to differential expression analysis. We identified 353 down- and 209 up-regulated DEGs for further analysis (Figure 1A). We constructed a WGCNA co-expression network to select the key module genes for DN. The free-scale network was established with the soft power (β= 7, scale-free R2 > 0.85) and the module eigengenes were clustered with the height set at 0.25 (Figure 1B and C). Correlation analysis revealed no significant associations between the gene modules (Figure 1D). The cluster dendrogram result revealed that 12 modules were calculated, and the genes of each module were divided (Figure 1E). The correlation of clinical features and different modules was further calculated, and the result suggested that module purple was negatively correlated with HC (r = −0.55, p = 6e-09), but positively correlated with DN (r = 0.55, p = 6e-09); module blue was positively correlated with HC (r = 0.55, p = 5e-09), but negatively correlated with DN (r = −0.55, p = 5e-09) (Figure 1F). The module membership versus gene significance plot showed that the purple and blue modules were highly linked with DN and were selected for the next analysis (Figure 1G and H).
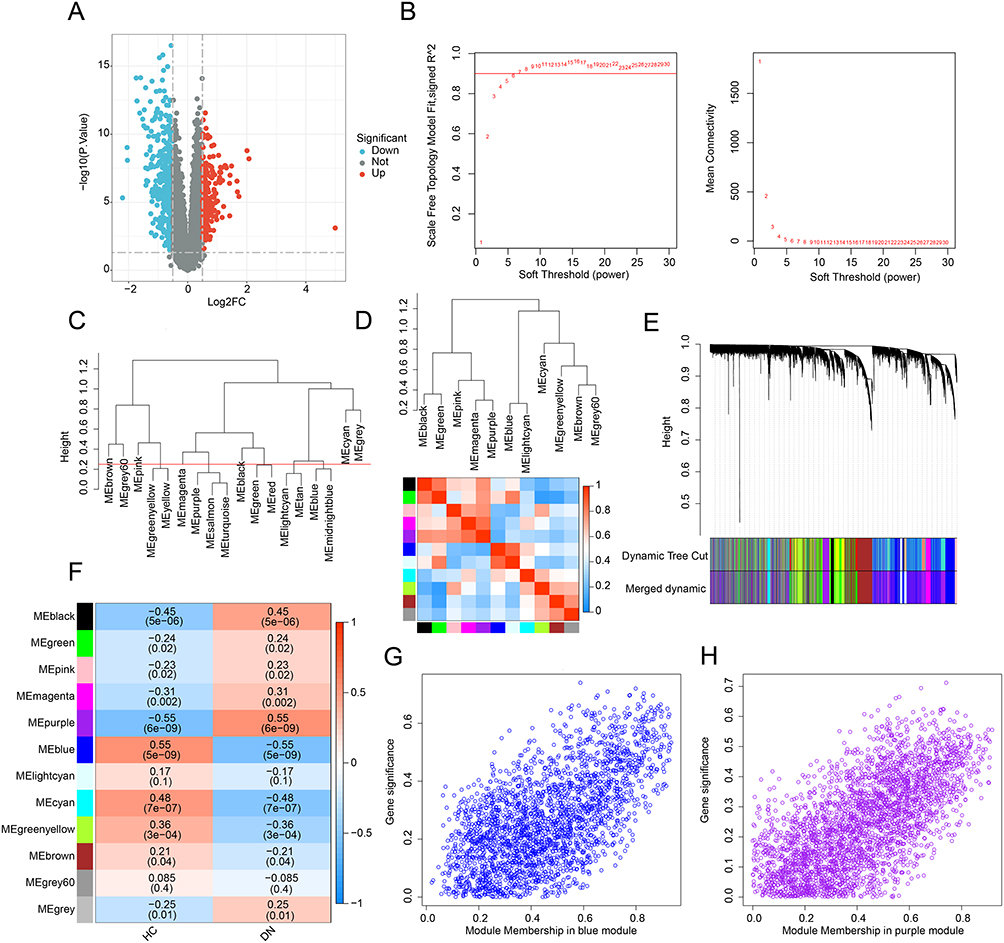 |
Figure 1 Differential expression gene analysis and WGCNA model development. (A) Identification of DEGs between HC and DN groups. Genes upregulated are shown in red, and genes downregulated are shown in blue. (B) Analysis of the scale-free network and mean connectivity for various soft-thresholding powers. (C) The clustering of module eigengenes. The clustering tree height was set to 0.25. (D) Correlation analysis of each module eigengene. Positive correlations are shown in red, and negative correlations are shown in blue. (E) Clustering dendrogram of different modules. (F) Heatmap shows the relationships of module-trait. Positive correlations are shown in red, and negative correlations are shown in blue. (G and H) The module membership vs gene significance in the blue and purple modules. |
Generation of the Pivotal DE-IRGs and Functional Enrichment Analysis
Utilizing the WGCNA and differential expression analysis, we obtained 50 pivotal DE-IRGs for the subsequent analysis (Figure 2A). The PPI network showed the potential interaction of the 50 pivotal DE-IRGs (Figure 2B). To further understand the potential molecular function of pivotal DE-IRGs in DN, GO and KEGG analysis were adopted. GO analysis results suggested the pivotal DE-IRGs were greatly enriched in cell chemotaxis, leukocyte chemotaxis, receptor ligand activity, and cytokine activity, which are closely related to immune related function (Figure 3A and B). KEGG analysis illustrated that cytokine-cytokine receptor interaction, viral protein interaction with cytokine and cytokine receptor, and chemokine signaling pathway were observably enriched of the DE-IRGs (Figure 2C and D).
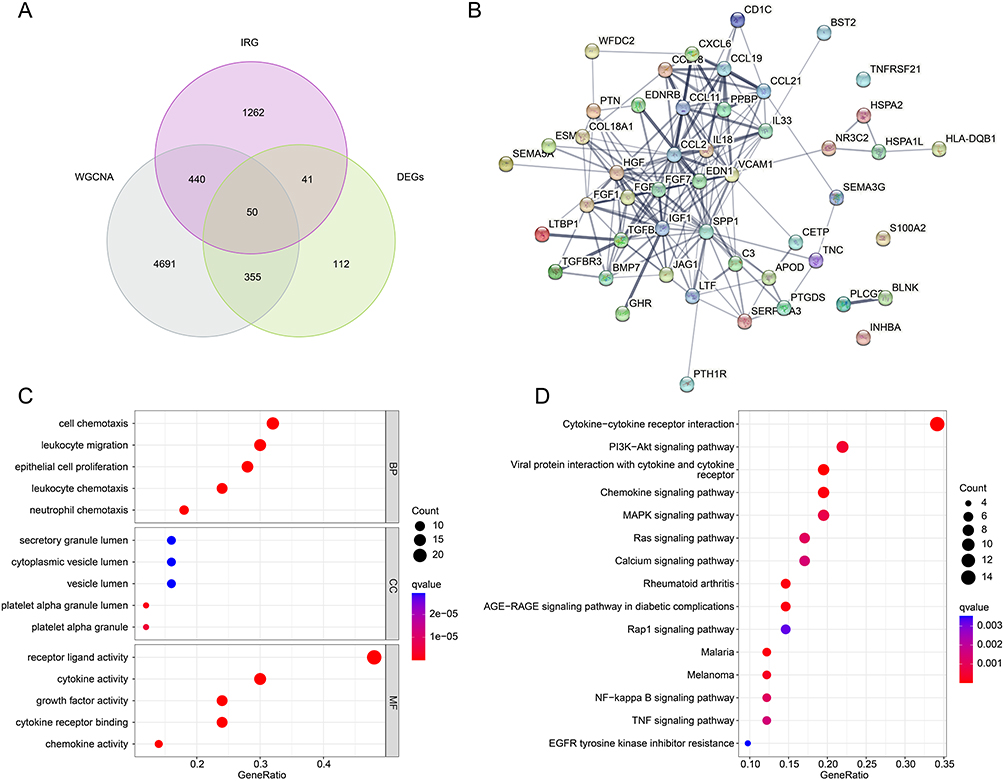 |
Figure 2 Generation of pivotal DE-IRGs and functional enrichment analysis. (A) Generation of pivotal DE-IRGs based on the WGCNA and differential expression analysis. (B) PPI inaction analysis. (C) GO enrichment analysis of the pivotal DE-IRGs (D) KEGG enrichment analysis of the pivotal DE-IRGs. |
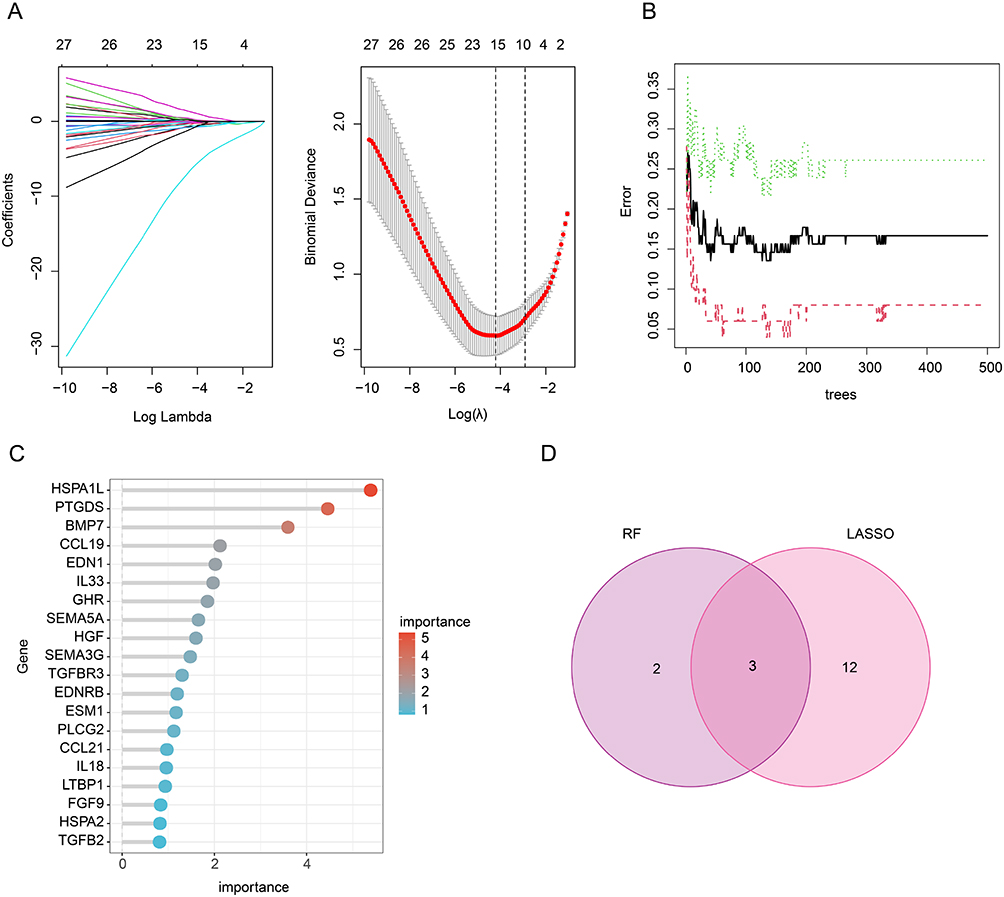 |
Figure 3 Identification of IRG related feature diagnostic biomarkers for DN. (A) LASSO model shows the optimal coefficients and lambda for DE-IRGs. (B and C) The RF algorithm shows the importance of DE-IRGs. (D) Venn diagram shows the intersection of diagnostic biomarkers selected by LASSO and RF algorithms. |
Identification of IRG Related Feature Diagnostic Biomarkers via Machine Learning
To identify the IRG related feature diagnostic biomarkers for DN, LASSO and RF algorithms were utilized. Under LASSO regression analysis, the model showed the optimal coefficients and minimum lambda, and 15 DE-IRGs were selected as IRG related feature diagnostic biomarkers (Figure 3A). According to the RF algorithm, 5 DE-IRGs were identified as IRG related feature diagnostic biomarkers for DN (Figure 3B and C). Based on LASSO and RF algorithms, 3 overlapping DE-IRGs were considered as IRG related feature diagnostic biomarkers for DN, including CCL9, EDN1, and HSPA1L (Figure 3D).
Analysis of Diagnostic Ability for IRG Related Feature Diagnostic Biomarkers
Based on the expression of CCL9, EDN1 and HSPA1L, a nomogram model was established to evaluate the diagnostic ability IRG related feature biomarkers for DN (Figure 4A). The AUCs of the ROC curves for CCL9, EDN1 and HSPA1L were 0.739, 0.831 and 0.913, respectively. Of note, the AUC of ROC curve for nomogram model was 0.939, which was higher than CCL9, EDN1 and HSPA1L, illustrating a satisfactory diagnostic power for DN (Figure 4B). The expression results showed that the DN samples had higher expression levels of EDN1, but lower expression levels of CCL9 and HSPA1L (Figure 4C–E).
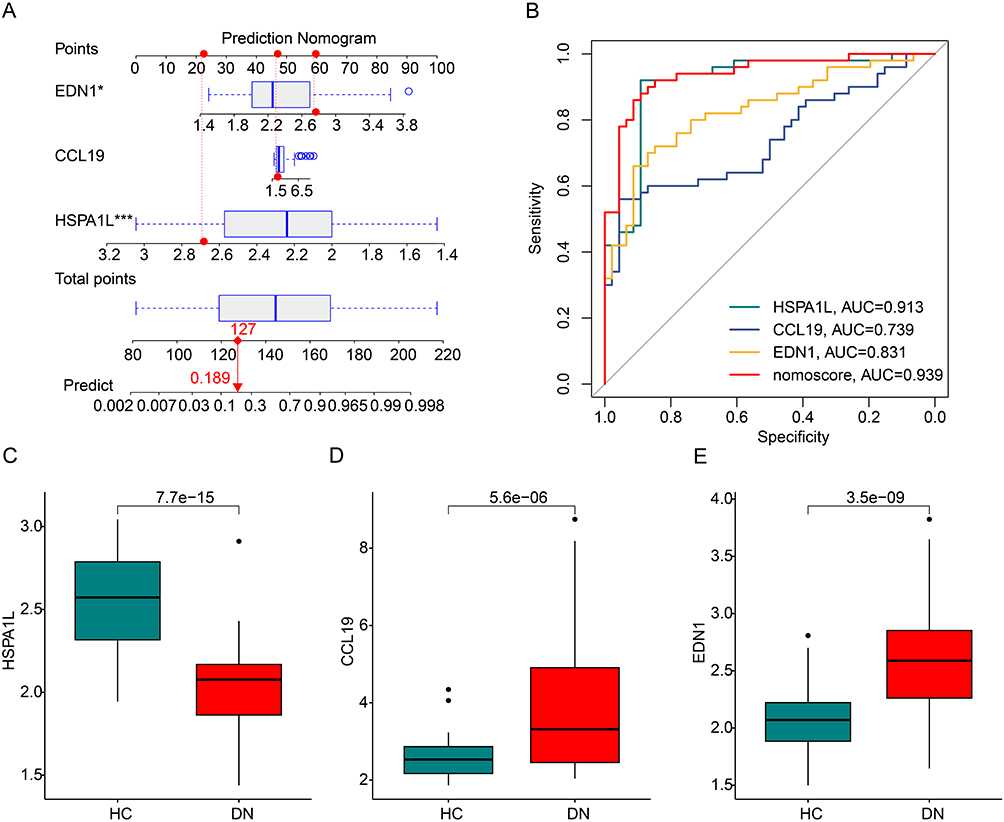 |
Figure 4 Evaluation of diagnostic value of IRGs biomarkers for DN. (A) Nomogram construction of IRG related feature diagnostic biomarkers in DN. The red dashed line represents the connection between the scores of each variable and the total score, while the red solid line represents the connection between the total score and the predicted prognosis probability. (B) The ROC curve shows the diagnostic efficacy of IRG related feature diagnostic biomarkers and nomogram model for DN. (C–E) The expression of the IRG-related feature diagnostic biomarkers in the HC and DN groups. *P<0.05; ***P<0.001. |
Immune Infiltration Characterization and GSEA Evaluation
As a comprehensive disease, DN involves a range of immune responses. GSEA analysis revealed that asthma, intestinal immune network for IgA production, primary immunodeficiency, systemic lupus erythematosus and toxoplasmosis were significantly enriched in DN group, whereas fatty acid elongation, glycosylphosphatidylinositol (GPI)-anchor biosynthesis, glyoxylate and dicarboxylate metabolism, histidine metabolism, and tryptophan metabolism were enriched in HC group (Figure 5A and B). In the subsequent analysis, we further evaluate the immune infiltration landscape of the HC and DN groups. With the calculation of 22 type immune cells via CIBERSORT algorithm, the relative percent of 22 immune cells for each sample was obtained (Figure 5C). The quantitative data suggested that the fraction of B cells naïve, T cells CD4 memory resting, NK cells resting, monocytes, dendritic cells resting, mast cells activated, and neutrophils was greatly higher in the HC group, but the fraction of B cells memory, plasma cells, T cells regulatory (Tregs), NK cells activated, macrophages M2, and mast cells resting was higher in DN patients (Figure 5D).
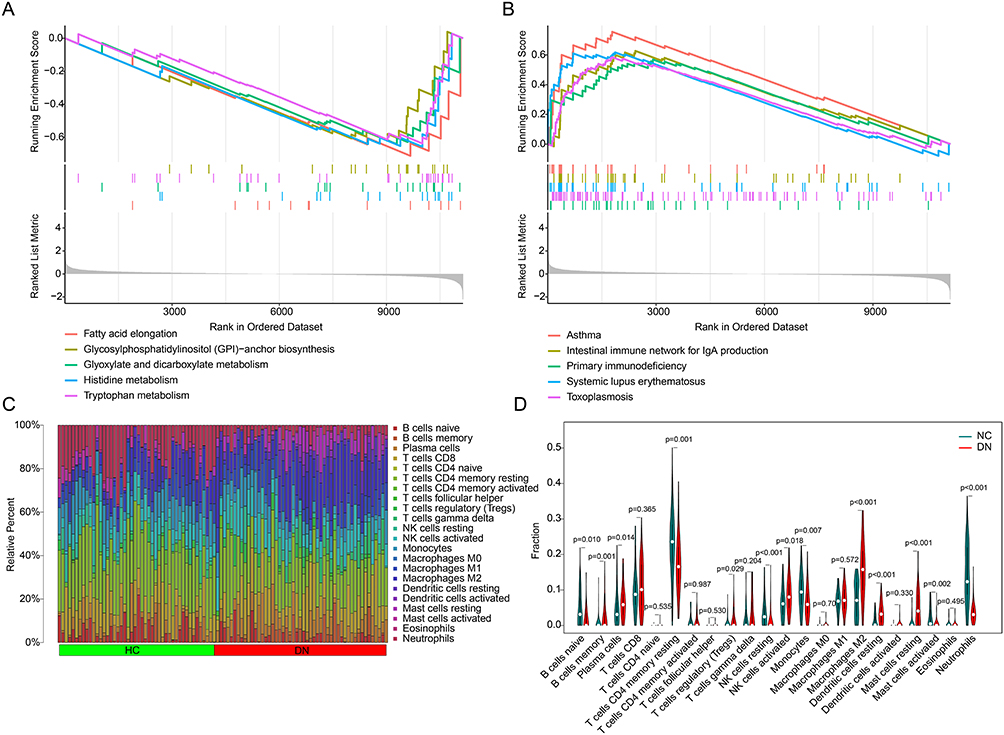 |
Figure 5 Immune infiltration landscape and GSEA analysis. (A and B) GSEA analysis of the DEGs between the HC and DN groups. (C) The bar plot shows the fraction of 22 immune cells obtained by CIBERSORT algorithm. (D) Violin plot shows the proportion of 22 immune cells in the HC and DN groups. |
Correlation Analysis of IRG Related Feature Diagnostic Biomarkers and Immune Infiltration Characterization
The relationship between IRG related feature diagnostic biomarkers and immune infiltration characterization was investigated in the subsequent analysis. As shown in Figure 6A, CCL19 was positively correlated with dendritic cells activated, T cells CD4 memory activated, B cells memory, mast cells resting, T cells gamma delta, dendritic cells resting and macrophages M2, but negatively related to neutrophils, NK cells resting, mast cells activated, monocytes, T cells CD4 memory resting and macrophages M0. EDN1 was positively related to dendritic cells activated, B cells memory, dendritic cells resting, T cells gamma delta, mast cells resting and macrophages M2, whereas negatively related to neutrophils, NK cells resting, T cells CD4 memory resting and B cells naive (Figure 6B). HSPA1L was positively correlated with B cells naïve, monocytes, T cells CD4 memory resting, mast cells activated, NK cells resting and neutrophils, but negatively related with macrophages M2, mast cells resting, dendritic cells resting, B cells memory, plasma cells and T cells gamma delta (Figure 6C). These results reveal that the IRG related feature diagnostic biomarkers are closely associated with immune infiltration characterization for DN.
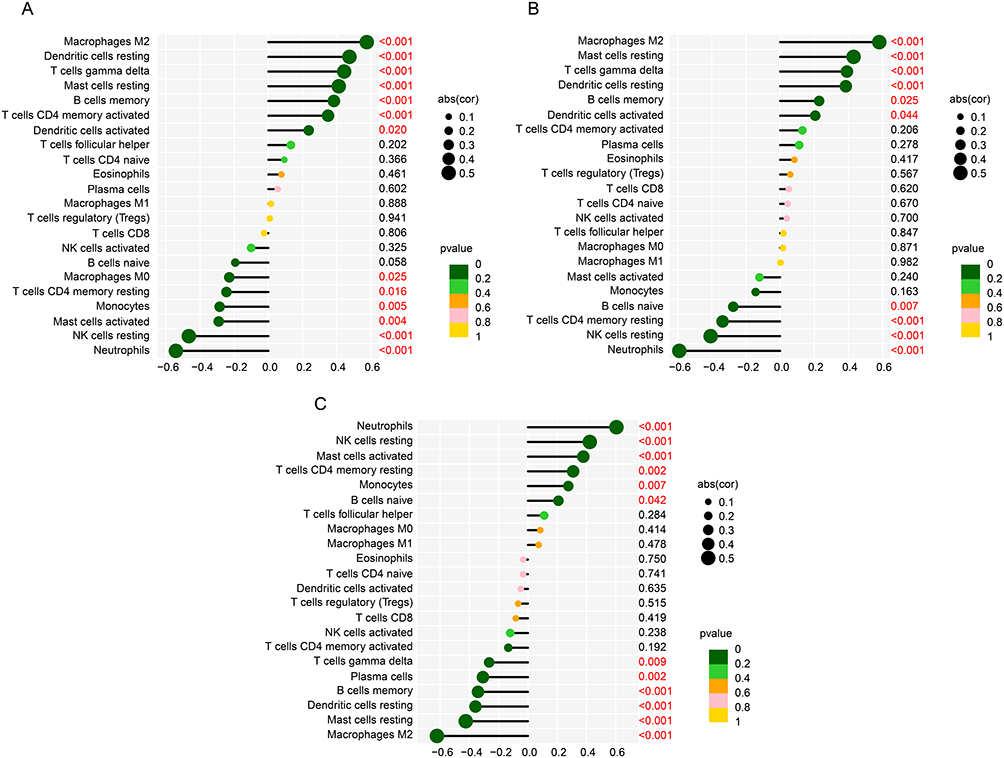 |
Figure 6 The association of IRG related feature diagnostic biomarkers and immune infiltration characterization. Correlation analysis of (A) CCL9, (B) EDN1 and (C) HSPA1L and 22 types of immune cells. Red indicates that the difference is statistically significant. |
In vitro Validation of IRG Related Feature Diagnostic Biomarkers
The expression of the IRG related feature diagnostic biomarkers (CCL9, EDN1 and HSPA1L) was further validated in the cell line model. The expression profiler of CCL19 and EDN1 in the CON group was greatly higher than DN group, whereas the expression profiler of HSPA1L in DN group was significantly higher than CON group (Figure 7A–C). Based on the expression of CCL19, EDN1 and HSPA1L, we developed a nomogram to evaluate the diagnostic ability for DN, and the AUC of nomogram model was 1.000, showing an optimal diagnostic ability of nomogram for DN (Figure 7D and E).
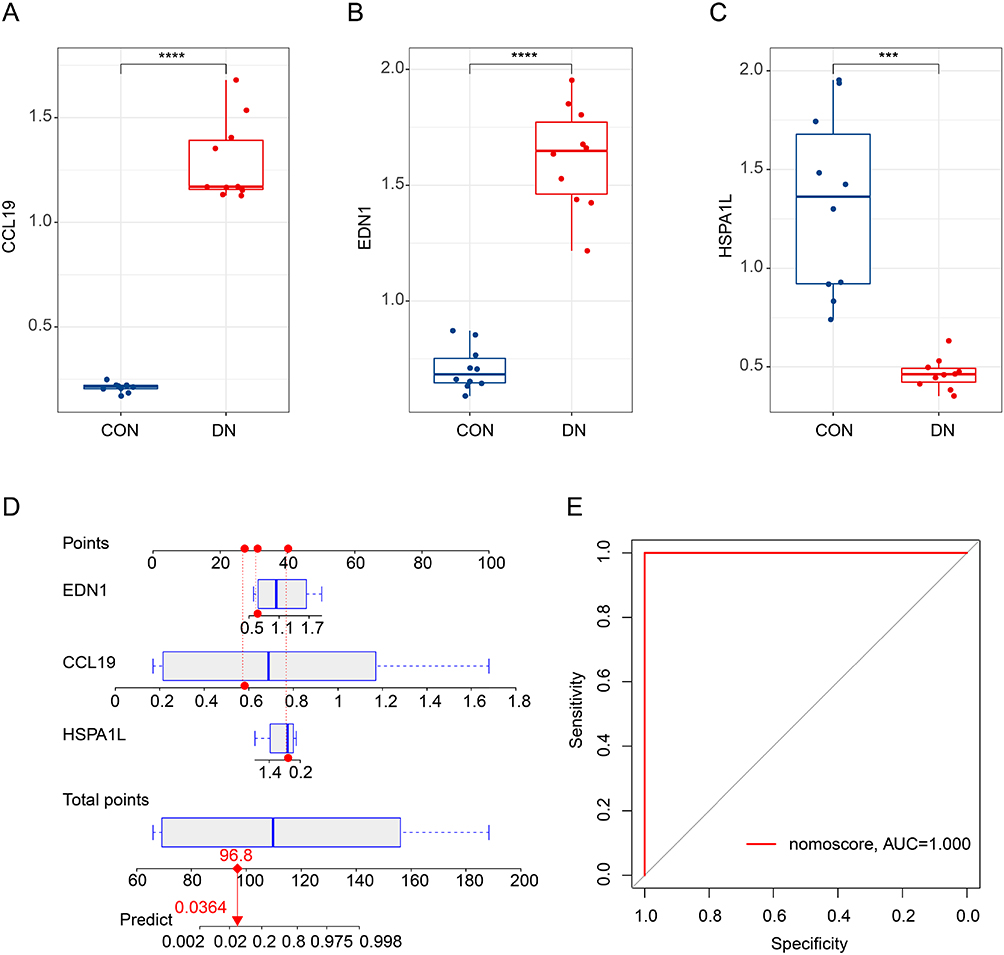 |
Figure 7 In vitro validation of IRGs related diagnostic biomarkers and nomogram model development. (A-C) qRT-PCR analysis of CCL9, EDN1 and HSPA1L in CON and DN cell line group. (D and E) Nomogram model development and diagnostic ability evaluation. The red dashed line represents the connection between the scores of each variable and the total score, while the red solid line represents the connection between the total score and the predicted prognosis probability. ***P<0.001; ****P<0.0001. |
Validation of Bioinformatics Findings in a T2DM Mouse Model of Diabetic Nephropathy
To validate the results of our bioinformatics analysis, a T2DM mouse model was established. Compared with the control (Con) group, the DN group showed no significant increase in body weight but exhibited markedly elevated blood glucose levels (Figure 8A and B). Moreover, both left and right kidney weights were significantly lower in the DN group compared to the Con group (Figure 8C and D). Hematoxylin and eosin (HE) staining revealed normal renal structure in the Con group, whereas the DN group displayed glomerular hypertrophy, mesangial expansion, thickening of the glomerular basement membrane (GBM), shrunken Bowman’s space, and interstitial inflammatory cell infiltration (Figure 8E). Masson’s trichrome staining further demonstrated prominent fibrotic changes in the kidneys of DN mice, including the accumulation of blue-stained fibers within the glomeruli and the presence of cord-like fibrosis (Figure 8F). Western blot analysis of kidney tissues showed that the expression levels of CCL19 and EDN1 were significantly upregulated in the DN group, while HSPA1L expression was markedly downregulated, consistent with the bioinformatics predictions (Figure 8G–J).
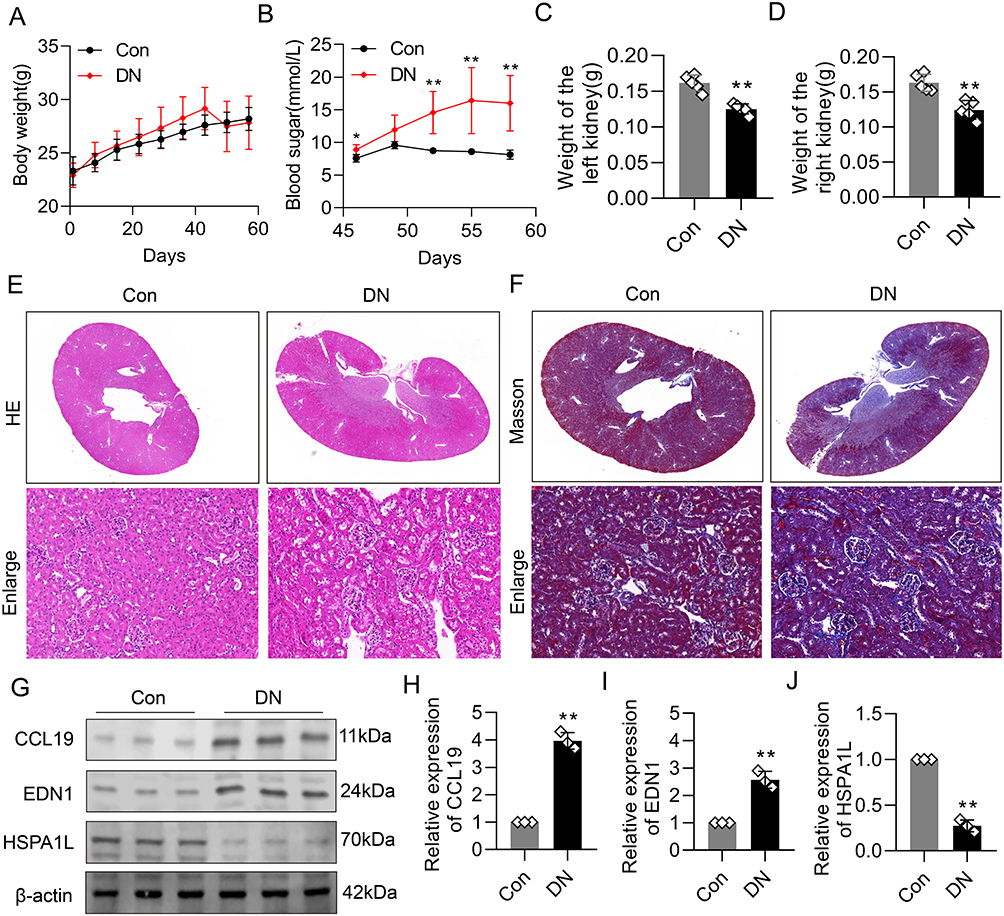 |
Figure 8 Validation of key protein expression in a T2DM mouse model. (A) Body weight of mice in the control and DN groups (n=5). (B) Fasting blood glucose levels in control and DN mice (n=5). (C and D) Kidney weight of the left (C) and right (D) kidneys in control and DN mice (n = 5). Compared to controls, DN mice exhibited significantly lower kidney weights. (E) Representative hematoxylin and eosin (HE) staining images of kidney tissues from each group (n=5). DN mice showed glomerular hypertrophy, mesangial expansion, thickened glomerular basement membrane (GBM), narrowed Bowman’s capsule space, and inflammatory cell infiltration in the renal interstitium. (F) Representative Masson’s trichrome staining of kidney tissues (n=5). Increased deposition of collagen fibers within glomeruli and interstitial areas was observed in DN mice, indicating marked renal fibrosis. (G–J) Western blot analysis of key proteins in kidney tissues (n=3). Compared to the control group, the DN group showed significant upregulation of CCL19 and EDN1 expression and downregulation of HSPA1L, consistent with bioinformatics predictions. **P<0.01. |
Discussion
In this study, we identified three IRGs potentially involved in the diagnosis of DN and explored their underlying mechanisms through immune cell infiltration profiling and functional enrichment analyses.
In our study, three diagnostic biomarkers including CCL9, EDN1 and HSPA1L were screened. CCL9, a chemokine belonging to the NC6 subfamily of CC-chemokines in mice, has been implicated in early-stage chronic kidney disease (CKD) due to its role in modulating immune cell recruitment.30 In CKD, pro-inflammatory mediators and white blood cells can promote organ damage.31 CCL9 expression is upregulated in the early stages of CKD.32 In addition, further mechanisms suggest that upregulated CCL9, by binding to ligands, can alleviate the accumulation of renal macrophages and monocytes and counteract renal inflammation and fibrosis.33 The macrophages at the site of diabetic kidney injury are mainly M1 phenotype.34 Proinflammatory M1 macrophages cause persistent kidney inflammation and damage.35 We observed a low level of CCL9 expression in DN. Although there is no relevant report of CCL9 in DN, the accumulation of macrophages in the kidney caused by lack of CCL9 may be one of the pathogenic causes of DN.
Genetic polymorphisms in EDN1 are strongly associated with DN and are considered key contributors to the fibrotic processes underlying DN progression.36,37 The EDN1 gene encodes the ET-1 protein and can cause persistent vasoconstriction.38 Circulating EDN1 was increased in diabetic patients and in mouse models of DN.39,40 EDN1 and its receptor mediate glomerular endothelial mitochondrial dysfunction through pathological crosstalk between activated podocytes and glomerular endothelial cells.41 Mitochondrial dysfunction of glomerular endothelial cells is one of the basic characteristics of diabetic nephropathy susceptibility.40 This provides a possible explanation for EDN1’s function in DN.
We observed a high expression level of HSPA1L in DN. Members of the heat shock protein 70 (HSP70) family, to which HSPA1L belongs, are generally known to promote DN progression by inducing Th17/Treg imbalance and activating downstream inflammatory pathways.42–44 However, the specific function and transcriptional regulation of HSPA1L itself remain incompletely understood,45,46 although recent evidence has highlighted its involvement in DN-related stress responses.47 Contrary to the general pro-disease role of other HSP70 members, most studies suggest that the upregulation of HSPA1L in DN may represent a compensatory, protective response aimed at enhancing mitophagy and maintaining mitochondrial function.48 For instance, in proximal tubular cells, HSPA1L forms a complex with other components that mitigates inflammasome activation and confers cellular protection. It is noteworthy that the extracellular release of HSPA1L has been identified as a critical step contributing to organelle dysfunction in DN.49 T Furthermore, evidence has shown that crotonylation-mediated regulation of HSPA1L can mitigate hypertensive nephropathy and alleviate oxidative stress by enhancing mitophagy.50 Given the well-established protective role of mitophagy in DN development,51–53 the specific protective mechanisms mediated by HSPA1L warrant further investigation.
Although M2 macrophages were found to be elevated in the DN immune microenvironment, their role in DN pathogenesis remains controversial. It has been reported that the transformation of macrophages to the M2 phenotype can protect the kidneys and ameliorate DN symptoms.54 However, it has also been reported that the anti-inflammatory M2 macrophages can accelerate the development of CKD by promoting the process of renal fibrosis.55,56 Reprogramming macrophages toward an M1-like phenotype has been reported to attenuate DN progression in certain contexts.57 In addition, correlation analysis with immune cell components showed that low expression of CCL9 and EDN1 in DN patients was significantly positively correlated with M2 macrophages, while high expression of HSPA1L in DN was negatively correlated with M2 macrophages. These findings imply that reduced M2 macrophage levels may be associated with DN and could have diagnostic relevance, although further investigation is warranted. In fact, the ratio of M2 to M1 macrophages changes dynamically with the pathological progression of DN.58 In the future, it may be necessary to conduct a more accurate analysis of the polarization level of macrophages at various stages in the development of DN, so as to better explore the diagnostic value and therapeutic significance of macrophages.
This study has several limitations that should be acknowledged. First, although the differential expression of HSPA1L in DN was identified through bioinformatic analysis and preliminarily verified in vivo, its precise functional role and molecular mechanisms remain unexplored. The lack of mechanistic experiments limits a deeper understanding of its biological significance in DN. Second, during the model evaluation process, no cross-validation or independent external test set was used to assess the robustness and generalizability of the diagnostic biomarkers, which may affect the reliability of the model in real clinical applications. Furthermore, all analyses were based on transcriptomic data from public databases. The absence of validation in independent clinical cohorts or real-world samples hinders confirmation of the diagnostic utility of these biomarkers in practical settings. Finally, immune infiltration analysis relied entirely on computational algorithms without experimental validation, such as flow cytometry, to directly quantify immune cell proportions, which weakens the reliability and interpretability of the immune landscape. Future studies should incorporate multi-center clinical validations with larger sample sizes and combine functional experiments to further elucidate the mechanistic roles of these candidate genes in the pathogenesis of DN.
Conclusions
We systematically explored the impact of IRGs on DN using integrated bioinformatics and in vivo experimental approaches, and identified several candidate IRGs that may serve as potential diagnostic biomarkers or therapeutic targets. These findings contribute to a deeper understanding of the immunogenomic landscape underlying DN pathogenesis.
Data Sharing Statement
The data and materials used in the current study are available from the corresponding authors Mei Yang upon reasonable request. The datasets (GSE30122 and GSE96804) presented in this study can be found in the Gene Expression Omnibus (GEO) database (https://www.ncbi.nlm.nih.gov/gds/).
Ethical Statement
This study involving human data received ethical approval from the Ethics Committee of the People’s Hospital of Chongqing Liang Jiang New Area. The animal experiments were conducted in accordance with the guidelines of the Animal Research: Reporting of In Vivo Experiments (ARRIVE) and were approved by the Laboratory Animal Welfare and Ethics Committee of the People’s Hospital of Chongqing Liang Jiang New Area.
Author Contributions
All authors made a significant contribution to the work reported, whether that is in the conception, study design, execution, acquisition of data, analysis and interpretation, or in all these areas; took part in drafting, revising or critically reviewing the article; gave final approval of the version to be published; have agreed on the journal to which the article has been submitted; and agree to be accountable for all aspects of the work.
Funding
This study was supported by the First Batch of Key Disciplines on Public Health in Chongqing, the Natural Science Foundation of Chongqing (NO. CSTB2024NSCQ-MSX0320), the Chongqing Medical Young Talents Program (NO. YXQN202541) and the Postdoctoral Science Foundation General Funding Program of China (NO. 2024MD754010).
Disclosure
The authors report no conflicts of interest in this work.
References
1. Zhou B, Lu Y, Hajifathalian K; Collaboration, N.C.D.R.F. Worldwide trends in diabetes since 1980: a pooled analysis of 751 population-based studies with 4.4 million participants. Lancet. 2016;387(10027):1513–1530. doi:10.1016/S0140-6736(16)00618-8
2. Zimmet PZ, Magliano DJ, Herman WH, Shaw JE. Diabetes: a 21st century challenge. Lancet Diabetes Endocrinol. 2014;2(1):56–64. doi:10.1016/S2213-8587(13)70112-8
3. Alicic RZ, Rooney MT, Tuttle KR. Diabetic kidney disease: challenges, progress, and possibilities. Clin J Am Soc Nephrol. 2017;12(12):2032–2045. doi:10.2215/CJN.11491116
4. Jones CA, Krolewski AS, Rogus J, Xue JL, Collins A, Warram JH. Epidemic of end-stage renal disease in people with diabetes in the United States population: do we know the cause? Kidney Int. 2005;67(5):1684–1691. doi:10.1111/j.1523-1755.2005.00265.x
5. Gregg EW, Li Y, Wang J, et al. Changes in diabetes-related complications in the United States, 1990-2010. N Engl J Med. 2014;370(16):1514–1523. doi:10.1056/NEJMoa1310799
6. Ni WJ, Tang LQ, Wei W. Research progress in signalling pathway in diabetic nephropathy. Diabetes Metab Res Rev. 2015;31(3):221–233. doi:10.1002/dmrr.2568
7. Tanaka S, Sugiura Y, Saito H, et al. Sodium-glucose cotransporter 2 inhibition normalizes glucose metabolism and suppresses oxidative stress in the kidneys of diabetic mice. Kidney Int. 2018;94(5):912–925. doi:10.1016/j.kint.2018.04.025
8. Reidy K, Kang HM, Hostetter T, Susztak K. Molecular mechanisms of diabetic kidney disease. J Clin Invest. 2014;124(6):2333–2340. doi:10.1172/JCI72271
9. Kato M, Natarajan R. Diabetic nephropathy--emerging epigenetic mechanisms. Nat Rev Nephrol. 2014;10(9):517–530. doi:10.1038/nrneph.2014.116
10. Hojs R, Ekart R, Bevc S, Hojs N. Biomarkers of renal disease and progression in patients with diabetes. J Clin Med. 2015;4(5):1010–1024. doi:10.3390/jcm4051010
11. Tang SCW, Yiu WH. Innate immunity in diabetic kidney disease. Nat Rev Nephrol. 2020;16(4):206–222. doi:10.1038/s41581-019-0234-4
12. Tesch GH. Diabetic nephropathy - is this an immune disorder? Clin Sci. 2017;131(16):2183–2199. doi:10.1042/CS20160636
13. Akira S, Uematsu S, Takeuchi O. Pathogen recognition and innate immunity. Cell. 2006;124(4):783–801. doi:10.1016/j.cell.2006.02.015
14. Kanwar YS, Sun L, Xie P, Liu FY, Chen S. A glimpse of various pathogenetic mechanisms of diabetic nephropathy. Annu Rev Pathol. 2011;6:395–423. doi:10.1146/annurev.pathol.4.110807.092150
15. Flyvbjerg A. The role of the complement system in diabetic nephropathy. Nat Rev Nephrol. 2017;13(5):311–318. doi:10.1038/nrneph.2017.31
16. Chow F, Ozols E, Nikolic-Paterson DJ, Atkins RC, Tesch GH. Macrophages in mouse type 2 diabetic nephropathy: correlation with diabetic state and progressive renal injury. Kidney Int. 2004;65(1):116–128. doi:10.1111/j.1523-1755.2004.00367.x
17. Beissert S, Schwarz A, Schwarz T. Regulatory T cells. J Invest Dermatol. 2006;126(1):15–24. doi:10.1038/sj.jid.5700004
18. Bilate AM, Lafaille JJ. Induced CD4+Foxp3+ regulatory T cells in immune tolerance. Annu Rev Immunol. 2012;30:733–758. doi:10.1146/annurev-immunol-020711-075043
19. Zheng Z, Zheng F. Immune cells and inflammation in diabetic nephropathy. J Diabetes Res. 2016;2016:1841690. doi:10.1155/2016/1841690
20. Hou G, Dong Y, Jiang Y, et al. Immune inflammation and metabolic interactions in the pathogenesis of diabetic nephropathy. Front Endocrinol. 2025;16:1602594. doi:10.3389/fendo.2025.1602594
21. Ma L, Liu D, Yu Y, Li Z, Wang Q. Immune-mediated renal injury in diabetic kidney disease: from mechanisms to therapy. Front Immunol. 2025;16:1587806. doi:10.3389/fimmu.2025.1587806
22. Wang J, Shi H, Yang Y, Gong X. Crosstalk between ferroptosis and innate immune in diabetic kidney disease: mechanisms and therapeutic implications. Front Immunol. 2025;16:1505794. doi:10.3389/fimmu.2025.1505794
23. Chen J, Liu Q, He J, Li Y. Immune responses in diabetic nephropathy: pathogenic mechanisms and therapeutic target. Front Immunol. 2022;13:958790. doi:10.3389/fimmu.2022.958790
24. Sun Y, Dai W, He W. Identification of key immune-related genes and immune infiltration in diabetic nephropathy based on machine learning algorithms. IET Syst Biol. 2023;17(3):95–106. doi:10.1049/syb2.12061
25. Deng J, Wu P. Integrated bioinformatics analysis and in vivo validation of potential immune-related genes linked to diabetic nephropathy. Heliyon. 2024;10(21):e40151. doi:10.1016/j.heliyon.2024.e40151
26. Zhang Y, Lu S, Dong Y, Shang J. Unveiling the impact of bisphenol a exposure on gene expression and immune response in diabetic nephropathy through integrative toxicogenomics and molecular dynamics approaches. Diabetol Metab Syndr. 2025;17(1):340. doi:10.1186/s13098-025-01874-7
27. Zhao H, Guo J. Macrophages in focus: key drivers and therapeutic opportunities in diabetic kidney disease. Int J Biol Sci. 2025;21(10):4647–4662. doi:10.7150/ijbs.112737
28. Saliba A, Du Y, Feng T, Garmire L. Multi-omics integration in nephrology: advances, challenges, and future directions. Semin Nephrol. 2024;44(6):151584. doi:10.1016/j.semnephrol.2025.151584
29. Singh A, Bocher O, Zeggini E. Insights into the molecular underpinning of type 2 diabetes complications. Hum Mol Genet. 2025;34(6):469–480. doi:10.1093/hmg/ddae203
30. Ravindran C, Cheng YC, Liang SM. CpG-ODNs induces up-regulated expression of chemokine CCL9 in mouse macrophages and microglia. Cell Immunol. 2010;260(2):113–118. doi:10.1016/j.cellimm.2009.10.001
31. Wynn TA, Ramalingam TR. Mechanisms of fibrosis: therapeutic translation for fibrotic disease. Nat Med. 2012;18(7):1028–1040. doi:10.1038/nm.2807
32. Berahovich RD, Miao Z, Wang Y, Premack B, Howard MC, Schall TJ. Proteolytic activation of alternative CCR1 ligands in inflammation. J Immunol. 2005;174(11):7341–7351. doi:10.4049/jimmunol.174.11.7341
33. Hemmers C, Schulte C, Wollenhaupt J, et al. Chemokine CCL9 is upregulated early in chronic kidney disease and counteracts kidney inflammation and fibrosis. Biomedicines. 2022;10(2):420. doi:10.3390/biomedicines10020420
34. Calle P, Hotter G. Macrophage phenotype and fibrosis in diabetic nephropathy. Int J Mol Sci. 2020;21(8):2806. doi:10.3390/ijms21082806
35. Wang X, Chen J, Xu J, Xie J, Harris DCH, Zheng G. The role of macrophages in kidney fibrosis. Front Physiol. 2021;12:705838. doi:10.3389/fphys.2021.705838
36. Tziastoudi M, Stefanidis I, Zintzaras E. The genetic map of diabetic nephropathy: evidence from a systematic review and meta-analysis of genetic association studies. Clin Kidney J. 2020;13(5):768–781. doi:10.1093/ckj/sfaa077
37. Tziastoudi M, Theoharides TC, Nikolaou E, Efthymiadi M, Eleftheriadis T, Stefanidis I. Key genetic components of fibrosis in diabetic nephropathy: an updated systematic review and meta-analysis. Int J Mol Sci. 2022;23(23):15331. doi:10.3390/ijms232315331
38. Yanagisawa M, Kurihara H, Kimura S, et al. A novel potent vasoconstrictor peptide produced by vascular endothelial cells. Nature. 1988;332(6163):411–415. doi:10.1038/332411a0
39. Kush RD, Hallett MD, Ota K, et al. Long-term continuous ambulatory peritoneal dialysis. Mass transfer and nutritional and metabolic stability. Blood Purif. 1990;8(1):1–13. doi:10.1159/000169919
40. Qi H, Casalena G, Shi S, et al. Glomerular endothelial mitochondrial dysfunction is essential and characteristic of diabetic kidney disease susceptibility. Diabetes. 2017;66(3):763–778. doi:10.2337/db16-0695
41. Ebefors K, Wiener RJ, Yu L, et al. Endothelin receptor-A mediates degradation of the glomerular endothelial surface layer via pathologic crosstalk between activated podocytes and glomerular endothelial cells. Kidney Int. 2019;96(4):957–970. doi:10.1016/j.kint.2019.05.007
42. Jayashree K, Senthilkumar GP, Parameswaran S, Vadivelan M. Association of elevated extracellular HSP72 in albuminuria with systemic inflammation and disease progression in type 2 diabetic kidney disease. Clin Biochem. 2023;121-122:110682. doi:10.1016/j.clinbiochem.2023.110682
43. Jheng HF, Tsai PJ, Chuang YL, et al. Albumin stimulates renal tubular inflammation through an HSP70-TLR4 axis in mice with early diabetic nephropathy. Dis Model Mech. 2015;8(10):1311–1321. doi:10.1242/dmm.019398
44. Lazaro I, Oguiza A, Recio C, et al. Targeting HSP90 ameliorates nephropathy and atherosclerosis through suppression of NF-kappaB and STAT signaling pathways in diabetic mice. Diabetes. 2015;64(10):3600–3613. doi:10.2337/db14-1926
45. Yan Y, Xu J, Chen Z, et al. Heat shock protein A1L restricts influenza A virus by ubiquitination of NA. J Virol. 2025;99(9):e0077125. doi:10.1128/jvi.00771-25
46. Zhao W, Zhao B, Meng X, et al. The regulation of MFG-E8 on the mitophagy in diabetic sarcopenia via the HSPA1L-Parkin pathway and the effect of D-pinitol. J Cachexia Sarcopenia Muscle. 2024;15(3):934–948. doi:10.1002/jcsm.13459
47. Daugaard M, Rohde M, Jaattela M. The heat shock protein 70 family: highly homologous proteins with overlapping and distinct functions. FEBS Lett. 2007;581(19):3702–3710. doi:10.1016/j.febslet.2007.05.039
48. Lee JH, Yoon YM, Song KH, Noh H, Lee SH. Melatonin suppresses senescence-derived mitochondrial dysfunction in mesenchymal stem cells via the HSPA1L-mitophagy pathway. Aging Cell. 2020;19(3):e13111. doi:10.1111/acel.13111
49. Nakatsuka A, Yamaguchi S, Eguchi J, et al. A Vaspin-HSPA1L complex protects proximal tubular cells from organelle stress in diabetic kidney disease. Commun Biol. 2021;4(1):373. doi:10.1038/s42003-021-01902-y
50. Wu Q, Fu J, Zhu B, et al. VEGFR3 mitigates hypertensive nephropathy by enhancing mitophagy via regulating crotonylation of HSPA1L. Cell Commun Signal. 2025;23(1):52. doi:10.1186/s12964-025-02045-x
51. Frey BM, Shenas F, Boutitie F, et al. Intravenous thrombolysis in patients with white matter hyperintensities in the WAKE-UP trial. Stroke. 2023;54(7):1718–1725. doi:10.1161/STROKEAHA.122.040247
52. Sun J, Guan X, Niu C, et al. FGF13-sensitive alteration of parkin safeguards mitochondrial homeostasis in endothelium of diabetic nephropathy. Diabetes. 2023;72(1):97–111. doi:10.2337/db22-0231
53. Yang M, Li C, Yang S, et al. Mitophagy: a Novel Therapeutic Target for Treating DN. Curr Med Chem. 2021;28(14):2717–2728. doi:10.2174/0929867327666201006152656
54. Mohamed R, Jayakumar C, Chen F, et al. Low-dose IL-17 therapy prevents and reverses diabetic nephropathy, metabolic syndrome, and associated organ fibrosis. J Am Soc Nephrol. 2016;27(3):745–765. doi:10.1681/ASN.2014111136
55. Shen B, Liu X, Fan Y, Qiu J. Macrophages regulate renal fibrosis through modulating TGFbeta superfamily signaling. Inflammation. 2014;37(6):2076–2084. doi:10.1007/s10753-014-9941-y
56. Yang Q, Wang Y, Pei G, et al. Bone marrow-derived Ly6C(-) macrophages promote ischemia-induced chronic kidney disease. Cell Death Dis. 2019;10(4):291. doi:10.1038/s41419-019-1531-3
57. Cucak H, Nielsen Fink L, Hojgaard Pedersen M, Rosendahl A. Enalapril treatment increases T cell number and promotes polarization towards M1-like macrophages locally in diabetic nephropathy. Int Immunopharmacol. 2015;25(1):30–42. doi:10.1016/j.intimp.2015.01.003
58. Yan J, Li X, Liu N, He JC, Zhong Y. Relationship between macrophages and tissue microenvironments in diabetic kidneys. Biomedicines. 2023;11(7):1889. doi:10.3390/biomedicines11071889
 © 2025 The Author(s). This work is published and licensed by Dove Medical Press Limited. The
full terms of this license are available at https://www.dovepress.com/terms
and incorporate the Creative Commons Attribution
- Non Commercial (unported, 4.0) License.
By accessing the work you hereby accept the Terms. Non-commercial uses of the work are permitted
without any further permission from Dove Medical Press Limited, provided the work is properly
attributed. For permission for commercial use of this work, please see paragraphs 4.2 and 5 of our Terms.
© 2025 The Author(s). This work is published and licensed by Dove Medical Press Limited. The
full terms of this license are available at https://www.dovepress.com/terms
and incorporate the Creative Commons Attribution
- Non Commercial (unported, 4.0) License.
By accessing the work you hereby accept the Terms. Non-commercial uses of the work are permitted
without any further permission from Dove Medical Press Limited, provided the work is properly
attributed. For permission for commercial use of this work, please see paragraphs 4.2 and 5 of our Terms.
Recommended articles
Integrated Analysis of Single-Cell RNA-Seq and Bulk RNA-Seq Combined with Multiple Machine Learning Identified a Novel Immune Signature in Diabetic Nephropathy
Peng YL, Zhang Y, Pang L, Dong YF, Li MY, Liao H, Li RS
Diabetes, Metabolic Syndrome and Obesity 2023, 16:1669-1684
Published Date: 7 June 2023
Immune Cell Infiltration Analysis Based on Bioinformatics Reveals Novel Biomarkers of Coronary Artery Disease
He T, Muhetaer M, Wu J, Wan J, Hu Y, Zhang T, Wang Y, Wang Q, Cai H, Lu Z
Journal of Inflammation Research 2023, 16:3169-3184
Published Date: 26 July 2023
Analysis and Validation of Critical Signatures and Immune Cell Infiltration Characteristics in Doxorubicin-Induced Cardiotoxicity by Integrating Bioinformatics and Machine Learning
Huang C, Pei J, Li D, Liu T, Li Z, Zhang G, Chen R, Xu X, Li B, Lian Z, Chu XM
Journal of Inflammation Research 2024, 17:669-685
Published Date: 2 February 2024
Cuproptosis-Related Biomarkers and Characterization of Immune Infiltration in Sepsis
Wang Y, Qiu X, Liu J, Liu X, Pan J, Cai J, Liu X, Qu S
Journal of Inflammation Research 2024, 17:2459-2478
Published Date: 22 April 2024
Machine Learning-Based Predictive Modeling of Diabetic Nephropathy in Type 2 Diabetes Using Integrated Biomarkers: A Single-Center Retrospective Study
Zhu Y, Zhang Y, Yang M, Tang N, Liu L, Wu J, Yang Y
Diabetes, Metabolic Syndrome and Obesity 2024, 17:1987-1997
Published Date: 10 May 2024