Back to Journals » Diabetes, Metabolic Syndrome and Obesity » Volume 16
Integrated Analysis of Single-Cell RNA-Seq and Bulk RNA-Seq Combined with Multiple Machine Learning Identified a Novel Immune Signature in Diabetic Nephropathy
Authors Peng YL, Zhang Y, Pang L, Dong YF, Li MY, Liao H ![]() , Li RS
, Li RS
Received 12 April 2023
Accepted for publication 31 May 2023
Published 7 June 2023 Volume 2023:16 Pages 1669—1684
DOI https://doi.org/10.2147/DMSO.S413569
Checked for plagiarism Yes
Review by Single anonymous peer review
Peer reviewer comments 3
Editor who approved publication: Prof. Dr. Juei-Tang Cheng
Yue-Ling Peng,1 Yan Zhang,1 Lin Pang,2 Ya-Fang Dong,3 Mu-Ye Li,4 Hui Liao,5 Rong-Shan Li1
1Department of Nephrology, Shanxi Provincial People’s Hospital (Fifth Hospital of Shanxi Medical University), Taiyuan, People’s Republic of China; 2Department of Health Statistics, School of Public Health, Shanxi Medical University, Taiyuan, People’s Republic of China; 3Department of Pathology and Pathophysiology, School of Basic Medicine, Shanxi Medical University, Taiyuan, People’s Republic of China; 4Department of Ocular Fundus Diseases, Shanxi Eye Hospital, Shanxi Medical University, Taiyuan, People’s Republic of China; 5Drug Clinical Trial Institution, Shanxi Provincial People’s Hospital (Fifth Hospital of Shanxi Medical University), Taiyuan, People’s Republic of China
Correspondence: Rong-Shan Li, Department of Nephrology, Shanxi Provincial People’s Hospital (Fifth Hospital of Shanxi Medical University), Taiyuan, People’s Republic of China, Email [email protected]
Background: Increasing evidence suggests that immune modulation contributes to the pathogenesis and progression of diabetic nephropathy (DN). However, the role of immune modulation in DN has not been elucidated. The purpose of this study was to search for potential immune-related therapeutic targets and molecular mechanisms of DN.
Methods: Gene expression datasets were obtained from the Gene Expression Omnibus (GEO) database. A total of 1793 immune-related genes were acquired from the Immunology Database and Analysis Portal (ImmPort). Weighted gene co-expression network analysis (WGCNA) was performed for GSE142025, and the red and turquoise co-expression modules were found to be key for DN progression. We utilized four machine learning algorithms, namely, random forest (RF), support vector machine (SVM), adaptive boosting (AdaBoost), and k-nearest neighbor (KNN), to evaluate the diagnostic value of hub genes. Immune infiltration patterns were analyzed using the CIBERSORT algorithm, and the correlation between immune cell type abundance and hub gene expression was also investigated.
Results: A total of 77 immune-related genes of advanced DN were selected for subsequent analyzes. Functional enrichment analysis showed that the regulation of cytokine–cytokine receptor interactions and immune cell function play a corresponding role in the progression of DN. The final 10 hub genes were identified through multiple datasets. In addition, the expression levels of the identified hub genes were corroborated through a rat model. The RF model exhibited the highest AUC. CIBERSORT analysis and single-cell sequencing analysis revealed changes in immune infiltration patterns between control subjects and DN patients. Several potential drugs to reverse the altered hub genes were identified through the Drug-Gene Interaction database (DGIdb).
Conclusion: This pioneering work provided a novel immunological perspective on the progression of DN, identifying key immune-related genes and potential drug targets, thus stimulating future mechanistic research and therapeutic target identification for DN.
Keywords: diabetic nephropathy, machine learning, single cell, cell-to-cell communication, immune therapy
Corrigendum for this paper has been published.
Introduction
Diabetic nephropathy (DN) is characterized by early glomerular hypertrophy, glomerular basement membrane thickening, podocyte injury, mesangial stromal dilation, and tubular injury, with later glomerulosclerosis and tubulointerstitial fibrosis, and has emerged as the leading cause of end-stage renal disease (ESRD) worldwide.1 Although traditional standard treatments, including strict blood sugar and blood pressure control, have been used in DN treatment, their effectiveness in delaying DN exacerbation is still disappointing.2 Considering the enormous economic and social burden of DN, there is an urgent need to identify new therapeutic targets and improve clinical outcomes from the pathogenesis of DN.
DN has not historically been regarded as an immune-mediated disease, as metabolic and hemodynamic elements are believed to be the primary causes.3–5 Accumulating evidence from experimental and clinical studies has revealed that the immune system plays a vital role in both the development and progression of DN.6,7 The immune response that occurs in the diabetic kidney is an expected consequence of chronic stress and damage to the diabetic kidney, and the failure to adequately control hyperglycemia leads to the development of ongoing inflammation, with persistent diabetic renal inflammation leading to substantial kidney damage and ultimately to ESRD.8,9 Moreover, analysis of renal biopsies has verified that immune cells are present in the glomerulus and interstitium at all stages of DN and are positively associated with disease progression.10 The exact pathogenesis of DN remains unclear, and differences in etiology complicate the pathogenesis of DN.11 Disrupted equilibrium between pro- and anti-inflammatory factors contributes to DN pathogenesis. Dysregulated immune responses in DN manifest as altered cytokines, chemokines, and adhesion molecules expression, and aberrant immune cell activation or dysfunction, such as macrophages, T cells, and B cells. The imbalance between pro-inflammatory cytokines (TNF-α, IL-1β, IL-6) and anti-inflammatory cytokines (IL-10, TGF-β) aggravates kidney injury and advances disease progression.8 The dysregulation of immune cell infiltration and activation, especially macrophages, plays a role in DN pathogenesis, emphasizing the importance of immune dysregulation and the potential therapeutic benefits of targeting these immune mechanisms to decelerate or halt disease progression. However, it is undeniable that immune factors play a nonnegligible role in the occurrence and development of DN.
In this study, we applied multiple machine learning approaches in conjunction with bulk sequencing data and single-cell sequencing data to explore the immune-related core genes, potential pathways, immune infiltration patterns and cell-to-cell communication involved in DN development and progression. Our research centered on uncovering a novel immune signature, characterized by unique immune cell populations and other immune-related genes that play an essential role in the onset and progression of DN The immune signature we identified elucidates the intricate relationship between the immune system and DN pathogenesis, emphasizing the importance of comprehending these interactions for devising more efficacious strategies in DN management. Our research offers a fresh perspective on DN pathogenesis from an immunological standpoint and presents potential targets for future drug development aimed at DN, which we believe holds substantial significance.
Materials and Methods
Data Collection
The experimental design and workflow are schematically depicted in Figure 1. A total of 1793 immune-related genes were obtained from the ImmPort database (http://www.immport.org/)12 after the removal of duplicate genes (Supplementary Table 1). We downloaded gene expression data from GSE142025 from the Gene Expression Omnibus (GEO) (https://www.ncbi.nlm.nih.gov/geo) database, containing 9 normal samples, 6 early DN samples, and 13 advanced DN samples. GSE30528 was used to access hub genes by combining immune-related genes. GSE30529 contained 12 normal and 10 DN samples, and GSE47183 included 14 normal and 7 DN samples, which were used to verify the expression of hub genes. Single-cell sequencing data of 3 healthy individuals and 3 patients with DN were procured from the GSE131882 dataset.
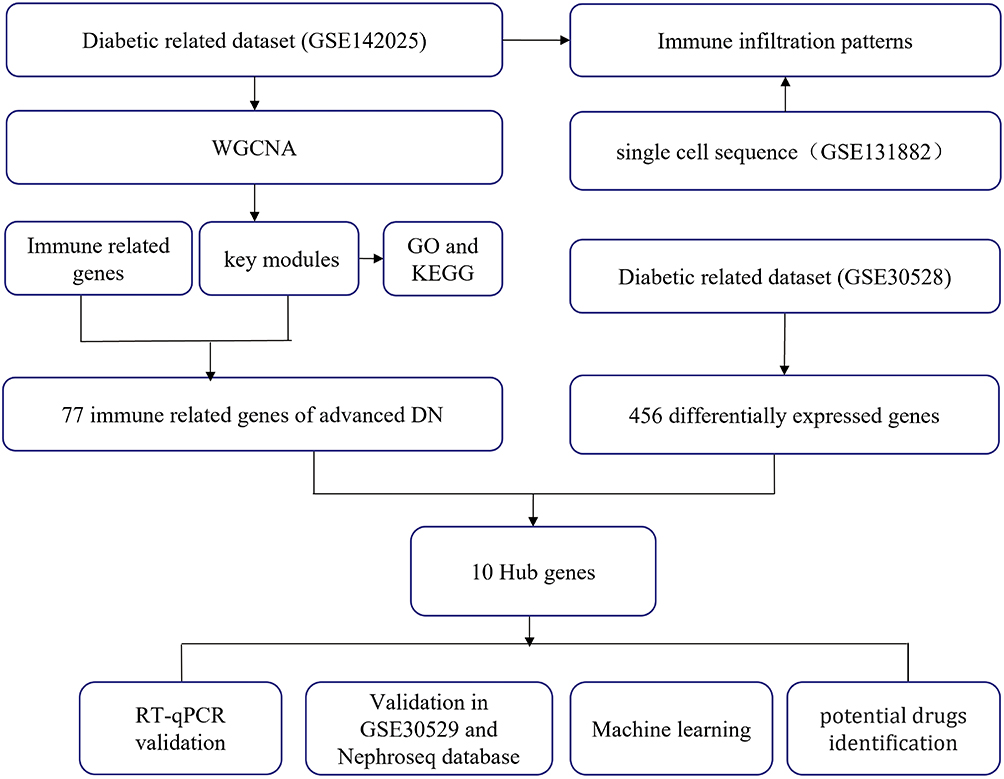 |
Figure 1 Flow chart of the entire study. |
Weighted Gene Co-Expression Network Analysis
The co-expression network of GSE142025 was analyzed using weighted gene co-expression network analysis (WGCNA) in the R package.13 Network construction and module detection were conducted using an unsigned type of topological overlap matrix (TOM). Here, we set the soft threshold power as 11 (scale free R2 = 0.84), cut height as 0.8, and minimal module size as 30 to identify key modules. Moreover, modules closely related to advanced DN were chosen for further analysis.
Functional Exploration of Immune-Related Genes
For GO and KEGG enrichment analysis, we used the R packages org.Hs.eg.db (version 3.1.0) and KEGG rest API (https://www.kegg.jp/kegg/rest/keggapi.html) to obtain the latest gene annotations, respectively. Next, the R package clusterProfiler (version 3.14.3) was used to perform enrichment analysis to obtain the gene set enrichment results. A minimum gene set of 5 and a maximum gene set of 5000 were set, and a P value of < 0.05 were considered statistically significant.14
Identification and Verification of Hub Genes
First, we applied the “limma” package to screen the differentially expressed genes (DEGs) between DN patients and controls in GSE30528. The criteria were set as P < 0.05 and | log2FC | > 1 (Supplementary Table 2). Second, we extracted the immune-related genes in the module related to clinical features and took the intersection with the DEGs in GSE30528 to identify hub genes. Third, GSE30529 was used as a validation cohort for the hub genes. Moreover, the expression levels of hub genes were also validated in the Nephroseq database (https://www.nephroseq.org/resource/login.html).
Animal Models, Kidney RNA Extraction and RT‒qPCR
In the DN model group and the chaga groups, insulin resistances of SD rats were confirmed after eight weeks’ high-fat chow. Then, the rats were received a single intraperitoneal injection of 35 mg/kg streptozotocin (STZ) to establish a type 2 diabetic mellitus (T2DM) when their random blood glucose (RBG) levels ≥16.7 mmol/L for three consecutive times. After that, the DN group fed a high-fat diet and given 0.25 mL/100 g tap water by gavage daily for 8 weeks and chaga group received 100 mg/kg chaga extracts daily for 8 weeks also. For detailed experimental procedures and information on the animal models, please refer to our previous publication.15 Total RNA was extracted from kidney tissues using TRIzol reagent (Takara, Japan) and reverse transcribed to cDNA using PrimeScript RT Master Mix (Takara, Japan). The RT‒qPCR analyzes were performed in triplicate using the NovoStart SYBR qPCR SuperMix Plus Kit (Novoprotein, China) and detected using an Applied Biosystems 7500 Real-Time PCR System (Thermo Fisher Scientific, USA). β-Actin was chosen as an internal reference. The comparative Ct approach was used to calculate the fold-changes in relative gene expression (fold change = 2 -ΔΔCt). All primers used are listed in Supplementary Table 3 and were purchased from Sangon Biotech (Shanghai, China).
Developing the Diagnostic Model Based on Machine Learning
We adopted GSE30528 as the training set and GSE30529 and GSE47183 as the test sets to predict the onset and progression of DN using random forest (RF), support vector machine (SVM), AdaBoost methods, and k-nearest neighbor (KNN). The 5-fold cross-validation method was used to randomly divide the entire dataset into five parts, with four-fifths used for training and the remaining one-fifth for testing. Receiver operating characteristic (ROC) curves were applied to assess the predictive value of the model. In this study, the RF model, SVM model, AdaBoost model and KNN were developed using the “Random Forest” package, the “e1071” package, the “adabag” package, and the “kknn” package, respectively. All the parameters for the four machine learning models are shown in Supplementary Table 4.
Single-Cell Data Processing
The gene expression matrix of GSE131882 was filtered and further analyzed with the R package Seurat, and cells were identified with the criteria of mitochondrial genes <20% and greater than 200 and less than 7000 genes expressed. A total of 21,450 cells met the quality control criteria for further analysis, and variable features of 6 samples were normalized before further analysis. Cells were clustered into 18 cell populations using the FindClusters function (resolution = 0.6). Identification of cell types was based on the specific cell markers obtained from the CellMarker database (http://biocc.hrbmu.edu.cn/CellMarker/) and scHCL (scHCL is an R package for large-scale data from the scHCL online function Human Cell Landscape). CellChat contains a database of receptor‒ligand interactions and was used to analyze cell-to-cell pathways. To obtain more critical cell–cell interactions between normal and diabetic microenvironments, we selected receptor‒ligand pairs for further analysis, aiming to explore the potential interactions between immune cells and podocytes.
Immune Infiltration Patterns by CIBERSORT Analysis
CIBERSORT (https://cibersort.stanford.edu) is an online tool that uses support vector regression modeling to deconvolute cell types and to estimate the abundance of 22 immune cell types.16 The percentage of each kind of immune cell in the samples was further calculated. The Wilcoxon rank-sum test and Spearman correlation were performed to explore the correlation between the infiltration levels of immune cells and hub genes.
Prediction of Hub Gene-Targeted Drugs
The drug-gene interaction database (DGIdb, https://www.dgidb.org/) annotates known drug-gene interactions and potential drug accessibility-related genes and includes over 14,000 drug-gene interactions involving 2600 genes and 6300 drugs targeting these genes, as well as 6700 other genes. Here, the DGIdb was applied to predict drugs targeting hub genes.
Statistical Analysis
Statistical analyzes were conducted using R, GraphPad Prism 9.0, and Sangerbox (http://www.sangerbox.com/tool). The Mann–Whitney test was utilized to analyze differences between the two groups. To assess the diagnostic value of the pivotal genes, four machine learning algorithms-Random Forest (RF), Support Vector Machine (SVM), Adaptive Boosting (AdaBoost), and K-Nearest Neighbor (KNN)-were employed. Receiver operating characteristic (ROC) curves were generated, and the area under the curve (AUC) was calculated to evaluate the diagnostic performance of the hub genes. A p-value < 0.05 was deemed statistically significant.
Results
Construction of a Weighted Co-Expression Network and Identification of Key Modules
As we described previously, the highest scale-free topology model fit index and lowest mean connectivity can be obtained when the soft threshold is set as 11 (Figure 2A). Then, we employed hierarchical clustering to group similarly expressed genes into the same module, set a height of 0.80 as the threshold value, merged modules with high similarity, and finally obtained 14 qualified modules (Figure 2B). We used the P value to measure the correlation between each module and clinical traits. According to the heatmap of module-trait relationships, the turquoise module (r = 0.82, P = 7e−10) and the red module (r = 0.76, P = 9e−08) presented a higher positive correlation with advanced DN in comparison to other modules, which suggested that the genes in the turquoise and red modules might play a vital role in the progression of DN to the advanced stage. For this reason, the turquoise and red modules were identified as the most clinical-type modules and were used for subsequent analysis.
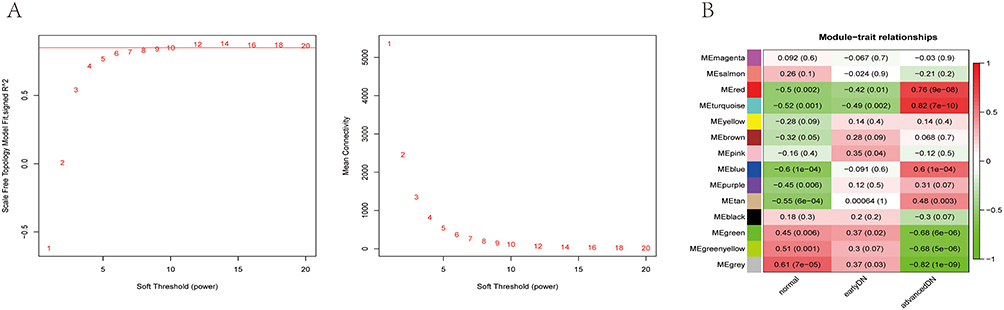 |
Figure 2 Construction of a weighted co-expression network and identification of key modules. (A) Analysis of the scale-free network for soft threshold powers and the mean connectivity for soft threshold powers. The soft-thresholding power was set as 11. (B) Heatmap of module-trait relationships containing correlation coefficients and p values. |
GO and KEGG Pathway Enrichment Analysis
In this study, GO and KEGG enrichment pathway analyzes were further investigated for the identified genes in the turquoise and red modules. According to GO analysis, the biological processes were mainly enriched in immune system process, immune response, and cell activation (Figure 3A). The cellular components were primarily enriched in plasma membrane part, the intrinsic component of plasma membrane, and the integral component of plasma membrane (Figure 3B). In the molecular function category, genes in the turquoise and red modules were predominantly associated with molecular transducer activity, signaling receptor activity, and GTPase regulator activity (Figure 3C). Regarding the KEGG analysis, the results demonstrated that these genes were significantly associated with the chemokine signaling pathway, cytokine‒cytokine receptor interaction, and T-cell receptor signaling pathway (Figure 3D). In summary, the above results indicated that immune-related functions are strongly related to genes in the turquoise and red modules.
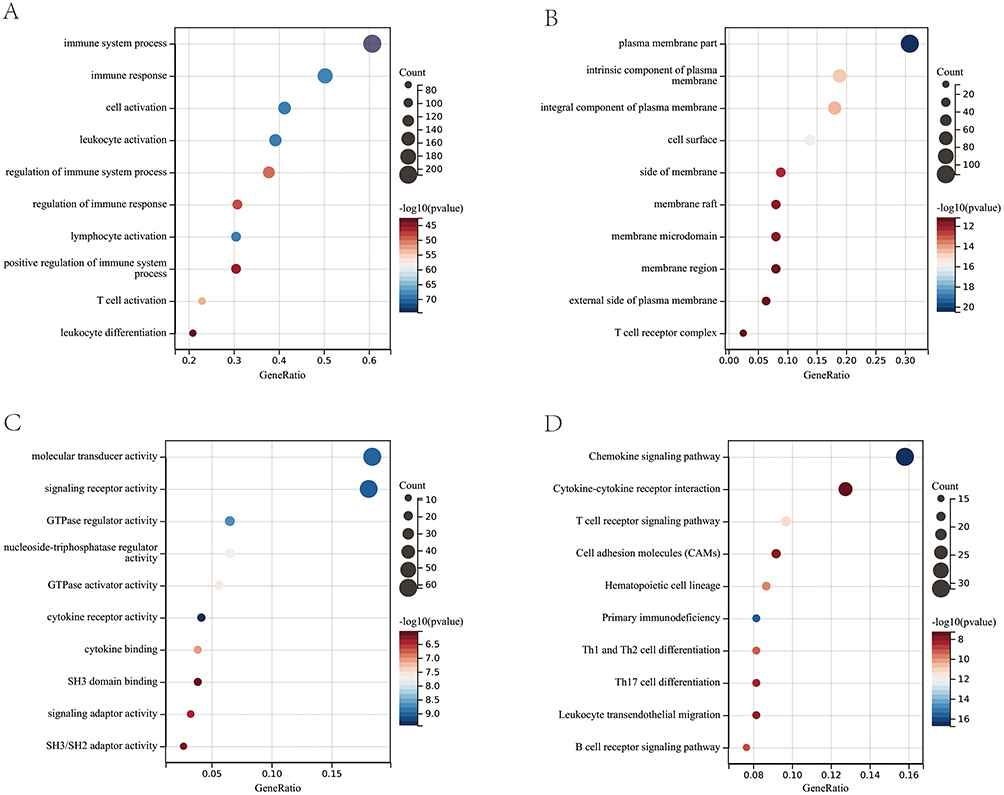 |
Figure 3 GO enrichment analysis of the genes in the turquoise and red modules. (A) BP, biological process; (B) CC, cellular component; (C) MF, molecular function. (D) KEGG pathway enrichment analysis of the genes in the turquoise and red modules. |
Identification and Validation of Hub Genes
We extracted the 77 immune-related genes in the turquoise and red modules and intersected them with the DEGs in GSE30528 (Figure 4A). Finally, 10 hub genes (LCK, CD48, CD3D, ITGB2, IL10RA, IL7R, CCL5, TLR7, LYZ, and PTPRC) were identified. Next, we performed validation in the GSE30529 and Nephroseq databases to explore the expression patterns of these hub genes in different diabetic population samples. As expected, the expression of these hub genes in GSE30529 and Nephroseq was also higher than that in normal samples, which is consistent with the results in GSE30528 (Figure 4B and C). We further performed RT‒qPCR to analyze the mRNA expression levels among the normal, DN, and chaga-treated group (treatment with 100 mg/kg chaga) kidneys of rats. Of all 10 hub genes, 9 primers were designed successfully (no available primers were designed for LYZ). The results showed that compared with those in the normal control group, the expression levels of 9 hub genes were significantly upregulated in the DN group, and interestingly, the gene expression levels in the chaga-treated group almost returned to normal levels, which was consistent with the results of the transcriptome analysis (Figure 4D). In addition, the expression trends of TLR7 and its downstream genes MyD88 and NF-κB were consistent across each group. The results demonstrated the reliability of the bioinformatics analysis and suggested that these genes may be potential targets to prevent the progression of DN.
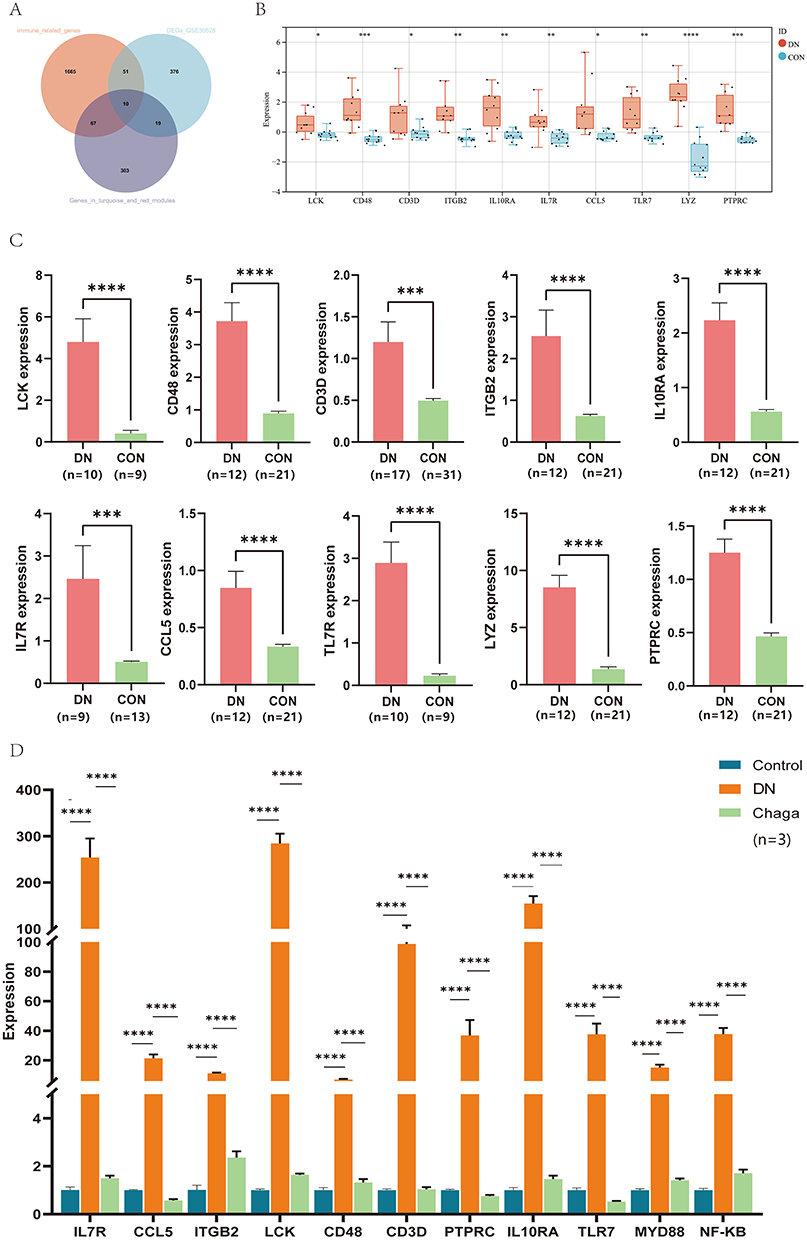 |
Figure 4 Identification and validation of 10 hub genes. (A) Venn diagram showing the overlap of genes between immune-related genes in the turquoise and red modules and the DEGs in GSE30528. (B) Validation of 10 hub genes in GSE30529. (C) Validation of 10 hub genes in Nephroseq. (D) RT‒qPCR showed the mRNA expression level of hub genes in kidney tissues of rats in each group. DN, diabetic nephropathy; Chaga, treatment with 100 mg/kg chaga. *P < 0.05, **P < 0.01, ***P < 0.001, ****P < 0.0001. |
Creating the Random Forest Model (RF), Support Vector Machine (SVM), Adaptive Boosting (AdaBoost) and k-Nearest Neighbor (KNN) Models
We used RF, SVM, AdaBoost and KNN to evaluate the value of immune signature based on hub genes in the diagnosis of the occurrence and development of DN. GSE30528 was used as a training model, and GSE30529 and GSE47183 were used as the test model. As shown in Figure 5A, the correlation between model uncertainties and the number of selected trees presented a consistent inaccuracy. The Gini coefficient technique was further examined, and the top 4 genes in order of ranking were LCK, CD3D, TLR7, and IL7R (Figure 5B). As shown in Figure 5C and D, we built four kinds of machine learning models through 5-fold cross-validation. ROC curves were drawn based on the cross-validation test set data to visually display the diagnostic predictive values of the four machine learning models. In addition, other metrics, including accuracy, sensitivity, specificity, precision, recall, and F1-score, are given in Supplementary Tables 5 and 6. In both validation sets, that is, GSE30529 and GSE47183, the RF model exhibited a higher AUC (0.899; 0.932) than the SVM, AdaBoost, and KNN models, demonstrating a higher performance in differentiating between DN groups and normal control groups. Our findings revealed that the immune signature could efficiently distinguish between DN patients and healthy controls, while also exhibiting potential for predicting the progression of DN.
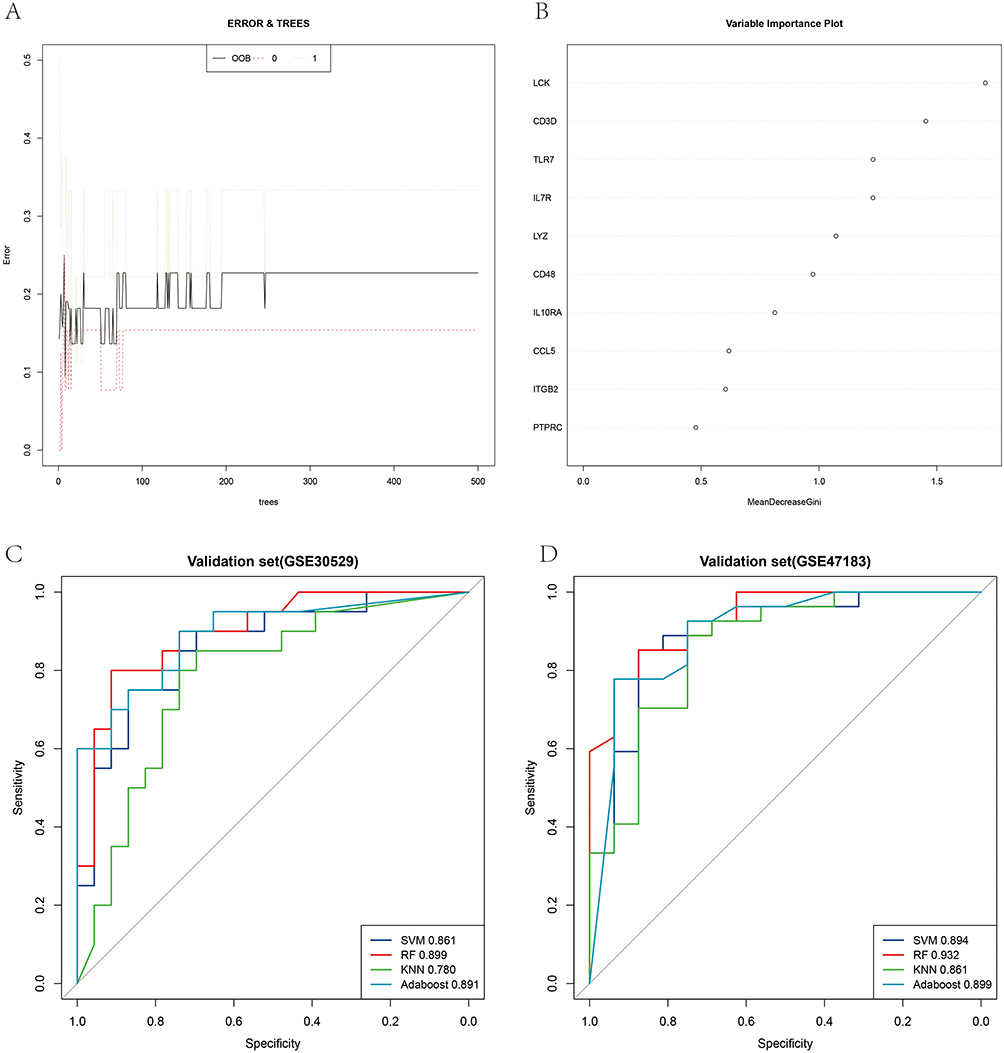 |
Figure 5 Developing the diagnostic model based on machine learning. (A) The tree model indicated that the error had stabilized. (B) The relative relevance of 10 hub genes. (C and D) The receiver operating characteristic curves with 5-fold cross-validation of RF, SVM, AdaBoost and KNN. |
Immune Infiltration Patterns Based on Bulk Sequence Analysis and Single-Cell Sequencing Analysis
In the previous GO and KEGG enrichment analyzes, we found that genes in the turquoise and red modules were highly enriched in immune-related pathways. Therefore, CIBERSORT algorithms were further performed in GSE142025 and GSE30529 to explore the immune cell types potentially involved in the occurrence and development of DN. The abundance of immune cell subtypes in each sample is shown in Figure 6A and B. In GSE142025 (Figure 6C), compared with normal samples, advanced DN had reduced proportions of B-cells naive, T_cells_CD4_memory_resting, NK cells activated, and Macrophages_M0 but increased proportions of T_cells_CD8, T_cells_CD4_naive, NK cells resting, Macrophages_M2, and Mast cells resting. For early-stage DN, compared with the normal group, the proportion of monocytes was reduced, while the proportion of T cells gamma delta increased. Moreover, higher proportions of T_cells_CD8, T_cells_CD4_naive, NK cells resting, Monocytes, Macrophages_M2, and Mast cells resting and lower proportions of B cells naive, T cells regulatory, NK cells activated, and Macrophages_M0 were identified in advanced DN samples than in early-stage DN samples. In GSE30529 (Figure 6D), relative to the normal group, reduced proportions of T cells regulatory, NK cells resting, and Mast cells activated but increased proportions of Plasma cells, T cells gamma delta, Monocytes, Macrophages_M1, Macrophages_M2, and Mast cells resting were detected in the DN group.
 |
Figure 6 Immune infiltration patterns based on bulk sequence analysis. (A) Abundance of immune cell types in GSE142025. (B) Abundance of immune cell types in GSE30529. (C) Comparisons between immune cells in advanced DN, early-stage DN and normal control samples in GSE142025. (D) Comparisons between immune cells in DN and normal control samples in GSE30529. *P < 0.05, **P < 0.01, ***P < 0.001, ****P < 0.0001, -P > 0.05. |
In addition to the bulk sequencing analysis, we analyzed the immune microenvironment of DN with the single-cell sequencing dataset GSE131882. According to the CellMarker database and scHCL, we identified 18 cell clusters and annotated the 18 clusters into 13 cell populations: mesangial cells, proximal tubule cells, distal convoluted tubule cells, thin ascending limb cells, intercalated cells, B cells, endothelial cells, descending limb cells, podocytes, thick ascending limb cells, monocytes, and natural killer T cells (Figure 7A and B). The proportions of cells in each cluster are shown in Figure 7C. As expected, a high portion of immune cell clusters (B cells, monocytes, and natural killer T cells) was detected in DN samples. The R package CellChat was used to further investigate the communication between activated podocytes and immune cells (B cells, monocytes, and natural killer T cells). The overall number of inferred interactions and the cell communication strength were enhanced in DN samples (Figure 7D). Compared to normal samples, the interactions of podocytes with B cells, monocytes, and natural killer T cells were significantly enhanced in DN samples. Interestingly, enhanced interaction strength between podocytes and monocytes and natural killer T cells but reduced interaction strength between podocytes and B cells were observed, as shown in Figure 7E. Next, we focused on the different pathways between DN samples and normal samples, including CD46 and NOTCH signals, reported to be associated with the development and progression of DN (Figure 7F). Finally, we constructed a pathway map of the three immune cell types and podocytes in normal and DN samples. The results indicated that the communication pathways between podocytes and immune cells were significantly increased in DN samples (Figure 7G).
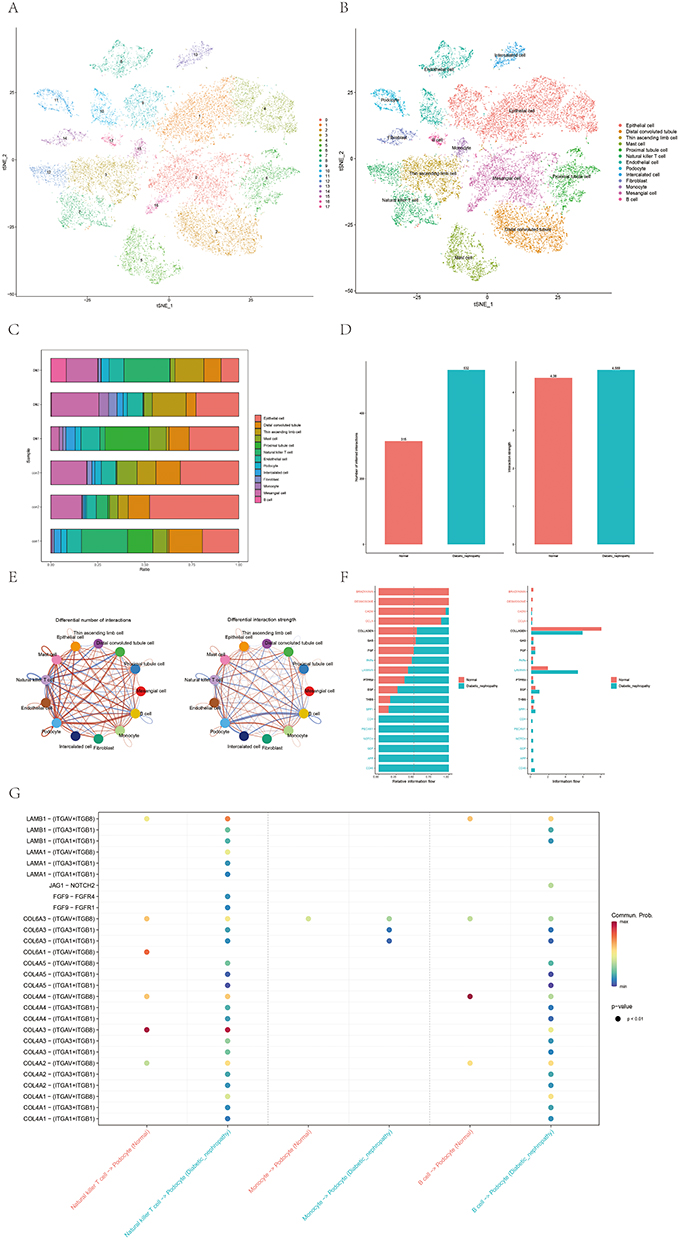 |
Figure 7 Immune infiltration patterns based on single-cell sequencing analysis. (A and B) Cell clusters for GSE131882 of 3 healthy controls and 3 patients with diabetic nephropathy. (C) Proportions of different cell clusters in normal and diabetic nephropathy kidney tissues. (D) Differential number of interactions and interaction between diabetic nephropathy and normal samples. (E) Differential number of interactions and interaction strength for the comparison of diabetic nephropathy and normal samples between podocytes and immune cells. The red line represents enhancement, and the blue line represents reduction. (F) All the signaling pathways between diabetic nephropathy and normal samples ranked based on their differences in overall information flow within the inferred networks. Signaling pathways indicated in red are more enriched in normal group, signaling pathways indicated in blue are more enriched in diabetic nephropathy group, signaling pathways indicated in black were not significantly different between the normal and diabetic nephropathy groups. (G) Comparison of important ligand‒receptor pairs for all signaling pathways between DM and control samples of podocytes and immune cells. |
Prediction of Hub Gene-Targeted Drugs
A total of 102 molecular drugs that may target hub genes were identified by the DGIdb. Among them, 52 targeted LCK, 7 targeted CD3D, 19 targeted ITGB2, 12 targeted TLR7, and 12 targeted PTPRC (Figure 8). Unfortunately, no candidate drugs targeting CD48, IL10RA, IL7R, CCL5, or LYZ were identified.
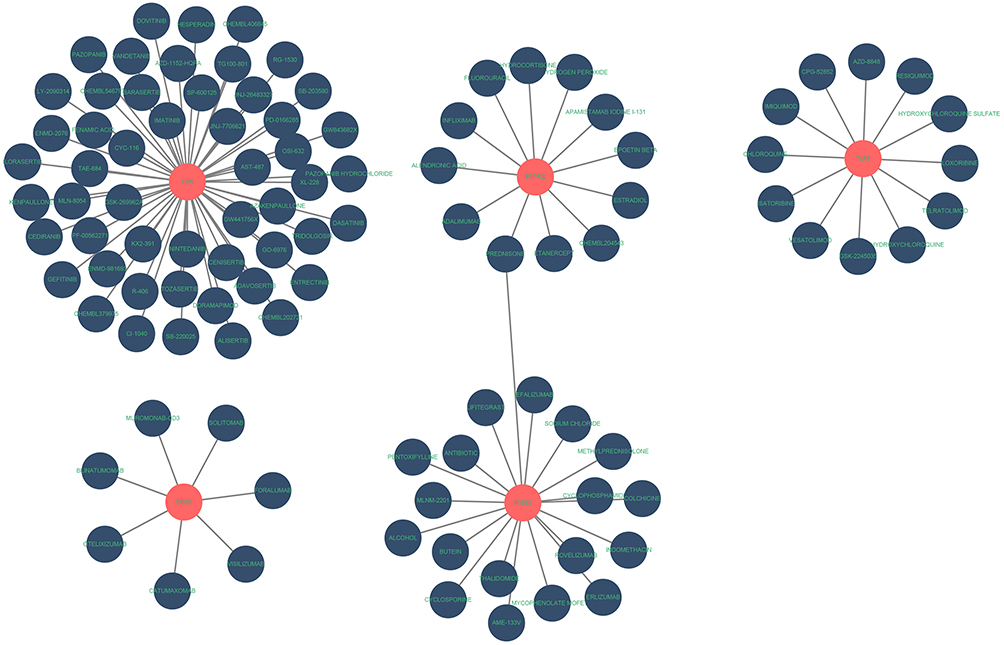 |
Figure 8 Prediction of hub gene-targeted drugs. The drugs may target the hub genes identified by the DGIdb. |
Discussion
Diabetic nephropathy (DN) is a major cause of end-stage renal failure, and inflammatory and immune factors contribute critically to the pathogenesis and progression of DN.17,18 Studies in experimental diabetic animal models have demonstrated the presence of low-grade inflammation in the diabetic kidney.19 As a result of inflammatory stress, renal cells produce proinflammatory molecules, thereby promoting a local immune response in the kidney.20 At present, there is an absence of comprehensive studies of immune-related genes in DN occurrence and development. Therefore, we used WGCNA to analyze bulk transcriptome data in combination with single-cell sequencing results, aiming to investigate the immune mechanisms in the DN disease process.
WGCNA revealed gene modules associated with the normal, early DN, and advanced DN groups. By comparison, we found few different modules between the normal and early DN groups. In contrast, the advanced DN group, whether compared with the normal group or the early DN group, had significantly more different modules, and the turquoise and red modules were identified as the key modules of DN progression. Furthermore, the enrichment analysis revealed that the genes of these key modules were primarily enriched in immune system process, immune response, and T-cell receptor pathways. These results suggested that immune genetic alterations are more likely to occur in the progressive phase of DN and that immune-related factors may be a cause of progressive renal damage, of which T cells may be an important factor. Some researchers have observed that in patients with diabetes, activation of the TNF-α signaling pathway and T lymphocytes appear to be synergistic and contribute to the progression of DN.21 Moreover, several studies in rodent models of DN have revealed that T cells were significantly increased in the kidney and that proteinuria can be improved by immunosuppression of T-cell proliferation and activation, suggesting the vast promise of immunotherapy in DN.22,23
A total of 10 hub immune genes were identified in the development and progression of DN. The gene modules from WGCNA may have false positives, reducing the ability to predict disease. Subsequently, we applied four machine learning methods to assess the diagnostic value of the hub genes. The AUC values of RF, SVM, AdaBoost and KNN were all greater than 0.8, indicating satisfactory diagnostic performance. The RF model exhibited the highest AUC value, and LCK, CD3D, TLR7, and IL7R was considered to be the four most important genes for diagnosis by the mean decrease in the Gini index. Hanet al used LASSO, SVM-RFE, and RF to identify novel biomarkers of DN, and their results were in general agreement with our analysis, all with good AUC values; on this basis, they also constructed a reliable diagnostic model for diabetes.24 In addition, feed-forward neural network models were reported that were trained using clinical variables as predictors, and these outperformed other machine learning and traditional risk prediction models validated in the same dataset, showing good predictive power.25 Zhang et al trained an immune checkpoint inhibitor (ICI) response classification model using seven common machine learning algorithms and performed 5-fold cross-validation to optimize the performance of the model.26 In our study, we referred to their method and performed 5-fold cross-validation on our results, which confirmed that our machine learning models have superior data processing capability. Hyperparameter tuning is critical to the robust and stable performance of machine learning models, regardless of clinical variables or sequencing data. We hope that more convincing prognostic models can be constructed by combining gene expression and corresponding clinical variables in future studies.
Alterations in the expression and activity of LCK have been reported to be associated with many diseases, including diabetes.27 The critical function of LCK in lymphocytes and the link to diabetes in nonobese diabetic mouse models have been proposed,28 and combined with our studies, LCK is considered a prime candidate for DN susceptibility genes. The CD3D gene encodes a protein participating in T-cell development and signal transduction and plays an important role in the adaptive immune response.29 In previous transcriptomic studies, CD3D was considered a key mediator and diagnostic marker for the pathogenesis of rheumatoid arthritis progression and carotid atherosclerotic plaques.30,31 TLR7, a member of the Toll-like receptor (TLR) family, is generally thought to perform a fundamental role in pathogen recognition and activation of innate immunity, and metabolic inflammation activated by TLRs may now serve as an essential driver of diabetic kidney injury.32 Activation of TLR7 could also contribute to the regulation of B-cell functional activity and interaction with T cells, subsequently promoting the development of type 1 diabetes.33 IL7R was previously reported to be highly expressed in renal tissue transcriptomic analysis in patients with DN.34 Furthermore, anti-IL-7Rα treatment was reported to promote the development of IFN-γ+ cells in CD4+ and CD8+ T cells, offering a unique approach to the treatment of diabetes and its complications.35 After identifying hub genes, we validated the expression of mRNAs that are expected to be candidate biosignatures and promising therapeutic targets for DN in GSE30529, the Nephroseq database, and animal models. Moreover, in our previous study, we found that polysaccharides from Inonotus obliquus (Chaga), which is believed to exhibit immune-regulatory, anti-inflammatory, and antioxidant effects, could improve serum creatinine and urinary protein caused by DN.15 Interestingly, we found that the mRNA expression levels of immune genes were significantly decreased in the chaga-treated group compared to the DN group, which revealed that the therapeutic effect of chaga may result from modulating the immune response of the kidney.
We also applied the CIBERSORT algorithm to estimate the infiltration of 22 immune cells based on transcriptomic data from DN and obtained a panorama of immune infiltration patterns. In patients with advanced DN, the expression of T cells and B cells was significantly increased, and our findings were consistent with those of previous studies.36,37 The number of infiltrating T cells in the kidneys of DN animals was positively correlated with the degree of proteinuria, and blocking systemic T-cell activation could attenuate proteinuria.38 B cells participate in the pathogenesis of DKD by acting in antigen presentation, antibody production, immune complex production, and/or cytokine production. In clinical trials, B-cell depletion therapies demonstrated promising effects in patients with T1DM,39,40 while noncell depletion therapies, such as targeted inhibition of B-cell function, may also potentially benefit patients with T1DM and DKD.41 In addition, we utilized CellChat to investigate the differences in cellular communication in the renal tissues between normal subjects and DN patients. Considering that podocyte injury is closely related to proteinuria, we focused on cellular communication between podocytes and immune cells. We found that the proportions of the three identified immune cell types (B cells, monocytes, and natural killer T cells) were significantly higher in DN patients than in normal subjects and that intercellular communication was also significantly enhanced, which is consistent with previous studies.23,34,38 Likewise, receptor‒ligand analysis suggested that COL4A-mediated communication from natural killer T cells and B cells to podocytes was the most enhanced. These results demonstrated that excessive activation of T and B cells leads to the development and progression of DKD and presented innovative targets and ideas for future personalized treatment.
Finally, we analyzed the network map between hub genes and gene-targeted drugs using DGIdb, and interestingly, we found that hydroxychloroquine was an inhibitor of TLR7. Prior research has shown that hydroxychloroquine can inhibit macrophage activation and attenuate renal fibrosis after ischemia-reperfusion injury.42 TLR7-mediated upregulation of IFN-α could lead to enhanced SLE activity, and hydroxychloroquine was reported to potentially target TLR7 for the treatment of SLE.43,44 Hydroxychloroquine has been reported for the treatment of DN, indicating considerable prospects for the treatment of DN.45 In the future, more experimental evidence and long-term clinical trials are needed to validate the effects of hydroxychloroquine in the treatment of DN.
In this investigation, we discovered a novel immune signature linked to immune responses and immune dysregulation in DN patients. This signature, involving specific immune cell populations, plays a vital role in DN progression, enhancing our understanding of immune regulatory mechanisms and directing future research.
Diagnostically, this immune signature serves as a unique biomarker for early identification of diabetic patients at risk for DN. By detecting specific immune cells and genes, we can accurately predict DN development likelihood, enabling timely interventions and reducing incidence and mortality rates. Prognostically, the immune signature aids in monitoring DN patients’ conditions and treatment responses. Regular assessments of these immune markers enable effective disease management and personalized treatment plans, ultimately improving therapeutic outcomes. Additionally, our in vivo study establishes a theoretical basis for innovative immune-centric therapeutic strategies targeting DN. Modulating specific immune cells and genes may enable targeted approaches, enhancing immune responses, reducing kidney damage, and decelerating DN progression.
In conclusion, our study uncovers the immune features of DN, contributing to a deeper understanding of diabetic nephropathy pathogenesis and presenting novel strategies for diagnosis, prognosis, and treatment. We anticipate these findings will be of significant value for future clinical practices and research endeavors.
Of course, there are limitations to our study. First, although we performed a rigorous bioinformatics analysis based on bulk transcriptome data and single-cell data, as well as verified hub gene expression in animal models, this is still a preliminary study of the immune elements in DN. Second, further validation of our results in larger cohorts is needed, including animal models and human studies, to confirm the relevance of the immune profile to DN and its potential as a diagnostic or therapeutic target. Second, the functional mechanisms between the hub genes and potential drugs in the development and progression of DN need to be further investigated.
Conclusion
Our investigation identified a novel immune signature in DN patients, characterized by unique immune cell populations and immune-associated genes that play an essential role in DN development and progression. This immune signature holds potential clinical relevance, as it could serve as a valuable biomarker for early DN detection and may also predict disease progression and treatment responses. Our findings enhance the understanding of the intricate relationship between the immune system and DN pathogenesis, laying the groundwork for future studies exploring the immune system’s role in DN and the development of innovative diagnostic and therapeutic approaches targeting the identified immune components.
In summary, bioinformatics analysis uncovered differences in the expression of immune-related genes and immune cell infiltration patterns between DN and normal human samples. Moreover, we found that natural killer T and B cells exhibited enhanced cellular communication with podocytes in the diabetic environment. Immune-related genes and potential drug interaction networks contributed to our study of the molecular mechanisms underlying DN pathophysiology and identified new targets for medical intervention.
Data Sharing Statement
Publicly available datasets from the GEO (https://www.ncbi.nlm.nih.gov/geo/) database were analyze d in this study. All data supporting this study are available from the corresponding authors upon reasonable request.
Ethics Approval and Informed Consent
Acclimatizing all animals under standardized laboratory conditions-including a ventilated environment at 25±1°C, 60±5% relative humidity, and a 12-hour light/dark cycle-with free access to water and standard laboratory chow, the experimental procedures adhered to “Guiding Principles in the Care and Use of Animals (China)” and received review and approval from the Ethics Review Committee for Animal Experimentation of Shanxi Provincial People’s Hospital (Approval No. 2021-004). The data from GEO and Nephroseq database are both publicly available. Thus, the bio-informatics study was exempted from the approval of Ethical Committee of the Shanxi Provincial People’s Hospital (Approval No. 2023-201) The current research follows the GEO and Nephroseq data access policies and publication guidelines.
Author Contributions
All authors made a significant contribution to the work reported, whether that is in the conception, study design, execution, acquisition of data, analysis and interpretation, or in all these areas; took part in drafting, revising or critically reviewing the article; gave final approval of the version to be published; have agreed on the journal to which the article has been submitted; and agree to be accountable for all aspects of the work.
Funding
This study was supported by Demonstration Project on Reformation and Quality Development of Public Hospitals (SCP-2023-8), the Local Science and Technology Development Funds Projects Guided by Central Government (No. YDZJSX2021C027), the Medical Key Research Projects of Shanxi Province (No. 2020XM02) and Basic Research Program of Shanxi Province (No.202103021224370).
Disclosure
All the authors have declared that they have no conflicts of interest regarding this article.
References
1. Bikbov B, Purcell CA, Levey AS.; GBD Chronic Kidney Disease Collaboration. Global, regional, and national burden of chronic kidney disease, 1990–2017: a systematic analysis for the global burden of disease study 2017. Lancet. 2020;395:709–733. doi:10.1016/S0140-6736(20)30045-3
2. Arora MK, Singh UK. Molecular mechanisms in the pathogenesis of diabetic nephropathy: an update. Vascul Pharmacol. 2013;58:259–271. doi:10.1016/j.vph.2013.01.001
3. Kato M, Natarajan R. Epigenetics and epigenomics in diabetic kidney disease and metabolic memory. Nat Rev Nephrol. 2019;15:327–345. doi:10.1038/s41581-019-0135-6
4. Ruggenenti P, Flores C, Aros C, et al. Renal and metabolic effects of insulin lispro in type 2 diabetic subjects with overt nephropathy. Diabetes Care. 2003;26:502–509. doi:10.2337/diacare.26.2.502
5. Mahato HS, Ahlstrom C, Jansson-Löfmark R, et al. Mathematical model of hemodynamic mechanisms and consequences of glomerular hypertension in diabetic mice. NPJ Syst Biol Appl. 2019;5(2). doi:10.1038/s41540-019-0081-8
6. Yu K, Li D, Xu F, et al. IDO1 as a new immune biomarker for diabetic nephropathy and its correlation with immune cell infiltration. Int Immunopharmacol. 2021;94:107446. doi:10.1016/j.intimp.2021.107446
7. Flyvbjerg A. The role of the complement system in diabetic nephropathy. Nat Rev Nephrol. 2017;13:311–318. doi:10.1038/nrneph.2017.31
8. Tesch GH. Diabetic nephropathy - is this an immune disorder? Clin Sci. 2017;131:2183–2199. doi:10.1042/CS20160636
9. Rayego-Mateos S, Morgado-Pascual JL, Opazo-Ríos L, et al. Pathogenic pathways and therapeutic approaches targeting inflammation in diabetic nephropathy. Int J Mol Sci. 2020;21:E3798. doi:10.3390/ijms21113798
10. Klessens CQF, Zandbergen M, Wolterbeek R, et al. Macrophages in diabetic nephropathy in patients with type 2 diabetes. Nephrol Dial Transplant. 2017;32:1322–1329. doi:10.1093/ndt/gfw260
11. C Q, X M, Z Z, H W. Classification and differential diagnosis of diabetic nephropathy. J Diabetes Res. 2017;2017:1.
12. Bhattacharya S, Andorf S, Gomes L, et al. ImmPort: disseminating data to the public for the future of immunology. Immunol Res. 2014;58:234–239. doi:10.1007/s12026-014-8516-1
13. Langfelder P, Horvath S. WGCNA: an R package for weighted correlation network analysis. BMC Bioinform. 2008;9:559. doi:10.1186/1471-2105-9-559
14. Kanehisa M, Furumichi M, Tanabe M, Sato Y, Morishima K. KEGG: new perspectives on genomes, pathways, diseases and drugs. Nucleic Acids Res. 2017;45:D353–D361. doi:10.1093/nar/gkw1092
15. Zhang Y, Liao H, Shen D, et al. Renal protective effects of Inonotus obliquus on high-fat diet/streptozotocin-induced diabetic kidney disease rats: biochemical, color Doppler ultrasound and histopathological evidence. Front Pharmacol. 2021;12:743931. doi:10.3389/fphar.2021.743931
16. Newman AM, Liu CL, Green MR, et al. Robust enumeration of cell subsets from tissue expression profiles. Nat Methods. 2015;12:453–457. doi:10.1038/nmeth.3337
17. Barutta F, Bruno G, Grimaldi S, Gruden G. Inflammation in diabetic nephropathy: moving toward clinical biomarkers and targets for treatment. Endocrine. 2015;48:730–742. doi:10.1007/s12020-014-0437-1
18. Tang SCW, Yiu WH. Innate immunity in diabetic kidney disease. Nat Rev Nephrol. 2020;16:206–222. doi:10.1038/s41581-019-0234-4
19. Dh N, Lee MH, Kim JE, et al. Blockade of cannabinoid receptor 1 improves insulin resistance, lipid metabolism, and diabetic nephropathy in db/db mice. Endocrinology. 2012;153:1387–1396.
20. Brosius FC, He JC. JAK inhibition and progressive kidney disease. Curr Opin Nephrol Hypertens. 2015;24:88–95. doi:10.1097/MNH.0000000000000079
21. Lampropoulou IT, Stangou Μ, Sarafidis P, et al. TNF-α pathway and T-cell immunity are activated early during the development of diabetic nephropathy in type II diabetes mellitus. Clin Immunol. 2020;215:108423. doi:10.1016/j.clim.2020.108423
22. Kim S-M, Lee S-H, Lee A, et al. Targeting T helper 17 by mycophenolate mofetil attenuates diabetic nephropathy progression. Transl Res. 2015;166:375–383. doi:10.1016/j.trsl.2015.04.013
23. Zhang F, Wang C, Wen X, et al. Mesenchymal stem cells alleviate rat diabetic nephropathy by suppressing CD103 + DCs-mediated CD8 + T cell responses. J Cell Mol Med. 2020;24:5817–5831. doi:10.1111/jcmm.15250
24. Han H, Chen Y, Yang H, et al. Identification and verification of diagnostic biomarkers for glomerular injury in diabetic nephropathy based on machine learning algorithms. Front Endocrinol. 2022;13:876960. doi:10.3389/fendo.2022.876960
25. Belur Nagaraj S, Pena MJ, Ju W, Heerspink HL. Machine‐learning–based early prediction of end‐stage renal disease in patients with diabetic kidney disease using clinical trials data. Diabetes Obes Metab. 2020;22:2479–2486. doi:10.1111/dom.14178
26. Zhang Z, Wang Z-X, Chen Y-X, et al. Integrated analysis of single-cell and bulk RNA sequencing data reveals a pan-cancer stemness signature predicting immunotherapy response. Genome Med. 2022;14:45. doi:10.1186/s13073-022-01050-w
27. Kumar Singh P, Kashyap A, Silakari O. Exploration of the therapeutic aspects of Lck: a kinase target in inflammatory mediated pathological conditions. Biomed Pharmacother. 2018;108:1565–1571. doi:10.1016/j.biopha.2018.10.002
28. Hulme JS, Barratt BJ, Twells RCJ, et al. Association analysis of the lymphocyte-specific protein tyrosine kinase (LCK) gene in type 1 diabetes. Diabetes. 2004;53:2479–2482. doi:10.2337/diabetes.53.9.2479
29. Rowe JH, Delmonte OM, Keles S, et al. Patients with CD3G mutations reveal a role for human CD3γ in Treg diversity and suppressive function. Blood. 2018;131:2335–2344. doi:10.1182/blood-2018-02-835561
30. Yu T, Xu B, Bao M, et al. Identification of potential biomarkers and pathways associated with carotid atherosclerotic plaques in type 2 diabetes mellitus: a transcriptomics study. Front Endocrinol. 2022;13:981100. doi:10.3389/fendo.2022.981100
31. Lu J, Bi Y, Zhu Y, Huipeng S, Duan W, Zhou J. CD3D, GZMK, and KLRB1 are potential markers for early diagnosis of rheumatoid arthritis, especially in anti-citrullinated protein antibody-negative patients. Front Pharmacol. 2021;12:726529. doi:10.3389/fphar.2021.726529
32. Feng Y, Yang S, Ma Y, Bai X-Y, Chen X. Role of Toll-like receptors in diabetic renal lesions in a miniature pig model. Sci Adv. 2015;1:e1400183. doi:10.1126/sciadv.1400183
33. Huang J, Peng J, Pearson JA, et al. Toll-like receptor 7 deficiency suppresses type 1 diabetes development by modulating B-cell differentiation and function. Cell Mol Immunol. 2021;18:328–338. doi:10.1038/s41423-020-00590-8
34. Geng X-D, Wang WW, Feng Z, et al. Identification of key genes and pathways in diabetic nephropathy by bioinformatics analysis. J Diabetes Investig. 2019;10:972–984. doi:10.1111/jdi.12986
35. Lee L-F, Logronio K, Tu GH, et al. Anti-IL-7 receptor-α reverses established type 1 diabetes in nonobese diabetic mice by modulating effector T-cell function. Proc Natl Acad Sci USA. 2012;109:12674–12679. doi:10.1073/pnas.1203795109
36. Yang X, Mou S. Role of immune cells in diabetic kidney disease. Curr Gene Ther. 2017;17:424–433. doi:10.2174/1566523218666180214100351
37. Moon J-Y, Jeong KH, Lee TW, Ihm CG, Lim SJ, Lee SH. Aberrant recruitment and activation of T cells in diabetic nephropathy. Am J Nephrol. 2012;35:164–174. doi:10.1159/000334928
38. Herrera M, Söderberg M, Sabirsh A, et al. Inhibition of T-cell activation by the CTLA4-Fc Abatacept is sufficient to ameliorate proteinuric kidney disease. Am J Physiol Renal Physiol. 2017;312:F748–F759. doi:10.1152/ajprenal.00179.2016
39. Pescovitz MD, Greenbaum CJ, Krause-Steinrauf H, et al. Rituximab, B-lymphocyte depletion, and preservation of beta-cell function. N Engl J Med. 2009;361:2143–2152. doi:10.1056/NEJMoa0904452
40. Pescovitz MD, Greenbaum CJ, Bundy B, et al. B-lymphocyte depletion with rituximab and β-cell function: two-year results. Diabetes Care. 2014;37:453–459. doi:10.2337/dc13-0626
41. Smith MJ, Simmons KM, Cambier JC. B cells in type 1 diabetes mellitus and diabetic kidney disease. Nat Rev Nephrol. 2017;13:712–720. doi:10.1038/nrneph.2017.138
42. Zheng H, Zhang Y, He J, et al. Hydroxychloroquine inhibits macrophage activation and attenuates renal fibrosis after ischemia-reperfusion injury. Front Immunol. 2021;12:645100. doi:10.3389/fimmu.2021.645100
43. Sakata K, Nakayamada S, Miyazaki Y, et al. Up-regulation of TLR7-mediated IFN-α production by plasmacytoid dendritic cells in patients with systemic lupus erythematosus. Front Immunol. 2018;9:1957. doi:10.3389/fimmu.2018.01957
44. Sacre K, Criswell LA, McCune JM. Hydroxychloroquine is associated with impaired interferon-alpha and tumor necrosis factor-alpha production by plasmacytoid dendritic cells in systemic lupus erythematosus. Arthritis Res Ther. 2012;14:R155. doi:10.1186/ar3895
45. Chen X, Sheng D, Kong X. The efficacy of hydroxychloroquine combined with Huangqi tablets in the treatment of diabetic nephropathy. J Healthc Eng. 2021;2021:7988924. doi:10.1155/2021/7988924
 © 2023 The Author(s). This work is published and licensed by Dove Medical Press Limited. The
full terms of this license are available at https://www.dovepress.com/terms
and incorporate the Creative Commons Attribution
- Non Commercial (unported, 3.0) License.
By accessing the work you hereby accept the Terms. Non-commercial uses of the work are permitted
without any further permission from Dove Medical Press Limited, provided the work is properly
attributed. For permission for commercial use of this work, please see paragraphs 4.2 and 5 of our Terms.
© 2023 The Author(s). This work is published and licensed by Dove Medical Press Limited. The
full terms of this license are available at https://www.dovepress.com/terms
and incorporate the Creative Commons Attribution
- Non Commercial (unported, 3.0) License.
By accessing the work you hereby accept the Terms. Non-commercial uses of the work are permitted
without any further permission from Dove Medical Press Limited, provided the work is properly
attributed. For permission for commercial use of this work, please see paragraphs 4.2 and 5 of our Terms.
Recommended articles
Machine Learning-Based Predictive Modeling of Diabetic Nephropathy in Type 2 Diabetes Using Integrated Biomarkers: A Single-Center Retrospective Study
Zhu Y, Zhang Y, Yang M, Tang N, Liu L, Wu J, Yang Y
Diabetes, Metabolic Syndrome and Obesity 2024, 17:1987-1997
Published Date: 10 May 2024
A Machine Learning Model for Predicting Diabetic Nephropathy Based on TG/Cys-C Ratio and Five Clinical Indicators
Zhou D, Shao L, Yang L, Chen Y, Zhang Y, Yue F, Gu W, Li S, Li S, Wei J
Diabetes, Metabolic Syndrome and Obesity 2025, 18:955-967
Published Date: 31 March 2025
Utilizing Podocyte Foot Process Morphology for the Identification of Diabetic Nephropathy with or without Minimal Change Disease: Establishment of an Artificial Intelligence-Assisted Diagnostic Model
Li X, Zhang P, Jiang S, Shang S, Zhang J, Liu J, Li C, Gao Y, Zhang H, Li W
Diabetes, Metabolic Syndrome and Obesity 2025, 18:2141-2153
Published Date: 4 July 2025
Comprehensive Analysis and Experimental Validation of Immune-Related Biomarkers and Immune Microenvironment in Diabetic Nephropathy
Zhou W, Zeng Z, Li X, Yang M
Journal of Inflammation Research 2025, 18:13711-13726
Published Date: 3 October 2025