Back to Journals » Journal of Inflammation Research » Volume 17
Cuproptosis-Related Biomarkers and Characterization of Immune Infiltration in Sepsis
Authors Wang Y, Qiu X, Liu J, Liu X, Pan J, Cai J, Liu X, Qu S
Received 2 December 2023
Accepted for publication 9 April 2024
Published 22 April 2024 Volume 2024:17 Pages 2459—2478
DOI https://doi.org/10.2147/JIR.S452980
Checked for plagiarism Yes
Review by Single anonymous peer review
Peer reviewer comments 3
Editor who approved publication: Professor Ning Quan
Yuanfeng Wang,1,* Xu Qiu,1,* Jiao Liu,1,* Xuanyi Liu,1 Jialu Pan,2 Jiayi Cai,2 Xiaodong Liu,1,3 Shugen Qu1,3
1College of Public Health and Management, Zhejiang Provincial Key Laboratory of Watershed Science and Health, Wenzhou Medical University, Wenzhou, People’s Republic of China; 2The First Clinical Medical College, Wenzhou Medical University, Wenzhou, People’s Republic of China; 3South Zhejiang Institute of Radiation Medicine and Nuclear Technology, Wenzhou, People’s Republic of China
*These authors contributed equally to this work.These authors contributed equally to this work
Correspondence: Xiaodong Liu; Shugen Qu, Email [email protected]; [email protected]
Introduction: Sepsis is a worldwide epidemic, with high morbidity and mortality. Cuproptosis is a form of cell death that is associated with a wide range of diseases. This study aimed to explore genes associated with cuproptosis in sepsis, construct predictive models and screen for potential targets.
Methods: The LASSO algorithm and SVM-RFE model has been analysed the expression of cuproptosis-related genes in sepsis and immune infiltration characteristics and identified the marker genes under a diagnostic model. Gene-drug networks, mRNA-miRNA networks and PPI networks were constructed to screen for potential biological targets. The expression of marker genes was validated based on the GSE57065 dataset. Consensus clustering method was used to classify sepsis samples.
Results: We found 381 genes associated with the development of sepsis and discovered significantly differentially expressed cuproptosis-related genes of 16 cell types in sepsis and immune infiltration with CD8/CD4 T cells being lower. NFE2L2, NLRP3, SLC31A1, DLD, DLAT, PDHB, MTF1, CDKN2A and DLST were identified as marker genes by the LASSO algorithm and the SVM-RFE model. AUC > 0.9 was constructed for PDHB and MTF1 alone respectively. The validation group data for PDHB (P=0.00099) and MTF1 (P=7.2e-14) were statistically significant. Consistent clustering analysis confirmed two subtypes. The C1 subtype may be more relevant to cellular metabolism and the C2 subtype has some relevance to immune molecules.The results of animal experiments showed that the gene expression was consistent with the bioinformatics analysis.
Discussion: Our study systematically explored the relationship between sepsis and cuproptosis and constructed a diagnostic model. And, several cuproptosis-related genes may interfere with the progression of sepsis through immune cell infiltration.
Keywords: machine learning, cuproptosis, immune infiltration, sepsis, diagnostic model
Introduction
Sepsis has a high morbidity and mortality rate, is widespread worldwide and the main cause of death is related to an overreaction and dysfunction of the body’s immune system.1 Epidemiological findings show that 48.9 million people were diagnosed with sepsis and 11 million died as a result of sepsis in 2017.2 Other than supportive care there is no other way to treat sepsis directly and effectively. A growing number of studies have demonstrated that the hyperinflammatory response caused by sepsis leads to systemic tissue and organ destruction and ultimately to multiple organ failure.3–5 Early diagnosis and intervention in sepsis are crucial to its treatment.6 Hence, there is a need to explore in greater depth the pathological processes, biomarkers, and potential drug targets related to sepsis. This will help to further enhance our understanding of the disease and reduce mortality from sepsis.
As a micronutrient, copper plays a very significant role in a variety of life activities.7 In particular, it acts as a cofactor for enzymes in mitochondrial energy metabolism.8 Copper plays an important role in the tricarboxylic acid cycle, ultimately affecting oxidative phosphorylation, cell growth, iron utilization and various other vital life processes.9,10 Moreover, the results of an epidemiological study based on a prospective cohort study showed the concentration of copper ions in the blood of people with sepsis is higher than normal.11 Related studies have shown that depletion of Fe-S cluster proteins and excessive accumulation of lipidated mitochondrial enzymes trigger mitochondrial stress and ultimately promote the development of cuproptosis.12–15 A rising number of studies indicate that deficiencies in energy metabolism and oxidative stress due to mitochondrial dysfunction may be a key pathogenetic mechanism in sepsis-induced multi-organ failure.16–18 The application of mitochondrial protectors can reduce the effects of sepsis-mediated organic damage.19 In summary, we deduced that cuproptosis is closely related to sepsis-induced multi-organ damage. However, no studies have been reported to date on the mechanisms regulating copper death in the development of sepsis, and further insightful research is needed. Thus, potential biomarkers for early diagnosis and treatment of sepsis may be obtained by further molecular characterisation of cuproptosis-related genes (CRGs).
In recent years, bioinformatics analysis has been used to explore the process of disease development and to find potential biological targets, which will help to enable early diagnosis of diseases, prognostic evaluation and treatment of diseases through drug screening.20 In this study, differentially expressed CRGs and immune profiles between normal and septicemic individuals were examined using the dataset (GSE65682). We used machine learning models to filter for key genes, construct a diagnostic model for sepsis and validate the performance of the predictive model in an external dataset(GSE57065). Potential drugs and microRNAs were predicted based on key genes in the model. We divided sepsis patients into two subtypes, analysed their CRGs expression and immune infiltration and performed GSEA analysis according to the CRGs expression landscapes. This will assist us in further elucidating the heterogeneity of sepsis. We believe our findings will provide greater insight into the characterization of cuproptosis progression in sepsis and provide potential prognostic biomarkers for the design of rational treatment regimens.
Materials and Methods
Data Source
The original expression profile data for the study was downloaded from the NCBI Gene Expression Omnibus (GEO). In this study, the GSE65682 dataset was used as the training set. The GSE57065 dataset was validated for expression of marker genes. And the detailed datasets are listed in Table 1.The GSE65682 dataset included 46 control blood samples and 760 blood samples that met the diagnostic criteria for sepsis. Specific clinical information is provided in Table S1. In addition, the GSE57065 dataset included 25 control blood samples and 82 blood samples that met the diagnostic criteria for sepsis. Specific clinical information is also shown in Table S1.
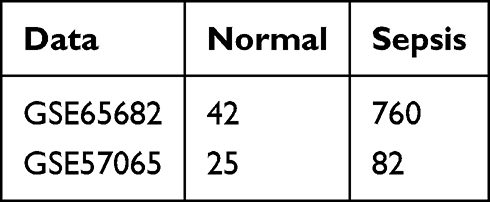 |
Table 1 Data Information |
The Drug-Gene Interaction database (DGIdb) is a database that holds a large number of drug-gene interactions and we use it to screen for drugs that interact with marker genes.Three databases, miRanda, miRDB and TargetScan, were used to analyze mRNA-miRNA interaction pairs.
Differential Expression Analysis
The limma package was applied to screen for differentially expressed cuproptosis-associated genes. If P < 0.05 and |logFC| > 1 will be identified as differentially expressed genes (DEGs).21
Weighted Gene Co-Expression Network Analysis (WGCNA)
WGCNA was performed for the identification of co-expression modules using the R package “WGCNA”.22 To guarantee accurate results, the top 25% of genes with the highest variance were utilized for subsequent WGCNA analyses. To construct a weighted adjacency matrix, an optimal soft power was selected. This was then transformed into a topological overlap matrix (TOM). Relying on the hierarchical clustering tree algorithm, TOM dissimilarity measure (1-TOM) was used to acquire modules, where minimum module size was set as 100. A random color was designated to every module. The global gene expression profiles were each represented by module eigengenes. Module Significance (MS) described the relationship between the modules and the disease status. Gene Significance (GS) was stated as the correlation between a gene and the clinical phenotype.
Functional Enrichment
Gene ontology (GO) analysis can reveal molecular functions (MF), biological processes (BP) and cellular components (CC) based on gene sets. In addition, KEGG can suggest possible cellular signalling pathways, biological processes, and more. Based on sepsis-related DEGs and differentially expressed genes associated with cuproptosis, analyses were performed using the cluster Profiler package in R.23 P < 0.05 was used as a significant enrichment threshold.
Immune Infiltration Analysis
Using the CIBERSORT algorithm and the LM22 feature matrix, the corresponding ratios of the 22 immune cell types in each sample can be estimated.Only specimens with P < 0.05 were regarded as an accurate fraction of immune cells.24
Correlation Analysis Between CRGs and Infiltrated Immune Cells
The correlation coefficient between CRGs expression and the relative percentage of immune cells was analyzed using the Spearman correlation coefficient, with p < 0.05 indicating a relevant correlation. The conclusion was presented using the R package “corrplot”.
Identifying the Best Diagnostic Genetic Biomarkers for Sepsis
The least absolute shrinkage and selection operator (LASSO) algorithms is exerted in the glmnet package to decrease the dimensionality of the data.25,26 For feature selection, LASSO algorithms were used to identify gene biomarkers for sepsis by retaining the differently expressed CRGs between patients with sepsis and normal samples. At the same time, the SVM package was used to construct models to screen for key genes.27 The crossover genes obtained by the two algorithms were considered as the best marker genes and logistic regression models were constructed for the diagnosis of the disease. The diagnostic power of the logistic regression model was then assessed using ROC curves.
Single-Gene Gene Set Enrichment Analysis (GSEA) Enrichment Analysis
This analysis is implemented in the GSEA package in R. To further explore the related pathways of the marker genes, the correlation between the marker genes and all the other genes in the GSE65682 data set was calculated. Then, all the genes were sorted from the top to the bottom according to their correlations, and these sorted genes were contemplated to be tested. In addition, the GSEA analysis in our study was implemented based on the gene set of KEGG.28
Single-Gene Gene Set Variation Analysis (GSVA) Enrichment Analysis
GSVA package based gene set variation analysis was implemented.29 We performed GSVA analysis for each marker gene. Differences in scores between high and low expression groups of marker genes were analysed using the limma package. If |t| > 2, P < 0.05, we consider the two to be different. And t > 0 means that the pathway is promoted in the high expression group. Conversely, t < 0 means that the pathway is upregulated in the low expression group.
GeneMANIA Analysis
GeneMANIA (http://genemania.org) is a flexible, user-friendly website to hypothesize gene function, analyze gene lists and prioritize genes to be tested functionally. Using the identified genetic biomarkers as a gene list, GeneMANIA finds functionally similar genes based on genomic and proteomic data. In this mode, it weights each functional genomic dataset in accordance with its predictive value for the query.30
Unsupervised Clustering of Patients with Sepsis
According to the characteristics of the 14 differentially expressed CRGs, we performed an unsupervised cluster analysis using the “ConsensusClusterPlus” R package,31 grouping the 760 sepsis samples into different clusters using the k-means algorithm with 1000 iterations.
Animal Grouping and Model Establishment
C57BL/6JGpt mice(Strain NO. N000013) were purchased from GemPharmatech (Nanjing, China). Ten 12-week-old C57BL/6JGpt male mice(wydw2023-0561) were randomly divided into two groups, labeled and weighed.Mice in the experimental group were injected LPS (lipopolysaccharide) into the intraperitoneal cavity at the dose of 0.01mg LPS/g, and the control group was injected with the corresponding dose of normal saline for 24 hours.Blood was collected from the eyeballs of mice 24 hours later for follow-up experiments. The experiment has been approved by the Animal Ethics Committee of Wenzhou Medical University.
Materials and Reagents
RNAiso Blood(Takara)(9112), PrimeScript™ RT reagent Kit with gDNA Eraser (Perfect Real Time)(Takara)(RR047A), Mouse CRP(C-Reactive Protein) ELISA Kit(Sangon Biotech)(JL47089), 2X SanTaq PCR Master Mix (with Blue Dye)(Sangon Biotech)(B532061-0005).
Experimental Method
Each mouse was scored according to the scoring scale (Table S2) at 2, 4, 8, 12 and 24 hours after injection of LPS. Then we analyzed the score. Centrifuge mouse blood, perform the operation according to the instructions of C-reactive protein ELISA kit, centrifuge the blood sample according to the instructions, take the supernatant, and dilute it five times. Each sample is made three multiple holes, and finally converted into concentration according to absorbance, multiplied by five, and analyzed.Another 40ul of blood was taken from each mouse and divided into two tubes of 20ul each. Blood count results were measured using SYSMEX-XN-1000 with 20ul of whole blood in 140ul of diluent. The sending agency measures the number of various types of cells in the blood for analysis.After extracting RNA from mouse plasma, reverse transcription and amplification, gel electrophoresis was performed, and the trend of the results was calculated by gray value analysis. Primer sequences are listed in Table S3.
Statistical Analysis
All of the analyses were carried out using R version 4.2.1, 64-bit6 and its support package. To test the correlation between two groups of continuous parameters, the non-parametric Wilcoxon rank-sum test was used. Correlation coefficients were examined using Spearman correlation analysis. And, P < 0.05 was considered to be statistically significant. The glm package is used to build logistic regression models. The receiver operating characteristic curve (ROC) and the area under the curve (AUC) are used to evaluate the effectiveness of the model. And PCA plots using the ggplot2 package.
Results
Identification of DEGs in GSE65682
A total of 1058 DEGs were identified from the screening of whole blood-derived RNA samples from both normal controls and septic patients. The genes ABLIM1, CD96, CD160, GATA3, NMT2, PTCH1 were down-regulated (Figure 1A, green dots) and MAPK14, SRPK1, S100A8, TXN, UPP1 were up-regulated (Figure 1A, red dots). Figure 1B shows 50 up-regulated genes and 50 down-regulated genes by heatmap.
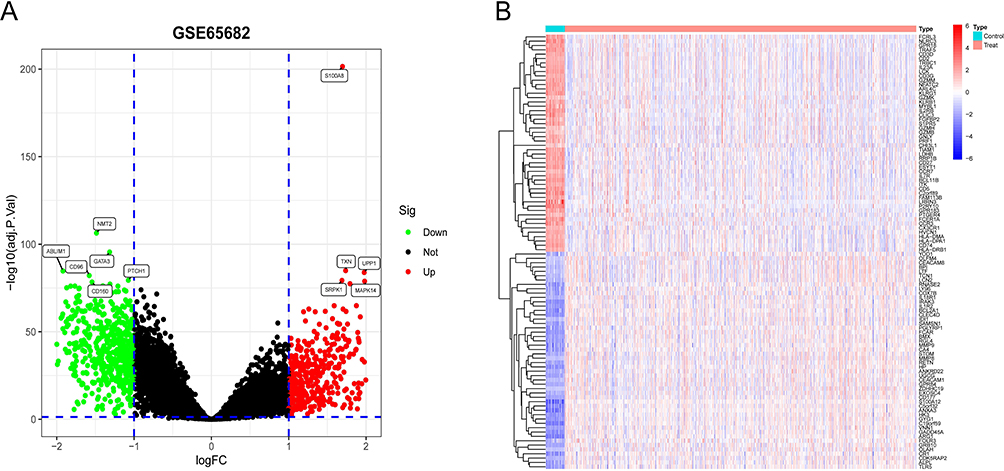 |
Figure 1 Profile of differentially expressed genes in both sepsis patients and controls. (A)Volcano plot in GSE65682. Green nodes represent downward modulation; red nodes indicate upward modulation; black nodes indicate no significant difference. (B)The expression of 100 DEGs in septicemic and control samples is represented in the form of a heatmap, with red representing up-regulation and blue representing down-regulation. |
Screening of Gene Modules and Construction of Co-Expression Networks
We constructed co-expression networks and modules for normal and sepsis samples and selected the genes with the highest 25% variation for further analysis. Further, we set the scale-free R2 to 0.9 and screened for soft power(soft power = 7), at which point the co-expressed gene modules were able to be successfully identified. (Figure 2A). Subsequently, we obtained eight co-expression modules in different colours and the topological overlap matrix (TOM) heat map is shown (Figure 2B–D). We found that the blue module was most strongly associated with sepsis and that P < 2e-73, the module contained a total of 585 genes (Figure 2E and F).
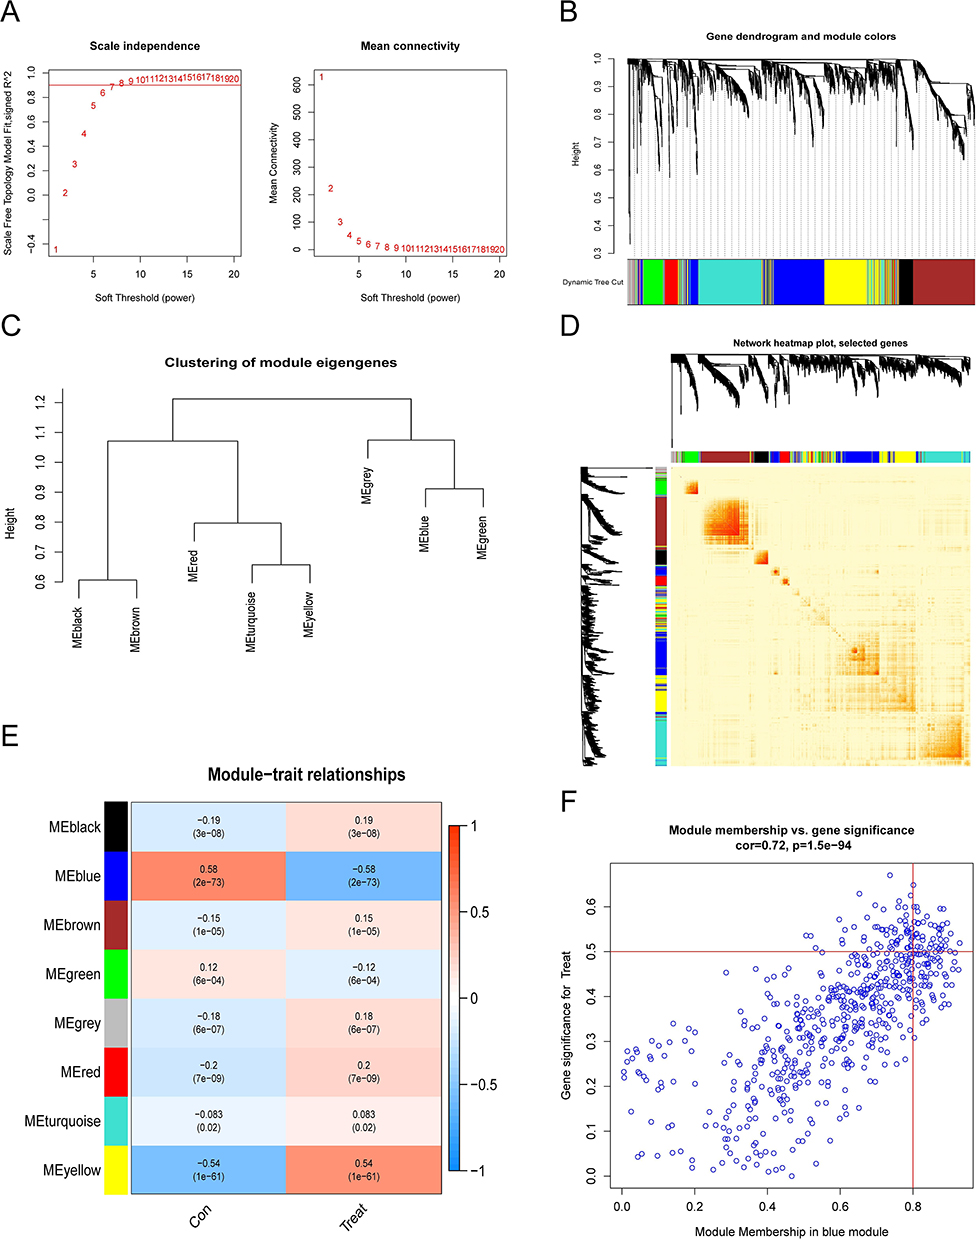 |
Figure 2 Co-expression network of differentially expressed genes in sepsis. (A)The choice of the soft threshold of power. (B) Dendrogram of co-expression module clusters. And, co-expression modules were represented by different colours. (C) Representative clusters of modular autologous genes. (D)Representative heatmap. (E)Correlation analysis of module-related genes with clinical traits (normal and sepsis). Rows represent modules, columns represent clinical traits and numbers in brackets are p-values. (F) Scatter plot. |
Functional Annotation of Sepsis-Associated Genes
We obtained 381 genes by taking the intersection of the differentially expressed genes and the modular genes obtained by WGCNA (Figure 3A). Next, these genes were analysed by KEGG and GO for functional annotation. In the KEGG analysis (Figure 3B), the first 30 enrichment pathways were mainly Th17 cell differentiation, T cell receptor signaling pathway, PD−L1 expression and PD−1 checkpoint pathway in cancer, etc. In the GO-BP analysis (Figure 3C), the main pathway is also lymphocyte differentiation(GO:0030098). In GO-CC analysis (Figure 3C), the external side of the plasma membrane(GO:0009897) and immunological synapse(GO:0001772) were significantly enriched. The results of GO-MF (Figure 3C) are also mainly related to immunological processes. Thus, the enrichment analysis results indicated that the activation and regulation of cell death and resistance to infection may be of vital importance in sepsis.
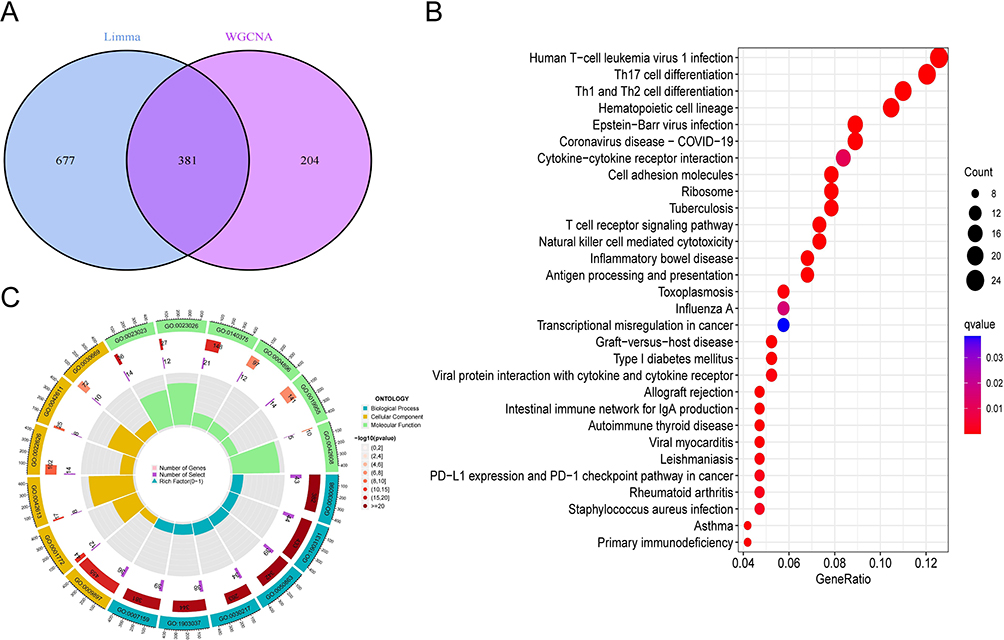 |
Figure 3 Enrichment analysis of sepsis-associated genes. (A)Intersection of the DEGs and modular genes of WGCNA. (B)Top 30 KEGG pathway. (C)Top 6 GO(GO-BP, CC, MF) pathway. |
Expression of CRGs, Biological Function and Immune Infiltration in Patients with Sepsis
To further explore the biological role of CRGs in the development of sepsis and in causing multi-organ damage, we investigated the expression of 19 CRGs in GSE65682. The 14 CRGs were eventually identified as differentially expressed cuproptosis genes. NFE2L2, FDX1, LIAS, LIPT1, DLAT, PDHA1, PDHB, GLS, CDKN2A and DLST gene expression levels were greatly lower in the sepsis samples than in the non-sepsis controls. And, NLRP3, SLC31A1, DLD and MTF1 expression levels were upregulated in the sepsis samples (Figure 4A–C). Furthermore, we analysed the correlation of differentially expressed CRGs, which will be useful in revealing the mutual regulation of CRGs in sepsis. The results showed that DLAT and DLD exhibited a strong synergistic effect and that NFE2L2 and SLC31A1 had a definite antagonistic effect (Figure 4D and E). The immune system plays a crucial role in the development of sepsis, so an immune infiltration analysis was performed based on the CIBERSORT algorithm for differences to detect differences in the percentages of 22 infiltrating immune cell types between sepsis samples and non-sepsis control samples (Figure 4F). The results showed significant differences in the proportions of immune cells such as naïve B cells, B cells memory, plasma cells, T cells CD8, Monocytes and Dendritic cells resting, etc. Meanwhile, the correlation analysis showed that CRGs were associated with immune cells such as the activation of NK cells and the activation of CD4 memory in T cells, etc. (Figure 4G). These results indicate that CRGs may be crucial factors regulating the molecular and immune aggressiveness state in sepsis patients.
 |
Figure 4 Differential expression and function of CRGs in sepsis, immune infiltration in patients with sepsis. (A)Boxplots showed the expression of CRGs between sepsis and non-sepsis controls. (B)The heatmap shows the expression patterns of 14 differentially expressed CRGs. (C)Chromosomes locations of the 19 CRGs. (D)Correlation analysis, red represents positive correlations, green represents negative correlations, and the correlation coefficient is represented by the area of the pie chart. (E)Correlation analysis of the 14 differentially expressed CRGs is represented by chord plots. (F)Differences in immune infiltration between sepsis and non-sepsis controls were shown in boxplots. (G) Correlation analysis between 14 differentially expressed CRGs and infiltrating immune cells. Enrichment analysis of differentially expressed CRGs in sepsis. (H)GO pathway. (I)KEGG pathway. *P < 0.05,**P < 0.01,***P < 0.001. |
The effect of differentially expressed CRGs in the development of sepsis was explored by GO and KEGG analysis. It was shown in GO enrichment analysis that these genes play a major role in the acetyl-CoA metabolic process, mitochondrial matrix and oxidoreductase activity (Figure 4H). In addition, the Citrate cycle (TCA cycle), Carbon metabolism and Pyruvate metabolism were the main enrichment results in the KEGG analysis (Figure 4I).
Identification of Diagnostic Genes and Construction of Models
We constructed diagnostic models for differentiating septicemic samples from non-septic control samples based on differentially expressed CRGs. The LASSO and SVM-RFE algorithms were used in the GSE65682 dataset to screen for important differentially expressed CRGs to differentiate between sepsis patients and normal individuals. The LASSO logistic regression algorithm was applied to identify 10 sepsis-related features. The penalty parameters were tuned by 10-fold cross-validation (Figure 5A and B). Meanwhile, we filtered 11 genes(maximal accuracy =0.994, minimal RMSE =0.006) out of 14 differentially expressed CRGs as optimal signature genes in the SVM-RFE algorithm (Figure 5C). The genes screened by the two algorithms were intersected to obtain a total of 9 genes (NFE2L2, NLRP3, SLC31A1, DLD, DLAT, PDHB, MTF1, CDKN2A, DLST) as the final identified genes for subsequent analysis (Figure 5D). ROC curves were generated for each marker gene in an attempt to explore the ability of individual genes to distinguish sepsis samples from normal samples (Figure 5E). Each gene had an AUC greater than 0.6 and some had an AUC greater than 0.9(PDHB, AUC=0.970; MTF1, AUC=0.974). In addition, using the 9 marker genes mentioned above, we constructed logistic regression models using the R package glm. Using ROC curves, logistic regression models based on 9 markers discriminated between normal and septic samples with AUC=1.000 (Figure 5F). The final results showed that the accuracy and specificity of the logistic regression model was superior to that of individual marker genes.
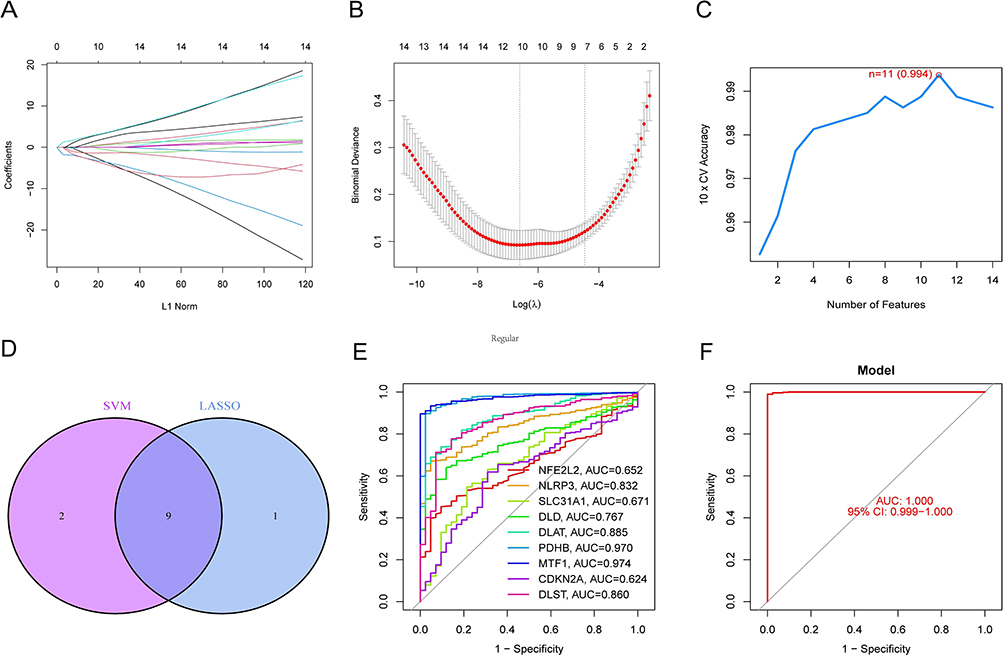 |
Figure 5 Identification of diagnostic genes and construction of models. (A and B) Ten sepsis-related features were selected by 10-fold cross-validation using the LASSO logistic regression algorithm with penalized parameter adjustment. (C)11 genes were screened as signature genes for sepsis using the SVM-RFE algorithm. (D)The intersection was identified as the maker genes for which the diagnostic model was constructed. (E)ROC curves for 9 marker genes. (F)ROC curve for the logistic regression model. |
Marker Genes Have Been Associated with a Variety of Pathways in the Development of Sepsis
We used a GSEA-KEGG single-gene analysis pathway to analyse the biological functions of marker genes. The enrichment pathway for the top 6 of each marker gene is shown in the figure (Figure 6A–I). Our analysis has revealed that these marker genes are associated with the cell cycle, oxidative phosphorylation, immune response(Natural killer cell-mediated cytotoxicity and Presentation and handling of antigens), multiple organelles(Ribosomes, Spliceosomes and lysosomes), anabolism of substances(DNA replication, Pyrimidine metabolism and Histidine metabolism), various diseases(Parkinson’s disease, Asthma, Primary immunodeficiency disease, Type 1 diabetes, Systemic lupus erythematosus and Autoimmune thyroid disease) and numerous cellular signaling pathways(Nod-like receptor signaling pathway, Toll-like receptor signaling pathway, Neurotrophin signaling pathway and T-cell receptor signaling pathway).
 |
Figure 6 GSEA-KEGG single-gene analysis pathway in CDKN2A(A), DLAT(B), DLD(C), DLST(D), MTF1(E), NFE2L2(F), NLRP3(G), PDHB(H) and SLC31A1(I). |
Using GSVA analysis, we examined the signaling pathways that were differentially activated between the high and low expression groups. We found that overexpression of CDKN2A-activated processes such as GLYCOSPHINGOLIPID BIOSYNTHESIS LACTO AND NEOLACTO SERIES, STARCH AND SUCROSE METABOLISM, LINOLEIC ACID METABOLISM. However, low expression of CDKN2A in sepsis may contribute to the development of this disease through ONE CARBON POOL BY FOLATE, INTESTINAL IMMUNE NETWORK FOR IGA PRODUCTION (Figure 7A). The low expression group of DLAT was enriched in BASAL TRANSCRIPTION FACTORS, VALINE LEUCINE, AND ISOLEUCINE BIOSYNTHESIS (Figure 7B). Low expression of DLD is associated with TERPENOID BACKBONE BIOSYNTHESIS, O GLYCAN BIOSYNTHESIS and high expression is associated with PRIMARY IMMUNODEFICIENCY, TYROSINE METABOLISM (Figure 7C). Low expression of DLST in disease activates GLYCOSAMINOGLYCAN BIOSYNTHESIS KERATAN SULFATE, GLYCOSAMINOGLYCAN BIOSYNTHESIS CHONDROITIN SULFATE, but the high expression is only strongly correlated with FOLATE BIOSYNTHESIS (Figure 7D). Notably, high expression of MTF1 is associated with diseases such as AUTOIMMUNE THYROID DISEASE, TYPE I DIABETES MELLITUS and GRAFT VERSUS HOST DISEASE that has a relevant association with sepsis. However, at low MTF1 expression, it is mainly associated with STARCH AND SUCROSE METABOLISM (Figure 7E). The low-expression group of NFE2L2 was predominantly enriched in GLYCOSAMINOGLYCAN BIOSYNTHESIS CHONDROITIN SULFATE and enriched in DRUG METABOLISM CYTOCHROME P450 in the high-expression group (Figure 7F). The highly expressed NLRP3 plays a central role in the anabolism of substances(DNA REPLICATION, MISMATCH REPAIR, TYROSINE METABOLISM, BIOSYNTHESIS OF UNSATURATED FATTY ACIDS) (Figure 7G). Interestingly, low expression of PDHB is mainly enriched with amino acid biosynthesis and metabolisms such as VALINE LEUCINE AND ISOLEUCINE BIOSYNTHESIS, BETA-ALANINE METABOLISM and OTHER GLYCAN DEGRADATION (Figure 7H). In addition, SLC31A1 expression was upregulated in sepsis samples, closely related to PRIMARY IMMUNODEFICIENCY, GLYCOSAMINOGLYCAN BIOSYNTHESIS KERATAN SULFATE (Figure 7I).
 |
Figure 7 Combinations of marker genes corresponding to CDKN2A(A), DLAT(B), DLD(C), DLST(D), MTF1(E), NFE2L2(F), NLRP3(G), PDHB(H) and SLC31A1(I) expression levels were divided into high expression group and low expression group. Red represents the high-expression group of the gene and green represents the low-expression group of the gene. |
Multiple Interaction Networks Based on Marker Genes
In order to screen for potential drugs for sepsis treatment, we filtered through the DGIdb database based on marker genes. The results are visualised using Cytoscape software as follows (Figure 8A). In the DGIdb database, five of the marker genes(NFE2L2, NLRP3, SLC31A1, MTF1, CDKN2A) had interacting drugs. Unfortunately, the remaining marker genes were not queried for information on interacting drugs. The miRanda, miRDB and TargetScan databases are used to screen for miRNAs that interact with mRNAs of marker genes. And we use Cytoscape software for visualisation (Figure 8B). The miRNAs interacting with the nine marker genes are presented. The details of the network are shown in “gene-miRNA.txt”. In addition, we constructed Protein-Protein Interaction Networks based on the GeneMANIA database by using marker genes (Figure 8C). In the generated PPI network, proteins are presented as nodes, with differently coloured lines between the nodes representing specific meanings.
 |
Figure 8 Interaction networks. (A)Prediction of marker gene‐targeted drugs. Red nodes represent genes up-regulated in sepsis samples, green nodes represent genes down-regulated in sepsis samples and blue nodes represent drugs that have interactions with the target gene. (B)The gene-miRNA action network. The red nodes represent marker genes and the blue nodes represent miRNAs that interact with the genes. (C)PPI network. Nodes represent proteins. The connecting lines represent network types and the colour of the node represents the enriched function. |
Expression of Marker Genes in the Validation Set
To make our experimental results more realistic and credible, we confirmed marker genes expression in the GSE57065 dataset. The results demonstrated that the expression trends for PDHB, DLAT, DLD, DLST, MTF1, SLC31A1 and NLRP3were consistent with the data from GSE65682 and were statistically significant (Figure 9A–G). The expression trend of CDKN2A was not statistically significant (Figure 9H). And the expression trend of NFE2L2 was opposite to that of the GSE65682 dataset (Figure 9I).
 |
Figure 9 Marker genes’ expression in the GSE57065 dataset. PDHB(A), DLAT(B), DLD(C), DLST(D), MTF1(E), SLC31A1(F), NLRP3(G), CDKN2A(H) and NFE2L2(I). |
The Differences in Expression of CRGs, Immune Infiltration Characteristics and Functions Between the Two Subtypes
The results in the above validation experiments differed somewhat from the analytical findings. We speculate that this may be related to the category of gene chips or the heterogeneity of sepsis. Therefore, based on the expression profiles of 14 differentially expressed CRGs, we attempted to explore the heterogeneity of sepsis by clustering sepsis samples using a consensus clustering method. Based on the combined scoring of the clusters, the optimum number of subtypes was determined to be 2 and was shown in the consensus matrix (Figure 10A), and representative cumulative distribution function (CDF) curves, triangular CDF area plots, consensus clustering scores, and range plots (Figure 10B-E). We named the two subtypes C1 and C2, respectively, and used the PCA plot to represent the distribution of the two subtypes (Figure 10F).
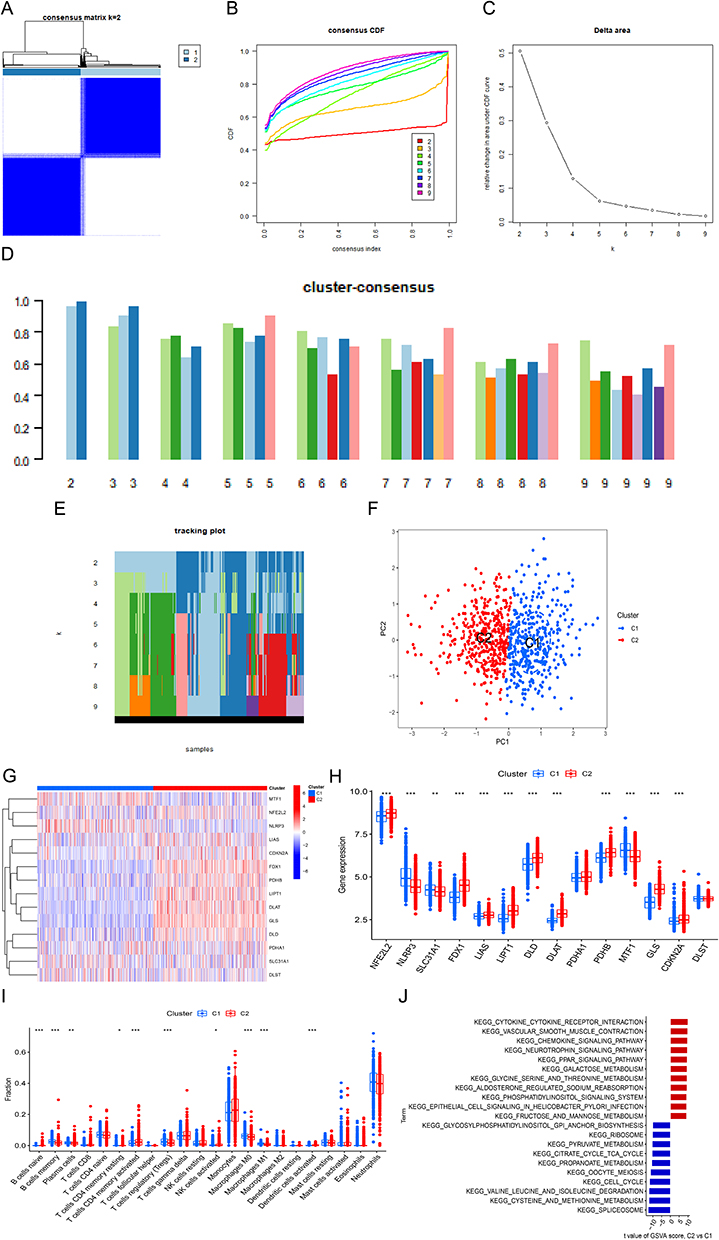 |
Figure 10 The differences in expression of CRGs, immune infiltration characteristics and functions between the two subtypes. (A)Consensus clustering matrix when k = 2. (B)The cumulative distribution function (CDF) curve. (C)CDF delta area curves. (D) Consensus clustering and trajectory plot scores for k = 2–9. (E) Pattern classification trajectories for k=2-9. (F)The PCA diagram represents the effective division of sepsis samples into two subtypes (C1 and C2). (G)Heatmap is used to represent the expression of CRGs between the two subtypes. (H)The expression of CRGs between the two subtypes is represented by boxplots. (I)The differences were shown in immune infiltrating between the two subtypes. (J)Ranked by GSVA t value, differences in biological functions between C1 and C2 subtypes. Blue represents the C1 subtype and red represents the C2 subtype.*P < 0.05,**P < 0.01,***P < 0.001. |
We first analyzed the expression of CRGs between the two subtypes, showing that the expression of NLRP3, SLC31A1 and MTF1 was higher in the C1 subtype and that NFE2L2, FDX1, LISA, LIPT1, DLD, DLAT, PDHB, GLS and CDKN2A were upregulated in the C2 subtype (Figure 10G-H). In addition, immunological infiltration analysis between the two subtypes showed that the C1 subtype exhibited higher B-cell memory, Plasma cells, Macrophages M0 and Macrophages M1 (Figure 10I). Moreover, GSVA analysis between the two subtypes showed that the C1 subtype was predominantly enriched in SPLICEOSOME, CYSTEINE AND METHIONINE METABOLISM, VALINE LEUCINE AND ISOLEUCINE DEGRADATION and the C2 subtype was enriched in CYTOKINE CYTOKINE RECEPTOR INTERACTION, VASCULAR SMOOTH MUSCLE CONTRACTION and CHEMOKINE SIGNALING PATHWAY (Figure 10J). In conclusion, we found that the C1 subtype may be more relevant to cellular metabolism and the C2 subtype has some relevance to immune molecules.
Animal Experiments Verified the Expression of CRGs
We constructed sepsis models by intraperitoneal injection of LPS in the mice grouped equally according to body weight (Figure 11A). The results showed that c-reactive protein levels were elevated in the serum of sepsis mice, and the observational index scores increased with time (Figure 11B–C). In addition, peripheral blood cell analysis showed that sepsis mice had significantly higher levels of neutrophils and lower levels of monocytes (Figure 11D–E).In an examination of the expression of CRGs in serum samples, we found that the expression of Dld, Dlst, Nlrp3, Nfe2l2, and Slc31a1 was up-regulated in sepsis mice (Figure 11F).
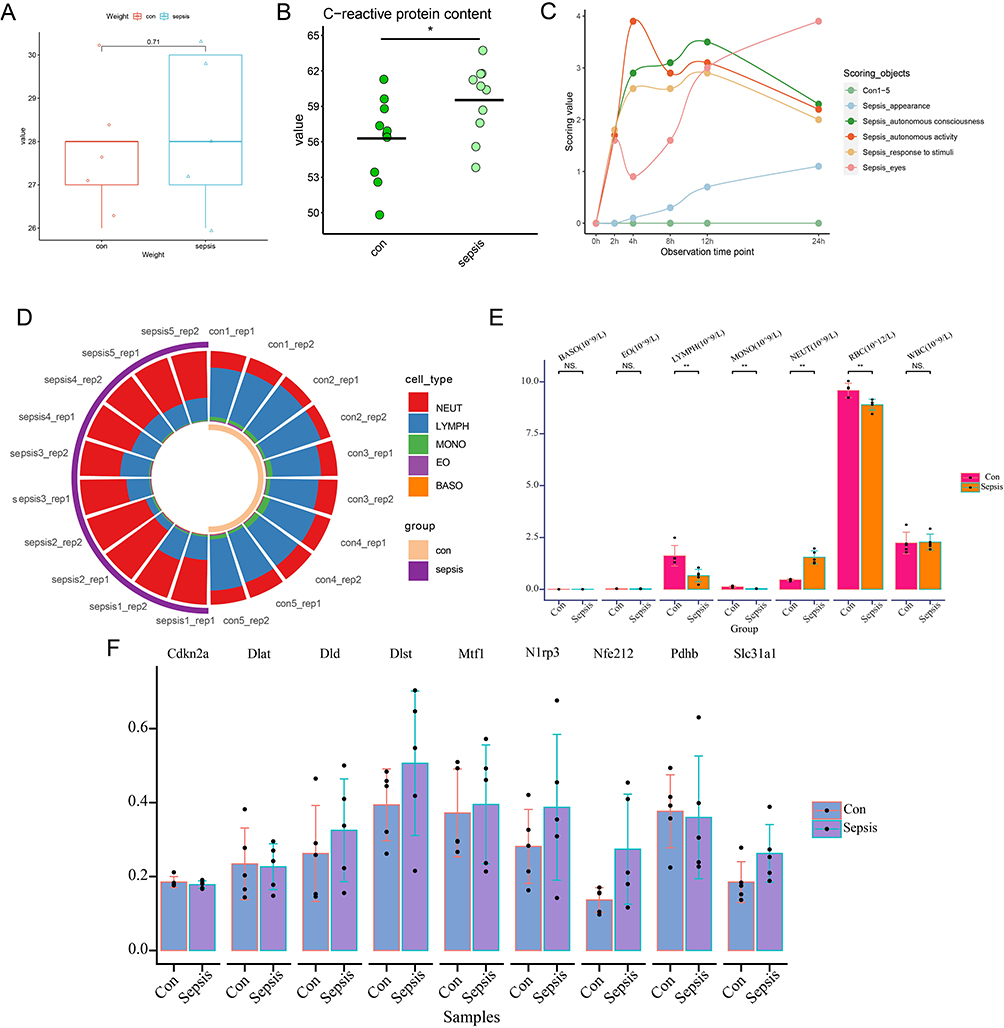 |
Figure 11 Animal experiments verified the expression of CRGs. (A) Comparison of body weights of control and sepsis group mice. (B) Comparison of c-reactive protein in serum of control and sepsis mice. (C) Curves of change in observational index scores over time in control and sepsis group mice. (D) Blood cell ratio chart. (E) Comparative analysis of differences in blood cells. (F) Differential analysis of CRGs expression in serum of control and sepsis mice. *P < 0.05,**P < 0.01,***P < 0.001. |
Discussion
Sepsis has a high morbidity and mortality rate, with multiple organ dysfunction, and can even develop into septic shock.32 A growing number of studies have concluded that disturbances in substance and energy metabolism are highly relevant to the progression of sepsis.33–35 And cuproptosis is closely linked to the TCA cycle.36 Therefore, it is reasonable to assume that cuproptosis may play a vital role in the disease progression of sepsis, multi-organ damage and other processes. We now note that former studies did not examine the relevance between CRG and sepsis’s advancement.Strikingly, many CRGs were differentially expressed between septic and normal samples, and most of these genes were associated with immune function and may influence sepsis typing. This suggests a potential role for cuproptosis in sepsis.
In recent years, our understanding of sepsis which is a systemic, complex and systemic disease is still incomplete. The key biological processes underlying disease progression need to be further explored. Therefore, we took intersections of differentially expressed genes between sepsis patients and healthy individuals and genes screened by the WGCNA method as disease-related genes. This not only helps to pick out latent diagnostic biomarkers and therapeutic targets of sepsis, but also helps to further clarify the molecular mechanism of sepsis pathogenesis.We picked out 381 genes as relevant for sepsis and analysed their function. Cytokines are important in organ damage due to sepsis. The use of appropriate inhibitors can provide some protection during the acute phase of sepsis.37 Platelet MHC class I in sepsis inhibits CD8+ T-cells and exacerbates sepsis injury.38 The results of these studies are consistent with our functional enrichment results. In addition, we have revealed a number of other cellular signaling pathways that may be involved in the development of sepsis and may be able to provide new ideas for mitigating organ damage due to sepsis.
Moreover, we observed differences in the expression of CRGs, kind and abundance of immune cell population infiltration between the two groups.This shows that immune cells take significant part in sepsis and that CRGs may play a regulatory role in immune cells. It has been shown that depletion of B-cell memory contributes to sepsis-induced immunosuppression and exacerbates disease damage and that reduced circulating B-cell and IgM levels are associated with reduced sepsis survival.39,40 During sepsis, the systemic inflammatory reaction induced by circulating intrinsic immune cells also affects tissue-resident immune cells, compromising vital organ function.41 T-cell CD8 and T-cell CD4 dysfunction and decreased cell counts in sepsis patients.42 In our study, the memory of B cells, plasma cells, M0 macrophages, and monocytes was significantly higher in sepsis samples than in controls. The relative frequencies of CD8 T cells and CD4 T cells were significantly reduced. Although T cells gamma delta have been shown to be a specialized antigen-presenting cell, the antigen-presenting function of T cells gamma delta is severely impaired in patients with sepsis.43 In our study, there was more T cell gamma delta in sepsis samples than in normal samples. We speculate that this may be related to a compensatory increase following impaired antigen presentation function. Notably, in a relevance analysis that between CRGs and immune cell infiltration, we found a significant negative correlation between NFE2L2(Nrf2) and infiltration of neutrophils.This is consistent with the conclusion that inhibition of the NLRP3-GSDMD pathway using melatonin activation of the Nrf2/HO-1 signaling axis alleviated acute lung injury in sepsis characterised by neutrophil infiltration.44 In our study, numerous results have shown that the expression of CRGs correlates significantly with the infiltration of multiple immune cells. Thus CRGs may play a key role in the regulation of the immune microenvironment in sepsis.
Furthermore, we used two machine learning algorithms to identify 9 marker genes (NFE2L2, NLRP3, SLC31A1, DLD, DLAT, PDHB, MTF1, CDKN2A, DLST) and construct a diagnostic model. NFE2L2 is a key regulator of cellular redox homeostasis. It plays a critical role in the regulation of mitochondrial function.45 Clinical studies have found that the NFE2L2’s mRNA levels have a negative relation to the inflammation of the lungs and the severity of the disease in patients with sepsis.46 And NLRP3 is a cytosolic innate immune signaling receptor that promotes inflammatory vesicle formation and induces inflammatory cellular scavenging. It is also associated with auto-inflammation and autoimmune diseases.47,48 In addition, the NLRP3 inflammasome activates interleukin 1β (IL-1β).Then interleukin 1β (IL-1β) damages cardiac ability in patients with sepsis.49 SLC31A1 is a copper transporter protein and upregulation of ATF3/SPI1/SLC31A1 signaling. Copper homeostasis and promote cuproptosis50 would be disrupted by SLC31A1. FDX1, DLD, DLAT and PDHB are the lipoic acid way’s core genes and their low expression in ovarian tissue would promote cuproptosis.51 According to the report, MTF1 is a Cys2-His2 zinc finger protein that is closely related to intracellular metal metabolism and metal homeostasis and is involved in the regulation of cuproptosis.52,53 CDKN2A is a cell cycle control gene and its absence disrupts glucose homeostasis.54 DLST is the E2 component of the alpha-ketoglutarate (αKG) dehydrogenase complex, which controls the entry of glutamine into the tricarboxylic acid cycle (TCA) for oxidative decarboxylation.55 In our study, the expression trends of genes for which the function of sepsis development has been clarified (NFE2L2 and NLRP3) are consistent with the above experimental findings. However, the effect of sepsis’ other genes (SLC31A1, FDX1, DLD, DLAT, PDHB, MTF1, CDKN2A and DLST) has not yet been revealed and further studies are needed. Nonetheless, our findings support that they promote cuproptosis in sepsis samples and that cuproptosis may be a cause of multi-organ damage.The diagnostic model we have developed is able to accurately identify sepsis in the dataset and provides new insights into the diagnosis of sepsis. Next, our marker gene-based ssGSEA and GSVA have a significant meaning for the molecular mechanisms of sepsis and cuproptosis.
In order to search for drugs and latent biomarkers for the therapy of sepsis, we analysed the gene-drug network, the mRNA-miRNA network, and the PPI network. Some of these drugs have been shown to be effective in the treatment of sepsis such as ETODOLAC,56 KETOCONAZOLE57 and TRAMETINIB.58 According to the report, miRNA dysregulation plays a role in sepsis.59 It has been demonstrated that exosomal miR-30d-5p of neutrophils induces M1 macrophage polarization and triggers macrophage scorching in sepsis-associated acute lung injury.60 And, exosomal miR-1-3p in sepsis leads to endothelial cell dysfunction by targeting SERP1.61 Surprisingly, these studies are consistent with the results predicted by our mRNA-miRNA network. Therefore, we can prospectively study selected drugs and miRNAs to explore whether they can have some effect on the treatment of sepsis. Moreover, the PPI network provides us with additional targets for action that can be explored.
Interestingly, we found a loss of differential significance for CDKN2A and NLRP3 in the validation set data. NFE2L2 showed the opposite trend. The expression trends of other genes were consistent with the original results. We believe this may be due to the different patient sources of the two transcriptomic data, the difference in assay methods and the staging of sepsis.
Therefore, We chose to explore the heterogeneity of sepsis, dividing it into two subtypes (C1 and C2) based on differentially expressed CRGs. And, we found that the C1 subtype may be more relevant to cellular metabolism and the C2 subtype has some relevance to immune molecules. At present, studies have revealed the relationship between sepsis and glutamine metabolism,62 and this will affect the tolerance of sepsis. In addition, the activation of some immune molecules will aggravate the damage of sepsis.63 However, the relationship between the two subtypes and the prognosis of sepsis still needs to be explored in more sophisticated experiments. This may help inform the implementation of personalised and precise treatment for different subtypes of sepsis, and hopefully improve the cure rate of the disease.
Finally, there are some limitations to our experiment. Due to the limitation of the number of experimental samples and the method of sepsis modelling, the expression of the genes in mice may be somewhat different in humans.
Conclusions
In conclusion, our results suggest that cuproptosis is critical in the progression of sepsis and may able to regulate the immune microenvironment of sepsis. We have screened some potential drugs and targets, which may have a positive effect on the treatment of sepsis.
Availability of Data and Materials
The dataset analyzed in the current study is available on GEO database. In addition, according to China’s “Measures for Ethical Review of Life Science and Medical Research Involving Humans”, our research involving humans meets the relevant requirements for ethical approval exemption. The original contributions presented in the study are included in the article/Supplementary Material. Further inquiries can be directed to the corresponding author.
Animal and Ethical Matters
The study was approved by the Animal Ethics Committee of Wenzhou Medical University(Ethics approval number: wydw2023-0561). The research followed Laboratory animals—Guideline ethical review of animal welfare (GB/T 35892-2018). In addition, all operations on laboratory animals are carried out in accordance with the Measures for the Management of Laboratory Animals of Zhejiang Province (Zhejiang Provincial Government Order No. 263).
Acknowledgments
Yuanfeng Wang, Xu Qiu and Jiao Liu are co-first authors for this study. We appreciate the National Natural Science Foundation of China and the National Innovative Training Program for college students. We acknowledge the editors and reviewers for their helpful comments on this paper.
Author Contributions
YF wrote and submit the manuscript. QX, LJ collected and analyzed data. JL, JY, XY made key changes to the manuscript and drew pictures. XD and SG provide ideas and participated in the coordination of the study and reviewed the manuscript. All authors made a significant contribution to the work reported, whether that is in the conception, study design, execution, acquisition of data, analysis and interpretation, or in all these areas; took part in drafting, revising or critically reviewing the article; gave final approval of the version to be published; have agreed on the journal to which the article has been submitted; and agree to be accountable for all aspects of the work.
Funding
This work was funded by the National Natural Science Foundation of China (82103774). In addition, this work was also funded by the National Innovative Training Program for college students (202310343013).
Disclosure
All authors declare that they have no conflict of interest.
References
1. Kim SY, Kim D, Kim S, et al. Mycobacterium tuberculosis Rv2626c-derived peptide as a therapeutic agent for sepsis. EMBO Mol Med. 2020;12(12):
2. Rudd KE, Johnson SC, Agesa KM, et al. Global, regional, and national sepsis incidence and mortality, 1990-2017: analysis for the Global Burden of Disease Study. Lancet. 2020;395(10219):
3. Rosen DA, Seki SM, Fernández-Castañeda A, et al. Modulation of the sigma-1 receptor-IRE1 pathway is beneficial in preclinical models of inflammation and sepsis. Sci Transl Med. 2019;11(478):eaau5266. doi:10.1126/scitranslmed.aau5266
4. Cheng N, Zhang Y, Delaney MK, et al. Targeting Gα 13 -integrin interaction ameliorates systemic inflammation. Nat Commun. 2021;12:
5. Silva CMS, Wanderley CWS, Veras FP, et al. Gasdermin D inhibition prevents multiple organ dysfunction during sepsis by blocking NET formation. Blood. 2021;138(25):2702–2713. doi:10.1182/blood.2021011525
6. Singer M, Deutschman CS, Seymour CW, et al. The Third International Consensus Definitions for Sepsis and Septic Shock (Sepsis-3). JAMA. 2016;315(8):
7. Nosewicz J, Spaccarelli N, Roberts KM, et al. The epidemiology, impact, and diagnosis of micronutrient nutritional dermatoses part 1: zinc, selenium, copper, vitamin A, and vitamin C. J Am Acad Dermatol. 2022;86.
8. Garza NM, Swaminathan AB, Maremanda KP, et al. Mitochondrial copper in human genetic disorders. Trends Endocrinol Metab. 2023;34(1):
9. Soto IC, Fontanesi F, Liu J, et al. Biogenesis and assembly of eukaryotic cytochrome c oxidase catalytic core. Biochim Biophys Acta. 2012;1817:
10. Dennerlein S, Rehling P. Human mitochondrial COX1 assembly into cytochrome c oxidase at a glance. J Cell Sci. 2015;128(5):833–837. doi:10.1242/jcs.161729
11. Zhang B, Yang Q, Wang X, et al. Association of whole blood metals/metalloids with severity in sepsis patients: a prospective, single-center, pilot study. J Trace Elem Med Biol. 2023;75:127098. doi:10.1016/j.jtemb.2022.127098
12. Oliveri V. Selective Targeting of Cancer Cells by Copper Ionophores: an Overview. Front Mol Biosci. 2022;9:841814. doi:10.3389/fmolb.2022.841814
13. Cobine PA, Dc B. Cuproptosis: cellular and molecular mechanisms underlying copper-induced cell death. Mol Cell. 2022;82(10):1786–1787. doi:10.1016/j.molcel.2022.05.001
14. Tang D, Chen X, Kroemer G. Cuproptosis: a copper-triggered modality of mitochondrial cell death. Cell Res. 2022;32(5):
15. Tsvetkov P, Coy S, Petrova B, et al. Copper induces cell death by targeting lipoylated TCA cycle proteins. Science. 2022;375(6586):1254–1261. doi:10.1126/science.abf0529
16. Zou R, Tao J, Qiu J, et al. DNA-PKcs promotes sepsis-induced multiple organ failure by triggering mitochondrial dysfunction. J Adv Res. 2022;41:39–48. doi:10.1016/j.jare.2022.01.014
17. Zhuang J, Chen L, Li G, et al. RCAN1 deficiency aggravates sepsis-induced cardiac remodeling and dysfunction by accelerating mitochondrial pathological fission. Inflamm Res. 2022;71(12):1589–1602. doi:10.1007/s00011-022-01628-5
18. Eyenga P, Rey B, Eyenga L, et al. Regulation of Oxidative Phosphorylation of Liver Mitochondria in Sepsis. Cells. 2022;11(10):1598. doi:10.3390/cells11101598
19. Chen Z, Wang H, Hu B, et al. Transcription factor nuclear factor erythroid 2 p45-related factor 2 (NRF2) ameliorates sepsis-associated acute kidney injury by maintaining mitochondrial homeostasis and improving the mitochondrial function. Eur J Histochem. 2022;66(3):
20. Zhao E, Zhou C, Chen S. A signature of 14 immune-related gene pairs predicts overall survival in gastric cancer. Clin Transl Oncol. 2021;23(2):265–274. doi:10.1007/s12094-020-02414-7
21. Ritchie ME, Phipson B, Wu D, et al. limma powers differential expression analyses for RNA-sequencing and microarray studies. Nucleic Acids Res. 2015;43(7):
22. Langfelder P, Horvath S. WGCNA: an R package for weighted correlation network analysis. BMC Bioinf. 2008;9(1):559. doi:10.1186/1471-2105-9-559
23. Yu G, Wang LG, Han Y, et al. clusterProfiler: an R package for comparing biological themes among gene clusters. Omisc. 2012;16(5):
24. Newman AM, Liu CL, Green MR, et al. Robust enumeration of cell subsets from tissue expression profiles. Nat Methods. 2015;12(5):
25. Yang C, Ren J, Li B, et al. Identification of gene biomarkers in patients with postmenopausal osteoporosis. Mol Med Rep. 2019;19(2):1065–1073. doi:10.3892/mmr.2018.9752
26. Friedman J, Hastie T, Tibshirani R. Regularization Paths for Generalized Linear Models via Coordinate Descent. J Stat Softw. 2010;33(1):
27. Qiu J, Peng B, Tang Y, et al. CpG Methylation Signature Predicts Recurrence in Early-Stage Hepatocellular Carcinoma: results From a Multicenter Study. J Clin Oncol. 2017;35(7):
28. Wu X, Qin K, Iroegbu CD, et al. Genetic analysis of potential biomarkers and therapeutic targets in ferroptosis from coronary artery disease. J Cell Mol Med. 2022;26(8):
29. Hänzelmann S, Castelo R, Guinney J. GSVA: gene set variation analysis for microarray and RNA-seq data. BMC Bioinf. 2013;14(1):7. doi:10.1186/1471-2105-14-7
30. Franz M, Rodriguez H, Lopes C, et al. GeneMANIA update 2018. Nucleic Acids Res. 2018;46(W1):
31. Wilkerson MD, Hayes DN. ConsensusClusterPlus: a class discovery tool with confidence assessments and item tracking. Bioinformatics. 2010;26(12):1572–1573. doi:10.1093/bioinformatics/btq170
32. Cecconi M, Evans L, Levy M, et al. Sepsis and septic shock. Lancet. 2018;392(10141):75–87. doi:10.1016/S0140-6736(18)30696-2
33. Cheng SC, Scicluna BP, Arts RJ, et al. Broad defects in the energy metabolism of leukocytes underlie immunoparalysis in sepsis. Nat Immunol. 2016;17(4):
34. Liang X, Wu T, Chen Q, et al. Serum proteomics reveals disorder of lipoprotein metabolism in sepsis. Life Sci Alliance. 2021;4(10):e202101091. doi:10.26508/lsa.202101091
35. Chen Q, Liang X, Wu T, et al. Integrative analysis of metabolomics and proteomics reveals amino acid metabolism disorder in sepsis. J Transl Med. 2022;20(1):123. doi:10.1186/s12967-022-03320-y
36. Ding L, Li W, Tu J, et al. Identification of cuproptosis-related subtypes, cuproptosis-related gene prognostic index in hepatocellular carcinoma. Front Immunol. 2022;13:989156. doi:10.3389/fimmu.2022.989156
37. Savio LEB, de Andrade Mello P, Figliuolo VR, et al. CD39 limits P2X7 receptor inflammatory signaling and attenuates sepsis-induced liver injury. J Hepatol. 2017;67(4):716–726. doi:10.1016/j.jhep.2017.05.021
38. Guo L, Shen S, Rowley JW, et al. Platelet MHC class I mediates CD8+ T-cell suppression during sepsis. Blood. 2021;138(5):401–416. doi:10.1182/blood.2020008958
39. Shankar-Hari M, Fear D, Lavender P, et al. Activation-Associated Accelerated Apoptosis of Memory B Cells in Critically Ill Patients With Sepsis. Crit Care Med. 2017;45(5):
40. Krautz C, Maier SL, Brunner M, et al. Reduced circulating B cells and plasma IgM levels are associated with decreased survival in sepsis - A meta-analysis. J Crit Care. 2018;45:71–75. doi:10.1016/j.jcrc.2018.01.013
41. Hoyer FF, Naxerova K, Schloss MJ, et al. Tissue-Specific Macrophage Responses to Remote Injury Impact the Outcome of Subsequent Local Immune Challenge. Immunity. 2019;51(5):
42. Jin B, Liang Y, Liu Y, et al. Notch signaling pathway regulates T cell dysfunction in septic patients. Int Immunopharmacol. 2019;76:105907. doi:10.1016/j.intimp.2019.105907
43. Yang XW, Li H, Feng T, et al. Impairment of antigen-presenting function of peripheral γδ T cells in patients with sepsis. Clin Exp Immunol. 2022;207(1):104–112. doi:10.1093/cei/uxab029
44. Kang JY, Xu MM, Sun Y, et al. Melatonin attenuates LPS-induced pyroptosis in acute lung injury by inhibiting NLRP3-GSDMD pathway via activating Nrf2/HO-1 signaling axis. Int Immunopharmacol. 2022;109:108782. doi:10.1016/j.intimp.2022.108782
45. Chen Y, Tang Y, Luo S, et al. Nuclear factor erythroid 2-related factor 2 protects bovine mammary epithelial cells against free fatty acid-induced mitochondrial dysfunction in vitro. J Dairy Sci. 2021;104(12):12830–12844. doi:10.3168/jds.2021-20732
46. Luo J, Wang J, Zhang J, et al. Nrf2 Deficiency Exacerbated CLP-Induced Pulmonary Injury and Inflammation through Autophagy- and NF-κB/PPARγ-Mediated Macrophage Polarization. Cells. 2022;11(23):3927. doi:10.3390/cells11233927
47. Hochheiser IV, Pilsl M, Hagelueken G, et al. Structure of the NLRP3 decamer bound to the cytokine release inhibitor CRID3. Nature. 2022;604(7904):184–189.
48. Mangan MSJ, Olhava EJ, Roush WR, et al. Targeting the NLRP3 inflammasome in inflammatory diseases. Nat Rev Drug Discov. 2018;17(8):567.
49. Busch K, Kny M, Huang N, et al. Inhibition of the NLRP3/IL-1β axis protects against sepsis-induced cardiomyopathy. J Cachexia Sarcopenia Muscle. 2021;12(6):1653–1668. doi:10.1002/jcsm.12763
50. Huo S, Wang Q, Shi W, et al. ATF3/SPI1/SLC31A1 Signaling Promotes Cuproptosis Induced by Advanced Glycosylation End Products in Diabetic Myocardial Injury. Int J Mol Sci. 2023;24(2):1667. doi:10.3390/ijms24021667
51. Nie X, Chen H, Xiong Y, et al. Anisomycin has a potential toxicity of promoting cuproptosis in human ovarian cancer stem cells by attenuating YY1/lipoic acid pathway activation. J Cancer. 2022;13(14):3503–3514. doi:10.7150/jca.77445
52. Giedroc DP, Chen X, Apuy JL. Metal response element (MRE)-binding transcription factor-1 (MTF-1): structure, function, and regulation. Antioxid Redox Signal. 2001;3(4):577–596. doi:10.1089/15230860152542943
53. Li J, Chen S, Liao Y, et al. Arecoline Is Associated With Inhibition of Cuproptosis and Proliferation of Cancer-Associated Fibroblasts in Oral Squamous Cell Carcinoma: a Potential Mechanism for Tumor Metastasis. Front Oncol. 2022;12:925743. doi:10.3389/fonc.2022.925743
54. Pal A, Potjer TP, Thomsen SK, et al. Loss-of-Function Mutations in the Cell-Cycle Control Gene CDKN2A Impact on Glucose Homeostasis in Humans. Diabetes. 2016;65(2):527–533. doi:10.2337/db15-0602
55. Anderson NM, Qin X, Finan JM, et al. Metabolic Enzyme DLST Promotes Tumor Aggression and Reveals a Vulnerability to OXPHOS Inhibition in High-Risk Neuroblastoma. Cancer Res. 2021;81(17):
56. Ochalski SJ, Hartman DA, Belfast MT, et al. Inhibition of endotoxin-induced hypothermia and serum TNF-alpha levels in CD-1 mice by various pharmacological agents. Agents Actions. 1993;39(Spec No):C52–4. doi:10.1007/BF01972718
57. Slotman GJ, Burchard KW. Ketoconazole prevents Candida sepsis in critically ill surgical patients. Arch Surg. 1987;122(2):147–151. doi:10.1001/archsurg.1987.01400140029002
58. Smith JA, Mayeux PR, Schnellmann RG. Delayed Mitogen-Activated Protein Kinase/Extracellular Signal-Regulated Kinase Inhibition by Trametinib Attenuates Systemic Inflammatory Responses and Multiple Organ Injury in Murine Sepsis. Crit Care Med. 2016;44(8):
59. Formosa A, Turgeon P, Dos Santos CC. Role of miRNA dysregulation in sepsis. Mol Med. 2022;28(1):
60. Jiao Y, Zhang T, Zhang C, et al. Exosomal miR-30d-5p of neutrophils induces M1 macrophage polarization and primes macrophage pyroptosis in sepsis-related acute lung injury. Crit Care. 2021;25(1):356. doi:10.1186/s13054-021-03775-3
61. Gao M, Yu T, Liu D, et al. Sepsis plasma-derived exosomal miR-1-3p induces endothelial cell dysfunction by targeting SERP1. Clin Sci. 2021;135:347–365. doi:10.1042/CS20200573
62. Leitner BP, Lee WD, Zhu W, et al. Tissue-specific reprogramming of glutamine metabolism maintains tolerance to sepsis. PLoS One. 2023;18(7):
63. Zeng J, Yang Z, Xu D, et al. NMI Functions as Immuno-regulatory Molecule in Sepsis by Regulating Multiple Signaling Pathways. Inflammation. 2024;47(1):60–73.
 © 2024 The Author(s). This work is published and licensed by Dove Medical Press Limited. The
full terms of this license are available at https://www.dovepress.com/terms
and incorporate the Creative Commons Attribution
- Non Commercial (unported, 3.0) License.
By accessing the work you hereby accept the Terms. Non-commercial uses of the work are permitted
without any further permission from Dove Medical Press Limited, provided the work is properly
attributed. For permission for commercial use of this work, please see paragraphs 4.2 and 5 of our Terms.
© 2024 The Author(s). This work is published and licensed by Dove Medical Press Limited. The
full terms of this license are available at https://www.dovepress.com/terms
and incorporate the Creative Commons Attribution
- Non Commercial (unported, 3.0) License.
By accessing the work you hereby accept the Terms. Non-commercial uses of the work are permitted
without any further permission from Dove Medical Press Limited, provided the work is properly
attributed. For permission for commercial use of this work, please see paragraphs 4.2 and 5 of our Terms.
Recommended articles
Immune Cell Infiltration Analysis Based on Bioinformatics Reveals Novel Biomarkers of Coronary Artery Disease
He T, Muhetaer M, Wu J, Wan J, Hu Y, Zhang T, Wang Y, Wang Q, Cai H, Lu Z
Journal of Inflammation Research 2023, 16:3169-3184
Published Date: 26 July 2023
Analysis and Validation of Critical Signatures and Immune Cell Infiltration Characteristics in Doxorubicin-Induced Cardiotoxicity by Integrating Bioinformatics and Machine Learning
Huang C, Pei J, Li D, Liu T, Li Z, Zhang G, Chen R, Xu X, Li B, Lian Z, Chu XM
Journal of Inflammation Research 2024, 17:669-685
Published Date: 2 February 2024
Identification and Analysis of PANoptosis-Related Genes in Sepsis-Induced Lung Injury by Bioinformatics and Experimental Verification
Yang Z, Kao X, Huang N, Yuan K, Chen J, He M
Journal of Inflammation Research 2024, 17:1941-1956
Published Date: 28 March 2024
ISLR as a Cuproptosis-Related Predictor and Therapeutic Target in Heart Failure: A Multi-Omics and Bioinformatics Approach
Huang K, Ding S, Xu X, Wang C, Han L
Journal of Inflammation Research 2025, 18:9699-9716
Published Date: 22 July 2025
Machine Learning-Based Identification and Experimental Validation of Hub Ferroptosis-Related Cuproptosis Genes in Lupus Nephritis
Zhang S, Hu W, Zhang Y, Huang C, He Z, Xu J, Lin S, Yang B, Chen X
Journal of Inflammation Research 2025, 18:11335-11353
Published Date: 18 August 2025