Back to Journals » Journal of Asthma and Allergy » Volume 16
Asthma Prevalence and Phenotyping in the General Population: The LEAD (Lung, hEart, sociAl, boDy) Study
Authors Schiffers C ![]() , Wouters EF, Breyer-Kohansal R, Buhl R, Pohl W, Irvin CG, Breyer MK, Hartl S
, Wouters EF, Breyer-Kohansal R, Buhl R, Pohl W, Irvin CG, Breyer MK, Hartl S
Received 29 December 2022
Accepted for publication 15 March 2023
Published 8 April 2023 Volume 2023:16 Pages 367—382
DOI https://doi.org/10.2147/JAA.S402326
Checked for plagiarism Yes
Review by Single anonymous peer review
Peer reviewer comments 4
Editor who approved publication: Dr Amrita Dosanjh
Caspar Schiffers,1 Emiel FM Wouters,1,2 Robab Breyer-Kohansal,1,3 Roland Buhl,4 Wolfgang Pohl,5 Charles G Irvin,6 Marie-Kathrin Breyer,1,7 Sylvia Hartl1,7,8
1Ludwig Boltzmann Institute for Lung Health, Vienna, Austria; 2NUTRIM, School of Nutrition and Translational Research in Metabolism, Maastricht University Medical Center, Maastricht, the Netherlands; 3Department of Respiratory and Pulmonary Diseases, Clinic Hietzing, Vienna Healthcare Group, Vienna, Austria; 4Pulmonology Department, Mainz University Hospital, Mainz, Germany; 5Karl Landsteiner Gesellschaft, Institute for Clinical and Experimental Pneumology, Vienna, Austria; 6Pulmonary and Critical Care, Larner College of Medicine, University of Vermont, Burlington, VT, USA; 7Department of Respiratory and Pulmonary Diseases, Clinic Penzing, Vienna Healthcare Group, Vienna, Austria; 8Sigmund Freud University, Faculty for Medicine, Vienna, Austria
Correspondence: Caspar Schiffers, Ludwig Boltzmann Institute for Lung Health, Vienna, 1140, Austria, Email [email protected]
Background: Asthma is a chronic heterogeneous respiratory disease involving differential pathophysiological pathways and consequently distinct asthma phenotypes.
Objective and Methods: In the LEAD Study, a general population cohort (n=11.423) in Vienna ranging from 6– 82 years of age, we addressed the prevalence of asthma and explored inflammatory asthma phenotypes that included allergic and non-allergic asthma, and within these phenotypes, an eosinophilic (eosinophils ≥ 300 cells/μL, or ≥ 150 cells/μL in the presence of ICS medication) or non-eosinophilic (eosinophils < 300 cells/μL, or < 150 cells/μL in the presence of ICS) phenotype. In addition, we compared various factors related to biomarkers, body composition, lung function, and symptoms in control subjects versus subjects with current asthma (current doctor’s diagnosis of asthma).
Results: An overall prevalence of 4.6% was observed for current asthma. Furthermore, an age-dependent shift from allergic to non-allergic asthma was found. The non-eosinophilic phenotype was more prominent. Obesity was a prevalent condition, and body composition including visceral adipose tissue (VAT), is affected in current asthma versus controls.
Conclusion: This broad-aged and large general population cohort identified differential patterns of inflammatory asthma phenotypes that were age-dependent. The presence of eosinophilia was associated with worse asthma control, increased asthma medication, increased VAT, and lower lung function, the opposite was found for the presence of an allergic asthma.
Keywords: asthma, prevalence, phenotyping, pulmonary function testing, spirometry, general population, body composition
Introduction
Asthma is a chronic heterogeneous disease characterized by chronic airway inflammation, variable expiratory airflow limitation and respiratory symptoms including wheeze, shortness of breath, chest tightness and cough that may vary over time and in intensity.1
The prevalence of asthma increased in the last decades and asthma is presently a highly prevalent disease affecting over 399 million people globally, or 4.3% of the population.1–3 However, these figures range from 1–22% dependent on country and/or age ranges studied.3 In children, (allergic) asthma is the highest prevalent chronic respiratory condition and is studied extensively;4 conversely, data on asthma prevalence in the elderly are more scarce5 although it is associated with increased morbidity6 and mortality.7
Differential underlying pathophysiological pathways in asthma are associated with distinct asthma phenotypes. These phenotypes can be classified by their clinical phenotype, such as early-onset, late-onset, and obesity-associated asthma, or by their inflammatory phenotype, including allergic and non-allergic eosinophilic (Th2-high) or non-eosinophilic (Th2-low) asthma,8,9 and are largely derived from cohorts that included participants with severe asthma.10–12 As such, these phenotypes are poorly studied in primary care,13 and data on these phenotypes in the general population are lacking. International GINA recommendations14 suggest asthma can be characterized by different stages of severity, ranging from mild to severe asthma and by variable asthma control being either well-controlled, partly-controlled, or uncontrolled.3
In this study, we sought to determine the prevalence of asthma and inflammatory asthma phenotypes in the general population between 6 and 82 years. In addition, the presence of asthma was related to asthma control, medication use and body composition.
Methods
Study Design and Participants
The LEAD (Lung, hEart, sociAl, boDy) Study (NCT01727518; http://clinicaltrials.gov) is a single-centered longitudinal, observational, population-based cohort study that aims to provide a comprehensive database of measured parameters of the function of the respiratory, cardiovascular, and metabolic system in a general population. In the first study phase, from 2012 to 2016, a random sample (stratified by age, gender, and residential area) of 11,423 subjects (males 47.6%, females 52.4%), aged 6–82 years, from Vienna and lower Austria has been investigated. A detailed study protocol is available online.15 Ever asthma was defined as doctor’s diagnosis (Positive response to the following question: “Has a doctor or other health professional ever told you that you have asthma?”) and current asthma defined by a current doctor’s diagnosis (Positive response to the following question: “Do you still have the diagnosis of asthma?”).16,17 Control subjects were all subjects with complete lung function data (pre- and post-bronchodilation (BD)) excluding those diagnosed with COPD, emphysema, or chronic bronchitis and current/ever asthma. The Asthma Control Test™ was performed according to the guidelines.18 The presence of asthma medication was used as a proxy to assess severity of asthma according to GINA, with intake of at least one of the following: inhaled corticosteroids (ICS), short-acting (SABA) and long-acting beta agonist (LABA), and short-acting (SAMA) and long-acting muscarinic antagonist (LAMA). In addition, antihistamine medication was recorded.
Ethics
The local Ethics committee of Vienna (Ethikkommission der Stadt Wien) approved the study (protocol number: EK-11-117-0711). Participants signed informed consent, and informed consent for children under the age of 18 had to be signed by their parents or legal representative. The manuscript was conducted in accordance with the Declaration of Helsinki.
Measurements
All measurements were performed at the LEAD study center of the Ludwig Boltzmann Institute for Lung Health at the Clinic Penzing in Vienna, Austria. Lung function measurements included pre- and post-BD spirometry following international guidelines.19,20 Quality control of spirometry was ensured by employment of trained personnel and standard operating procedures, and lung function parameter (forced expiratory volume in 1 second, FEV1; forced vital capacity, FVC) results were related to the Global Lung Initiative (GLI) reference equations.21,22 Reversibility was defined as the difference of post-BD minus pre-BD FEV1 >12% and >0.2 L in participants ≥19 years; in participants <19 years: ≥12% difference in pre- vs post-BD FEV1.23
For more detailed information regarding the collection of parameters (including questionnaires) collected in this study, refer to15 and Table S1.
Assessment of Atopic State, Eosinophils, and Body Composition
Atopic state was defined by skin prick allergen testing: a positive skin prick test was defined as the presence of a reaction ≥3mm to aero-allergens.24 In brief, antihistamines or glucocorticoids were withdrawn for at least 48h before testing. The following aero-allergens were tested: ash tree, tree pollen mix (hazel, alder, birch), grass mix (Anthoxantum, Dactylis, Lolium, Phleum and Poa), mugwort, ragweed, ribwort, mites mix (Dermatophagoides Farinae and Dermatophagoides Pteronyssinus), mildew, and dog and cat dander. All allergens were obtained from the company “Alk-Abello”. Positive (0.1% histamine) and negative (0.9% sodium chloride) controls were included in the test panel.24 Additionally, doctor’s diagnosis of allergy and atopy were recorded, as well as questionnaires on the presence of atopic symptoms. Venous blood was collected from each participant, processed, and blood plasma was analysed for eosinophil counts using the Sysmex XN1000 hematology analyzer, performed by specialists at the Institute for Laboratory Medicine at Klinik Penzing, Vienna, Austria.
Body height and weight were measured with a stadiometer and a high precision scale, respectively. BMI was calculated as weight (kg) divided by height (m2), and obesity was defined as a BMI >30 kg/m2 and +2 standard deviations (SD) in those aged <19 years.25 Body composition measurements were performed with a Lunar Prodigy™ (GE Healthcare©, USA) dual x-ray absorptiometry (DXA) scan. Whole-body scans were performed, and main body composition parameters including visceral adipose tissue (VAT) mass and volume were subsequently analyzed with enCORE™ v17. Quality control and calibration were conducted daily, as detailed elsewhere.26 The fat mass index (FMI) and lean mass index (LMI) were derived from the fat mass and lean mass respectively and were corrected for height. Additionally, z-scores were accounted for age and sex.
Asthma Phenotyping
In subjects with current asthma, we determined phenotypes as following: allergic (positive skin prick, in combination with at least 1 of the following: doctor`s diagnosis of allergy, atopic symptoms, neurodermitis/atopic eczema) or non-allergic (Absence of positive skin prick with at least 1 of the following: doctor`s diagnosis of allergy, atopic symptoms, neurodermitis/atopic eczema) asthma. Within allergic and non-allergic asthma, we defined an eosinophilic (eosinophils ≥300 cells/µL, or ≥150 cells/µL in the presence of current ICS medication) or non-eosinophilic (eosinophils <300 cells/µL, or <150 cells/µL in the presence of current ICS medication) phenotype based on GINA 2021.27,28
Statistical Analysis
Statistics were performed in SPSS Statistics, version 27.29 Differences between the control population and (current or ever) asthmatics, between age groups in current asthmatics (children/adolescents, 6-<20 years; adults, 20–60 years; elderly, 60+ years; and overall study population, age 6–82), or between the different asthma phenotypes, were analyzed using either ANOVA or Chi-square (Fisher’s Exact). P-values < 0.05 were considered significant.
Results
Study Population
From the total LEAD study population of 11,423 participants aged 6–82 years, 11,249 participants had valid spirometry. From these 11,249 subjects, 9,920 were defined as controls (436 exclusions due to COPD, and for the analysis of current asthma, 401 ever asthmatics were excluded), 492 with current asthma (7 with invalid spirometry; Figure 1A) and 893 with ever asthma (11 with invalid spirometry; Figure 1B).
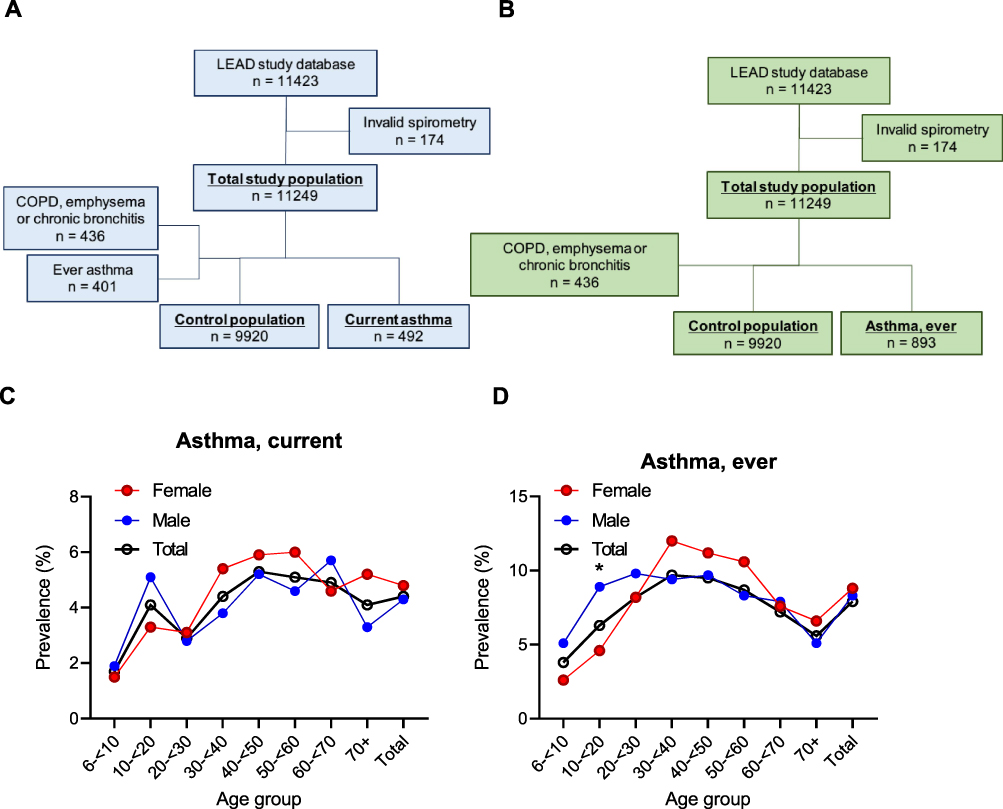 |
Figure 1 Flowchart of study population of current ((A); n=492) and ever ((B); n=893) asthma within the LEAD study cohort following exclusion criteria, including the prevalence of current (C) and ever (D) asthma. * p < 0.05. |
Prevalence of Doctor’s Diagnosed Asthma
The overall prevalence of current asthma was 4.4% (4.3% male, 4.8% female; Figure 1C), and the highest prevalence was observed in the age group 40-<50 years, with 5.3% (5.2% male, 5.9% female). In the current asthma group, 52 subjects (61.5% male) were <20 years, whereas 447 subjects (43.0% male) were ≥20 years. The highest prevalence for males was observed at age group 60-<70 (5.7% male) and for females at age group 50-<60 (6.0% female). The overall prevalence of ever asthma was 7.9% (8.3% male, 8.8% female; Figure 1D). Prevalence of ever asthma declined more substantially at older age (>60 years).
Baseline characteristics as well as other factors for current and ever asthma are shown in Table 1. The current asthma population were older than controls (mean±SD: 46.7±17.8 versus 44.10±19.6 years; p<0.01). Both ever and current asthmatics weighed more, had increased BMI, and had increased pack years compared to respective controls. Current and ever asthmatics had increased symptoms (cough, sputum, wheezing and dyspnea) and had significantly lower lung function, pre- and post-BD (in liters, and %pred GLI) in all forced expiratory spirometric lung function parameters (FEV1, FVC and FEV1/FVC) compared to controls. These lung function parameters were lower in all age groups with current asthma but did not reach statistical significance in the children/adolescents with current asthma versus controls (Table 2). The adult asthma population revealed significant lower numbers in all lung function parameters, but the largest reductions were observed in the elderly asthmatics.
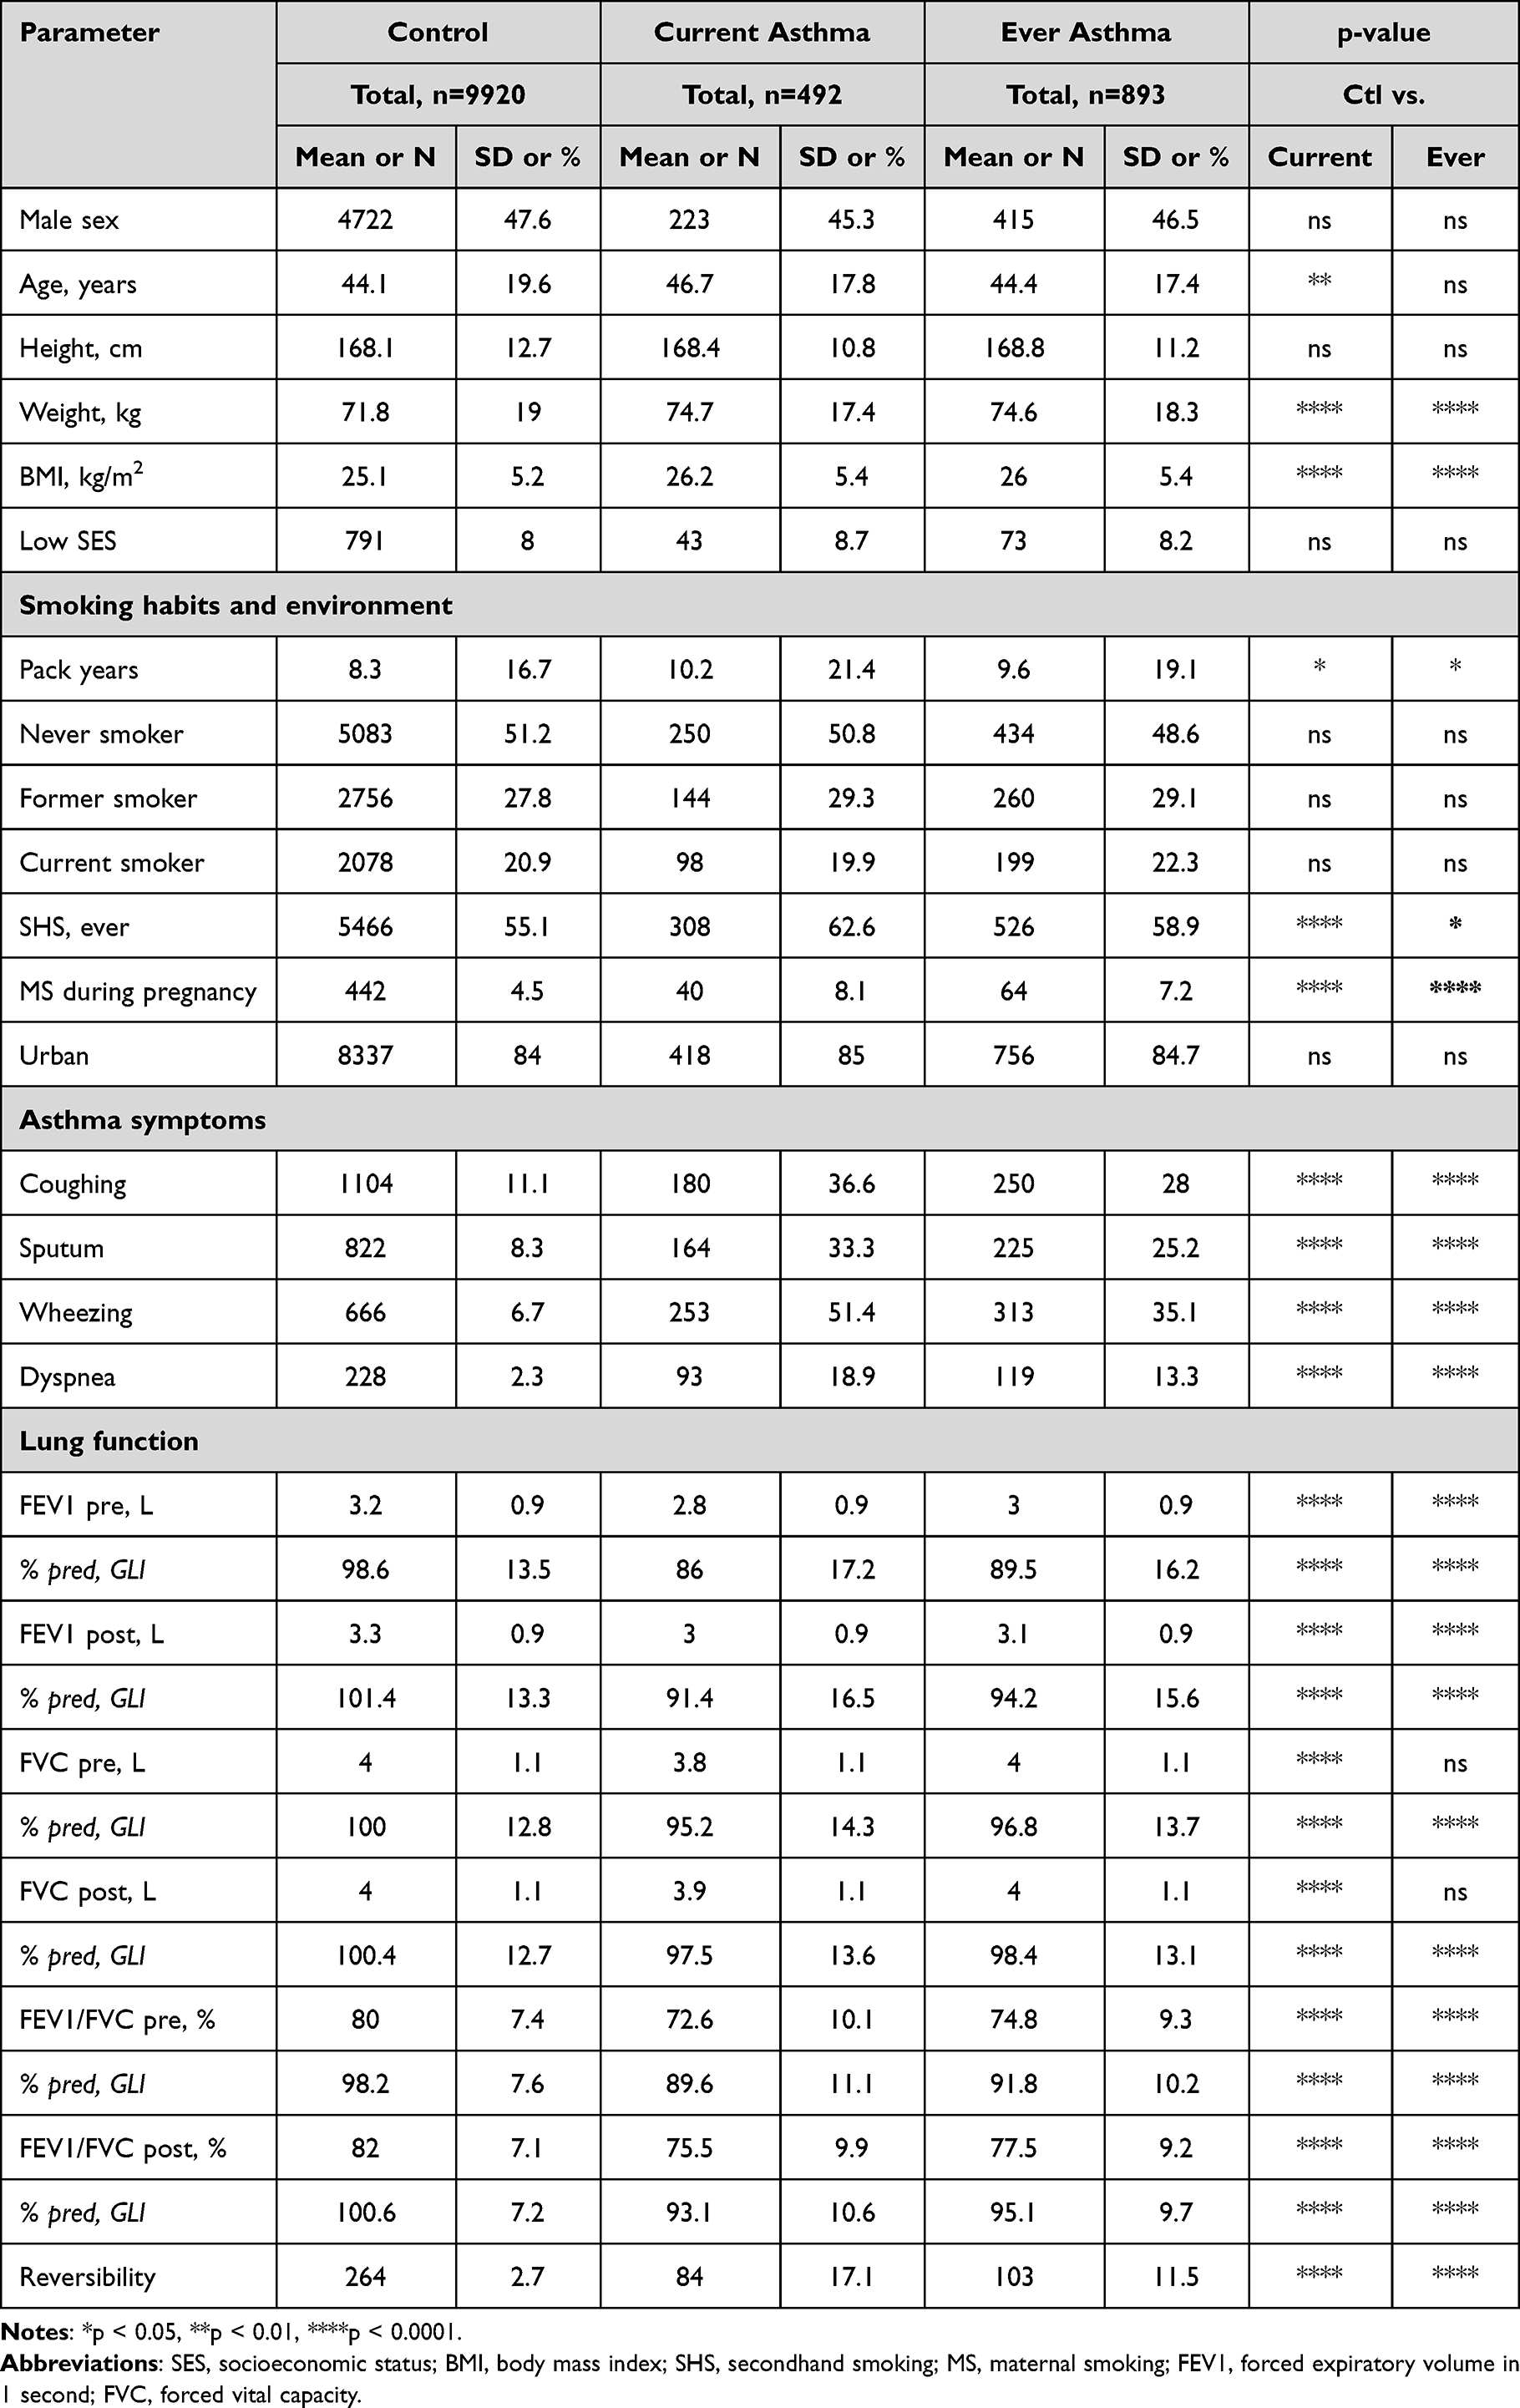 |
Table 1 Baseline Characteristics Analysis Including Anthropometrics, as Well as Lung Function, Body Composition, Inflammation Markers, and Other Blood Biomarkers in the LEAD Study for Control and Asthma Subjects |
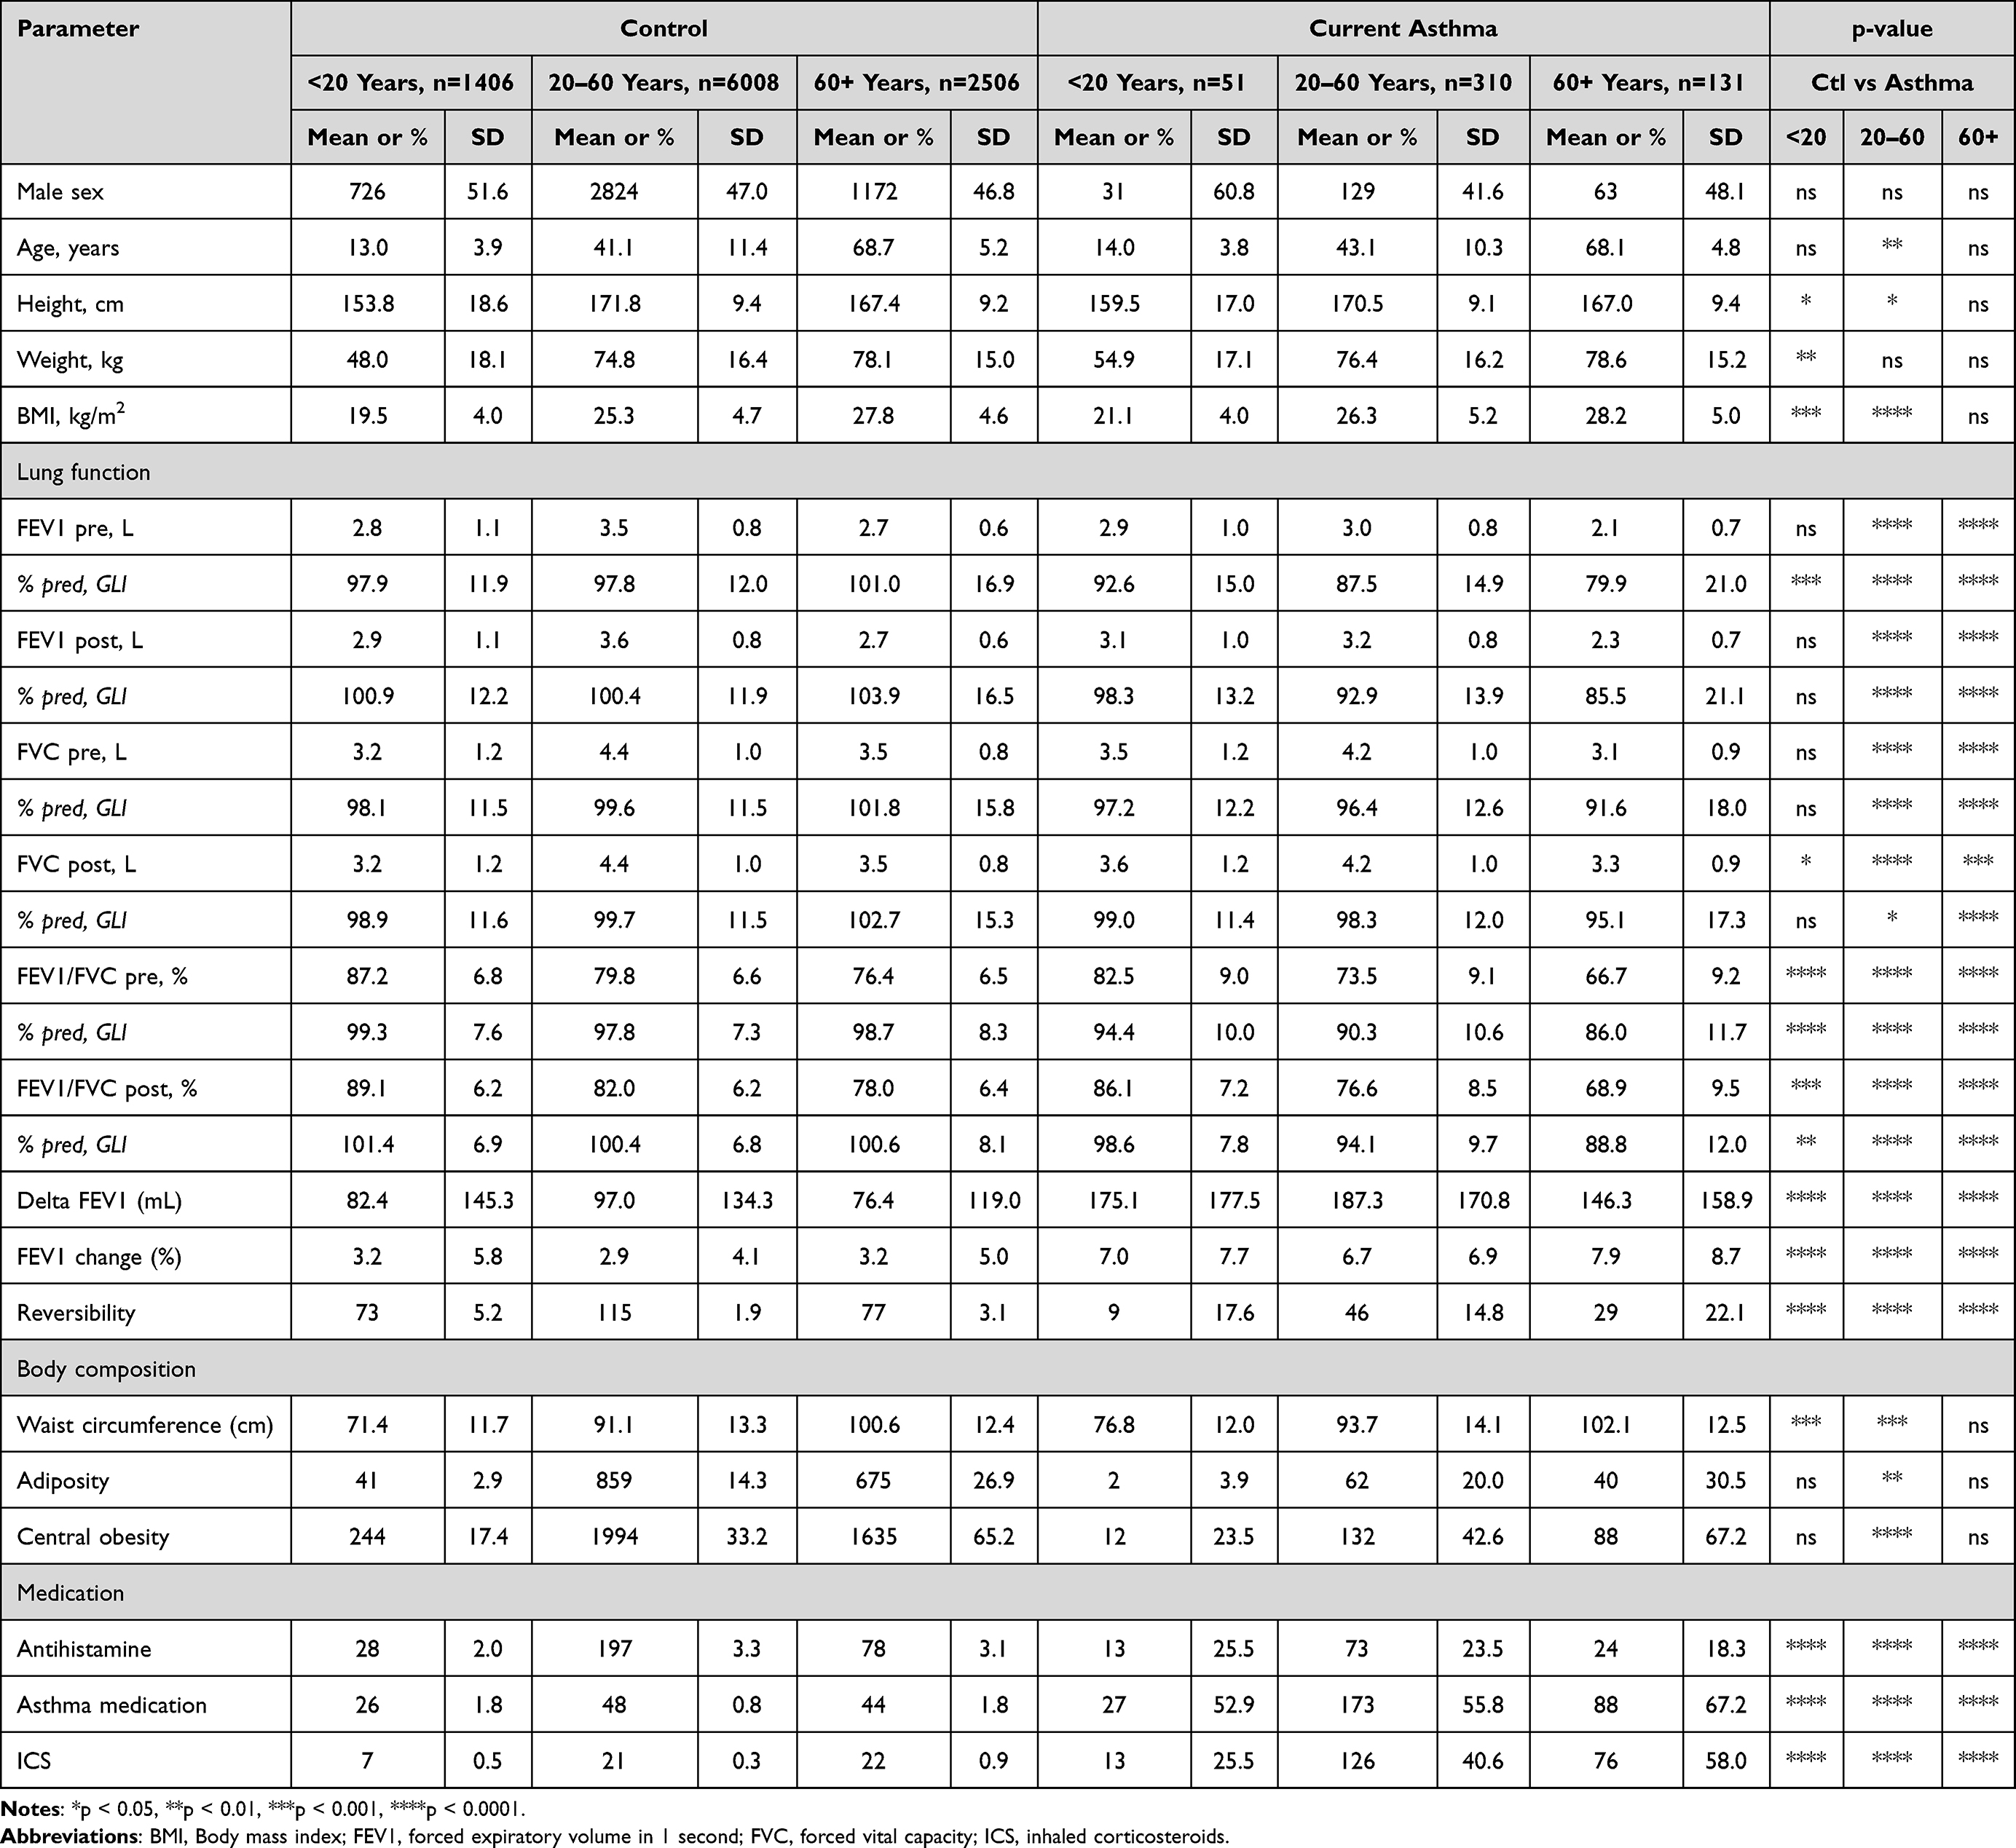 |
Table 2 Categorical Analysis in the LEAD Study for Control and Asthma Subjects, Separated by Age (<20 Years, 20–60 Years, 60+ Years) Including Anthropometrics, Body Composition, Lung Function, and Asthma Medication |
Nearly a fifth (17.1%) of the current asthma population and a tenth (11.5%) of the ever asthma population showed reversibility (Table 1). More specifically, it was observed in 17.6%, 14.8% and 22.1% of the children/adolescents, adults, and the elderly population with current asthma, respectively (Table 2).
Asthma Control and Medication
The asthma control test (ACT) indicated that 73.4% of the asthmatics were found to have well-controlled asthma, 18.5% partly-controlled asthma, and 8.2% uncontrolled asthma (Figure 2), which was not affected by sex. In addition, a visible shift in the ACT was observed between children and adults with asthma, with children having a higher percentage of partly-controlled or uncontrolled asthma (partly-controlled: 24.4%, vs 15.4% in adults; uncontrolled: 17.1%, vs 7.3% in adults; p-value = 0.027). In the elderly, the prevalence of partly-controlled asthma increased again compared to the adult population (25.3%), whereas uncontrolled asthma remained relatively stable (6.3%). Overall, 288 out of 492 (58.5%) current asthmatics had a medication for their asthma, of which 214 (74%) subjects indicated taking ICS.
 |
Figure 2 Asthma control according to the Asthma Control Test (ACT) in the current asthma population, separated by age groups (<20 years, 20 to 60 years, 60+ years). A significant difference (p=0.027) was found for ACT between the age groups <20 years versus 20 to 60 years. |
Phenotyping of Current Asthma
Allergic and non-allergic asthma was observed in 301 (64.6%) and 165 (35.4%) asthmatics, respectively. Within allergic asthma, 40.2% were eosinophilic (26.2% of asthmatics), whereas 59.8% were non-eosinophilic (38.8% of asthmatics). In non-allergic asthma, 44.0% (15.4% of asthmatics) displayed an eosinophilic and 56.0% (19.6% of asthmatics) a non-eosinophilic phenotype, respectively. Eosinophilic and non-eosinophilic asthma was present in 189 (41.5%) and 266 (58.5%) asthmatics, respectively (Figure 3A). Of note, ICS intake in eosinophilic and non-eosinophilic asthma was 74.6% and 20.7%, respectively (Table 3).
 |
Table 3 Comparison of Asthma Phenotypes (Allergic (A), Non-Allergic (NA), Eosinophilic (E), Non-Eosinophilic (NE)) for Anthropometrics, as Well as Exposures, Smoking, Symptoms, Lifestyle, Lung Function and Body Composition |
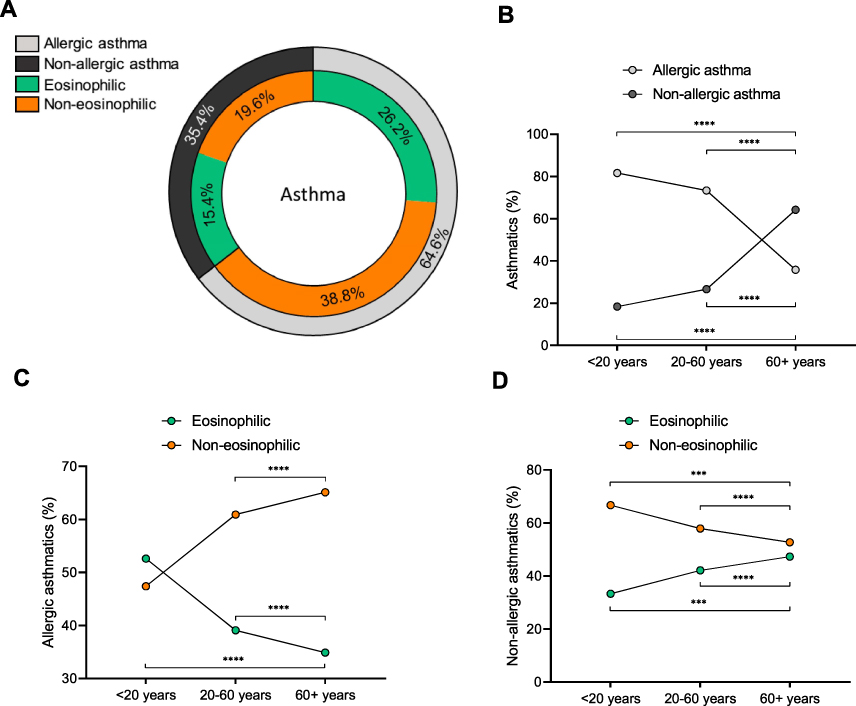 |
Figure 3 The percentage of LEAD study asthma subjects (n=492 total, n=26 with missing allergic status, and another n=11 with missing eosinophil counts) with (A and B) allergic asthma (64.6%) or non-allergic asthma (35.4%), either (C and D) eosinophilic (26.6% with allergic, 15.4% with non-allergic) or non-eosinophilic (38.8% with allergic, 19.6% with non-allergic), separated by age (<20 years of age, and 20 years to 60, or 60+). *** p < 0.001, **** p < 0.0001. |
Significant age-related differences in these phenotypes were found in our study. Allergic asthma was the most prominent phenotype in children/adolescents (81.6%) and adults (73.4%; Figure 3B) but revealed an age-related decrease with a concomitant increase in non-allergic asthma, which was more prominent in elderly asthmatics (64.2%). In allergic asthmatics, a non-eosinophilic phenotype was more prominent, and this increased with age (Figure 3C; 47.4%, 60.9% and 65.1% for children/adolescents, adults, and the elderly respectively) with a concomitant decrease in eosinophilic allergic asthma. In non-allergic asthma, the non-eosinophilic phenotype, while more prominent, decreased with age (Figure 3D; 66.7%, 57.9% and 52.7% for children/adolescents, adults, and the elderly respectively). Allergic asthma revealed a higher prevalence of male gender, lower age, increased height, and lower BMI (Table 3). These subjects had better lung function, less secondhand smoking (SHS) exposure and a higher proportion of never smokers.
Compared to non-eosinophilic asthma, a worse outcome in asthma control was measured in eosinophilic asthma concordant with increased ICS/asthma medication intake (Table 3). They also had significantly lower lung function both pre- and post-BD (FEV1, FVC, FEV1/FVC %pred, and ratio FEV1/FVC) as well as a higher prevalence of reversibility compared to non-eosinophilic asthma subjects.
Asthma and Obesity
Obesity was prevalent in current asthma: 21.1% or 104 of 492 were obese, which was also significantly higher than in controls (16.0%: p=0.002; Table 1). In children/adolescents, obesity was detected by both significant increases in BMI and waist circumference, whereas in the adult asthma population, obesity was additionally recognized by central obesity, which was significantly higher than respective controls (Table 2). Absolute visceral adipose tissue (VAT) mass was increased in the adult and elderly asthma population, whereas VAT volume and mass (z-score) were only increased in the elderly asthma population (Table S2). The fat mass index (absolute and z-scores) was significantly increased in the children/adolescent and adult asthma population.
Within the asthma phenotypes, obesity was significantly higher prevalent in non-allergic compared to allergic asthmatics (26.7% versus 17.9%, p=0.028), and increased by age (Figure 4A). Moreover, allergic asthma revealed lower FMI and VAT (mass, volume and z-scores) compared to non-allergic asthmatics. Within the categories of allergic/non-allergic, the differentiation between eosinophilic and non-eosinophilic did not have an impact on the prevalence of obesity (Figure 4B; allergic eosinophilic, 17.6%; non-eosinophilic, 18.1%; non-allergic eosinophilic 25.7%; non-eosinophilic 25.8%) but increased with age (Figure 4C).
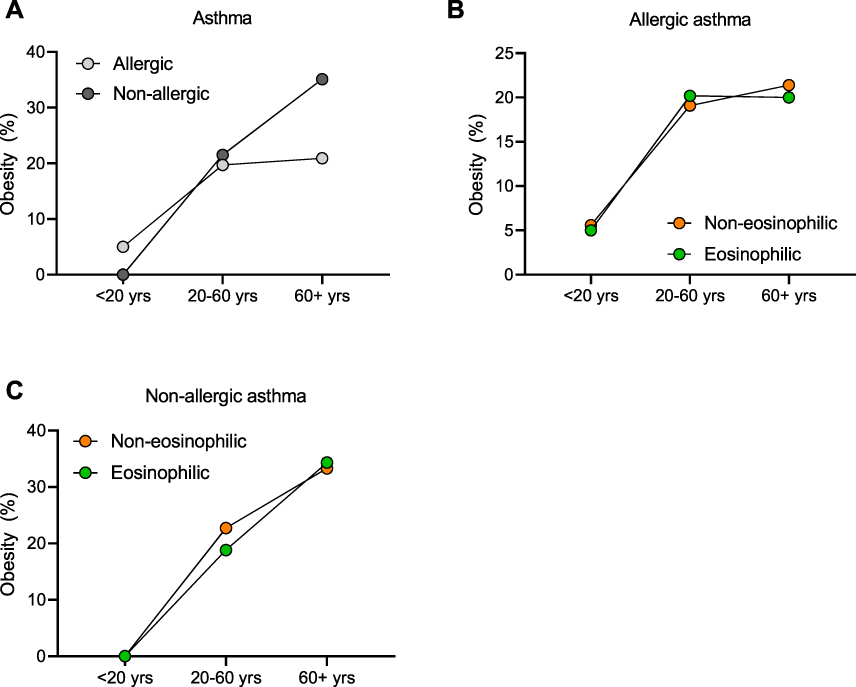 |
Figure 4 (A) Prevalence of current asthmatics with obesity (BMI ≥ 30 kg/m2 or participants aged ≤19 years old: ≥ + 2 SD) having either an allergic or non-allergic asthma. Prevalence of obesity within allergic (B) or non-allergic (C) asthma for the eosinophilic (green) or non-eosinophilic (Orange) phenotype. |
Discussion
The current study covering a lifespan between 6 and 82 years highlights a 4.4% prevalence of current asthma which is age-dependent with its peak prevalence from 40 years onwards without any sex dependence in the general population. Additionally, we were able to differentiate between allergic/non-allergic as well as eosinophilic/non-eosinophilic asthma phenotypes. We found that asthma, compared to the general population, has higher indices of obesity, including BMI, central obesity and visceral fat mass, the latter of which was related to the elderly. Furthermore, asthma in adulthood is associated with lower lung function even though current asthma within a general population reflects milder asthma. In addition, the overall analysis of asthmatics compared to controls reveal that symptoms and lung function impairment pre- and post-BD not only in current, but also ever asthmatics, are significantly higher than in the general population. Lastly, asthma phenotyping reveals that eosinophilic asthma has the lowest lung function pre-and post-BD.
According to the World Health Survey (WHS), the global prevalence of doctor diagnosed asthma is 4.3%, and varied significantly among 70 countries.3 In the US, the prevalence of asthma among adults is 7.6%, but rates vary dramatically among different ethnic groups.30 A survey of UK healthcare records reported that the prevalence was marginally higher at 6.5%.31 They additionally reported that prevalence was highest at age 12–17, then declined gradually up to the group aged 45–54 years, where the prevalence slightly started increasing again.31 Our prevalence data based on current asthma fit very well with the global prevalence. Nevertheless, we also have a significant proportion of 401 individuals (44.4% of total asthma population) with an asthma diagnosis but without symptom persistence, and as such, the prevalence of ever asthma is significantly higher, and may partially explain the differential findings between studies using different definitions.
Research indicates that asthma is common in the elderly32,33 and has been associated with increased morbidity and mortality rates,34 and is often underdiagnosed or confused with COPD.5 However, general population data are scarce in this older population: one study demonstrated a prevalence of 7.8% in male and 7.1% in female aged >65 years based on an asthma diagnosis and symptoms.35 Here we provide evidence that asthma is indeed common in the elderly, and is distinct from asthma during adolescence or in adults regarding phenotype, and body composition as discussed below.
Phenotyping of the current asthma population revealed that in children/adolescents, allergic asthma is the dominant phenotype, and an age-dependent shift from allergic asthma to non-allergic asthma.
In allergic asthma, a non-eosinophilic profile became the major phenotype from adulthood onward, whereas in non-allergic asthma, the inflammatory profiles remained stable with increasing age and with a slight predominance of the non-eosinophilic phenotype. This is in line with previous studies that describe a decrease of childhood and early-onset allergic asthma and increased non-allergic asthma (less atopy, lower serum IgE, lower blood/sputum eosinophil levels) with increasing age, especially in late-onset asthma/asthma in the elderly.36,37 Similar observations were reported in a Finnish cohort study.38 As for non-eosinophilic asthma, our current findings are in line with previous studies that have suggested about 50% of asthmatics display a non-eosinophilic asthma,39,40 a finding that was also observed in molecular signature studies, where 20 of 42 participants with asthma had Th2-low asthma.41 The age-dependent increase in non-eosinophilic asthma may be related to extrinsic and intrinsic factors.40,42 Another important question is whether the allergic/eosinophilic asthma phenotype disappears with increasing age, or whether this is the emergence of a new disease; however, our cross-sectional analysis cannot elaborate on this.
The differences in the asthma phenotypes are multifaceted and are in line with previous survey studies,43,44 and indicate significant differences regarding sex, anthropometrics, medication intake, symptoms, lung function and reversibility, as well as smoking behavior and body composition. The presence of eosinophilia was associated with worse asthma control, ICS intake, asthma medication, increased VAT,26 and lower lung function. The presence of an allergic asthma was associated with being male, younger, taller, lower BMI, less obesity, lower FMI and VAT, less symptoms, better lung function and more antihistamine intake. These data indicate that typing in eosinophilic and non-eosinophilic asthma may contribute to experienced disease burden and trait differentiation.
Our definition of the presence of an eosinophilic phenotype is based on commonly used cut‐off levels (≥300 cells/µL, or ≥150 cells/µL in the presence of ICS medication) to guide treatment with currently approved biologic agents.27,28 Interestingly, a recent meta-analysis on eosinophils as a biomarker in asthma addressed blood eosinophil ranges and distribution, which revealed median ranges of 157–280 and 200–400 cells/µL for asthma and severe asthma, respectively.45 The current study observed similar eosinophil levels in asthmatics: with ICS intake 285.6±240.1 cells/µL (95% CI: 199.1–241.6, median 220.0) versus 220.4±177.3 cells/µL in asthmatics without ICS intake (95% CI: 253.1–318.2, median 170.0). As such, the current analysis may overestimate eosinophilic asthma using a cut-off of 150 cells/µL in the presence of ICS intake and highlights the need to assess eosinophil count following ICS treatment.
Our data furthermore clearly demonstrate the importance of body composition in asthma. Obesity was more prevalent in current asthmatics, a finding that has been demonstrated previously from epidemiological studies and meta-analyses,46,47 and a recent large scale study observed that asthmatics have a higher risk of developing obesity than non-asthmatics, particularly those that are non-atopic,48 have longer disease duration or are on oral corticosteroids.49 In line with these findings, we here observed that obesity was more prevalent in non-allergic/non-atopic asthmatics versus allergic asthmatics. An important observation is that changes in body composition types were already present in children (increased BMI, FMI) that are known to modify asthma50 and may reflect worse long-term prognosis (lung function, airflow obstruction) if not treated. Our data furthermore indicate that in the elderly asthmatics, VAT is mainly impacted, and VAT was recently shown to increase with age in both males and females.26 Intriguingly, visceral fat may contribute to airway narrowing in asthma.51,52 Overall, obese asthma has been linked with increased (adipose tissue) inflammation and asthma morbidity.53
Our data indicate that the pattern of asthma control was relatively similar with a large proportion having good asthma control in the different age groups, although in children/adolescents, and to a lesser extent the elderly, asthma was less controlled than in adults, which paralleled with the use of ICS. This is in line with previous studies that highlight a difficult-to-control asthma in the elderly34 as well as in children/adolescents.
Other general population cohorts have found similar rates of asthma control, although definitions were different to the current study54 and often times involved severe asthma.55–58
While reversibility testing is advised in all guidelines,59 a Canadian general population study observed that reversibility was found in only 16.3% in study participants with a doctor’s diagnosis of asthma and current asthma symptoms,60 a finding that is similar to the prevalence of 17.1% in current asthmatics in our study as well as a 17.3% reversibility in current asthmatics as found by a study with combined data from three large population studies.61 Collectively, this would suggest that reversibility testing is not sufficient to diagnose asthma in the general population and would require further assessment for accurate asthma diagnosis.
The primary strengths of our study are the population-based design with a large sample and broad age range of participants representative for the general Austrian population.15 Another strength is atopy testing in all participants of this general population cohort. Additionally, all analyses of spirometry and body composition, based on state-of-The-art DXA, were performed by trained technicians using standardized operational procedures.
A limitation of this study is that prescribed medication adherence was assessed by self-reporting. Additionally, the data was collected between 2012 and 2016, before the era of current biologic treatments. Furthermore, there were no direct measurements of inflammation relevant to asthma (eg interleukins and FeNO). Since induced sputum was not obtained, we cannot draw any conclusions on sputum-derived eosinophil levels to further elucidate eosinophilic asthma. We recognize that not all asthmatics with a positive skin prick necessarily have allergic asthma,62 although we extended on the definition of allergic asthma by including at least a diagnosis of allergy, or atopy symptoms in addition to a positive skin prick. Lastly, as this study was cross-sectional in design, we cannot draw any causal inference between the parameters addressed in the current study and asthma.
Overall, the present study on current asthma in the general population highlighted a prevalence of 4.4% in a large cohort with a broad age range, which is associated with lower lung function. In addition, our findings advance the knowledge on asthma in that 1) there is an age-dependent shift from allergic to non-allergic asthma, in both of which a non-eosinophilic profile was more prominent. 2) Eosinophilic asthma is strongly associated with asthma symptoms, asthma control, asthma medication and impaired lung function, whereas allergic status is associated with male sex, body composition and body morphometry. 3) Obesity is prevalent, and asthma has major associations with body composition with indices of increased fat mass in both children and adults, central obesity in adults, and VAT in the elderly.
Summary
There are differential asthma phenotypes in the general population; eosinophilic asthma is strongly associated with the lowest lung function and asthma control, and symptoms. Furthermore, asthma has major association with body composition.
Abbreviation
LEAD Study, Lung, Heart, Social, Body Study; FEV1, Forced expiratory volume in 1 second; FVC, Forced vital capacity; GLI, Global Lung Initiative; DXA, Dual-energy X-ray absorptiometry; SES, Socioeconomic status; SHS, secondhand smoking; MS, Maternal smoking; FMI, Fat mass index; LMI, Lean mass index; VAT, visceral adipose tissue; SHS, Second-hand smoking; BMI, Body mass index; BD, bronchodilation; Th2, T helper 2; COPD, Chronic obstructive pulmonary disease; ACT, Asthma Control Test; GINA, Global Initiative for Asthma; ICS, inhaled corticosteroids; SABA, short-acting beta agonist; LABA, long-acting beta agonist; SAMA, short-acting muscarinic antagonist; LAMA, long-acting muscarinic antagonist.
Author Contributions
All authors made a significant contribution to the work reported, whether that is in the conception, study design, execution, acquisition of data, analysis and interpretation, or in all these areas; took part in drafting, revising or critically reviewing the article; gave final approval of the version to be published; have agreed on the journal to which the article has been submitted; and agree to be accountable for all aspects of the work.
Funding
The Austrian LEAD Study is supported by the Ludwig Boltzmann Society, the Municipal Department of Health and Environment of Vienna, the Federal State Governmental Department of Health of Lower Austria, and unrestricted scientific grants from AstraZeneca, Böhringer Ingelheim, Chiesi Pharma, Glaxo Smith Kline and Menarini Pharma. None of the supporting parties had any participation in the data, nor did they contribute to the design or the content of the present manuscript.
Disclosure
Prof. Dr. Roland Buhl reports grants from Boehringer Ingelheim, GlaxoSmithKline, Novartis, Roche; personal fees from AstraZeneca, Berlin-Chemie, Boehringer Ingelheim, Chiesi, Cipla, GlaxoSmithKline, Novartis, Sanofi, Roche, Teva, outside the submitted work. Prof. Dr. Wolfgang Pohl reports personal fees from AstraZeneca, Chiesi, Sanofi; grants, personal fees from GSK, outside the submitted work. Prof. Dr. Charles G Irvin reports Scientific Advisory Board for Medical Graphics Corp that manufactures PFT equipment. Dr Sylvia Hartl reports grants, personal fees from GSK, Astra zeneca, Chiesi Fatma, Menarini Pharma; personal fees from MSD and Roche, outside the submitted work. The authors declare no other conflicts of interest in this work.
References
1. Dharmage SC, Perret JL, Custovic A. Epidemiology of Asthma in Children and Adults. Front Pediatr. 2019;7:246.
2. Disease GBD, Injury I, Prevalence C. Global, regional, and national incidence, prevalence, and years lived with disability for 328 diseases and injuries for 195 countries, 1990-2016: a systematic analysis for the Global Burden of Disease Study 2016. Lancet. 2017;390:1211–1259.
3. To T, Stanojevic S, Moores G, et al. Global asthma prevalence in adults: findings from the cross-sectional world health survey. BMC Public Health. 2012;12:204.
4. Asher I, Pearce N. Global burden of asthma among children. Int J Tuberc Lung Dis. 2014;18:1269–1278.
5. Battaglia S, Benfante A, Spatafora M, Scichilone N. Asthma in the elderly: a different disease? Breathe. 2016;12:18–28.
6. Plaza V, Serra-Batlles J, Ferrer M, Morejon E. Quality of life and economic features in elderly asthmatics. Respiration. 2000;67:65–70.
7. Bellia V, Pedone C, Catalano F, et al. Asthma in the elderly: mortality rate and associated risk factors for mortality. Chest. 2007;132:1175–1182.
8. Chen M, Shepard K, Yang M, et al. Overlap of allergic, eosinophilic and type 2 inflammatory subtypes in moderate-to-severe asthma. Clin Exp Allergy. 2021;51:546–555.
9. Wenzel SE. Severe Adult Asthmas: integrating Clinical Features, Biology, and Therapeutics to Improve Outcomes. Am J Respir Crit Care Med. 2021;203:809–821.
10. Moore WC, Meyers DA, Wenzel SE, et al. Identification of asthma phenotypes using cluster analysis in the Severe Asthma Research Program. Am J Respir Crit Care Med. 2010;181:315–323.
11. Shaw DE, Sousa AR, Fowler SJ, et al. Clinical and inflammatory characteristics of the European U-BIOPRED adult severe asthma cohort. Eur Respir J. 2015;46:1308–1321.
12. Loza MJ, Djukanovic R, Chung KF, et al. Validated and longitudinally stable asthma phenotypes based on cluster analysis of the ADEPT study. Respir Res. 2016;17:165.
13. Haldar P, Pavord ID, Shaw DE, et al. Cluster analysis and clinical asthma phenotypes. Am J Respir Crit Care Med. 2008;178:218–224.
14. Reddel HK, Bacharier LB, Bateman ED, et al. Global Initiative for Asthma Strategy 2021: executive Summary and Rationale for Key Changes. Am J Respir Crit Care Med. 2022;205:17–35.
15. Breyer-Kohansal R, Hartl S, Burghuber OC, et al. The LEAD (Lung, Heart, Social, Body) Study: objectives, Methodology, and External Validity of the Population-Based Cohort Study. J Epidemiol. 2019;29:315–324.
16. He X, Cheng G, He L, et al. Adults with current asthma but not former asthma have higher all-cause and cardiovascular mortality: a population-based prospective cohort study. Sci Rep. 2021;11:1329.
17. Eisner MD. Environmental tobacco smoke exposure and pulmonary function among adults in NHANES III: impact on the general population and adults with current asthma. Environ Health Perspect. 2002;110:765–770.
18. Nathan RA, Sorkness CA, Kosinski M, et al. Development of the asthma control test: a survey for assessing asthma control. J Allergy Clin Immunol. 2004;113:59–65.
19. Pellegrino R, Viegi G, Brusasco V, et al. Interpretative strategies for lung function tests. Eur Respir J. 2005;26:948–968.
20. Miller MR, Hankinson J, Brusasco V, et al. Standardisation of spirometry. Eur Respir J. 2005;26:319–338.
21. Hall GL, Filipow N, Ruppel G, et al. Official ERS Technical Standard: Global Lung Function Initiative Reference Values for Static Lung Volumes in Individuals of European Ancestry. Eur Respir J. 2021;57.
22. Quanjer PH, Stanojevic S, Cole TJ, et al. Initiative ERSGLF. Multi-ethnic reference values for spirometry for the 3-95-yr age range: the global lung function 2012 equations. Eur Respir J. 2012;40:1324–1343.
23. Crapo RO. Standardization of Spirometry, 1994 Update American Thoracic Society. Am J Respir Crit Care Med. 1994;1995(152):1107–1136.
24. Kolli F, Breyer MK, Hartl S, et al. Aero-Allergen Sensitization in the General Population: longitudinal Analyses of the LEAD (Lung Heart Social Body) Study. J Asthma Allergy. 2022;15:461–473.
25. de Onis M, Onyango AW, Borghi E, Siyam A, Nishida C, Siekmann J. Development of a WHO growth reference for school-aged children and adolescents. Bull World Health Organ. 2007;85:660–667.
26. Ofenheimer A, Breyer-Kohansal R, Hartl S, et al. Reference values of body composition parameters and visceral adipose tissue (VAT) by DXA in adults aged 18-81 years-results from the LEAD cohort. Eur J Clin Nutr. 2020;74:1181–1191.
27. Global Initiative for Asthma. Global Strategy for Asthma Management and Prevention; 2022. Available from: www.ginasthma.org.
28. Brusselle GG, Koppelman GH. Biologic Therapies for Severe Asthma. N Engl J Med. 2022;386:157–171.
29. IBM. SPSS Statistics for Windows. Version 27.0 Ed. IBM Corp; 2020.
30. Sears MR. Trends in the prevalence of asthma. Chest. 2014;145:219–225.
31. Bloom CI, Saglani S, Feary J, Jarvis D, Quint JK. Changing prevalence of current asthma and inhaled corticosteroid treatment in the UK: population-based cohort 2006-2016. Eur Respir J. 2019;53.
32. Oraka E, Kim HJ, King ME, Callahan DB. Asthma prevalence among US elderly by age groups: age still matters. J Asthma. 2012;49:593–599.
33. Burr ML, Charles TJ, Roy K, Seaton A. Asthma in the elderly: an epidemiological survey. Br Med J. 1979;1:1041–1044.
34. Baptist AP, Busse PJ. Asthma Over the Age of 65: all’s Well That Ends Well. J Allergy Clin Immunol Pract. 2018;6:764–773.
35. Burrows B, Barbee RA, Cline MG, Knudson RJ, Lebowitz MD. Characteristics of asthma among elderly adults in a sample of the general population. Chest. 1991;100:935–942.
36. Gillman A, Douglass JA. Asthma in the elderly. Asia Pac Allergy. 2012;2:101–108.
37. Bauer BA, Reed CE, Yunginger JW, Wollan PC, Silverstein MD. Incidence and outcomes of asthma in the elderly. A population-based study in Rochester, Minnesota. Chest. 1997;111:303–310.
38. Pakkasela J, Ilmarinen P, Honkamaki J, et al. Age-specific incidence of allergic and non-allergic asthma. BMC Pulm Med. 2020;20:9.
39. Douwes J, Gibson P, Pekkanen J, Pearce N. Non-eosinophilic asthma: importance and possible mechanisms. Thorax. 2002;57:643–648.
40. Esteban-Gorgojo I, Antolin-Amerigo D, Dominguez-Ortega J, Quirce S. Non-eosinophilic asthma: current perspectives. J Asthma Allergy. 2018;11:267–281.
41. Woodruff PG, Modrek B, Choy DF, et al. T-helper type 2-driven inflammation defines major subphenotypes of asthma. Am J Respir Crit Care Med. 2009;180:388–395.
42. Tzortzaki EG, Proklou A, Siafakas NM. Asthma in the Elderly: can We Distinguish It from COPD? J Allergy (Cairo). 2011;2011:843543.
43. Chen Y, Dales R, Jiang Y. The association between obesity and asthma is stronger in nonallergic than allergic adults. Chest. 2006;130:890–895.
44. Chen Y, Rennie D, Cormier Y, Dosman J. Atopy, obesity, and asthma in adults: the Humboldt study. J Agromedicine. 2009;14:222–227.
45. Benson VS, Hartl S, Barnes N, Galwey N, Van Dyke MK, Kwon N. Blood eosinophil counts in the general population and airways disease: a comprehensive review and meta-analysis. Eur Respir J. 2022;1:59.
46. Beuther DA, Sutherland ER. Overweight, obesity, and incident asthma: a meta-analysis of prospective epidemiologic studies. Am J Respir Crit Care Med. 2007;175:661–666.
47. Khalid F, Holguin F. A review of obesity and asthma across the life span. J Asthma. 2018;55:1286–1300.
48. Sideleva O, Black K, Dixon AE. Effects of obesity and weight loss on airway physiology and inflammation in asthma. Pulm Pharmacol Ther. 2013;26:455–458.
49. Moitra S, Carsin AE, Abramson MJ, et al. Long-term effect of asthma on the development of obesity among adults: an international cohort study, ECRHS. Thorax. 2022;1:54.
50. Lang JE, Hossain J, Dixon AE, et al. American Lung Association-Asthma Clinical Research C. Does age impact the obese asthma phenotype? Longitudinal asthma control, airway function, and airflow perception among mild persistent asthmatics. Chest. 2011;140:1524–1533.
51. Yang MS, Choi S, Choi Y, Jin KN. Association Between Airway Parameters and Abdominal Fat Measured via Computed Tomography in Asthmatic Patients. Allergy Asthma Immunol Res. 2018;10:503–515.
52. Shuster A, Patlas M, Pinthus JH, Mourtzakis M. The clinical importance of visceral adiposity: a critical review of methods for visceral adipose tissue analysis. Br J Radiol. 2012;85:1–10.
53. Peters U, Dixon AE, Forno E. Obesity and asthma. J Allergy Clin Immunol. 2018;141:1169–1179.
54. Lenoir M, Williamson A, Stanford RH, Stempel DA. Assessment of asthma control in a general population of asthmatics. Curr Med Res Opin. 2006;22:17–22.
55. von Bulow A, Kriegbaum M, Backer V, Porsbjerg C. The prevalence of severe asthma and low asthma control among Danish adults. J Allergy Clin Immunol Pract. 2014;2:759–767.
56. Backman H, Jansson SA, Stridsman C, et al. Severe asthma-A population study perspective. Clin Exp Allergy. 2019;49:819–828.
57. Schleich F, Brusselle G, Louis R, et al. Heterogeneity of phenotypes in severe asthmatics. The Belgian Severe Asthma Registry (BSAR). Respir Med. 2014;108:1723–1732.
58. Mullerova H, Cockle SM, Gunsoy NB, Nelsen LM, Albers FC. Clinical characteristics and burden of illness among adolescent and adult patients with severe asthma by asthma control: the IDEAL study. J Asthma. 2021;58:459–470.
59. Reddel HK, Bateman ED, Becker A, et al. A summary of the new GINA strategy: a roadmap to asthma control. Eur Respir J. 2015;46:622–639.
60. Aaron SD, Vandemheen KL, Boulet LP, et al. Canadian Respiratory Clinical Research C. Overdiagnosis of asthma in obese and nonobese adults. CMAJ. 2008;179:1121–1131.
61. Janson C, Malinovschi A, Amaral AFS, et al. Bronchodilator reversibility in asthma and COPD: findings from three large population studies. Eur Respir J. 2019;4:54.
62. Arbes SJ. Do all asthmatics with atopy have atopic asthma? J Allergy Clin Immunol. 2012;130:1202–1204.
 © 2023 The Author(s). This work is published and licensed by Dove Medical Press Limited. The
full terms of this license are available at https://www.dovepress.com/terms
and incorporate the Creative Commons Attribution
- Non Commercial (unported, 3.0) License.
By accessing the work you hereby accept the Terms. Non-commercial uses of the work are permitted
without any further permission from Dove Medical Press Limited, provided the work is properly
attributed. For permission for commercial use of this work, please see paragraphs 4.2 and 5 of our Terms.
© 2023 The Author(s). This work is published and licensed by Dove Medical Press Limited. The
full terms of this license are available at https://www.dovepress.com/terms
and incorporate the Creative Commons Attribution
- Non Commercial (unported, 3.0) License.
By accessing the work you hereby accept the Terms. Non-commercial uses of the work are permitted
without any further permission from Dove Medical Press Limited, provided the work is properly
attributed. For permission for commercial use of this work, please see paragraphs 4.2 and 5 of our Terms.
Recommended articles
Assessment of Symptoms Control, Pulmonary Function and Related Quality of Life in Asthmatic Patients Treated with Extrafine Beclomethasone Dipropionate/Formoterol Fumarate 100/6 μg pMDI: Results of a Multicenter Observational Study in Romania (ALFRESCO Study)
Ulmeanu R, Bloju S, Vittos O
Journal of Asthma and Allergy 2022, 15:919-933
Published Date: 8 July 2022
Prevalence of Chronic Obstructive Pulmonary Disease in an Urban Area. Changes in COPD Ten Years on

García Castillo E, Alonso Pérez T, Peláez A, Pérez González P, Soriano JB, Ancochea J
International Journal of Chronic Obstructive Pulmonary Disease 2022, 17:2431-2441
Published Date: 29 September 2022
Prevalence and Characterisation of Patients with Asthma According to Disease Severity in Portugal: Findings from the EPI-ASTHMA Pilot Study
João C, Jácome C, Brito D, Teixeira P, Quelhas-Santos J, Amorim L, Barbosa MJ, Bulhões C, Lopes F, Pardal M, Bernardo F, Fonseca JA, Correia de Sousa J
Journal of Asthma and Allergy 2022, 15:1441-1453
Published Date: 19 October 2022
Prevalence, Management, and Risk Factors of Asthma Among School-Age Children in Yogyakarta, Indonesia
Triasih R, Setyowireni D, Nurani N, Setyati A
Journal of Asthma and Allergy 2023, 16:23-32
Published Date: 5 January 2023
Prevalence and Associated Factors of Chronic Obstructive Pulmonary Disease Among Adults in Neno District, Malawi: A Cross-Sectional Analytical Study
Zaniku HR, Connolly E, Aron MB, Matanje BL, Ndambo MK, Talama GC, Munyaneza F, Ruderman T, Rylance J, Dullie LW, Lalitha R, Banda NPK, Muula AS
International Journal of Chronic Obstructive Pulmonary Disease 2024, 19:389-401
Published Date: 5 February 2024