
Back to Journals » Journal of Inflammation Research » Volume 18
Association of TIMP-2 Expression with Postoperative Prognosis in Hepatocellular Carcinoma Patients and Development of a Predictive Model
Authors Liao SN  , Li T , Liu ZH, Luo DC, Long XW, Liao XL , Liu JL
Received 27 March 2025
Accepted for publication 13 August 2025
Published 26 August 2025 Volume 2025:18 Pages 11703—11736
DOI https://doi.org/10.2147/JIR.S530061
Checked for plagiarism Yes
Review by Single anonymous peer review
Peer reviewer comments 2
Editor who approved publication: Dr Fatih Türker
Si-Na Liao,1,* Ting Li,2,* Zhi-Hui Liu,1 Dong-Cheng Luo,3,4 Xia-Wei Long,2 Xiao-Li Liao,2 Jian-Lun Liu5
1Day Oncology Unit, Guangxi Medical University Cancer Hospital, Nanning, Guangxi Zhuang Autonomous Region, People’s Republic of China; 2Department of Digestive Oncology, Guangxi Medical University Cancer Hospital, Nanning, Guangxi Zhuang Autonomous Region, People’s Republic of China; 3Guangdong Provincial Key Laboratory of Viral Hepatitis Research, Department of Infectious Diseases, Nanfang Hospital, Southern Medical University, Guangzhou, People’s Republic of China; 4Department of Health Management, Nanfang Hospital, Southern Medical University, Guangzhou, People’s Republic of China; 5Breast Surgery Unit 1, Guangxi Medical University Cancer Hospital, Nanning, Guangxi Zhuang Autonomous Region, People’s Republic of China
*These authors contributed equally to this work
Correspondence: Jian-Lun Liu, Email [email protected] Xiao-Li Liao, Email [email protected]
Purpose: This study aimed to investigate the expression of tissue inhibitor of matrix metalloproteinase-2 (TIMP-2) in postoperative patients with hepatocellular carcinoma (HCC), its relationship with prognosis, and to build a nomogram prediction model for overall survival (OS) and disease-free survival (DFS) based on TIMP-2 expression.
Patients and Methods: Expression profile data from HCC-related datasets were obtained from the Gene Expression Omnibus to analyze the correlation between TIMP-2 and HCC survival and prognosis, and its relationship with the HCC tumor immune microenvironment. Overall, 118 patients who underwent radical surgery for HCC were included retrospectively. To investigate the relationship between TIMP-2 expression and the clinicopathological characteristics and prognosis of patients with HCC, Cox regression analysis was used to determine the independent prognostic factors for DFS and OS. A nomogram prediction model for OS and DFS after HCC was established based on TIMP-2.
Results: In the TIMP-2 high expression group, CD4+ T cells, CD8+ T lymphocytes, macrophages, and natural killer cells were the predominant infiltrates. The 1-, 2-, 3-, and 5-year survival and DFS rates in the low TIMP-2 expression group were higher than in the high TIMP-2 expression group (P< 0.01). TIMP-2, neutrophil-to-lymphocyte (NLR), and tumor count were independent risk factors for OS (P< 0.05), while NLR, liver cirrhosis, and ECOG score were independent risk factors for DFS (P< 0.05). A TIMP-2-based nomogram for OS and DFS demonstrated good discrimination, calibration capabilities, and clinical utility as confirmed by ROC curves, calibration maps, and DCA in both training and verification sets.
Conclusion: TIMP-2 may be involved in regulating the immune microenvironment as an immune inflammation-related gene in HCC. The nomogram prediction model of OS and DFS after HCC was established based on TIMP-2, providing a tool to predict the survival prognosis and recurrence risk of patients after HCC.
Keywords: TIMP-2, hepatocellular carcinoma, tumor microenvironment, nomogram model
Introduction
Primary liver cancer is the third leading cause of cancer-related death, with as many as 865,000 new cases, ranking sixth among malignant tumors.1 Our country is a country with a high incidence of primary liver cancer. New cases account for half of the world’s total new cases every year, and the annual mortality rate accounts for more than half of all cases worldwide. Hepatocellular carcinoma (HCC) is the main histological subtype, accounting for approximately 90% of all primary liver malignancies.2 Most patients with HCC are already advanced when diagnosed and miss the best opportunity for surgery. The postoperative recurrence rate is as high as 70–80%, and the prognosis is poor.3
High serum alpha-fetoprotein (AFP) levels have been shown to be associated with the occurrence and development of HCC, and have been used as a tool for diagnosing HCC and monitoring its recurrence. However, 20–30% of patients with HCC are negative for AFP,4 and AFP cannot play a diagnostic role in these patients. Addition, AFP is abnormally elevated in diseases such as liver cirrhosis, hepatitis, testicular germinoma and some digestive tract tumors, indicating that its specificity is insufficient.5 Secondly, AFP cannot predict the risk of recurrence and metastasis of HCC and determine its survival and prognosis. Therefore, identifying an effective marker to monitor recurrence and assess prognosis in HCC is an important research topic.
The tumor microenvironment (TME) has recently emerged as a key factor in tumor occurrence, development, invasion and metastasis, and has attracted considerable attention. As one of the main components of the TME, the extracellular matrix plays a key role in the process of tumor invasion and metastasis.6 Matrix metalloproteinases (MMPs) are the main mediators of extra cellular matrix (ECM) decomposition and remodeling and play a role in many pathological conditions, including promoting tumor cell invasion and metastasis, cell growth and differentiation, angiogenesis, and apoptosis.7–9 Tissue inhibitor of matrix metalloproteinase-2 (TIMP-2) belongs to the tissue inhibitor of MMPs family. As an endogenous inhibitor of MMPs, TIMP-2 is a steady-state regulator of the interface between the ECM and cellular components.10,11 Studies have shown that in the TME dominated by tumor and stromal cells, TIMP-2 mainly plays a role in anti-angiogenesis and changes the TME through its non-MMP-dependent activity.11,12 Some studies have found that the expression of TIMP-2 is closely related to tumor prognosis, but the prognostic results vary in different types of tumors. It has been reported that elevated expression of TIMP-2 is associated with poor prognosis in HCC, gastric cancer, glioblastoma, and head and neck squamous cell carcinoma,13,14 and is associated with good prognosis in endometrial cancer, pancreatic cancer, and renal cancer.15–17 Simultaneously, multiple clinical studies have revealed that TIMP-2 is a contradictory factor. In breast cancer,18,19 lung cancer,20,21 cervical cancer,22–24 ovarian cancer25–27 and bladder cancer,28–30 different studies have provided conflicting evidence on the prognostic role of TIMP2 in the same cancer. TIMP-2 is highly expressed in HCC with extensive dysregulation of angiogenesis, and patients with HCC with high TIMP-2 expression have significantly longer postoperative survival times than those with low TIMP-2 expression.31–34 However, some studies have proposed a different view. TIMP-2 is highly expressed in stromal cells and is associated with HCC cell invasion and metastasis. In addition to inhibiting tumors, it can directly promote tumor metastasis,35 but its mechanism of action remains unclear. In HCC, TIMP-2 shows two-way effects on antitumor and pro-tumor activities, which may be due to poor prognosis in different TMEs.
Previous studies by our research group found that the expression of TIMP-2 was up-regulated in patients with HCC prone to recurrence, suggesting that TIMP-2 may be related to the postoperative recurrence of HCC and poor prognosis. This prognostic outcome is consistent with those of previous studies, suggesting that TIMP-2 promotes HCC invasion and metastasis. This is consistent with pro-tumor activity.35 Therefore, TIMP-2 may be an effective marker for monitoring the postoperative recurrence of HCC and judging prognosis. Moreover, the pro-tumor activity of TIMP-2 may be related to the complex TME of HCC; however, few studies have explored this correlation. This study aims to investigate the relationship between TIMP-2 and the tumor and immune microenvironments of HCC, and to explore the feasibility of TIMP-2 as an effective marker for monitoring postoperative recurrence and predicting prognosis in HCC.
Materials and Methods
Correlation Between TIMP-2 Protein and HCC
In our previous study, 18 patients after radical surgery were selected and divided into groups A (n=9) and B (n=9) according to the difference in DFS. Group A included patients with HCC with DFS >3 years, and group B included patients with HCC with DFS <1.5 years. There was a statistically significant difference in the DFS between the two groups, whereas there was no statistical difference in other clinical characteristics. The DFS in group B was shorter, and the patients were prone to relapse. The expression levels of 440 tumor-associated proteins in 18 samples were measured using protein microarray technology. After normalization of the original data, 31 differentially expressed proteins were found by limma package differential expression analysis, of which 25 proteins were up-regulated in the relapse-prone group (group B) (Foldchange ≥1.5; P < 0.05), the up-regulated expression of TIMP-2 ranked higher.
Survival and transcriptomic test data of 133 patients with HCC were extracted from the GSE148355 (53 cases) and GSE54236 (80 cases) datasets of the Gene Expression Omnibus. Based on the expression of the TIMP-2 gene, they were divided into high-expression and low-expression groups, and the difference in survival rates between the two groups was compared using the Kaplan–Meier method. Finally, a multivariate Cox regression analysis was performed on the GSE148355 dataset combined with other clinical characteristics. As the GSE54236 dataset did not include patient clinical characteristics, a multivariate Cox regression analysis was not performed.
Enrichment Analysis of Biological Functions and Pathways of the TIMP-2 Protein
TIMP-2-related genes were obtained from the PathwayCommons database (httP://www.Pathwaycommons.org/), and these genes were enriched by the Basic Ontology Database (GeneOntologyGO) and the Kyoto Encyclopedia of Genes and Genomes (KEGG) using the “clusterProfiler” software package (P value <0.05). The STRING database was used to analyze and visualize co-expression networks among the top 25 proteins associated with TIMP-2.
Analysis of Immune Infiltration of TIMP-2 Protein in TME
Transcriptome data from 368 HCC tumor samples within the TCGA-LIHC cohort were obtained using USC Xena tools. Samples were then categorized into high and low expression groups based on TIMP-2 levels, defined as greater than the upper quartile and less than the lower quartile, respectively. The ESTIMATE algorithm calculates the immune and matrix scores in the TME, and simultaneously evaluates tumor purity. The Immune Tumor Biology Research (IOBR) package in R integrates six commonly used algorithms (MCPcounter, TIMER, xCell, CIBERSORT, EPIC, and quanTiSeq) to analyze and compare differences in immune cell infiltration of TIMP-2 with different expression levels in the TME. Immunophenoscores were calculated for four immunophenotypes: effector cells (EC), suppressor cells (SC), antigen presentation (MHC molecules), and immune checkpoint (CP). Subsequently, the correlation between TIMP-2 and the TME was analyzed using Spearman correlation test.
Patients and Follow-Up Methods
This study included 118 patients with primary HCC who underwent radical resection at the Cancer Hospital Affiliated to Guangxi Medical University from January 2013 to November 2014. The inclusion criteria were: (a) age 18–70 years, (b) primary HCC diagnosed by postoperative pathology, (c) no prior systemic antitumor treatment or liver cancer resection, (d) complete clinical and pathological data. (e) Informed consent was obtained from the patient before surgery, and an informed consent form was signed for specimen collection. Tumor tissue specimens from 118 patients with HCC were collected, and 20 paired liver tissues adjacent to the cancer (1 cm from the tumor edge) were collected simultaneously. All tissue specimens were kept in a refrigerator at −80°C, and all patients signed written informed consent before the start of this study. All patients were regularly followed up through telephone and the hospital follow-up office to obtain postoperative data. Disease-free survival (DFS) was defined as the time interval from the date of surgery to the first recurrence or metastasis after surgery, or death from any cause. Overall survival (OS) is defined as the time interval from the date of surgery to death. Follow-up continued until early November 2022. The Ethics Committee of the Affiliated Cancer Hospital of Guangxi Medical University approved this study. The study complied with the principles of the Declaration of Helsinki.
Data Collection
Preoperative clinical data before surgery were collected, and the platelet-lymphocyte ratio (PLR), neutrophil-lymphocyte ratio (NLR), systemic inflammation, and immune index (SII = platelet × neutrophil/lymphocyte count) were calculated.
Detection of TIMP-2 Protein Expression Level
The expression of TIMP-2 in 20 HCC tissues and adjacent tissues was analyzed using enzyme-linked immunosorbent assay (ELISA), and the expression level of TIMP-2 protein in 118 HCC tissues was detected.
Establishment of a Nomogram Prediction Model
A prognostic prediction model was constructed based on the results of the Cox multivariate regression analysis, and patients were randomly divided into training and verification sets at a ratio of 2:1. Overall, 76 and 37 patients were included in the training and verification sets, respectively. Use the “survival” package in the R package to draw nomograms of OS and DFS for 1, 2, 3, and 5 years. The R package “timeROC” is used to draw ROC curves, respectively, and the accuracy and consistency of model prediction are comprehensively evaluated through tdAUC. The clinical utility of the model was evaluated using the “ggDCA” package in R software. Using the 50th and 85th percentiles of the predicted score as cutoff values, patients were evenly divided into three groups (low-risk, intermediate-risk, and high-risk) and displayed as survival curves.
Statistical Analysis
Statistical analyses were performed using IBM SPSS Statistics for Windows, version 27.0 (IBM Corp., Armonk, NY., USA). The expression of TIMP-2 in cancer tissues and paired adjacent cancerous tissues was compared using the Wilcoxon signed-rank test. The differences between high and low TIMP-2 expression levels between groups were compared using a χ2 test or Fisher’s exact test. The t-test was used to analyze the differences in peripheral blood immune indicators in patients with HCC showing different expression levels of TIMP-2. Pearson’s correlation analysis was used to analyze the correlation between TIMP-2 protein expression and peripheral blood immune indicators. Survival comparisons were performed using the Kaplan–Meier method and Log rank test. The Cox proportional hazards regression model was used to perform univariate and multivariate (likelihood ratio test (forward: LR) method for maximum partial likelihood estimation to screen independent variables) survival analyses. Statistical significance was set at P=0.05. Time-dependent ROC curves, calibration plots, nomograms, and DCA were plotted using the R packages: timeROC, pROC, and ggDCA.
Results
Differential Protein Analysis Associated with the Prognosis of HCC
Using the limma package, our research group identified 54 differentially expressed proteins from 440 proteins identified in a previous study, of which three proteins were highly expressed in group A and 51 proteins were highly expressed in group B (Figure 1A). TIMP-2 was highly expressed in Group B (Figure 1B). The log2 (foldchange) value of TIMP-2 is −2.56 (P=0.006) (using group A as reference).
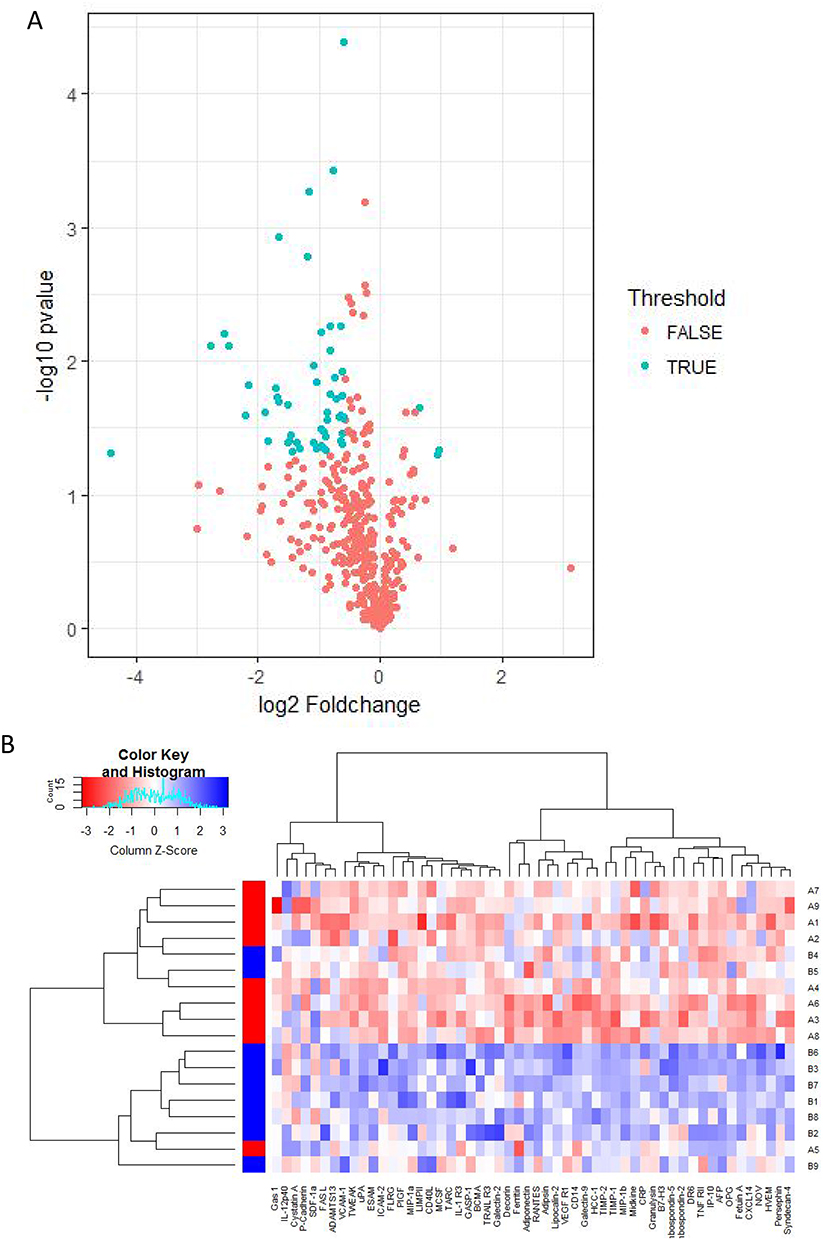 |
Figure 1 (A) Volcano plot showing differentially expressed proteins between groups A and B; (B) Clustering heat map of 54 differentially expressed proteins. |
Relationship Between TIMP-2 Protein Expression and Prognosis of HCC
The samples were divided into high- and low-expression groups based on TIMP-2 gene expression. The results of the GSE148355 dataset showed that the median DFS was not reached for either group (Figure 2A). Multivariate Cox regression analysis showed that the risk of recurrence in the group with high TIMP-2 expression was 1.08 times higher than that in the group with low TIMP-2 expression (P<0.05; Figure 2B). Analysis of 2-year survival time and OS time on the GSE54236 dataset showed that the two-year median OS of patients with HCC in the TIMP-2 high expression group was 18.5 months, while the median OS of the TIMP-2 low expression group was not reached, and the difference was statistically significant (P<0.01; Figure 2C); The OS time analysis showed that the total median OS of patients in the high and low expression groups was 18.5 months and 25 months respectively (P>0.05; Figure 2D).
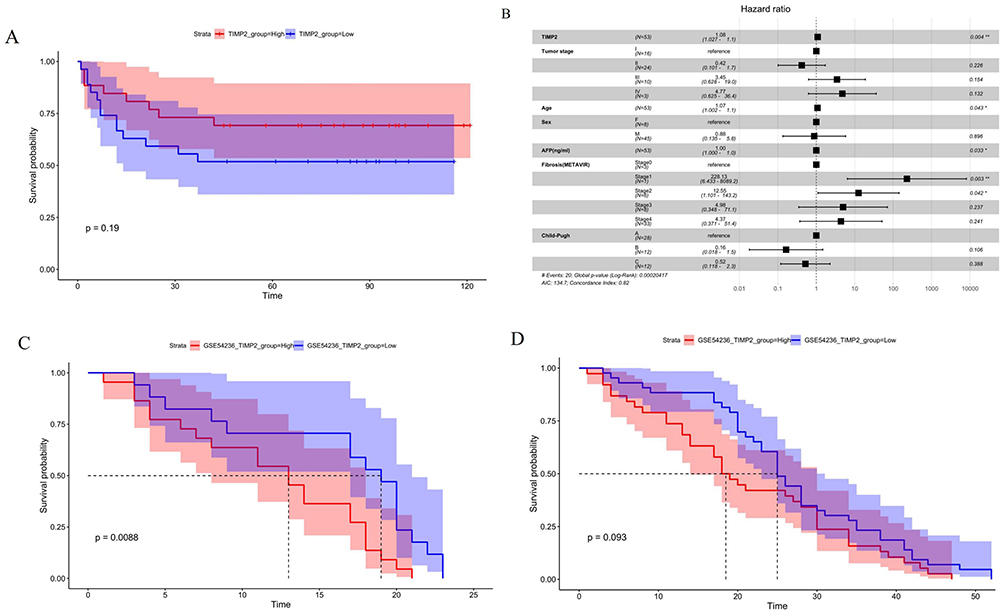 |
Figure 2 Analysis of survival and prognosis between TIMP-2 and hepatocellular carcinoma: (A) Univariate analysis of DFS in GSE148355 data set; (B) Multivariate COX regression analysis of DFS in GSE148355 data set, *p < 0.05, **p < 0.01; (C) Univariate analysis within 2 years of OS in GSE54236 data set; (D) Univariate analysis of OS in GSE54236 data set. High expression of TIMP-2 is a risk factor for poor survival and prognosis in patients with hepatocellular carcinoma. |
Analysis of Biological Processes and Pathway Enrichment of TIMP-2
Gene ontology enrichment analysis revealed significant enrichment in biological processes including cell response to tumor necrosis factor, tumor necrosis factor, extracellular matrix tissue, extracellular structural tissue, and proteasome-mediated ubiquitin-dependent protein catabolic processes (Figure 3A and C), while KEGG enrichment analysis showed that genes were significantly enriched in the proteoglycan metabolism pathway of cancer (Figure 3B and D). The gene concept network diagram showed that TIMP-2 is involved in tumor-related biological processes and gene pathways. The main proteins involved in these tumor-related biological processes and gene pathways are TNF, MMP-16, COL1A1, ITGB1 (β1 integrin), MMP-2, PSME3, etc. (Figure 3E and F). SRTING network protein analysis showed that TIMP-2, MMP-16, TIGB1, and MMP-2 were essential nodes in the protein network (Figure 4).
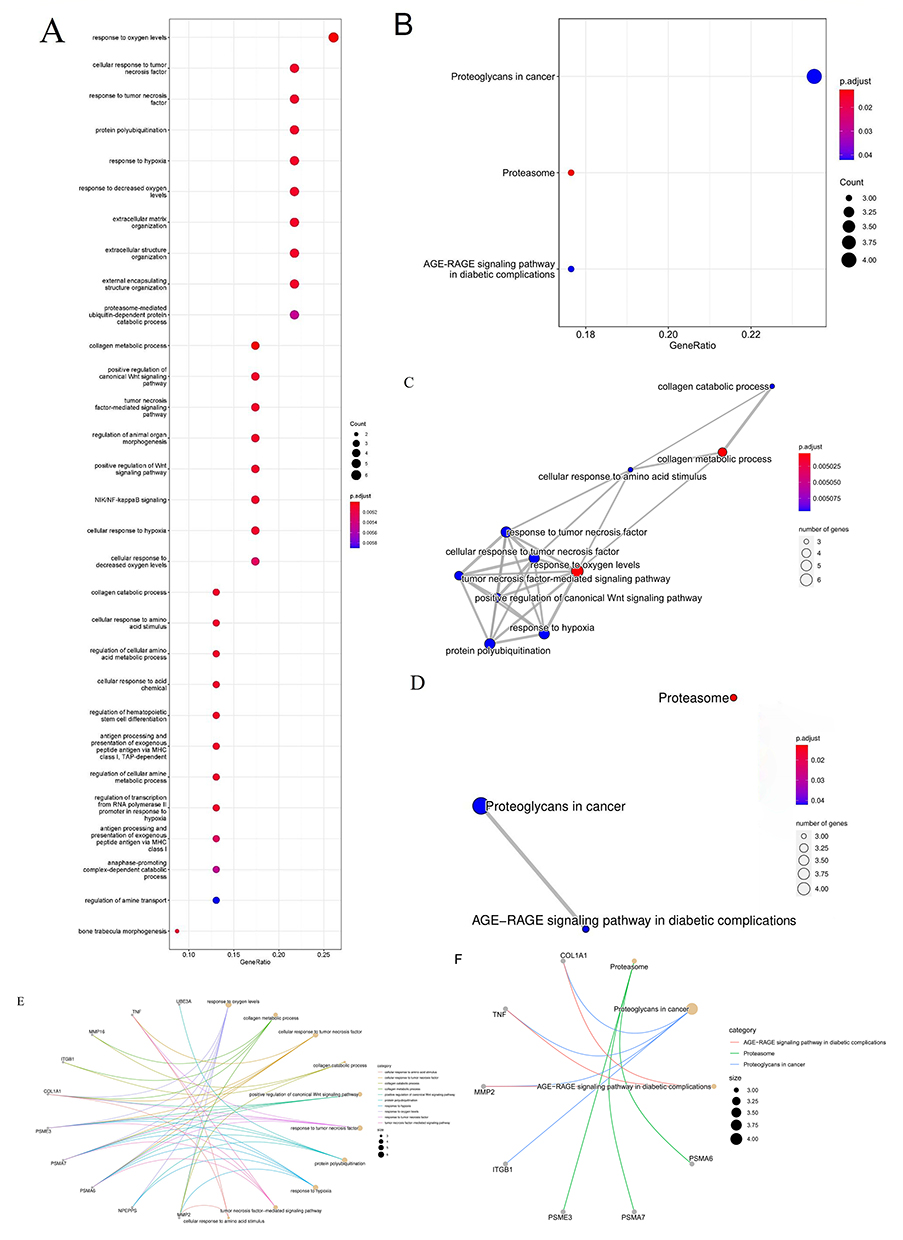 |
Figure 3 GO and KEGG analysis of TIMP-2 related genes: (A) GO enrichment analysis of TIMP-2 related biological processes; (B) KEGG enrichment analysis of TIMP-2 related metabolism and pathway; (C) GO enrichment analysis of gene convergence of TIMP-2 related biological processes; (D) KEGG enrichment analysis of TIMP-2 related pathway convergence; (E) GO enrichment analysis of the relationship between TIMP-2 related biological processes and related genes; (F) KEGG enrichment analysis of the relationship between TIMP-2 related metabolism, pathway and related genes. |
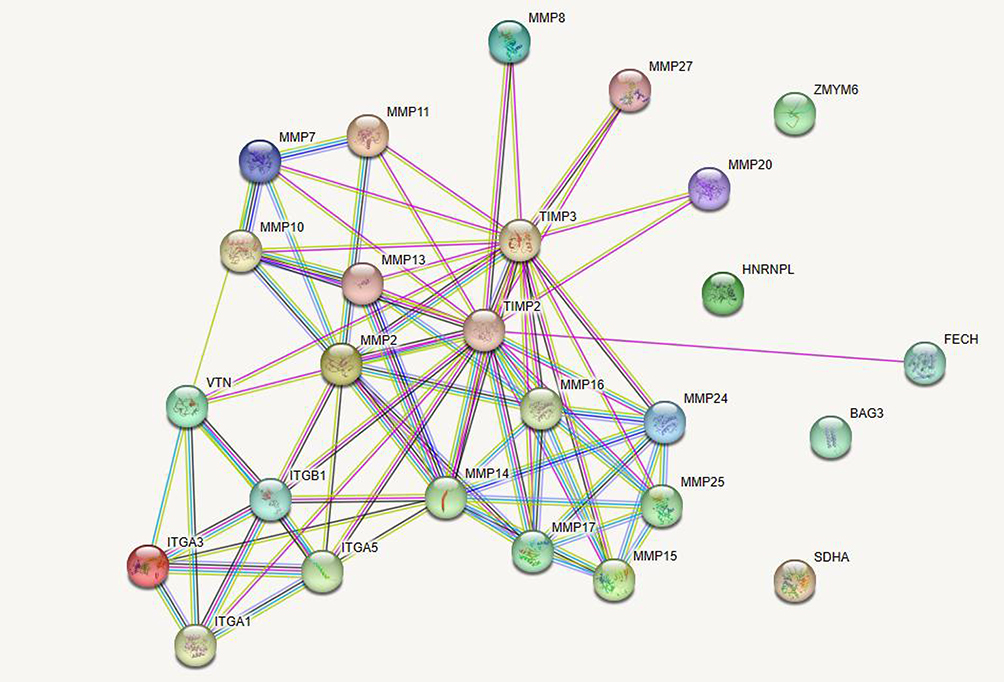 |
Figure 4 Interaction between TIMP-2 and its top 25 related proteins. |
Analysis of Immune Infiltration of TIMP-2 Protein in TME
Relationship Between TIMP-2 Protein and Various Scores in TME
Estimation scoring analysis showed that the immune and matrix scores in the high TIMP-2 expression group were higher than those in the low TIMP-2 expression group (P<0.05). The tumor purity scores in the low-expression group were higher than those in the high-expression group (Figure 5).
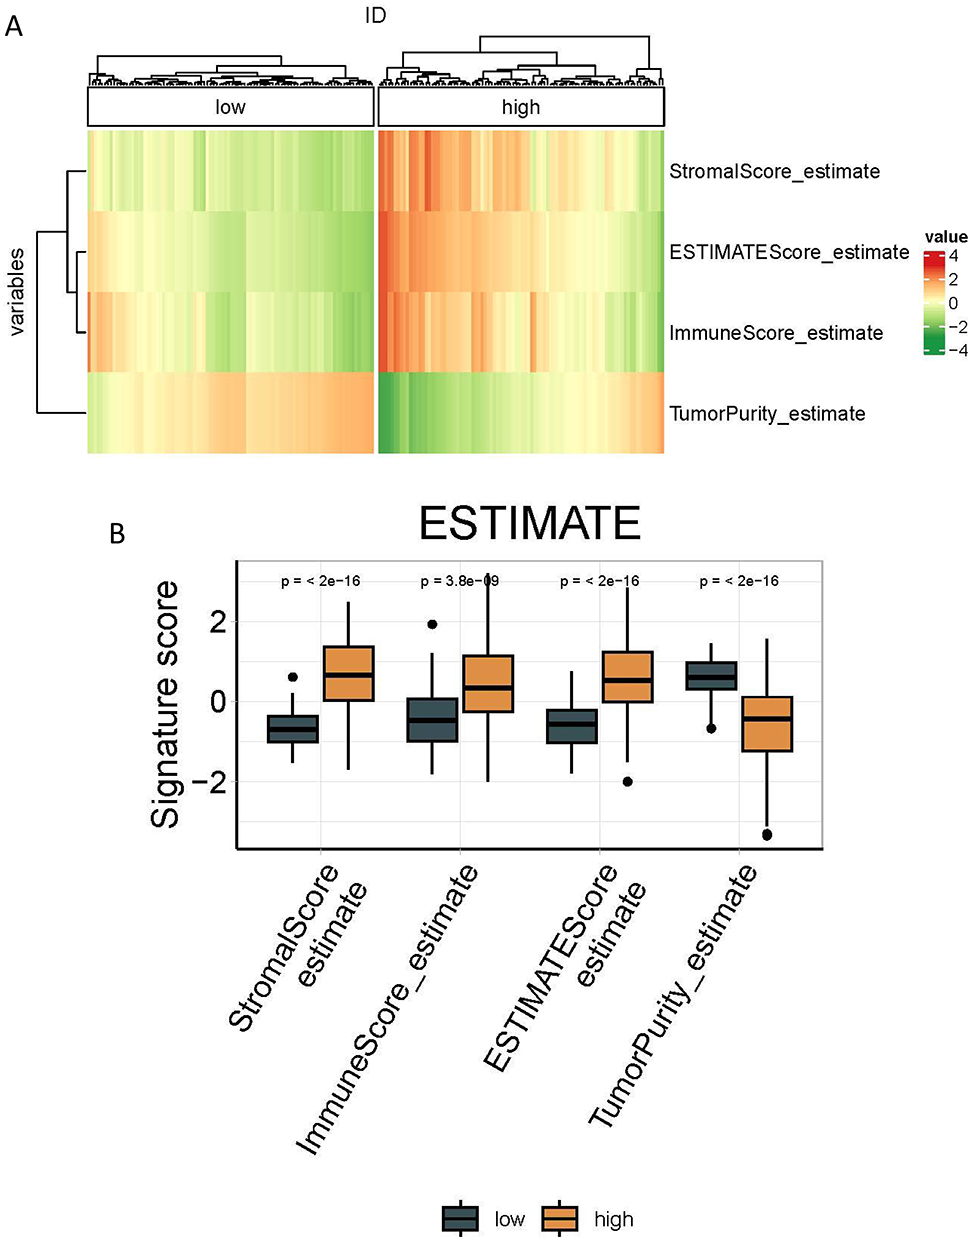 |
Figure 5 Relationship between TIMP-2 and each score of ESTIMATE method: (A) Clustering heat map of the relationship between TIMP-2 and each score of ESTIMATE method; (B) Box diagram of the relationship between TIMP-2 and various scores of ESTIMATE method. |
Immune Cell Infiltration in HCC Samples with Different TIMP-2 Expression Levels
Memory resting CD4 +T cells in TIMP-2 high expression group are in CIBERSORT algorithm, T lineage cells, CD8 +T cells, and fibroblasts are in MCP algorithm, CD4 +T cells, CD8 +T cells are in TIMER algorithm, B lineage cells, M2 macrophages, and monocytes are in quaitTIseq algorithm, plasma cells, M1 macrophages, fibroblasts, activated DC cells are in xCell algorithm, tumor-associated fibroblasts The infiltration degree of cancer-associated fibroblasts (CAFs) in EPIC algorithm was higher than that in the low-expression group (P<0.05). The degree of immune infiltration of CD8+ T cells in the high-level group of the MCP and TIMER algorithms was higher than that in the low-level group (P<0.05). The degree of immune infiltration of fibroblasts in the MCP and xCell algorithms was higher than that in the low-expression group (P<0.05). In samples from the low TIMP-2 expression group, the degree of immune infiltration of CD8 +T cells and activated NK cells in the CIBERSORT algorithm, CD8 + naïve T cells, CD4 + memory T cells, M2 macrophages in the xCell algorithm, macrophages in the EPIC algorithm, and neutrophils in the quaitTIseq algorithm was higher than that in the high TIMP-2 expression group (P<0.05; Figure 6).
 |
Figure 6 Various algorithms evaluate the infiltration of immune cells in hepatocellular carcinoma samples with different levels of TIMP-2 expression: (A) Clustering heat map of immune cell infiltration; (B) Boxplot of immune cell infiltration. |
Immunophenotypes of HCC Tissues with Different TIMP-2 Expression Levels
The EC and MHC scores of the TIMP-2 high expression group were higher than those of the low expression group (P<0.01), while the SC score and CP score of the TIMP-2 low expression group were higher than those of the TIMP-2 high expression group (P<0.01). There was no difference in the Z-score scores between the two groups (P>0.05; Figure 7).
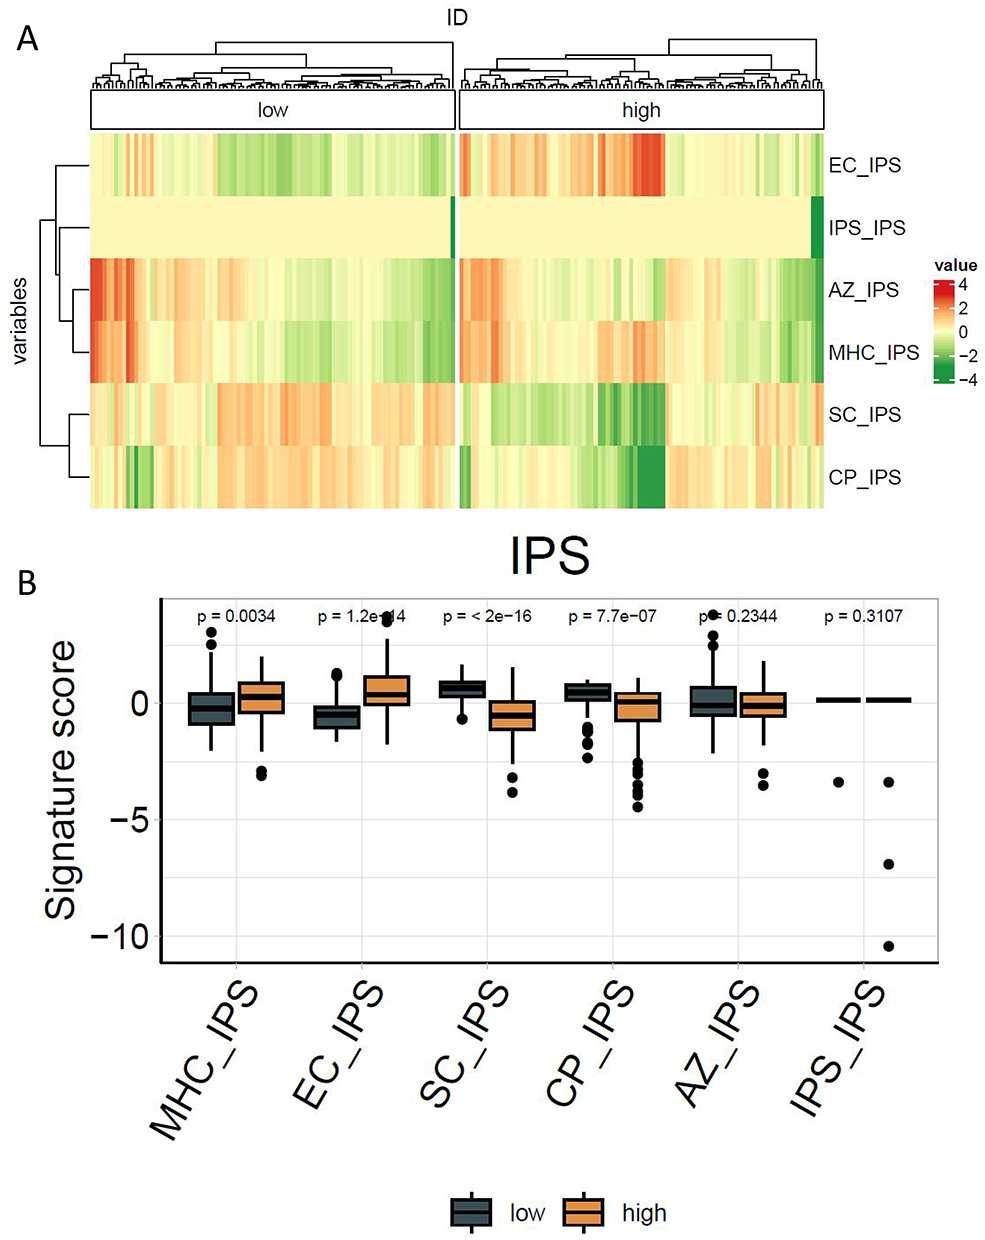 |
Figure 7 Immunophenotypes of hepatocellular carcinoma samples with different levels of TIMP-2 expression: (A) Clustering heat map of different immunophenotypes; (B) Boxplots of different immunophenotypes. |
Correlation Between TIMP-2 Protein and Tumor Immune Microenvironment
MCP algorithm showed that fibroblasts (ρ=0.77) and endothelial cells (ρ=0.57) were positively correlated with TIMP-2 expression. The xCELL algorithm showed that fibroblasts (ρ=0.60), chondrocytes (ρ=0.58), and mesangial cells (ρ=0.73) were positively correlated with TIMP-2 expression. Estimate scoring method showed that matrix score (ρ=0.61) was positively correlated with TIMP-2 expression, and tumor purity (ρ=−0.5) was negatively correlated with TIMP-2 expression. TIMER algorithm showed that neutrophils (ρ=0.53), dendritic cells (ρ=0.54), and macrophages (ρ=0.61) were positively correlated with TIMP-2 expression. The EPIC algorithm showed that CAFs (ρ=0.70) were positively correlated with TIMP-2 expression (Figure 8).
 |
Figure 8 Relationship between TIMP-2 Protein and tumor immune microenvironment: (A) Relationship between TIMP-2 and fibroblasts in MCP algorithm; (B) Relationship between TIMP-2 and endothelial cells in MCP algorithm; (C) Relationship between TIMP-2 and fibroblasts in xCELL algorithm; (D) Relationship between TIMP-2 and chondrocytes in xCELL algorithm; (E) Relationship between TIMP-2 and Mesangial cells in xCELL algorithm; (F) Relationship between TIMP-2 and CAFs in EPIC algorithm; (G) Relationship between TIMP-2 and StromalScore in Estimate score method; (H) Relationship between TIMP-2 and tumor purity in Estimate score; (I) Relationship between TIMP-2 and neutrophils in TIMER algorithm; (J) Relationship between TIMP-2 and DC cells in TIMER algorithm; (K) Relationship between TIMP-2 and macrophages in TIMER algorithm. |
Basic Clinical Characteristics of Patients
Overall, 118 patients with HCC were included, and the expression level of TIMP-2 protein in 20 HCC tissue samples was higher than that in paired adjacent tissues (P<0.05; Figure 9). Among them, 58 cases were <50 years old, and 60 cases were ≥50 years old. As of November 2022, 5 patients were lost to follow-up, with a lost-to-follow-up rate of 4.2%. The median follow-up time was 60.4 months, median survival was 60.4 months, and median DFS was 17.7 months. Taking the median TIMP-2 expression of 1192.555 pg/mL as the cutoff value, patients were divided into a low TIMP-2 expression group and a high TIMP-2 expression group. TIMP-2 expression was closely related to patient age, presence or absence of cancer thrombus, BCLC stage, TNM stage, and CNLC stage (P<0.05; Table 1). The distribution of neutrophils in the group with low TIMP-2 expression was higher than that in the group with high TIMP-2 expression (P<0.05). There were no significant differences in the values of white blood cells, total T lymphocytes, CD3 + CD4 + helper lymphocytes, CD3 + CD8 + inhibitory lymphocytes, CD3 + CD4 +/CD3 + CD8 +, natural killer cells, B lymphocytes, SII, NLR, and PLR between the TIMP-2 high expression group and low expression group (P>0.05; Figures 10 and 11).
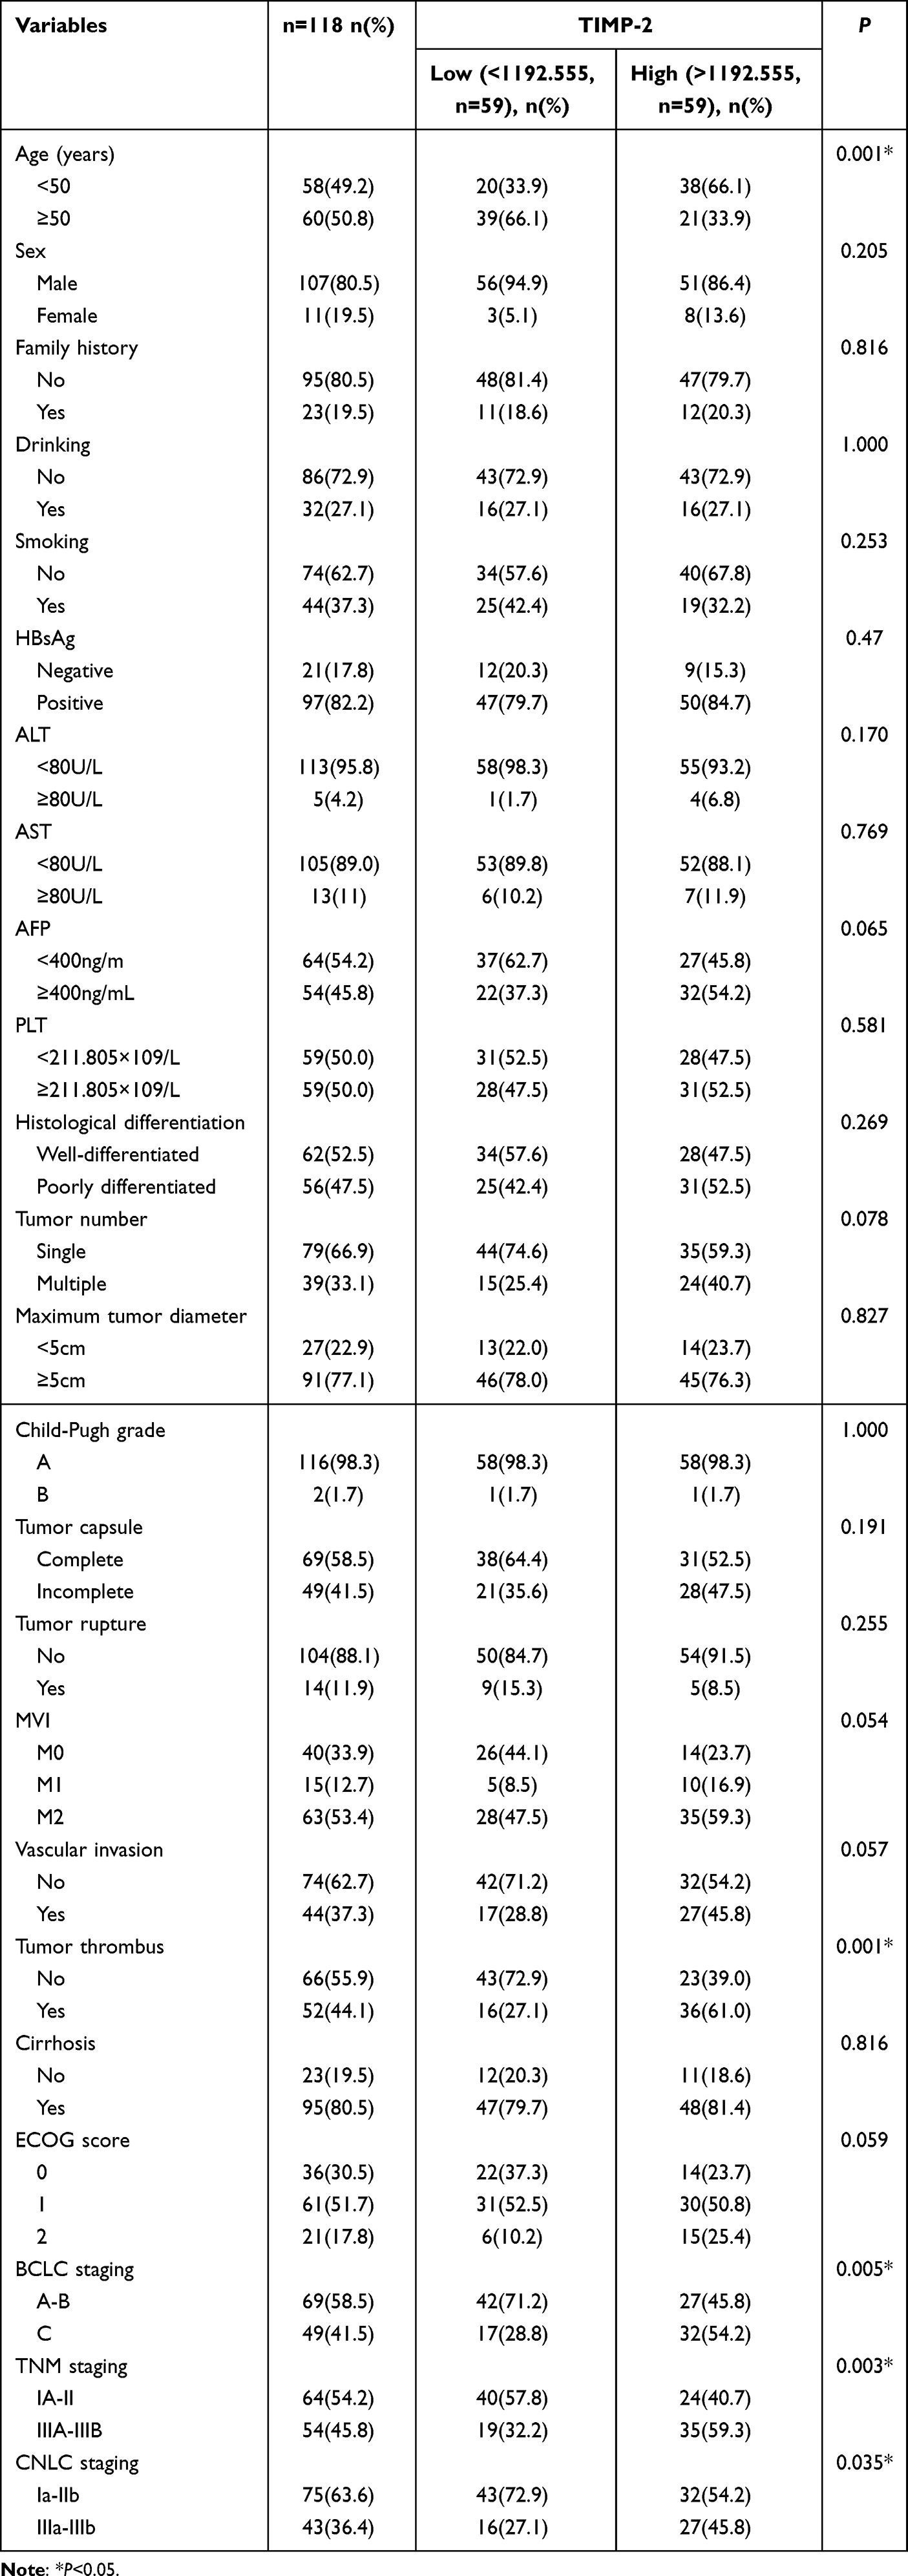 |
Table 1 Relationship Between Characteristics and TIMP-2 Protein Expression in Patients |
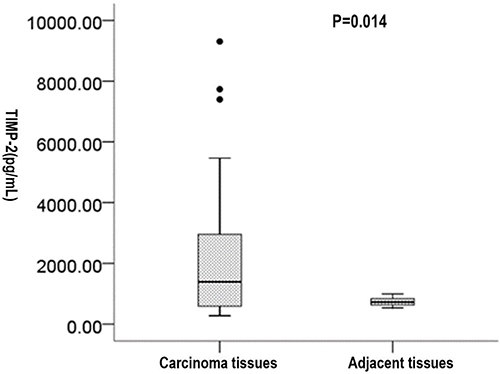 |
Figure 9 Comparison of TIMP-2 protein expression in hepatocellular carcinoma and adjacent tissues. |
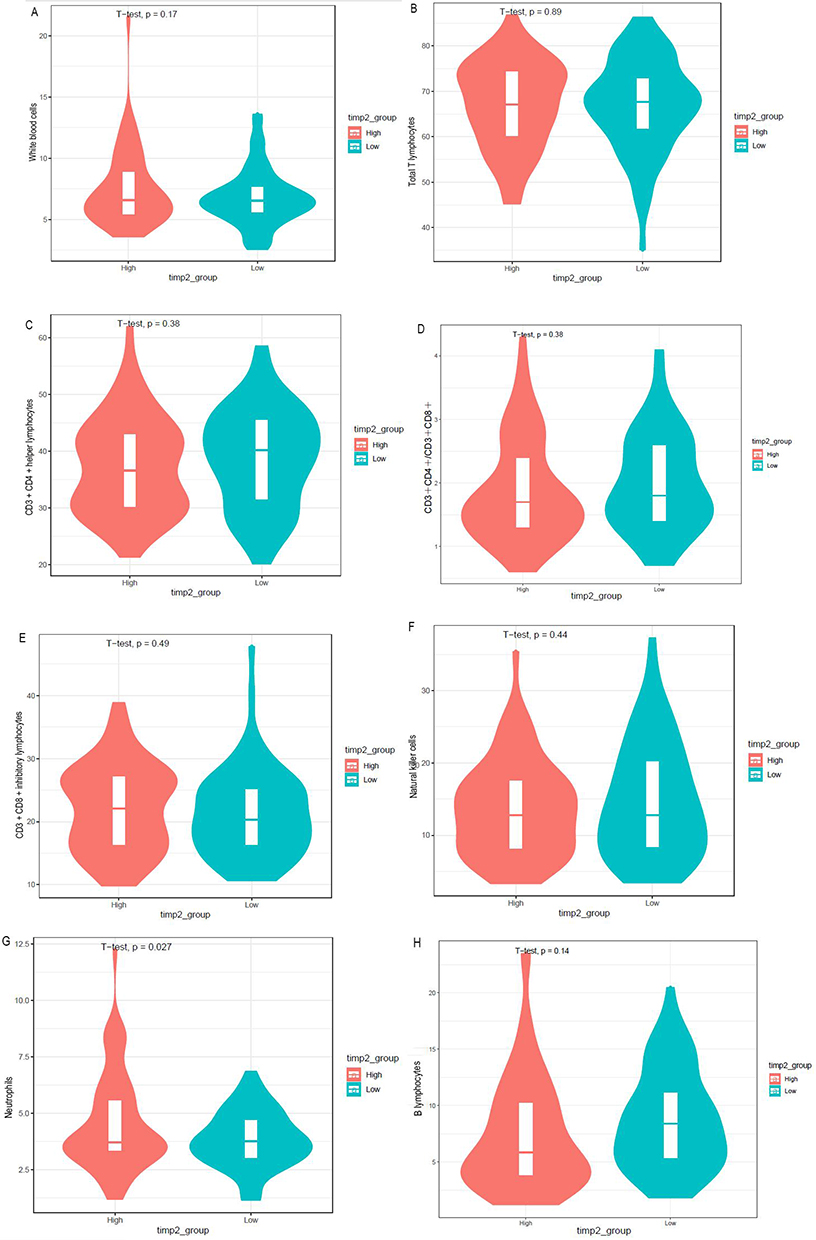 |
Figure 10 Differential analysis of various types of leukocytes in different levels of TIMP-2 expression: (A) White blood cells; (B) Total T lymphocytes; (C) CD3 + CD4 + helper lymphocytes; (D) CD3+CD4+/ CD3+CD8+; (E) CD3 + CD8 + inhibitory lymphocytes; (F) Natural killer cells; (G) Neutrophils; (H) B lymphocytes. |
 |
Figure 11 Differential analysis of immunoinflammatory indexes in different levels of TIMP-2 expression: (A) SII; (B) NLR; (C) PLR. |
Correlation Between TIMP-2 Protein Expression and Peripheral Blood Immune-Inflammatory Parameters
Leukocytes (γ=0.24), neutrophils (γ=0.19), and SII (γ=0.22) values were positively correlated with TIMP-2 protein expression (P<0.05; Figures 12 and 13).
 |
Figure 12 Relationship between TIMP-2 protein and various types of leukocytes: (A) White blood cells; (B) Total T lymphocytes; (C) CD3 + CD4 + helper lymphocytes; (D) CD3+CD4+/ CD3+CD8+; (E) CD3 + CD8 + inhibitory lymphocytes; (F) Natural killer cells; (G) Neutrophils; (H) B lymphocytes. |
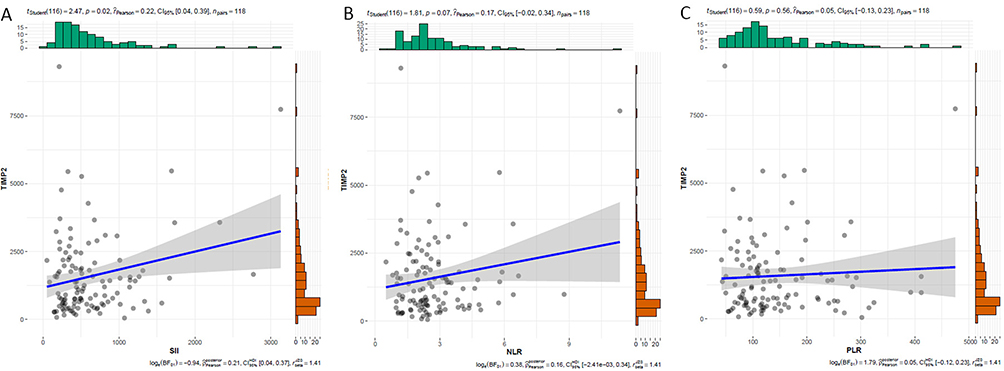 |
Figure 13 Relationship between TIMP-2 protein and immunoinflammation indexes: (A) SII; (B) NLR; (C) PLR. |
Relationship Between TIMP-2 Protein Expression and Prognosis of HCC
The median OS of the high TIMP-2 expression group was significantly shorter than that of the low TIMP-2 expression group (24 vs 97.9 m, P<0.01). The median DFS in the group with high TIMP-2 expression was significantly lower than that in the group with low TIMP-2 expression (5.6 vs 17.7 m, P=0.01; Figure 14). The 1- year (94.7% vs 60.7%), 2- year (89.5% vs 50%), 3- year (86% vs 41.1%), and 5- year (73.7% vs 26.8%) survival rates in the group with low TIMP-2 expression were higher than those in the group with high TIMP-2 expression (P<0.01). The 1- year (66.7% vs 39.3%), 2- year (63.2% vs 30.4%), 3- year (57.9% vs 25%) and 5-year (45.6% vs 17.9% DFS rates in the low TIMP-2 expression group were higher than those in the high TIMP-2 expression group (P<0.01; Tables 2 and 3).
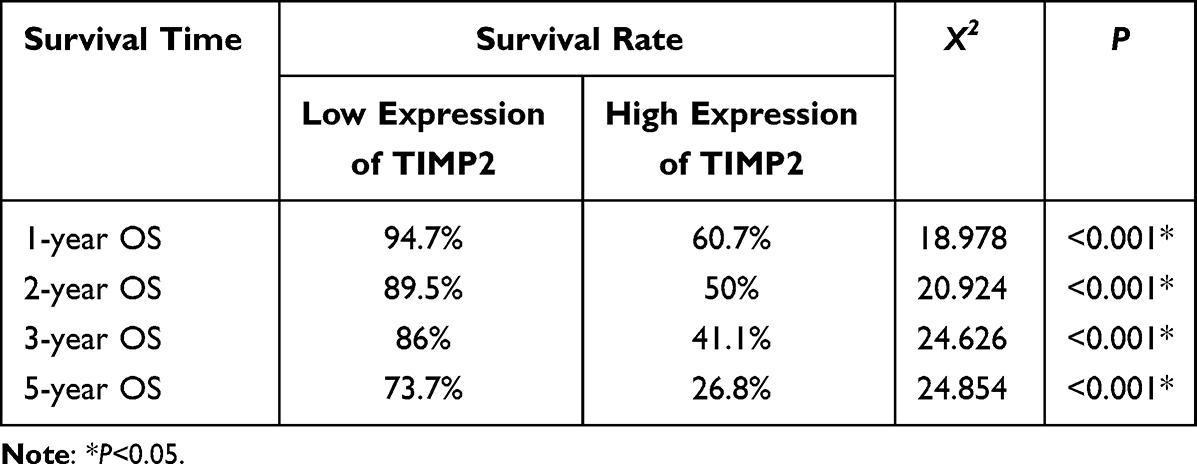 |
Table 2 Overall Survival Rate of HCC Patients with Different TIMP-2 Expression |
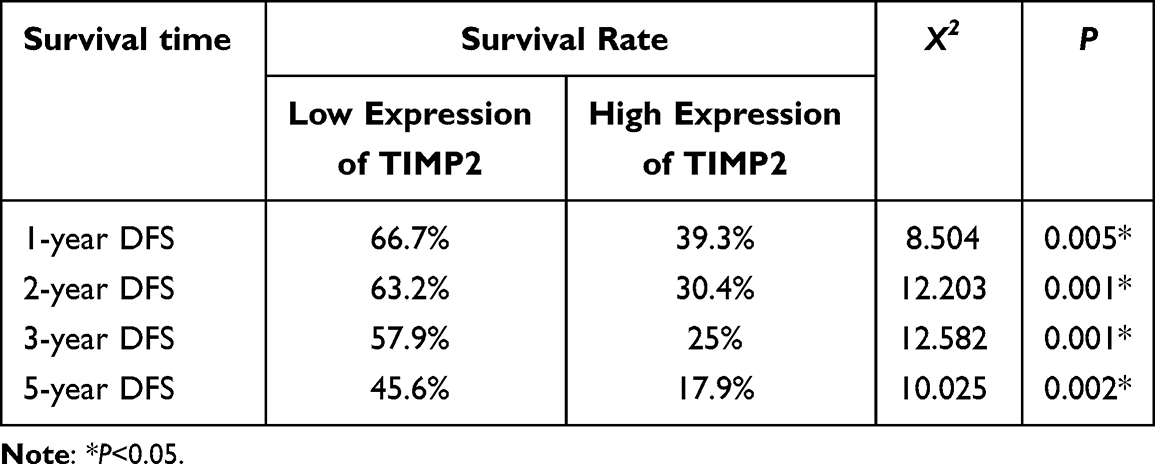 |
Table 3 Disease-Free Survival Rate of HCC Patients with Different TIMP-2 Expression |
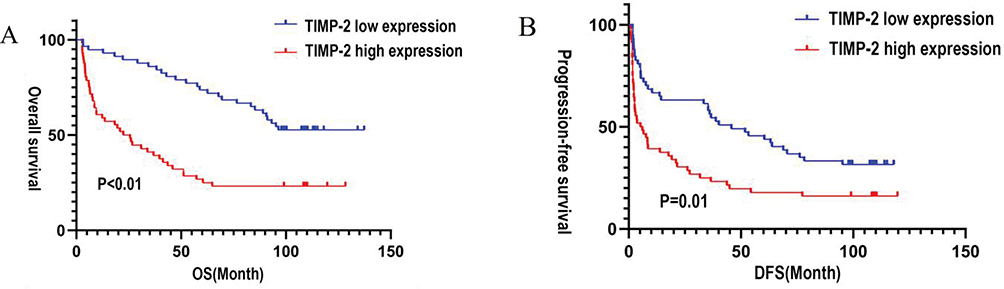 |
Figure 14 (A) Kaplan-Meier curve for OS of HCC patient with TIMP-2 different expression levels; (B) Kaplan-Meier curve for DFS of HCC patients with TIMP-2 different expression levels. |
Univariate and Multivariate Analysis of Survival in Patients with HCC
Univariate analysis showed that the expression levels of NLR and TIMP-2, histopathological differentiation, tumor number, BCLC stage, TNM stage, and CNLC stage were associated with postoperative OS (P<0.05; Table 4) and were risk factors affecting OS. The NLR, ECOG score, SII, histopathological differentiation, number of tumors, degree of liver cirrhosis, BCLC stage, and TNM stage were correlated with postoperative DFS (P<0.05; Table 5) and were risk factors affecting DFS. Multivariate analysis showed that TIMP-2 levels, NLR, and tumor number were independent risk factors for OS in patients with HCC. The risk of death in patients with high TIMP-2 expression was twice that in patients with low NLR, and the risk of death in patients with high NLR was 1.2 times that in patients with low NLR (Figure 15). NLR, liver cirrhosis, and ECOG PS were independent risk factors for DFS in patients with HCC. Patients with a high NLR had a 1.2 times higher risk of recurrence than those with a low NLR (Figure 16).
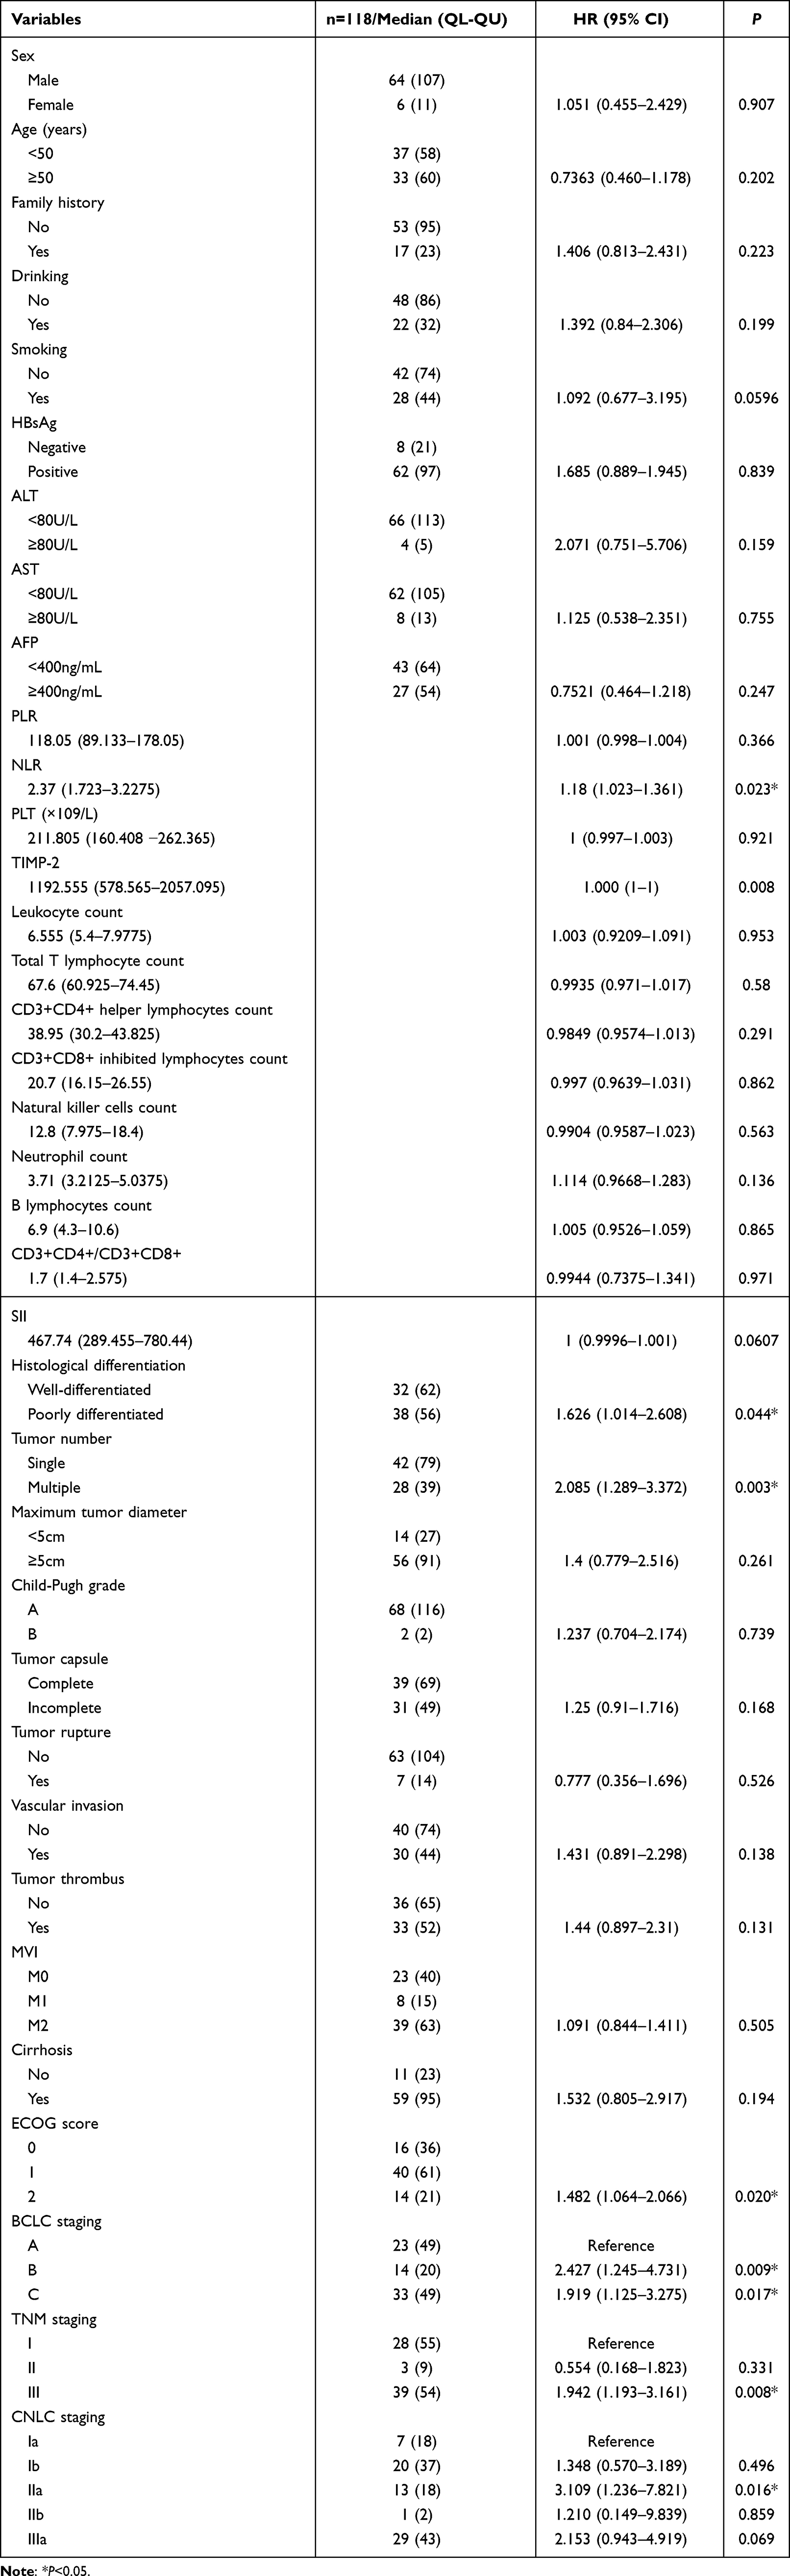 |
Table 4 Univariate Analysis of Overall Survival |
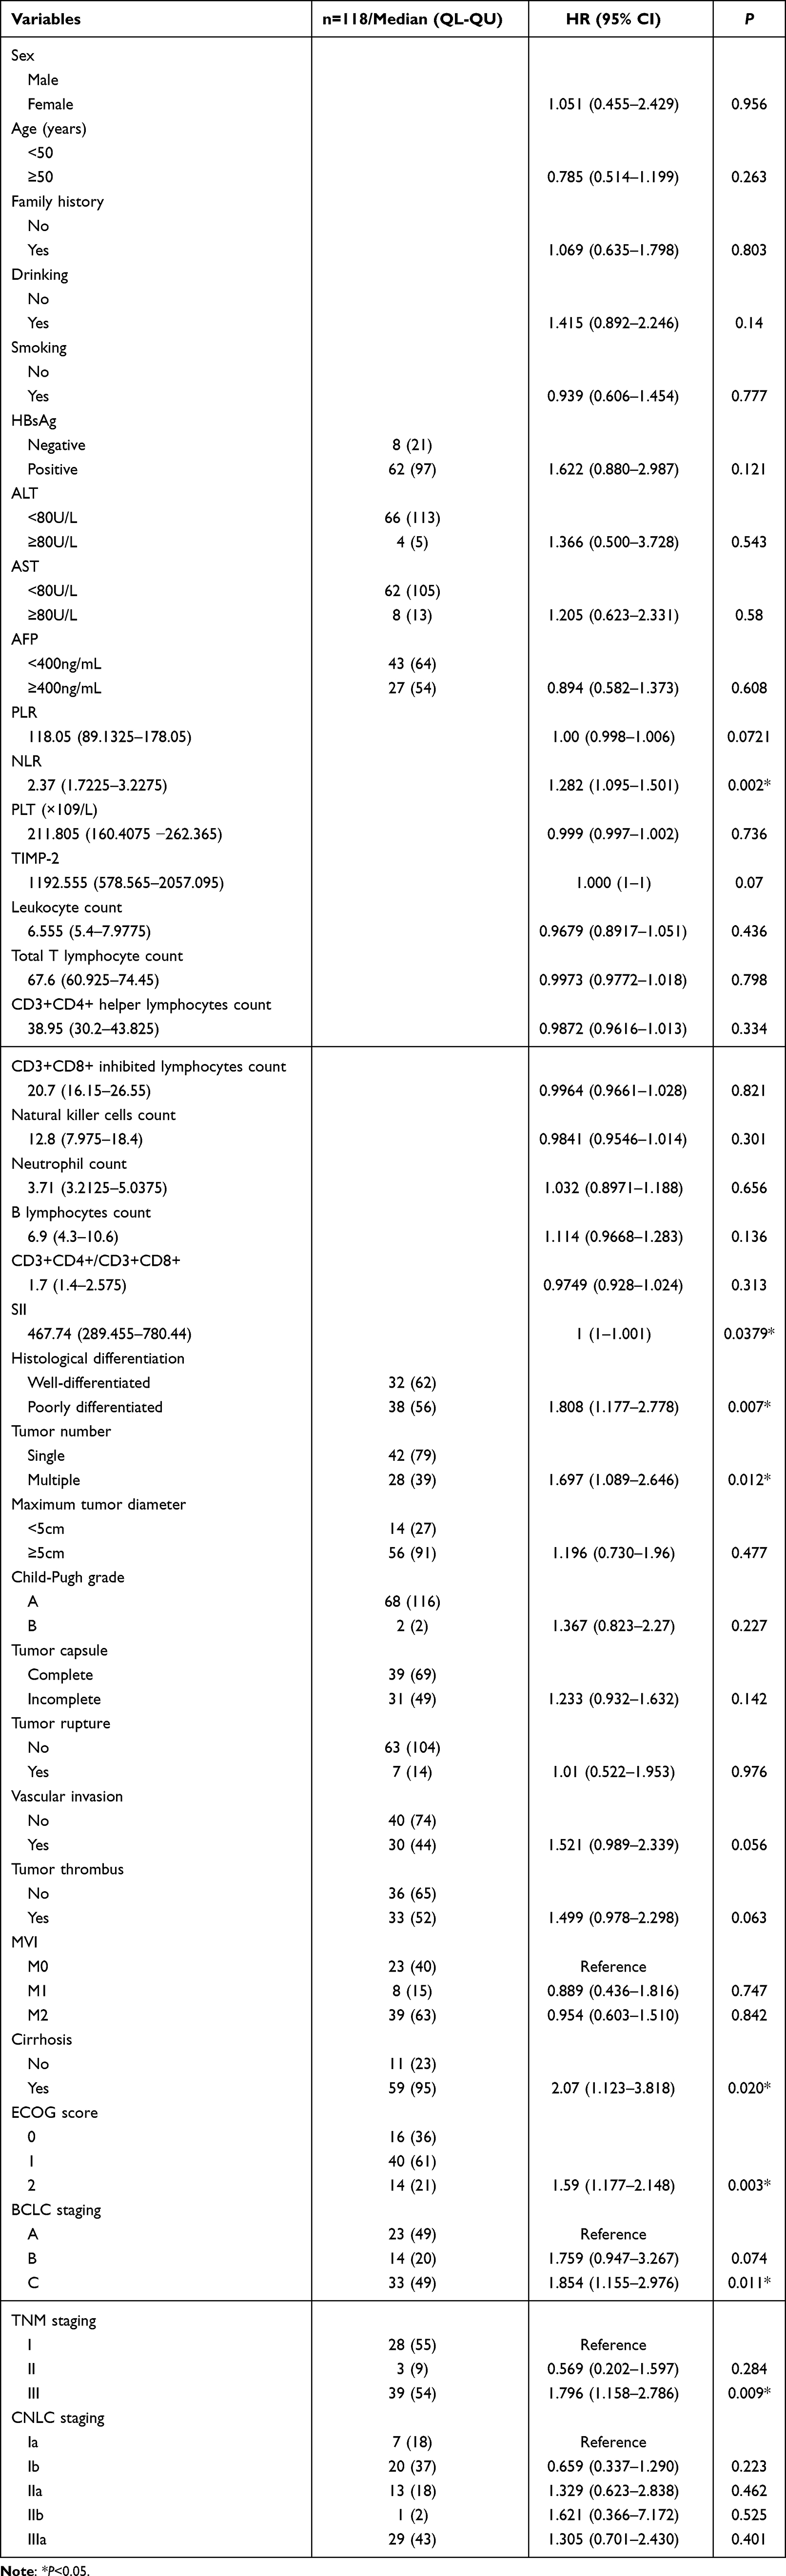 |
Table 5 Univariate Analysis of Disease-Free Survival |
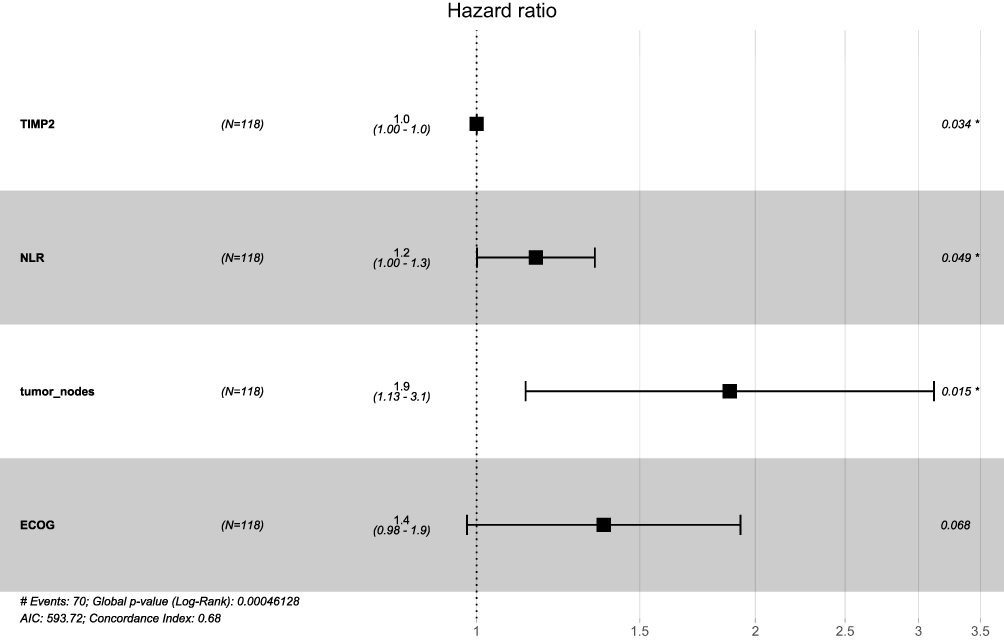 |
Figure 15 A forest plot of overall survival (OS) in patients with HCC based on multivariate. *p < 0.05. |
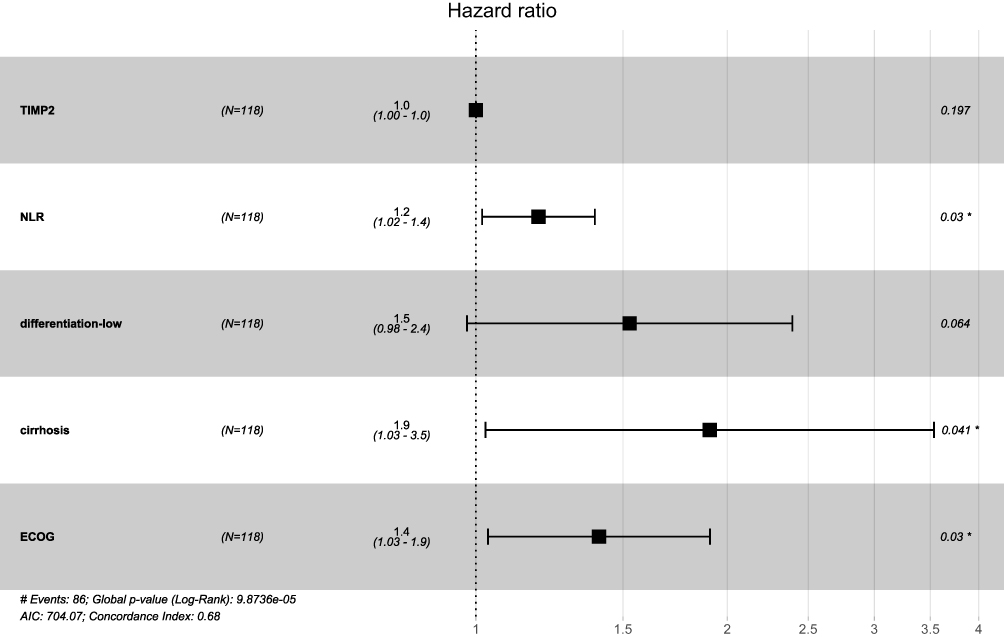 |
Figure 16 A forest plot of disease-free survival (DFS) in patients with HCC based on multivariate analysis. *p < 0.05. |
Establishment and Evaluation of the OS and DFS Nomogram Prediction Model
Cox multivariate regression analysis showed that TIMP-2 levels, NLR, and tumor number were independent risk factors affecting OS in patients with HCC. Cox multivariate regression analysis showed that the NLR, liver cirrhosis, and ECOG PS were independent risk factors for DFS in patients with HCC. Based on the results of the Cox multivariate regression analysis and the relationship between important clinical and pathological characteristics and prognosis, a prognostic nomogram model was constructed to predict OS and DFS at 1, 2, 3, 4, and 5 years (Figure 17).
 |
Figure 17 Nomograms for predicting the 1,2,3and5 year OS rate (A) and DFS rate (B) in patients with HCC. |
In the OS prediction model, the tdAUC of the 1,2,3, and 5-year OS of the training and validation sets were 0.82 vs 0.746, 0.807 vs 0.746, 0.813 vs 0.811, and 0.749 vs 0.81, respectively (Figure 18), which were greater than the univariate tdAUC value in the model. In the training set and the validation set, the C-index of the nomogram model was 0.693 (95% CI: 0.623−0.762) and 0.651 (95% CI: 0.783−0.518), respectively, which was better than that of the 8th edition AJCC TNM staging system (0.628, 95% CI: 0.565−0.691; 0.585, 95% CI: 0.472−0.697), the BCLC staging system (0.550, 95% CI: 0.48 0.619; 0.575, 95% CI: 0.458−0.692) and CNLC staging system (0.554, 95% CI: 0.486−0.622; 0.561, 95% CI: 0.44−0.681; Figure 19A). In the DFS nomogram model of the training and validation sets, the C-index of the nomogram model was 0.654 (95% CI: 0.574−0.733) and 0.68 (95% CI: 0.563−0.798), respectively, which was better than that of the 8th edition AJCC TNM staging system (0.569, 95% CI: 0.506−0.632; 0.572, 95% CI: 0.473−0.672), BCLC staging system (0.562, 95% CI: 0.496−0.628; 0.572, 95% CI: 0.471−0.672) and BCLC staging system (0.554, 95% CI: 0.486−0.622; 0.548, 95% CI: 0.442−0.654; Figure 19B). In the DFS nomogram model of the training and validation sets, the tdAUCs of the DFS rates at 1,2,3, and 5 years were 0.66 vs 0.712, 0.685 vs 0.722, 0.729 vs 0.774, and 0.763 vs 0.74, respectively (Figure 20). In the validation cohort, the agreement between the predicted 2-year DFS curve and the actual curve was slightly poor. In the training set, the consistency between the 1-year, 2-year, and 3-year OS prediction curves and the actual curve was somewhat poor. The remaining predicted curves are in good agreement with the actual curves (Figures 21 and 22). Compared with the AJCC TNM, BCLC, and CNLC stages, the nomogram prognostic model had better net benefits for OS and DFS at 1-year, 2-year, 3-year, and 5-year in both the training and validation sets (Figures 23 and 24).
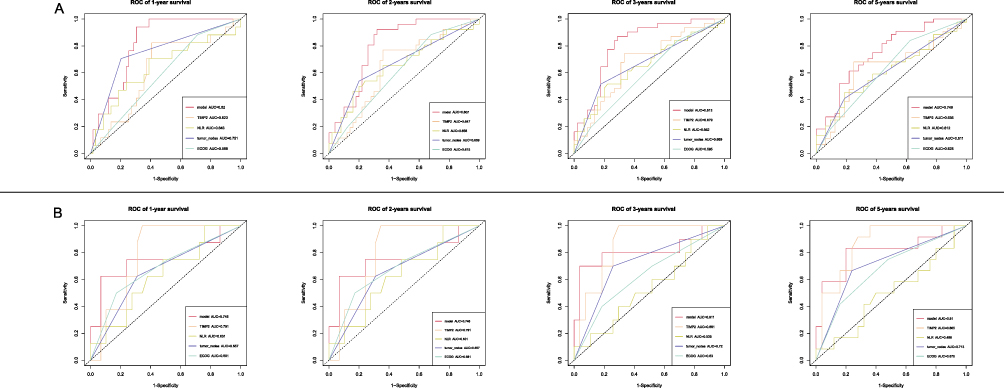 |
Figure 18 Time-dependent ROC curve of OS: (A) Time-dependent ROC curve of 1,2,3and5 year OS in the training set; (B) Time-dependent ROC curve of 1,2,3and5 year OS in the testing set. |
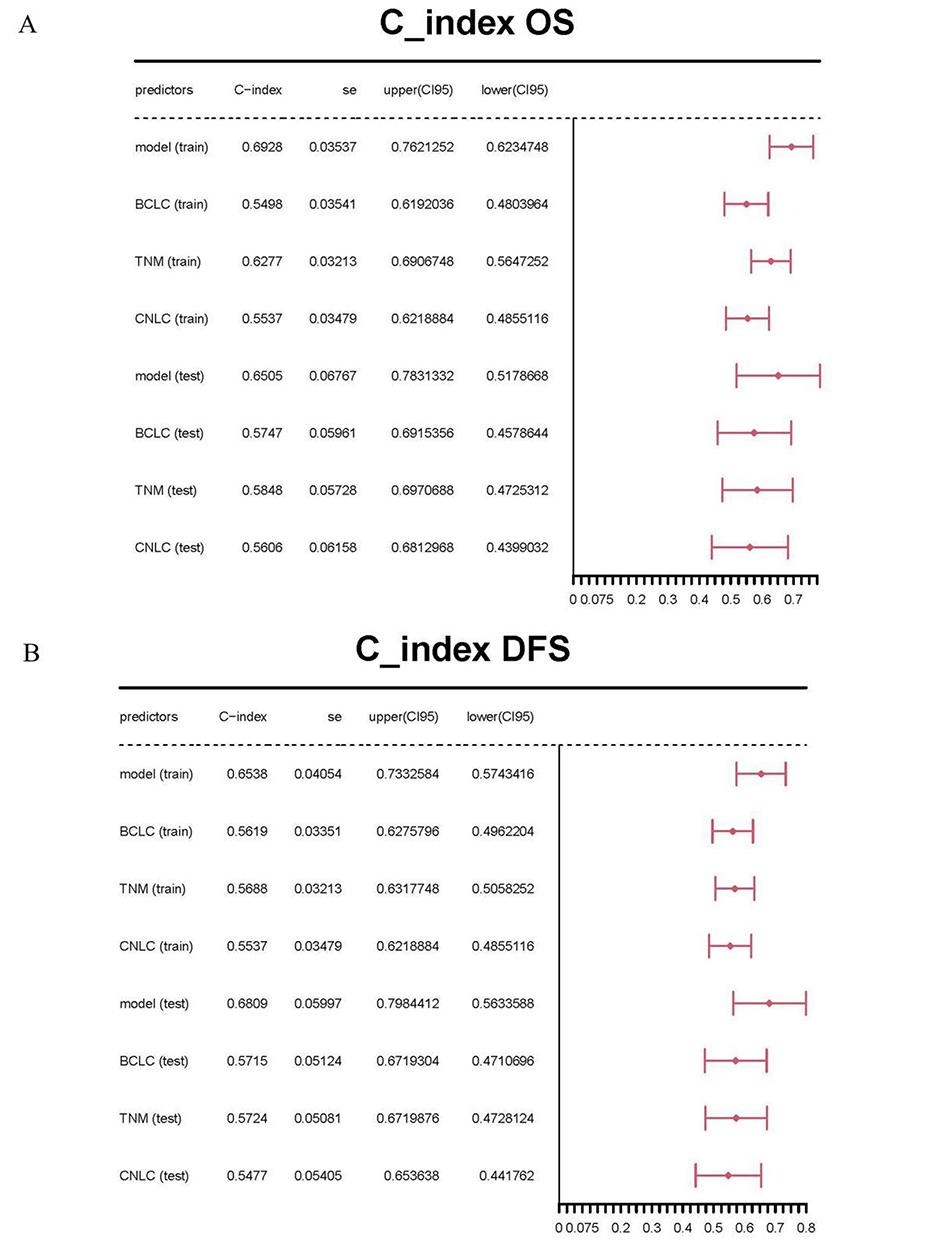 |
Figure 19 Comparison of the C-indexes of OS and DFS between nomograms and the AJCC 8thTNM, BCLC and CNLC staging system: (A) C-indexes of OS; (B) C-indexes of DFS. |
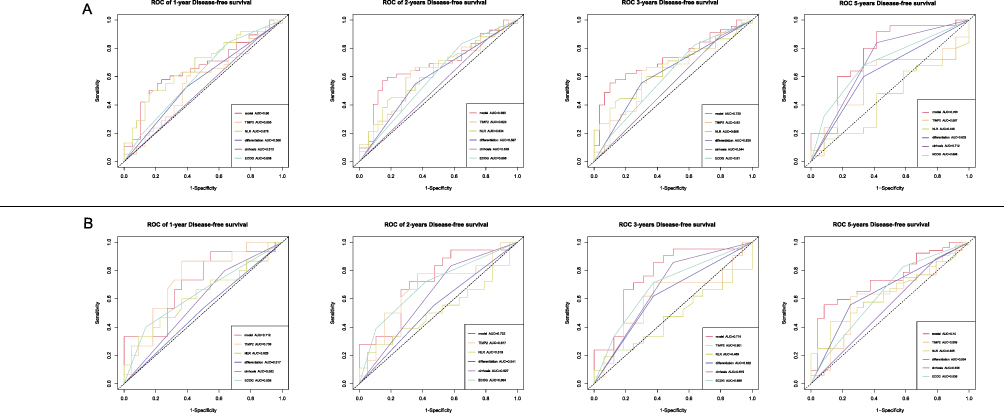 |
Figure 20 Time-dependent ROC curve of DFS: (A) Time-dependent ROC curve of 1,2,3and5 year DFS in the training set; (B) Time-dependent ROC curve of 1,2,3and5 year DFS in the testing set. |
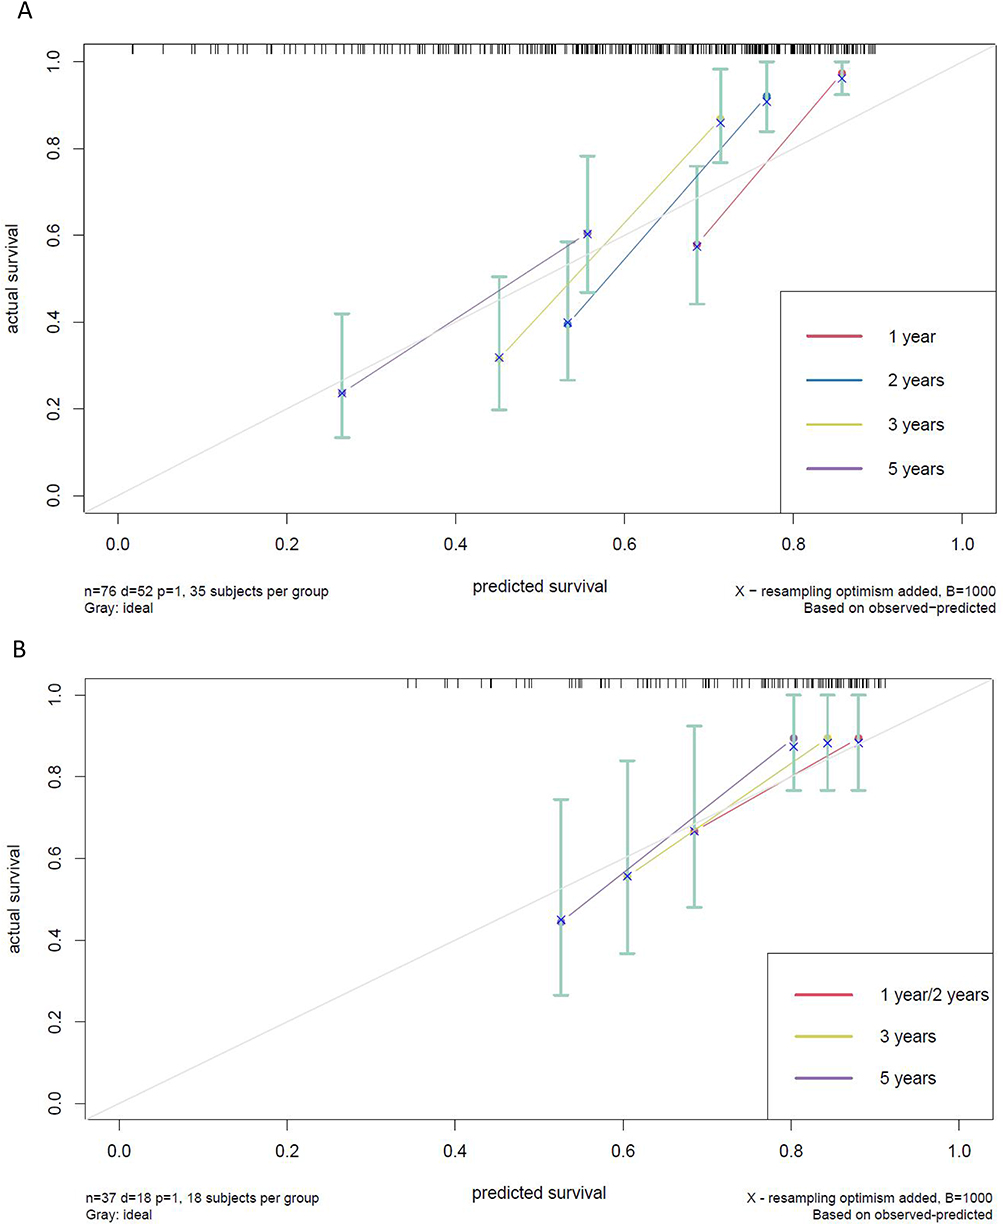 |
Figure 21 Calibration curves of OS: (A) Calibration curves of 1,2,3and5 year OS in the training set; (B) Calibration curves of 1,2,3and5 year OS in the testing set. |
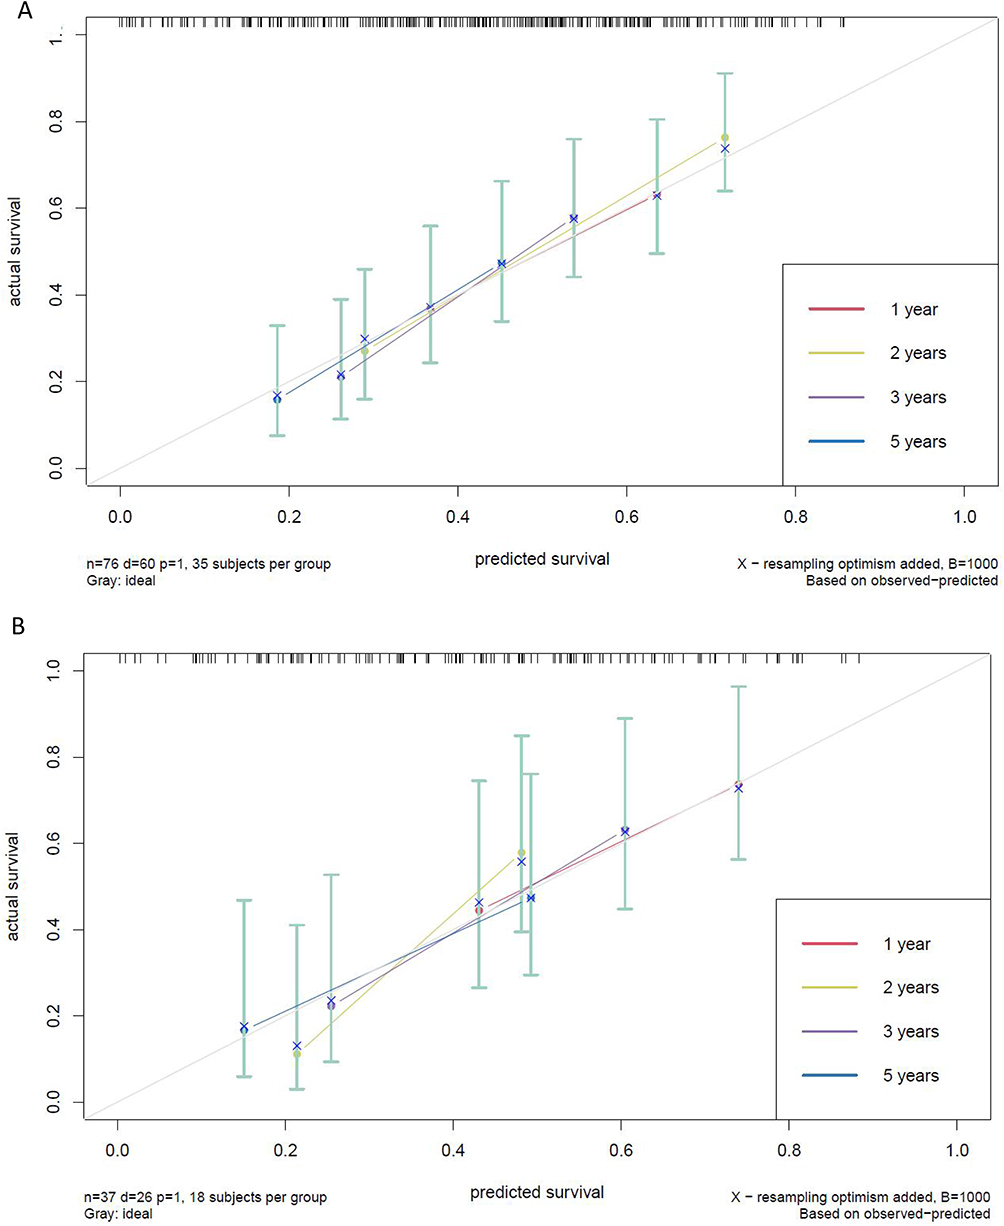 |
Figure 22 Calibration curves of DFS: (A) Calibration curves of 1,2,3and5 year DFS in the training set; (B) Calibration curves of 1,2,3and5 year DFS in the testing set. |
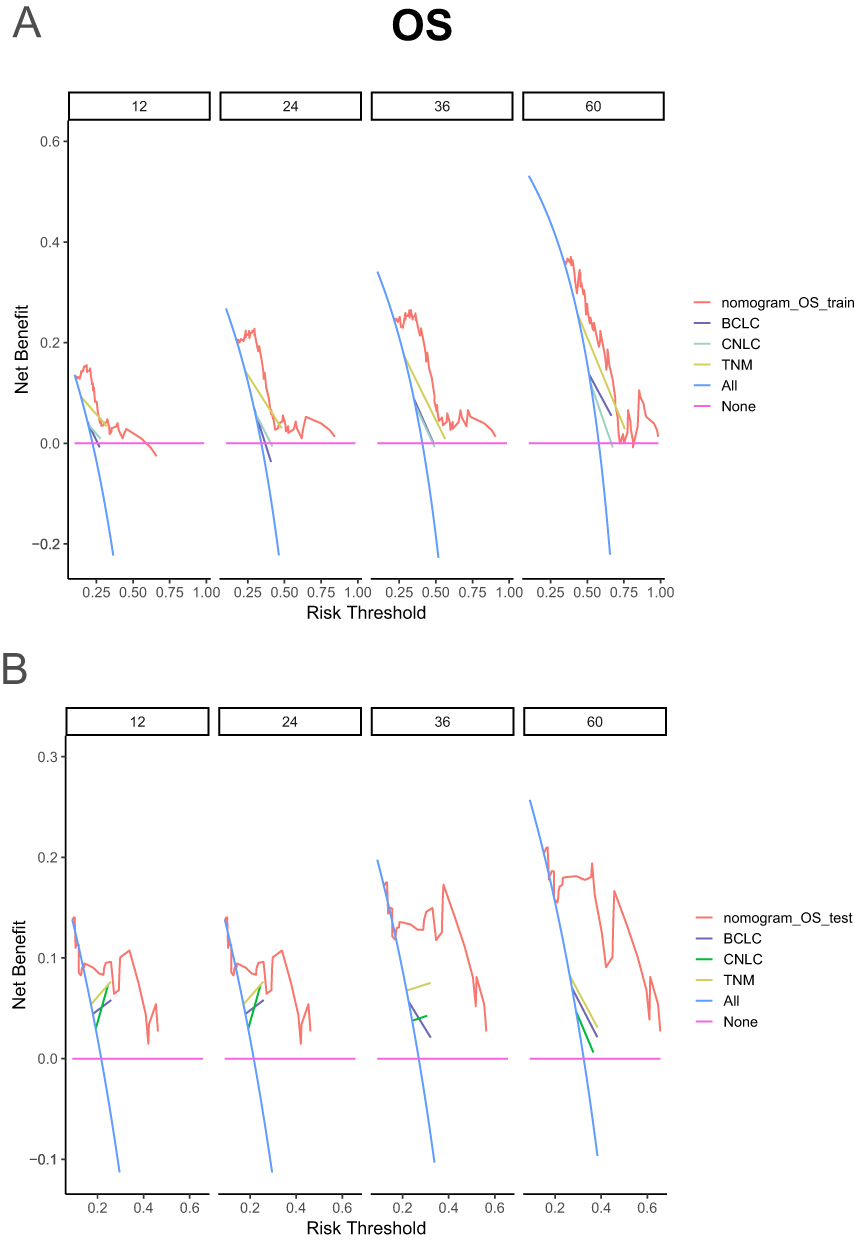 |
Figure 23 Comparison of decision curve analyses (DCA) of 1,2,3and5 year OS between nomogram and the AJCC 8thTNM, BCLC and CNLC staging system: (A) DCA of 1,2,3and5 year OS in the training set; (B) DCA of 1,2,3and5 year OS in the testing set. |
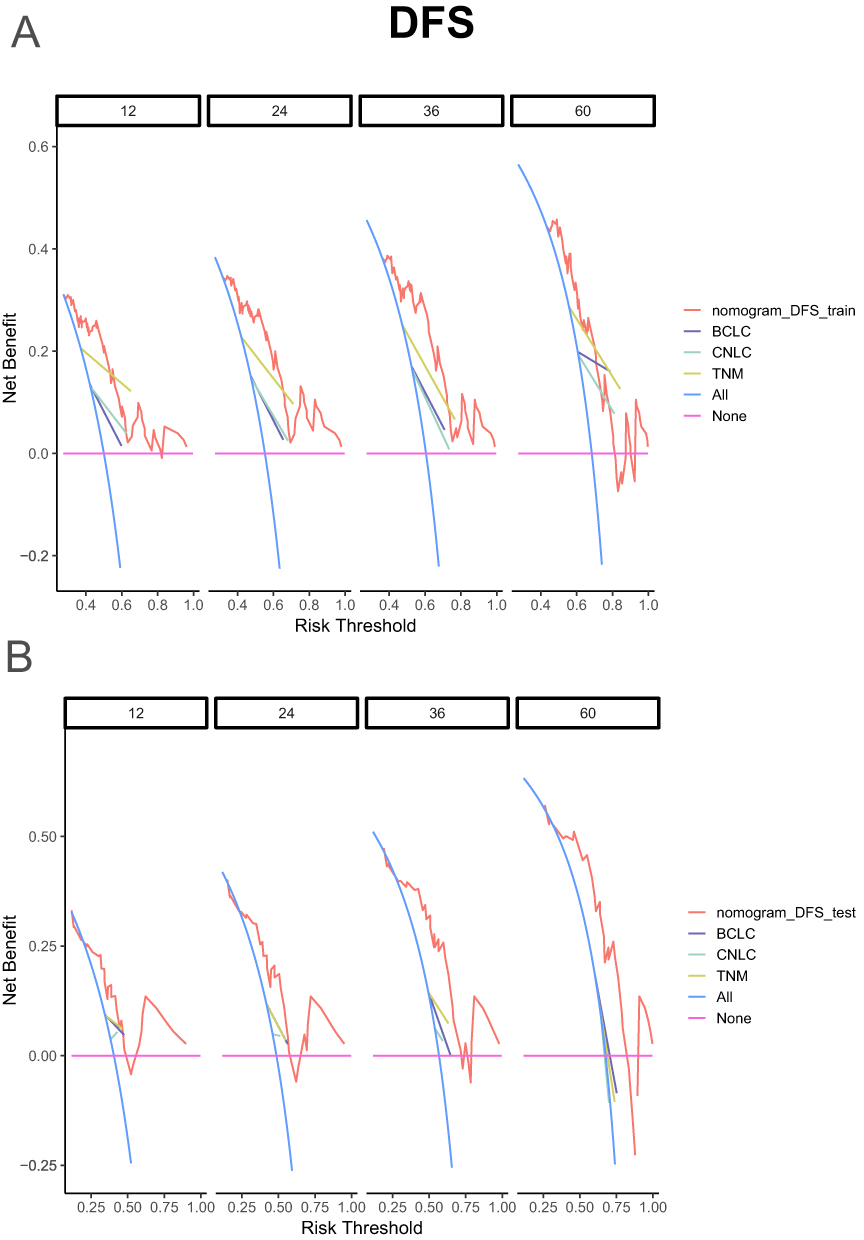 |
Figure 24 Comparison of decision curve analyses (DCA) of 1,2,3and5 year DFS between nomogram and the AJCC 8thTNM, BCLC and CNLC staging system: (A) DCA of 1,2,3and5 year DFS in the training set; (B) DCA of 1,2,3and5 year DFS in the testing set. |
Model Risk Stratification
Patients were divided into low -, intermediate -, and high-risk groups with 40.05 and 66.56 cutoff values (50th and 85th percentiles of the score, respectively), calculated according to the nomogram for OS. Kaplan–Meier curves showed that the median OS of low-risk, intermediate-risk, and high-risk groups was 96.4 m vs 25.6 m vs 9.5 m, and the difference was statistically significant (P<0.01; Figure 25A).
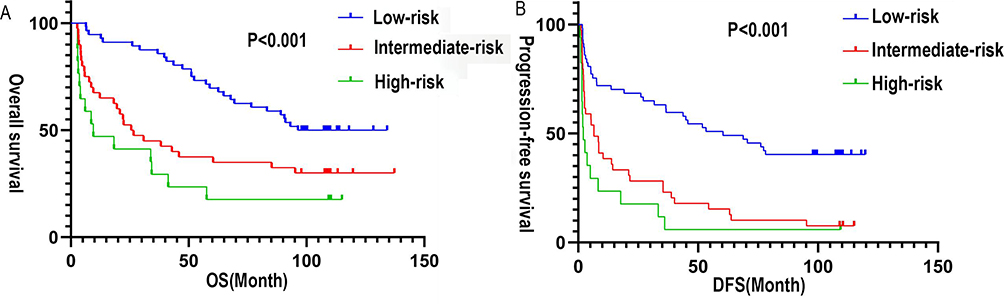 |
Figure 25 Kaplan-Meier curves for OS and DFS in the low-risk, intermediate-risk, and high-risk groups defined by the prognostic nomograms: (A) Kaplan-Meier curves for OS, (B) Kaplan-Meier curves for DFS. |
According to the DFS nomogram, patients were divided into low -, intermediate -, and high-risk groups with 74.75 and 105.77 as cutoff values (50th and 85th percentiles, respectively). Kaplan–Meier curves showed that the median DFS of the low-risk, intermediate-risk, and high-risk groups was 60.4 m vs 6.5 m vs 2.1 m, and the difference was statistically significant (P<0.01; Figure 25B).
Discussion
Our study found that elevated TIMP-2 expression, was associated with increased risk of postoperative recurrence, metastasis, and poor survival prognosis in patients with HCC. As an immune- and inflammation-related gene, TIMP-2 may regulate the immune microenviron and contribute to HCC occurrence, development, invasion, and metastasis.
Bioassays in this study revealed that the TIMP-2 high-expression group was mainly infiltrated by white blood cells, such as CD4+ T and CD8+ T lymphocytes, macrophages, and natural killer cells. Neutrophil infiltration was primarily observed in the low expression group of TIMP-2, where the major infiltration of neutrophils was observed. T-lymphocytes play an antitumor immune role in the body. CD4+ T cells are helper T cells that kill tumor cells, while CD8+ T cells include cytotoxic and inhibitory T cells that eliminate tumor cells and suppress immune response in the body. Together, they maintain a normal immune response through dynamic balance.36 In this study, with an expanded sample size, the results showed that peripheral blood neutrophil levels were higher in the low TIMP-2 expression group than in the high TIMP-2 expression group (P<0.05). Further analysis found that leukocytes (γ=0.24) and neutrophils (γ=0.19) were positively correlated with TIMP-2 protein expression (P<0.05). This suggests that there may be two different TIMP-2-related immune phenotypes in the immune microenvironment of HCC, mainly infiltrated by pro-tumor immune cells, which play a pro-tumor role. This effect is consistent with the poor prognosis of HCC. However, no significant correlation was found between TIMP-2 expression and immune cells, such as lymphocytes and natural killer cells, possibly due to the sample. A weak positive correlation was observed between CD8+ inhibitory lymphocytes and TIMP-2 (γ=0.14), suggesting a potential role of TIMP-2 in modulating inhibitory immune responses.
Currently, the expression and prognosis of TIMP-2 differ in different tumors. Albini et al37 and Remacle et al19 found that elevated TIMP-2 expression in breast cancer correlated with shorter survival time and higher risk of tumor metastasis and recurrence. However, Braicu et al22 studies in cervical cancer indicate that low TIMP-2 concentrations are significantly associated with poorer OS, suggesting that high TIMP-2 concentrations are indicative of a more favorable prognosis. Lu et al17 reported that TIMP-2 is associated with a good prognosis in renal cell carcinoma. Patients with hepatocellular and high TIMP-2 expression had longer postoperative survival than those with low TIMP-2 expression.31–34,38 The results of this study showed that there were significant differences in the median OS (P<0.01) and DFS (P=0.01) between the high expression group and low expression group of TIMP-2 in patients with HCC. The results of this study are different from those of previous studies because TIMP-2 plays various roles in different TMEs. Another reason may be that in a TME with tumor and stromal cells (fibroblasts, inflammatory cells, and endothelial cells), the role of TIMP-2 is first of all an MMP-independent function and finally the MMP-inhibitory activity of TIMP-2.19 However, it is generally suggested that TIMP-2 is related to the prognosis of patients with tumor, and it can be used as a marker to monitor tumor recurrence, metastasis, and prognosis.
In recent years, the relationship between peripheral blood immune inflammatory indicators and tumor prognosis has become a research hotspot. The peripheral blood immune inflammation indicators NLR and SII are used as new markers to predict tumor prognosis.39–41 This study showed that there was no significant difference in the NLR and SII values between the TIMP-2 high-expression group and the low-expression group; however, there was a trend for the TIMP-2 high-expression group to be higher than the low-expression group. Further analysis of the correlation between TIMP-2 expression and NLR value and SII value showed that SII value (γ=0.22) was significantly positively correlated with TIMP-2 expression (P=0.02). The expression of TIMP-2 affects changes in SII values. As TIMP-2 levels increased, the SII increased. There was a trend of positive correlation between NLR value (γ=0.17) and TIMP-2 expression, but the significance was not significant (P>0.05). There may be a positive correlation between the expression of immune inflammatory cells, leukocytes, and neutrophils, and the immune inflammatory indicators SII, NLR, and TIMP-2 in the peripheral blood. These results provided further evidence that TIMP-2 plays an important role in the HCC TME. TIMP-2 expression reflects, to a certain extent, the balance between immune and inflammatory reactions in the TME. High NLR is closely associated with poor prognosis of HCC42–45 and can be an independent predictor of poor prognosis in patients with HCC.46 The results of Cox analysis in this study showed that a high NLR was an independent risk factor affecting OS and DFS in patients with HCC (P<0.05), and was associated with a poor prognosis of HCC. It has been suggested that NLR has a good predictive value for the prognosis and recurrence of HCC. As a comprehensive indicator of inflammation that integrates neutrophil, lymphocyte, and platelet counts, the SII can reflect a patient’s systemic immune-inflammatory status. Recent studies have suggested that the SII is associated with poor survival and prognosis of HCC.41 The results of this study show that the SII is a risk factor for DFS in patients with HCC. The higher the SII value, the shorter the survival time of patients with HCC.
This study included TIMP-2, NLR, tumor number, and ECOG score to establish a nomogram prediction model for OS after HCC to predict the 1-, 2-, 3-, 4-, and 5-year survival rates of patients with HCC. Histopathological differentiation, NLR, liver cirrhosis, ECOG score, and TIMP-2 were used to establish a nomogram prediction model for DFS after HCC to predict the 1-year, 2-year, 3-year, and 5-year DFS rates. Both nomogram prediction models for OS and DFS were superior to traditional staging systems. This shows that the prediction model has good stability and consistency and may have good predictive value for the 5-year survival rate and DFS rate of patients with HCC after surgery. Chen et al47 incorporated PLR, NLR, and SII to establish an OS model based on inflammatory indicators to predict survival within 5 years after HCC surgery, which has good predictive value for survival within 5 years., It is better than traditional staging systems. Fu et al48 developed an immune infiltration cell model after HCC surgery based on a large amount of single-cell RNA sequencing data, which had predictive power for the DFS rate within 5 years. It can be seen that the inflammatory response plays an important role in the occurrence, development, and evolution of HCC, and is related to prognosis. Including this in the establishment of a model can improve its predictive ability. The predictive model developed in this study has the advantages of incorporating fewer variables and being easy to operate. The model includes the HCC immune-related gene TIMP-2, inflammatory indicators, and clinicopathological characteristics, and is superior to commonly used staging systems. Although the nomogram model in this study showed good performance in internal verification, the lack of external verification with independent cohorts remains a limitation, underscoring the need for future verification with larger external samples.
TIMP-2 may be involved in the regulation of the immune microenvironment in HCC as an inflammation-related gene. TIMP-2 plays an important role in the immune microenvironment of HCC and participates in the occurrence, development, invasion, and metastasis of HCC, with a pro-tumor role. TIMP-2 was highly expressed in HCC tissues. It is closely related to the survival and prognosis of patients with HCC, and can reflect the balance between immunity and inflammation in the body to a certain extent. TIMP-2 expression is an independent predictor of OS in patients with HCC The higher the expression level of TIMP-2, the more likely patients are to have recurrence and metastasis, shorter OS, and worse survival prognosis. The prognostic model established by TIMP-2 shows good clinical practicality for predicting patient survival time and DFS, monitoring postoperative recurrence, and judging. However, further clinical verification with a larger sample size is required. These findings suggest that TIMP-2 is an effective biomarker for monitoring HCC recurrence and metastasis, assessing recurrence risk, determining prognosis, and predicting immunotherapy responses. Its biological roles and prognostic values are promising.
Conclusion
TIMP-2 potentially acting as an immunoinflammatory gene may regulate the immune microenvironment of HCC, thereby influencing tumor occurrence, development, invasion, and metastasis. Its expression is an independent risk factor for OS in patients with HCC. Consequently, the nomogram prediction model for postoperative OS and DFS in HCC, developed using TIMP-2, offers a degree of predictive capability for patient survival prognosis and recurrence risk after surgery.
Acknowledgments
This work was supported by Guangxi Natural Science Foundation Project 2023GXNSFAA026156; the Guangxi Key Research and Development Program (GuiKe AB25069073) and Guangxi Medical and Health Key Discipline Construction Project.
Disclosure
The authors report no conflicts of interest in this work.
References
1. Bray F, Laversanne M, Sung H, et al. Global cancer statistics 2022: GLOBOCAN estimates of incidence and mortality worldwide for 36 cancers in 185 countries. CA Cancer J Clin. 2024;74(3):229–263. doi:10.3322/caac.21834
2. Wei W, Zeng H, Zheng R, et al. Cancer registration in China and its role in cancer prevention and control. Lancet Oncol. 2020;21(7):e342–e349. doi:10.1016/s1470-2045(20)30073-5
3. Maluccio M, Covey A. Recent progress in understanding, diagnosing, and treating hepatocellular carcinoma. CA Cancer J Clin. 2012;62(6):394–399. doi:10.3322/caac.21161
4. Forner A, Reig M, Bruix J. Hepatocellular carcinoma. Lancet. 2018;391(10127):1301–1314. doi:10.1016/s0140-6736(18)30010-2
5. Roberts LR, Gores GJ. Hepatocellular carcinoma: molecular pathways and new therapeutic targets. Semin Liver Dis. 2005;25(2):212–225. doi:10.1055/s-2005-871200
6. Di Martino JS, Akhter T, Bravo-Cordero JJ. Remodeling the ECM: implications for metastasis and tumor dormancy. Cancers. 2021;13(19):4916. doi:10.3390/cancers13194916
7. Brew K, Nagase H. The tissue inhibitors of metalloproteinases (TIMPs): an ancient family with structural and functional diversity. Biochim Biophys Acta. 2010;1803(1):55–71. doi:10.1016/j.bbamcr.2010.01.003
8. Pittayapruek P, Meephansan J, Prapapan O, Komine M, Ohtsuki M. Role of matrix metalloproteinases in photoaging and photocarcinogenesis. Int J Mol Sci. 2016;17(6). doi:10.3390/ijms17060868
9. Sbardella D, Fasciglione GF, Gioia M, et al. Human matrix metalloproteinases: an ubiquitarian class of enzymes involved in several pathological processes. Mol Aspects Med. 2012;33(2):119–208. doi:10.1016/j.mam.2011.10.015
10. Fernandez CA, Roy R, Lee S, et al. The anti-angiogenic peptide, loop 6, binds insulin-like growth factor-1 receptor. J Biol Chem. 2010;285(53):41886–41895. doi:10.1074/jbc.M110.166439
11. Peeney D, Fan Y, Nguyen T, Meerzaman D, Stetler-Stevenson WG. Matrisome-associated gene expression patterns correlating with TIMP2 in cancer. Sci Rep. 2019;9(1):20142. doi:10.1038/s41598-019-56632-3
12. Bourboulia D, Jensen-Taubman S, Rittler MR, et al. Endogenous angiogenesis inhibitor blocks tumor growth via direct and indirect effects on tumor microenvironment. Am J Pathol. 2011;179(5):2589–2600. doi:10.1016/j.ajpath.2011.07.035
13. Wang DD, Xu WX, Chen WQ, et al. Identification of TIMP2 as a prognostic biomarker and its correlation with tumor immune microenvironment: a comprehensive pan-cancer analysis. J Oncol. 2022;2022:9133636. doi:10.1155/2022/9133636
14. Wang W, Zhang Y, Liu M, et al. TIMP2 is a poor prognostic factor and predicts metastatic biological behavior in gastric cancer. Sci Rep. 2018;8(1):9629. doi:10.1038/s41598-018-27897-x
15. Giannopoulos G, Pavlakis K, Parasi A, et al. The expression of matrix metalloproteinases-2 and −9 and their tissue inhibitor 2 in pancreatic ductal and ampullary carcinoma and their relation to angiogenesis and clinicopathological parameters. Anticancer Res. 2008;28(3b):1875–1881.
16. Honkavuori-Toivola M, Talvensaari-Mattila A, Soini Y, Turpeenniemi-Hujanen T, Santala M. Immunoreactivity for TIMP-2 is associated with a favorable prognosis in endometrial carcinoma. Tumour Biol. 2012;33(4):935–941. doi:10.1007/s13277-012-0321-7
17. Lu H, Yang Z, Zhang H, Gan M, Zhou T, Wang S. The expression and clinical significance of matrix metalloproteinase 7 and tissue inhibitor of matrix metalloproteinases 2 in clear cell renal cell carcinoma. Exp Ther Med. 2013;5(3):890–896. doi:10.3892/etm.2012.859
18. Chen X, Zhong S-L, Lu P, et al. miR-4443 participates in the malignancy of breast cancer. PLoS One. 2016;11(8):e0160780. doi:10.1371/journal.pone.0160780
19. Remacle A, McCarthy K, Noël A, et al. High levels of TIMP-2 correlate with adverse prognosis in breast cancer. Int J Cancer. 2000;89(2):118–121. doi:10.1002/(sici)1097-0215(20000320)89:2<118::aid-ijc3>3.0.co;2-8
20. Cristescu R, Lee J, Nebozhyn M, et al. Molecular analysis of gastric cancer identifies subtypes associated with distinct clinical outcomes. Nature Med. 2015;21(5):449–456. doi:10.1038/nm.3850
21. Zhu L, Yu H, Liu SY, et al. Prognostic value of tissue inhibitor of metalloproteinase-2 expression in patients with non-small cell lung cancer: a systematic review and meta-analysis. PLoS One. 2015;10(4):e0124230. doi:10.1371/journal.pone.0124230
22. Braicu EI, Fotopoulou C, Chekerov R, et al. Role of serum concentration of VEGFR1 and TIMP2 on clinical outcome in primary cervical cancer: results of a companion protocol of the randomized, NOGGO-AGO Phase III adjuvant trial of simultaneous cisplatin-based radiochemotherapy vs. carboplatin and paclitaxel containing sequential radiotherapy. Cytokine. 2013;61(3):755–758. doi:10.1016/j.cyto.2013.01.013
23. Braicu EI, Gasimli K, Richter R, et al. Role of serum VEGFA, TIMP2, MMP2 and MMP9 in monitoring response to adjuvant radiochemotherapy in patients with primary cervical cancer--results of a companion protocol of the randomized NOGGO-AGO phase III clinical trial. Anticancer Res. 2014;34(1):385–391.
24. Davidson B, Goldberg I, Kopolovic J, et al. MMP-2 and TIMP-2 expression correlates with poor prognosis in cervical carcinoma--a clinicopathologic study using immunohistochemistry and mRNA in situ hybridization. Gynecol Oncol. 1999;73(3):372–382. doi:10.1006/gyno.1999.5381
25. Davidson B, Goldberg I, Gotlieb WH, et al. High levels of MMP-2, MMP-9, MT1-MMP and TIMP-2 mRNA correlate with poor survival in ovarian carcinoma. Clin Exp Metastasis. 1999;17(10):799–808. doi:10.1023/a:1006723011835
26. Davidson B, Goldberg I, Gotlieb WH, et al. The prognostic value of metalloproteinases and angiogenic factors in ovarian carcinoma. Mol Cell Endocrinol. 2002;187(1–2):39–45. doi:10.1016/s0303-7207(01)00709-2
27. Hałoń A, Nowak-Markwitz E, Donizy P, et al. Enhanced immunoreactivity of TIMP-2 in the stromal compartment of tumor as a marker of favorable prognosis in ovarian cancer patients. J Histochem Cytochem. 2012;60(7):491–501. doi:10.1369/0022155412446978
28. Gakiopoulou H, Nakopoulou L, Siatelis A, et al. Tissue inhibitor of metalloproteinase-2 as a multifunctional molecule of which the expression is associated with adverse prognosis of patients with urothelial bladder carcinomas. Clin Cancer Res. 2003;9(15):5573–5581.
29. Kanayama H, Yokota K, Kurokawa Y, Murakami Y, Nishitani M, Kagawa S. Prognostic values of matrix metalloproteinase-2 and tissue inhibitor of metalloproteinase-2 expression in bladder cancer. Cancer. 1998;82(7):1359–1366. doi:10.1002/(SICI)1097-0142(19980401)82:7<1359::AID-CNCR20>3.0.CO;2-4
30. Vasala K, Kuvaja P, Turpeenniemi-Hujanen T. Low circulating levels of ProMMP-2 are associated with adverse prognosis in bladder cancer. Tumour Biol. 2008;29(5):279–286. doi:10.1159/000156705
31. Giannelli G, Bergamini C, Marinosci F, et al. Clinical role of MMP-2/TIMP-2 imbalance in hepatocellular carcinoma. Int J Cancer. 2002;97(4):425–431. doi:10.1002/ijc.1635
32. Morse MA, Sun W, Kim R, et al. The role of angiogenesis in hepatocellular carcinoma. Clin Cancer Res. 2019;25(3):912–920. doi:10.1158/1078-0432.Ccr-18-1254
33. Musso O, Théret N, Campion JP, et al. In situ detection of matrix metalloproteinase-2 (MMP2) and the metalloproteinase inhibitor TIMP2 transcripts in human primary hepatocellular carcinoma and in liver metastasis. J Hepatol. 1997;26(3):593–605. doi:10.1016/s0168-8278(97)80425-4
34. Xue X, Wang X, Zhao Y, Hu R, Qin L. Exosomal miR-93 promotes proliferation and invasion in hepatocellular carcinoma by directly inhibiting TIMP2/TP53INP1/CDKN1A. Biochem Biophys Res Commun. 2018;502(4):515–521. doi:10.1016/j.bbrc.2018.05.208
35. Altadill A, Rodríguez M, González LO, et al. Liver expression of matrix metalloproteases and their inhibitors in hepatocellular carcinoma. Dig Liver Dis. 2009;41(10):740–748. doi:10.1016/j.dld.2009.01.016
36. Nyalendo C, Michaud M, Beaulieu E, et al. Src-dependent phosphorylation of membrane type I matrix metalloproteinase on cytoplasmic tyrosine 573: role in endothelial and tumor cell migration. J Biol Chem. 2007;282(21):15690–15699. doi:10.1074/jbc.M608045200
37. Albini A, Melchiori A, Santi L, Liotta LA, Brown PD, Stetler-Stevenson WG. Tumor cell invasion inhibited by TIMP-2. J Natl Cancer Inst. 1991;83(11):775–779. doi:10.1093/jnci/83.11.775
38. Arii S, Mise M, Harada T, et al. Overexpression of matrix metalloproteinase 9 gene in hepatocellular carcinoma with invasive potential. Hepatology. 1996;24(2):316–322. doi:10.1053/jhep.1996.v24.pm0008690399
39. Liang S, Li C, Gao Z, et al. A nomogram to predict short-term outcome of radiotherapy or chemoradiotherapy based on pre/post-treatment inflammatory biomarkers and their dynamic changes in esophageal squamous cell carcinoma. Int Immunopharmacol. 2021;90:107178. doi:10.1016/j.intimp.2020.107178
40. Ren A, Li Z, Zhang X, Deng R, Ma Y. Inflammation-based prognostic scores in patients with hepatitis B virus-related hepatocellular carcinoma after liver transplantation. J Hepatocell Carcinoma. 2020;7:101–106. doi:10.2147/jhc.S259992
41. Wang D, Hu X, Xiao L, et al. Prognostic nutritional index and systemic immune-inflammation index predict the prognosis of patients with HCC. J Gastrointest Surg. 2021;25(2):421–427. doi:10.1007/s11605-019-04492-7
42. Ji GW, Zhu FP, Xu Q, et al. Radiomic features at contrast-enhanced CT predict recurrence in early stage hepatocellular carcinoma: a multi-institutional study. Radiology. 2020;294(3):568–579. doi:10.1148/radiol.2020191470
43. Lee IC, Huang JY, Chen TC, et al. Evolutionary learning-derived clinical-radiomic models for predicting early recurrence of hepatocellular carcinoma after resection. Liver Cancer. 2021;10(6):572–582. doi:10.1159/000518728
44. Marasco G, Colecchia A, Colli A, et al. Reply to correspondence concerning: “Role of liver and spleen stiffness in predicting the recurrence of hepatocellular carcinoma after resection”. J Hepatol. 2019;70(4):809–810. doi:10.1016/j.jhep.2018.12.025
45. Qian X, Zheng H, Xue K, et al. Recurrence risk of liver cancer post-hepatectomy using machine learning and study of correlation with immune infiltration. Front Genet. 2021;12:733654. doi:10.3389/fgene.2021.733654
46. Long J, Qu T, Pan XF, et al. Expression of programmed death ligand-1 and programmed death 1 in hepatocellular carcinoma and its clinical significance. J Cancer Res Ther. 2018;14(Supplement):S1188–s1192. doi:10.4103/0973-1482.204850
47. Chen J, Fang A, Chen M, et al. A novel inflammation-based nomogram system to predict survival of patients with hepatocellular carcinoma. Cancer Med. 2018;7(10):5027–5035. doi:10.1002/cam4.1787
48. Fu J, Lei X. Identification of the Immune Subtype of hepatocellular carcinoma for the prediction of disease-free survival time and prevention of recurrence by integrated analysis of bulk- and single-cell RNA sequencing data. Front Immunol. 2022;13:868325. doi:10.3389/fimmu.2022.868325
 © 2025 The Author(s). This work is published and licensed by Dove Medical Press Limited. The
full terms of this license are available at https://www.dovepress.com/terms
and incorporate the Creative Commons Attribution
- Non Commercial (unported, 4.0) License.
By accessing the work you hereby accept the Terms. Non-commercial uses of the work are permitted
without any further permission from Dove Medical Press Limited, provided the work is properly
attributed. For permission for commercial use of this work, please see paragraphs 4.2 and 5 of our Terms.
© 2025 The Author(s). This work is published and licensed by Dove Medical Press Limited. The
full terms of this license are available at https://www.dovepress.com/terms
and incorporate the Creative Commons Attribution
- Non Commercial (unported, 4.0) License.
By accessing the work you hereby accept the Terms. Non-commercial uses of the work are permitted
without any further permission from Dove Medical Press Limited, provided the work is properly
attributed. For permission for commercial use of this work, please see paragraphs 4.2 and 5 of our Terms.
Recommended articles

Decaprenyl Diphosphate Synthase Subunit 1 (PDSS1): A Potential Prognostic Biomarker and Immunotherapy-Target for Hepatocellular Carcinoma
Yang Y, Li J, Tang M, Nie B, Huang W
Cancer Management and Research 2022, 14:1627-1639
Published Date: 3 May 2022
Infiltration of a Unique CD8+CD274+ Cell Subgroup in Hepatocellular Carcinoma is Associated with Poor Clinical Outcomes
Zhang Y, Cui K, Yang Y, Liu B, Zhu M, Chen H, Zhao C, Zhou Y, Nie Y
Journal of Hepatocellular Carcinoma 2023, 10:1051-1067
Published Date: 8 July 2023
Development and Validation of a Propionate Metabolism-Related Gene Signature for Prognostic Prediction of Hepatocellular Carcinoma
Xiao J, Wang J, Zhou C, Luo J
Journal of Hepatocellular Carcinoma 2023, 10:1673-1687
Published Date: 2 October 2023
Chronic Inflammatory and Immune Microenvironment Promote Hepatocellular Carcinoma Evolution
Chen S, Zhang L, Chen Y, Zhang X, Ma Y
Journal of Inflammation Research 2023, 16:5287-5298
Published Date: 15 November 2023
Construction of a Prognostic Model for Hepatocellular Carcinoma Based on Macrophage Polarization-Related Genes
Chen H, Li J, Cao D, Tang H
Journal of Hepatocellular Carcinoma 2024, 11:857-878
Published Date: 11 May 2024